Is 4U 0114+65 an eclipsing HMXB?
Abstract
We present the pulsation and spectral characteristics of the HMXB 4U 0114+65 during a Suzaku observation covering the part of the orbit that included the previously known low intensity emission of the source (dip) and the egress from this state. This dip has been interpreted in previous works as an X-ray eclipse. Notably, in this Suzaku observation, the count rate during and outside the dip vary by a factor of only 2-4 at odds with the eclipses of other HMXBs, where the intensity drops upto two orders of magnitude. The orbital intensity profile of 4U 0114+65 is characterized by a narrow dip in the RXTE-ASM (2-12 keV) light curve and a shallower one in the Swift-BAT (15-50 keV), which is different from eclipse ingress/egress behaviour of other HMXBs. The time-resolved spectral analysis reveal moderate absorption column density (NH - 2-20 atoms ) and a relatively low equivalent width ( 30 eV & 12 eV of the iron Kα and Kβ lines respectively) as opposed to the typical X-ray spectra of HMXBs during eclipse where the equivalent width is 1 keV. Both XIS and PIN data show clear pulsations during the dip, which we have further confirmed using the entire archival data of the IBIS/ISGRI and JEM-X instruments onboard INTEGRAL. The results we presented question the previous interpretation of the dip in the light curve of 4U 0114+65 as an X-ray eclipse. We thus discuss alternative interpretations of the periodic dip in the light curve of 4U 0114+65.
keywords:
X-rays: binaries– X-rays: individual: –4U 0114+65 stars: pulsars: general1 Introduction
The hard X-ray source 4U 0114+65 (alias 2S 0114+650) is a pulsar belonging to a class of persistent High-Mass X-ray Binaries (HMXBs), showing properties similar
to both Be (Koenigsberger et al., 1983) and supergiant X-ray
binaries Crampton, Hutchings & Cowley (1985); Reig et al. (1996). It was discovered
in the SAS-3 galactic survey (Dower et al., 1977). The pulsar’s companion is a B1Ia supergiant (LS I+65 010) located at a distance of 7.2 kpc (Reig et al., 1996). From the optical radial velocity measurements,
Crampton, Hutchings & Cowley (1985) first confirmed the binary nature of 4U 0114+65.
By assuming an eccentricity of 0.16, these authors estimated an orbital period of 11.588 d.
The corresponding value in case of a circular orbit is 11.591 d.
Similar values of the system orbital period have also been reported in later works:
Corbet, Finley & Peele (1999) obtained an X-ray variability of 11.63 d from the RXTE-ASM observations carried out between 1996-1999; Wen et al. (2006)
reanalysed ASM data from 1996-2004
and obtained an orbital period of 11.599 d; Grundstrom et al. (2007) obtained an orbital period of
11.5983 d by using both optical and X-ray observations. These authors also reported an eccentricity of the orbit of 0.18.
A stable 2.78 h periodicity in the X-ray light curve of the source was first reported by Finley, Belloni & Cassinelli (1992) by using EXOSAT
and ROSAT data.
A similar modulation was also observed in the optical by Taylor et al. (1995).
Corbet, Finley & Peele (1999) and Hall et al. (2000) further confirmed the same periodicity by analyzing the RXTE-ASM and PCA data, respectively.
Additional X-ray observations proved that the periodicity at 2.7 h was getting faster over time, firmly establishing its association with the
spin period of the neutron star hosted in this system (Hall et al., 2000; Bonning & Falanga, 2005; Farrell et al., 2008).
This is one of the slowest pulsar known and various models have been proposed to explain its unusually long spin period (Hall et al. 2000 and references therein). Li & van den Heuvel (1999) suggested that such long spin period could be achieved if the neutron star was initially born as a magnetar.
The possible cyclotron resonant absorption features at 22 and 44 keV reported by Bonning & Falanga (2005) did not provide support in favor of this hypothesis, as
they would imply a magnetic field of 2.51012 G for the pulsar in 4U 0114+65.
However, subsequent observations did not confirm the detection of the cyclotron features (den Hartog et al., 2006; Masetti et al., 2006; Farrell et al., 2008).
4U 0114+65 shows a remarkable variability in X-rays, with aperiodic flares lasting for a few hours Yamauchi et al. (1990); Apparao, Bisht & Singh (1991) and short-term flickering
occuring on timescales of minutes (Koenigsberger et al., 1983). A superorbital modulation of 30.7 d has been detected in RXTE-ASM data
(Farrell, Sood & O’Neill, 2006; Wen et al., 2006), and found to be stable over time. This makes 4U 0114+65 the fourth system to show stable superorbital variability
(see also the cases of SMC X-1, Her X-1, LMC X-4 and SS 433; Sood et al. 2006).
The orbital intensity profile of 4U 0114+65 as obtained from the RXTE-ASM shows a dip that has been usually associated with an X-ray eclipse.
Here we report on the timing and broad band spectral characteristics of the X-ray emission from 4U 0114+65 as observed with Suzaku
during part of the dip and the dip egress. The Suzaku observation indicates that the X-ray emission from the source recorded during the dip is not
compatible with what is usually observed from an HMXB in eclipse. In order to gain further insights on the nature of the dip, we thus also looked at the pulsation
characteristics of this source by using all publicly available IBIS/ISGRI and JEM-X data from the INTEGRAL satellite.
2 Observation and Analysis
2.1 Suzaku
Suzaku (Mitsuda et al., 2007) is a broad-band X-ray observatory which covers
the energy range of 0.2-600 keV. It has two main instruments: the X-ray Imaging Spectrometer XIS (Koyama et al., 2007), covering the 0.2-12
keV energy range, and the Hard X-ray Detector (HXD). The latter comprises PIN diodes (Takahashi et al., 2007), covering
the 10-70 keV energy range, and GSO crystal scintillator
detectors, covering the 70-600 keV energy range.
The XIS consists of four CCD detectors of which three are front illuminated
(FI) and one is back illuminated (BI). Only three out of the four XIS units (XIS 0,1 and 3) are currently
operational.
4U 0114+65 was observed with Suzaku on 2011 July 21-22 (OBSID ‘406017010’). The observation was carried out at the ‘XIS nominal’
pointing position and the effective exposure time of the XIS and PIN was of 106.5 and 88.5 ks, respectively. The XIS units were operated
in ‘standard’ data mode with the ‘Window 1/4’ option (providing a time resolution of 2 s).
For the XIS and HXD data, we used the filtered cleaned event files which are obtained using the pre-determined screening criteria as suggested in
the Suzaku ABC guide 111http://heasarc.gsfc.nasa.gov/docs/suzaku/analysis/abc/. XIS light curves and spectra were extracted from the XIS data by
choosing circular regions of radius from the source position.
Background light curves and spectra for the XIS were extracted by selecting regions of
the same size in a portion of the CCD that did not contain any source photons.
For the HXD/PIN, simulated ‘tuned’ non
X-ray background event files (NXB) corresponding to the month and year of the respective observations
were used to estimate the non X-ray background 222http://heasarc.nasa.gov/docs/suzaku/analysis/pinbgd.html(Fukazawa et al., 2009).
The timing analysis of the Suzaku data was performed on the XIS and PIN light curves after applying
barycentric corrections to the event data files (we used the FTOOLS task
‘aebarycen’). These files were also corrected for dead time effects by using the FTOOLS task ‘hxddtcor’.
Light curves were extracted from the XIS data with the highest available time resolution of 2 s.
We summed
the background subtracted XIS 0, 1 and 3 light curves and obtained a single background corrected light curve for all the XIS units.
The PIN light curves were extracted with a resolution of 1 s
and the corresponding background was evaluated by generating similar light curves from the simulated background files.
The XIS and PIN light curves comprise 14 neutron star rotations, as shown in Figure 1. The average source count-rate in the two instruments was 2.69 c/s and 0.85 c/s, respectively.
The XIS spectra were extracted with 2048 channels and the PIN spectra with 255 channels.
Response files for the XIS were created using CALDB version ‘20140701’. For the HXD/PIN spectrum, response files corresponding to the epoch
of the observation were obtained from the Suzaku guest observer
facility333http://heasarc.nasa.gov/docs/heasarc/caldb/suzaku/.
2.1.1 Timing Analysis
The source PIN and XIS light curves are reported in Figure 1 (the binsize is 300 s). The upper and middle panel of the figure show the XIS and PIN data respectively. The lower panel show the hardness ratio between the PIN and XIS. Pulsations can be clearly seen even during the lowest X-ray emission time interval, i.e., the dip. The average count rates measured during dip and and out of the dip differ only by a factor of 2-4.

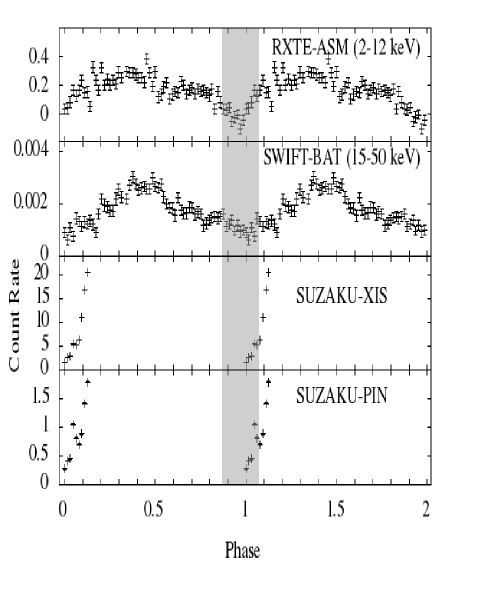
To determine the orbital phase of the Suzaku observation, we folded the Suzaku-XIS and PIN light curves together with the Swift-BAT444http://swift.gsfc.nasa.gov/results/transients/weak/3A0114p650/ and RXTE-ASM555ftp://legacy.gsfc.nasa.gov/xte/data/archive/ASMProducts/definitive_1dwell/lightcurves/ long term light curve of 4U 0114+65 at an orbital period of 11.596 days. The latter was obtained from the RXTE-ASM light curve using the FTOOLS task ‘efsearch’. The folded light curves in Figure 2 clearly show that the Suzaku observation was carried out during the X-ray dip.
We also extracted the energy resolved pulse profiles of the source, normalized at the average source intensity for the XIS and PIN data. As shown in Figure 3, the profiles do not show any significant energy dependence and pulsations are always detected up to 70 keV.


2.1.2 Spectral Analysis
We performed a time averaged spectral analysis of the X-ray emission from 4U 0114+65 using the two XIS units (XIS 0 and 3) and the PIN data.
Data from the back illuminated XIS 1, were not included in the spectral analysis as the cross-normalizations obtained between the XIS 0 and the XIS 1
were larger than those suggested in the Suzaku ABC guide.
Additionally, we also noticed systematic differences in the spectral fitting of the BI data
compared to the other XIS units.
Such differences between the BI and FI XIS units have been previously reported, e.g., in the case of GX 301-2 (Suchy et al., 2012) and
IGR J16318-4848 (Barragán et al., 2009).
In these situations, it is more convenient to use only the data from the FI XIS units, given the greater sensitivity of the the latter chips
above 2 keV compared to the BI XIS unit.
Spectral fitting was performed by using XSPEC v12.8.2.
For the spectral analysis we have chosen the energy range 0.8-10 keV
for the XIS units and 15.0-70.0 keV for the PIN, respectively.
Artificial residuals are known to arise in the XIS spectra around the Si
edge and Au edge. The energy range 1.75-2.23 keV is thus usually discarded for the spectral analysis.
We fitted all
spectra simultaneously with all parameters tied, except the relative
instrument normalizations which were kept free to vary. The 2048 channel XIS spectra were rebinned by a factor of 6 up to 5 keV,
by a factor of 2 from 5-7 keV,
and by a factor of 14 in the remaining energy range.
The PIN spectra were binned by a factor of 4 at energies 22 keV, by 8 in the energy range 22-45 keV, and by 12 in the remaining
part of the instrument passband.
To fit the spectral continuum, we used the continuum models commonly used for HMXBs, such as a
power-law model modified with an exponential cutoff (CUTOFFPL), a power law with a high energy cutoff (HIGHECUT; White, Swank & Holt 1983; Heindl et al. 2001),
a negative and positive power law with exponential continuum model (NPEX; Mihara 1995; Makishima et al. 1999) and a physical Comptonization model (COMPTT; Titarchuk 1994). In addition to the interstellar absorption along our line of sight, we also used a partial covering component to account for local absorption.
A soft excess below 2 keV remained visible in the residuals from the fits with all above models except COMPTT.
Where significantly detected, the soft excess was accounted for with the addition of a blackbody component. Two gaussian components were
added to fit the iron Kα and Kβ emission lines.
An evident feature is
seen in the residuals from all the fits between 20-30 keV, irrespectively of the model used for the continuum.
The inclusion of an absorption cyclotron feature (CYCLABS) with a width fixed at 9.8 keV (Bonning & Falanga, 2005) slightly improved the fit.
To test further, the significance of the cyclotron line detected, we used the F-test routine available in the IDL package
mpftest666http://cow.physics.wisc.edu/craigm/idl/down/mpftest.pro (DeCesar et al., 2013). The probability of chance improvement (PCI) is evaluated for the HIGHECUT model used to fit the spectrum with
and without the cyclotron line. The estimated PCI value after addition of cyclotron line component to the HIGHECUT is 38.4 % .
The best-fit spectral parameters for 4U 0114+65 for all considered models are summarized in Table 1.
The time-averaged spectra for different models and their residuals with and without the inclusion of the CYCLABS component are shown in Figure 4. At energies above 50 keV,
the residuals also suggested the presence of a high energy tail in 4U 0114+65 (Wang, 2011; den Hartog et al., 2006), the detailed fitting of which we have not
been able to carry out since the HXD/PIN spectrum is limited to 70 keV.


| Parameter | HIGHECUT | NPEX | CUTOFFPL | COMPTT |
| CvrFract | ||||
| PhoIndex | * | – | ||
| Powerlaw(norm) | – | |||
| Ecut (keV) | – | |||
| Efold (keV) | – | – | – | |
| compTT () (keV) | – | – | – | |
| compTT(kT) (keV) | – | – | – | |
| compTT(taup) | – | – | – | |
| compTT(norm) | – | – | – | |
| bbody(kT) (keV) | – | |||
| bbody(norm) | – | |||
| Cyclabs∗∗ (keV) | ||||
| Depth(keV) | ||||
| Kα line (keV) | ||||
| Equivalent Width for Kα line (keV) | ||||
| Kβ line (keV) | ||||
| Equivalent Width for Kβ line (keV) | ||||
| Flux | ||||
| Flux | ||||
| /d.o.f (with CYCLABS) | 1.24/462 | 1.27/462 | 1.28/463 | 1.48/467 |
| /d.o.f (without CYCLABS) | 1.28/464 | 1.29/464 | 1.32/465 | 1.55/469 |
| In units of atoms | ||||
| Photon-index of the second power-law component of the NPEX is frozen to 2.0 | ||||
| ∗∗Width frozen at 9.8 keV (Bonning & Falanga, 2005) | ||||
| In units of photons at 1 keV | ||||
| In units of / | ||||
| In units of |
To perform a time resolved spectral analysis of the emission within the dip, we divided the light curve into fourteen segments. Each segment is defined to be the time elapsed between two successive minima in the light curve, as is depicted in Figure 1. This way, the average time interval between the segments turn out to be 9355 s, which is nearly equal to the spin period of the pulsar ( 9391 s).
The time resolved spectra (shown in Figure 5) could be well fit with the HIGHECUT model, which also provided the best description of the time averaged spectrum. The variations of the spectral parameters with time obtained for the HIGHECUT model are shown on the left side of Figure 6.
For the spin phase resolved spectral analysis, we extracted the source spectra in 16 phase bins. Each phase resolved spectrum was again fitted with the HIGHECUT model. The variation of the spectral parameters with the spin phase is shown on the right hand side of Figure 6.


From the time resolved spectral analysis of the source, we obtained the following results:
-
1.
The partial covering absorption component was not needed to fit the time resolved spectra. The measured variation of NH with time suggests the presence of clumps in the neutron star surroundings as in the case of GX 301-2 (Mukherjee & Paul, 2004), Vela X-1 (Fürst et al., 2010), Cen X-3 (Naik, Paul & Ali, 2011) and OAO 1657-415 (Pradhan et al., 2014). We found that the NH was higher at the beginning of the observation (2 atoms ) and decreased by a factor of 10 towards the end of the Suzaku observation window.
-
2.
For low flux segments like (2-5 and 7-8 and 12), the blackbody temperature had to be frozen to the time-averaged value while allowing the blackbody normalization to vary. For low flux segments 1 and 6, we could not constrain the black body normalization even by freezing the blackbody temperature to time-averaged value.
-
3.
Residuals from the fits around the cyclotron line energy are not detected in most of the time resolved segments (due to low statistics) except for the segments 3, 5 and 8. In these cases, however, the statistics was far too low to perform a meaningful test about the statistical significance of the possible cyclotron line.
From the results of the phase resolved spectral analysis we conclude that:
-
1.
As for the time resolved spectral analysis, the partial covering absorption component was not required to fit the for phase resolved spectra.
-
2.
Only the photon index and the normalization of the power-law component show some moderately significant variability with the pulse phase.
-
3.
Residuals around the energy of the cyclotron line could not be detected, most likely due to the limited statistics compared to the phase averaged spectrum.
Finally, we showed through our timing analysis of the Suzaku data that pulsations are detected in the X-ray emission of the source also during the time interval corresponding to the dip.
2.2 INTEGRAL/IBIS and JEM-X light curves
We used all publicly available INTEGRAL data collected in the direction of 4U 0114+65 since the earliest science operations of the mission. This data-set comprises ‘science windows’ (SCWs), i.e. pointings with typical durations of 2-3 ks, carried out from the satellite revolution 25 to 1471. We analyzed all data from the IBIS/ISGRI (Lebrun et al., 2003) and the two JEM-X (Lund et al., 2003) instruments by using version 10.1 of the Off-line Scientific Analysis software (OSA) distributed by the ISDC (Courvoisier et al., 2003). To limit the IBIS/ISGRI calibration uncertainties, we selected only SCWs during which the source was located to within 12 deg from the center of the IBIS FoV (Ubertini et al., 2003). The total effective exposure time was of 8.9 Ms for IBIS/ISGRI, 1.4 Ms for JEM-X1, and 520 ks for JEM-X2. From all the available INTEGRAL IBIS/ISGRI and JEM-X observations of 4U 0114+65, we extracted the source light curves with a time binning of 100 s in the energy range 20-40 keV and 3-35 keV, respectively. We then searched for pulsations during those observations that were carried out at orbital phases corresponding to the X-ray dip ( 1 day). Except for those cases where the statistics of the data was relatively low, pulsations were seen in most of the observations and a few examples of pulse profiles are shown in Figure 7.
3 Discussion
In this paper, we used Suzaku and INTEGRAL data to study the X-ray emission from 4U 0114+65 during the orbital phase corresponding to its periodic X-ray dip. Such dip has been interpreted in the past as an eclipse of the neutron star hosted in this system by its supergiant companion. However, our analysis revealed some anomalous properties of the source X-ray emission that would not support such interpretation. In particular we noted that:
-
1.
The orbital intensity profile of 4U 0114+65 in the proximity of the X-ray dip is different from that of other eclipsing HMXBs which typically show sharp eclipse ingresses and egresses in hard X-rays and a more gradual variation of their intensity in soft X-rays owing to absorption in the stellar wind. On the contrary, we showed that 4U 0114+65 exhibits an eclipse-like profile at the lower energies (RXTE-ASM) with the ingress and egress time of the dip being nearly a day-long each, and a more gradual variation in hard X-rays (Swift-BAT).
- 2.
-
3.
The spectral index during eclipse should be higher than out of eclipse phases, since during eclipse, we will be observing only the scattered emission in the wind. As an example, in the Suzaku observation of Cen X-3 when the pulsar was observed during eclipse and out of eclipse phases, the photonindex correlates well with those orbital phases (Figure 6 of Naik, Paul & Ali 2011). We see no such correlation here.
-
4.
Eclipse ingresses and egresses of HMXBs are often characterized by extremely large increases/decreases of the absorption column densities due to the presence of the dense wind of the supergiant star along the line of sight to the observer (NH atoms ). A soft excess should not be observable in these cases, as the X-ray emission at energies 2 keV is strongly extinguished. In the case of 4U 0114 +65, we observe only a moderate increase of the absorption column density in the dip compared to other orbital phases and also the soft excess below 2 keV remains clearly detectable in the averaged Suzaku spectrum and in those segments where the flux is not too low.
-
5.
Pulsations were clearly detected during all available INTEGRAL observations carried out during the X-ray dip and the Suzaku observations, even though in these cases the source was supposed to be in eclipse.
Different works in the past have investigated the origin of the X-ray dip in 4U 0114+65. Hall et al. (2000) and Corbet, Finley & Peele (1999) reported a definite truncation of X-ray signal
near orbital phase 0 indicative of an eclipse which is further supported by an increase in column density near the same phase (Hall et al., 2000).
On the other hand, neither Crampton, Hutchings & Cowley (1985) nor Farrell et al. (2008) found convincing evidence for the presence of an X-ray eclipse in the RXTE/PCA and
optical data. Grundstrom et al. (2007) was the first to note that the minimum in the X-rays
occurs very close to the predicted phase of the supergiant inferior conjunction.
In agreement with their findings, we thus propose that, as the system is characterized by an eccentric orbit, the accretion rate onto the neutron star
is modulated along the orbital phase, leading to variations in both soft and hard X-rays. It is not an eclipsing
binary, but at the inferior conjunction of the companion star, increased absorption in the stellar wind causes a dip in the soft X-ray orbital light curve,
which is also seen in the form of a larger NH in the beginning of the Suzaku observation. It shall be remarked that the detection of X-ray pulsations
during the dip cannot be used to distinguish between the idea proposed above and the eclipse model. Indeed, the long spin period of the pulsar hosted in 4U 0114+65 would
allow us to detect pulsations even when the source is eclipsed, as these would not be washed out in the emission reprocessed by the stellar wind.
Finally we suggest that the variations of the absorption column density (see Figure 6) recorded during the Suzaku observation on time-scales of few
thousand seconds might be due to the presence of clumps in the wind of the supergiant companion as observed also in other similar systems (see, e.g., GX 301-2, Vela X-1,
Cen X-3 and OAO 1657-415; Mukherjee & Paul 2004; Fürst et al. 2010; Naik, Paul & Ali 2011; Pradhan et al. 2014; Walter et al. 2015 )
4 Acknowledgement
This research has made use of data obtained from the Suzaku satellite, a collaborative mission between the space agencies of Japan (JAXA) and the USA (NASA). The data for this work has been obtained through the High Energy Astrophysics Science Archive (HEASARC) Online Service provided by NASA/GSFC. We have also made use of public light curves from Swift and RXTE site. PP is thankful to UGC for their financial support under ‘Minor Research Project’ and also to the hospitality provided by Raman Research Institute, Bangalore for carrying out this work. TMB acknowledges support from INAF-PRIN 2012-6.
References
- Apparao, Bisht & Singh (1991) Apparao K. M. V., Bisht P., Singh K. P., 1991, ApJ, 371, 772
- Barragán et al. (2009) Barragán L., Wilms J., Pottschmidt K., Nowak M. A., Kreykenbohm I., Walter R., Tomsick J. A., 2009, A&A, 508, 1275
- Bonning & Falanga (2005) Bonning E. W., Falanga M., 2005, A&A, 436, L31
- Corbet, Finley & Peele (1999) Corbet R. H. D., Finley J. P., Peele A. G., 1999, ApJ, 511, 876
- Courvoisier et al. (2003) Courvoisier T. J.-L. et al., 2003, A&A, 411, L53
- Crampton, Hutchings & Cowley (1985) Crampton D., Hutchings J. B., Cowley A. P., 1985, ApJ, 299, 839
- DeCesar et al. (2013) DeCesar M. E., Boyd P. T., Pottschmidt K., Wilms J., Suchy S., Miller M. C., 2013, ApJ, 762, 61
- den Hartog et al. (2006) den Hartog P. R., Hermsen W., Kuiper L., Vink J., in’t Zand J. J. M., Collmar W., 2006, A&A, 451, 587
- Dower et al. (1977) Dower R., Kelley R., Margon B., Bradt H., 1977, IAU Circ., 3144, 2
- Farrell, Sood & O’Neill (2006) Farrell S. A., Sood R. K., O’Neill P. M., 2006, MNRAS, 367, 1457
- Farrell et al. (2008) Farrell S. A., Sood R. K., O’Neill P. M., Dieters S., 2008, MNRAS, 389, 608
- Finley, Belloni & Cassinelli (1992) Finley J. P., Belloni T., Cassinelli J. P., 1992, A&A, 262, L25
- Fukazawa et al. (2009) Fukazawa Y. et al., 2009, PASJ, 61, 17
- Fürst et al. (2010) Fürst F. et al., 2010, A&A, 519, A37
- Grundstrom et al. (2007) Grundstrom E. D. et al., 2007, ApJ, 656, 431
- Hall et al. (2000) Hall T. A., Finley J. P., Corbet R. H. D., Thomas R. C., 2000, ApJ, 536, 450
- Heindl et al. (2001) Heindl W. A., Coburn W., Gruber D. E., Rothschild R. E., Kreykenbohm I., Wilms J., Staubert R., 2001, ApJ, 563, L35
- Koenigsberger et al. (1983) Koenigsberger G., Swank J. H., Szymkowiak A. E., White N. E., 1983, ApJ, 268, 782
- Koyama et al. (2007) Koyama K. et al., 2007, PASJ, 59, 23
- Lebrun et al. (2003) Lebrun F. et al., 2003, A&A, 411, L141
- Li & van den Heuvel (1999) Li X.-D., van den Heuvel E. P. J., 1999, ApJ, 513, L45
- Lund et al. (2003) Lund N. et al., 2003, A&A, 411, L231
- Makishima et al. (1999) Makishima K., Mihara T., Nagase F., Tanaka Y., 1999, ApJ, 525, 978
- Masetti et al. (2006) Masetti N., Orlandini M., dal Fiume D., del Sordo S., Amati L., Frontera F., Palazzi E., Santangelo A., 2006, A&A, 445, 653
- Mihara (1995) Mihara T., 1995, PhD thesis, , Dept. of Physics, Univ. of Tokyo (M95), (1995)
- Mitsuda et al. (2007) Mitsuda K. et al., 2007, PASJ, 59, 1
- Mukherjee & Paul (2004) Mukherjee U., Paul B., 2004, A&A, 427, 567
- Nagase et al. (1992) Nagase F., Corbet R. H. D., Day C. S. R., Inoue H., Takeshima T., Yoshida K., Mihara T., 1992, ApJ, 396, 147
- Nagase et al. (1994) Nagase F., Zylstra G., Sonobe T., Kotani T., Inoue H., Woo J., 1994, ApJ, 436, L1
- Naik, Paul & Ali (2011) Naik S., Paul B., Ali Z., 2011, ApJ, 737, 79
- Pradhan et al. (2014) Pradhan P., Maitra C., Paul B., Islam N., Paul B. C., 2014, MNRAS, 442, 2691
- Reig et al. (1996) Reig P., Chakrabarty D., Coe M. J., Fabregat J., Negueruela I., Prince T. A., Roche P., Steele I. A., 1996, A&A, 311, 879
- Sood et al. (2006) Sood R., Farrell S., O’Neill P., Manchanda R., Ashok N. M., 2006, Advances in Space Research, 38, 2779
- Suchy et al. (2012) Suchy S., Fürst F., Pottschmidt K., Caballero I., Kreykenbohm I., Wilms J., Markowitz A., Rothschild R. E., 2012, ApJ, 745, 124
- Takahashi et al. (2007) Takahashi T. et al., 2007, PASJ, 59, 35
- Taylor et al. (1995) Taylor M., Finley J. P., Kurt C., Koenigsberger G., 1995, AJ, 109, 396
- Titarchuk (1994) Titarchuk L., 1994, ApJ, 434, 570
- Ubertini et al. (2003) Ubertini P. et al., 2003, A&A, 411, L131
- Walter et al. (2015) Walter R., Lutovinov A. A., Bozzo E., Tsygankov S. S., 2015, arXiv preprint arXiv:1505.03651
- Wang (2011) Wang W., 2011, MNRAS, 413, 1083
- Wen et al. (2006) Wen L., Levine A. M., Corbet R. H. D., Bradt H. V., 2006, ApJS, 163, 372
- White, Swank & Holt (1983) White N. E., Swank J. H., Holt S. S., 1983, ApJ, 270, 711
- Yamauchi et al. (1990) Yamauchi S., Asaoka I., Kawada M., Koyama K., Tawara Y., 1990, PASJ, 42, L53