The young cluster NGC 2282 : a multi-wavelength perspective
Abstract
We present the analysis of the stellar content of NGC 2282, a young cluster in the Monoceros constellation, using deep optical and IPHAS photometry along with infrared (IR) data from UKIDSS and -IRAC. Based on the stellar surface density analysis using nearest neighborhood method, the radius of the cluster is estimated as 3.15. From optical spectroscopic analysis of 8 bright sources, we have classified three early B-type members in the cluster, which includes, HD 289120, a previously known B2V type star, a Herbig Ae/Be star (B0.5 Ve) and a B5 V star. From spectrophotometric analyses, the distance to the cluster has been estimated as 1.65 kpc. The -band extinction map is estimated using nearest neighborhood technique, and the mean extinction within the cluster area is found to be AV 3.9 mag. Using IR colour-colour criteria and Hα-emission properties, we have identified a total of 152 candidate young stellar objects (YSOs) in the region, of which, 75 are classified as Class II, 9 are Class I YSOs. Our YSO catalog also includes 50 Hα-emission line sources, identified using slitless spectroscopy and IPHAS photometry data. Based on the optical and near-IR colour-magnitude diagram analyses, the cluster age has been estimated to be in the range of 2 5 Myr, which is in agreement with the estimated age from disc fraction ( 58%). Masses of these YSOs are found to be 0.12.0 M⊙. Spatial distribution of the candidate YSOs shows spherical morphology, more or less similar to the surface density map.
keywords:
Embedded clusters—young stellar objects – infrared: stars.1 Introduction
Young embedded stellar clusters are an active star-forming site, where pre-main sequence (PMS) massive and low-mass stars are formed together, and evolved over timescale of few million years (Lada et al. 1994; Lada & Lada 2003). Multiwavelength studies of these young stellar objects (YSOs) provide unique opportunity to understand their formation, evolution over time, circumstellar discs including planet formation in their discs, environment induced formation scenario and history (e.g. Carpenter et al. 2001; Kenyon S., & Hartman 1995; Evans et al. 2009; Lada et al. 2010; Jose et al. 2012, 2013; Samal et a. 2015). Highly uncertain issue of contamination from foreground and background population could be minimized from YSOs excesses at near-IR and mid-IR wavelengths and observations of close reference field at similar depth (Allen et al. 2004; Megeath et al. 2004; Flaherty et a. 2007). Such contamination could be further narrow down through spectroscopic observations in the optical and near-IR wavelengths (Hillenbrand 1997; Briceno et al. 2002; Luhman 2004; Rebull et al. 2010; Herczeg & Hillenbrand 2014).
| ID | Date of | Grism/filter | Exp. time (s) | Airmass | SNR | ||
| (h:m:s) | (d:m:s) | Observations | no. frame | ||||
| optical photometry | |||||||
| NGC 2282 | 06:46:50.4 | +01:18:50 | 14.12.2007 | B | 6006, 301 | 1.048 | |
| NGC 2282 | 06:46:50.4 | +01:18:50 | 14.12.2007 | V | 6006, 101 | 1.242 | |
| NGC 2282 | 06:46:50.4 | +01:18:50 | 14.12.2007 | I | 3005, 101 | 1.339 | |
| slit spectroscopy | |||||||
| 1 | 06:46:50.304 | +1:16:35.904 | 06.10.2014 | Gr7 | 15002 | 1.398 | 28 |
| 2 | 06:46:57.282 | +1:17:45.491 | 05.01.2013 | Gr7 | 18001 | 1.286 | 25 |
| 3 | 06:46:50.544 | +1:18:04.859 | 05.01.2013 | Gr7 | 25001 | 1.733 | 24 |
| 4 | 06:46:40.092 | +1:18:47.447 | 05.01.2013 | Gr7 | 25001 | 1.212 | 25 |
| 5 | 06:46:45.986 | +1:18:07.775 | 05.01.2013 | Gr7 | 15001 | 1.733 | 30 |
| 6 | 06:46:39.456 | +1:18:38.500 | 05.01.2013 | Gr7 | 15001 | 1.212 | 36 |
| 7 | 06:46:51.581 | +1:18:57.756 | 05.01.2013 | Gr7 | 15001 | 1.172 | 60 |
| 8 | 06:46:56.424 | +1:16:40.944 | 05.01.2013 | Gr7 | 25001 | 2.250 | 18 |
| slitless spectroscopy | |||||||
| NGC 2282 | 06:46:49.4 | +1:18:44.5 | 08.11.2013 | Gr8/Hα-Br | 18001 | 1.181 | |
| NGC 2282 | 06:46:49.4 | +1:18:44.5 | 25.01.2011 | Gr5/Hα-Br | 12001 | 1.532 | |
We present here multiwavelength studies of the embedded cluster NGC 2282 ( = = ), a reflection nebula in the Monoceros constellation. It is located in an isolated molecular cloud of few thousand solar masses (Horner et al. 1997). The cluster is about 3o away on the sky from Mon OB2 and is probably associated with it. NGC 2282 has been listed in the several sky surveys of reflection nebulae (Van der Bergh 1966; Racine 1968; Kutner et al. 1980; Chini et al. 1984), and is also listed in the surveys of Galactic H ii regions as BFS 54 (Blitz et al. 1982; Avedisova & Kondratenko 1984; Fich 1993; Kislyakov & Turner 1995). The distance of NGC 2282 was estimated to be 1.7 0.4 kpc, which was mainly based on the spectral type (B2 V) of the brightest star HD 289120 in NGC 2282 (Racine 1968; Avedisova & Kondratenko 1984). So far three optical sources were classified towards NGC 2282, namely V507 Mon, HD 289120 and EQ 0644.3+0121, of which, V507 Mon was identified as a spectroscopic binary (Wachmann 1996), while HD 289120 as the illuminating source to the reflection nebula (Horner et al. 1997). EQ 0644.3+0121 was noticed as a faint nebulous source in the Palomar plates (Petrossian 1985).
The cluster properties of NGC 2282 were first studied using -bands data by Horner et al. (1997). The authors estimated the cluster age as 510 Myrs based on the fraction (9%) of infrared excess emission sources, and its association with the parent molecular cloud. Horner et al. (1997) found a core radius 0.19 pc and a cluster radius 1.6 pc at 1.7 kpc distance, by radial profile fitting of -band data with different models. Following the method of Lada et al. (1994), the authors further estimated a variable interstellar extinction in the cluster region, which showed a maximum value of 6.7 0.4 mag towards South-East part of the cluster centre, while quite low value of 1.6 0.4 mag at the cluster centre around HD 289120.
However, the fundamental parameters of the cluster are still not clearly understood; requires proper identification and characterization of the PMS sources present in the region. Due to the absence of spectroscopic or longer wavelength (e.g., disc and envelope sources seen at 2.2 m) or accretion signature indicator (e.g, emission line stars seen with Hα emission) observations, the identification and evolutionary status of the PMS sources in the region could not be studied so far. Now with observations from Spitzer Space Telescope, in combination with deep data from UKDISS survey and photometric data from IPHAS survey, it is possible to make a more reliable membership census of the cluster by identifying its young stars with accretion discs and cold envelopes. In conjugation with deep optical photometric data the identified PMS can be better characterized (e.g., mass, age) by comparing their positions on the HR digram with the theoretical evolutionary models. The characterization PMS stars are essential to derive the cluster properties and to understand its star formation history (e.g., Lada & Lada 1991; Persi et al. 1994; Tapia et al. 1997; Ojha et al. 2004). We therefore studied the cluster with multiwavelength photometric data to have a better picture on the cluster properties and star formation activity.
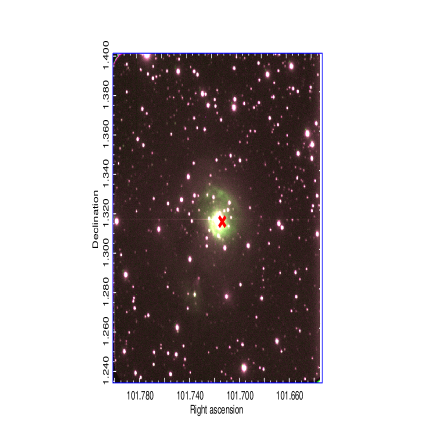
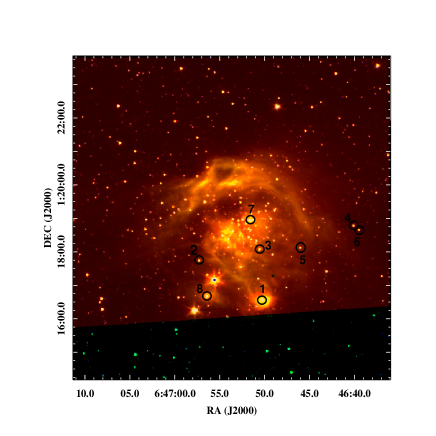
In this paper, we have estimated the basic properties of the cluster using deep optical/IR imaging and optical spectroscopic observations. We have identified and classified YSOs based on their IR excess emission in near-IR and mid-IR data as well as their emission line properties. We have characterized the YSOs based on various colour-magnitude diagrams. Optical/IR colour composite image of NGC 2282 is shown in Fig. 1. These optical observations were taken by us using narrow-band filters at 5007 Å[O III] (blue), 6563 Å[] (green) and 6724 Å[S II]) (red). While IR colour composite image is made using UKIDSS -band (blue), Spitzer 3.6 m (green) and 4.5 m (red) images. Section 2 describes our observations and archival data sets used for the present study. Section 3 deals with our analyses and results that include spectroscopic study of 8 optical bright objects, identification and classification of the YSOs. In Section 4, we discuss the cluster properties such as ages, masses, spatial distribution etc. In section 5, we summarize our main results of the work.
2 Data Sets Used
2.1 Observations
2.1.1 Optical Photometry
The CCD BVI observations of the cluster were acquired using the 1.04m Sampurnanand telescope (ST; Sagar 1999) at Nainital, India during 2007 December 14. The log of optical observations is shown in Table 1. We used a CCD Camera having a pixel size of 24 m and field-of-view (FOV) about 13 with a plate scale of 0.37 arcsec pixel-1. The gain and read out noise of the CCD are 10 e-/Analog to Digital Unit(ADU) and 5.3 e- respectively. The observations were taken in 22 binning mode to improve the signal to noise ratio (SNR) and the average FWHM of the stars were 2. The observations were taken in short and long exposures to get a good dynamic coverage of the stellar brightness. Along with the NGC 2282 field, standard stars in the SA 92 field (Landolt 1992) were also observed at various airmasses on the same night.
The raw CCD images were cleaned using IRAF111Image Reduction and Analysys Facility (IRAF) is distributed by National Optical Astronomy Observatories (NOAO), USA (http://iraf.noao.edu/) software following bias subtraction, flat fielding and cosmic ray removal. The identification of point sources was performed with the DAOFIND task. Following Stetson (1987), we have used the roundness limits of to and sharpness limits of to to eliminate bad pixels brightness enhancements and the extended sources such as background galaxies from the point source catalog. The photometry by PSF fitting was done using ALLSTAR task of DAOPHOT package (Stetson 1992). The instrumental magnitudes were converted to standard magnitudes following the procedure outlined by Stetson (1987). A total of 13 stars of SA 92 field were used to estimate atmospheric extinction and transformation coefficients. The estimated extinction coefficients in , and are 0.307 0.014, 0.185 0.005 and 0.108 0.008, respectively. The final transformation equations used for photometric calibrations are
| (1) |
| (2) |
| (3) |
where , , are the standard magnitudes and , , are the instrumental magnitudes corrected for the atmospheric extinctions for the airmass given in Table 1. The error of final magnitude measurements are obtained by propagating the uncertainties in extinction measurements, standard coefficients and profile-fitting photometry etc. The profile-fitting uncertainty is estimated from the gain and read-out-noise of CCD camera, and background level of an image etc. Fig. 2 shows the standardization residuals () between standard and transformed magnitudes, and colours of standard stars as function of magnitudes. The standard deviations in , and are 0.024, 0.019 and 0.023 mag, respectively. Finally, we estimated optical magnitudes of 1379 objects, which are detected in two or more bands with a limiting magnitude of 22 mag.
The world coordinate system (wcs) coordinates for the detected stars in the frame were determined using 20 isolated moderately bright stars with their positions from the 2MASS point source catalogue (PSC) (Curti et al. 2003), and a position accuracy of better than 0.3 has been achieved. We used IRAF tasks , and to achieve the above astrometric solution.

2.1.2 Slit Spectroscopy
We obtained optical spectroscopic observations of 8 bright sources within NGC 2282 using HFOSC of 2m Himalayan Chandra Telescope (HCT), India (Prabhu 2014). There observations were acquired using Grism 7 (3800- 6840 Å) with a resolving power of 1200 and a spectral dispersion of about 2.9 Å per two pixels. The FeAr arc lamp observations were taken immediately after the target observations. The spectrophotometric standard star G191B2B (Oke 1990) was also observed with an exposure time of 600s for the flux calibration. The log of spectroscopic observations is tabulated in Table 1.
After bias subtraction and flat field correction, the one-dimensional spectra were extracted using the optimal extraction method using APALL task in IRAF and wavelength calibrated using the FeAr arc lamp observations. The spectra were also corrected for the instrumental response using the sensitivity function generated from the standard star observations.
| ID | RA (J2000) | Dec (J2000) | 3.6 m | 4.5 m | ||||||
|---|---|---|---|---|---|---|---|---|---|---|
| (deg) | (deg) | (mag) | (mag) | (mag) | (mag) | (mag) | (mag) | (mag) | (mag) | |
| 1 | 101.709618 | 1.276534 | 14.674 0.008 | 0.933 0.007 | 1.438 0.004 | 11.964 0.020 | 11.506 0.029 | 11.164 0.034 | 10.678 0.002 | 10.371 0.003 |
| 2 | 101.738704 | 1.295886 | 13.858 0.006 | 0.775 0.003 | 0.945 0.002 | 12.273 0.019 | 11.886 0.022 | 11.771 0.023 | 11.706 0.004 | 11.712 0.005 |
| 3 | 101.710595 | 1.301281 | 14.285 0.004 | 0.978 0.003 | 1.177 0.003 | 12.264 0.020 | 11.789 0.025 | 11.648 0.025 | 11.606 0.004 | 11.612 0.005 |
| 4 | 101.667052 | 1.313098 | 13.348 0.005 | 0.587 0.002 | 0.735 0.005 | 12.196 0.020 | 11.959 0.026 | 11.873 0.026 | 11.816 0.004 | 11.824 0.005 |
| 5 | 101.691841 | 1.302181 | 13.777 0.005 | 0.721 0.003 | 0.803 0.002 | 12.460 0.020 | 12.155 0.026 | 12.080 0.025 | 12.017 0.004 | 12.066 0.006 |
| 6 | 101.664463 | 1.311054 | 14.037 0.004 | 0.646 0.003 | 0.809 0.005 | 12.711 0.020 | 12.548 0.027 | 12.429 0.028 | 12.333 0.005 | 12.318 0.006 |
| 7 | 101.715141 | 1.315808 | 10.198 0.010 | 0.148 0.010 | 0.337 0.009 | 9.717 0.025 | 9.586 0.024 | 9.542 0.026 | 9.425 0.002 | 9.404 0.002 |
| 8 | 101.735121 | 1.277934 | 15.934 0.013 | 1.037 0.010 | 1.841 0.007 | 12.061 0.023 | 11.212 0.020 | 10.572 0.023 | 9.616 0.003 | 9.049 0.002 |
| 9 | 101.738965 | 1.208942 | 18.459 0.004 | 1.934 0.035 | 2.624 0.008 | 13.554 0.021 | 12.615 0.028 | 12.198 0.023 | 11.951 0.004 | |
| 10 | 101.662814 | 1.214660 | 16.779 0.002 | 1.506 0.010 | 1.914 0.010 | 13.243 0.020 | 12.477 0.027 | 12.242 0.026 | 12.064 0.004 | |
| 11 | 101.689942 | 1.216617 | 13.879 0.003 | 0.543 0.005 | 0.755 0.010 | 12.630 0.020 | 12.391 0.027 | 12.287 0.026 | 12.258 0.005 | |
| 12 | 101.705790 | 1.222968 | 15.948 0.003 | 0.921 0.004 | 1.286 0.007 | 13.620 0.023 | 13.225 0.027 | 13.064 0.033 | 12.890 0.007 | |
| 13 | 101.702240 | 1.224899 | 16.201 0.002 | 1.801 0.006 | 2.206 0.007 | 12.172 0.018 | 11.303 0.025 | 11.019 0.025 | 10.808 0.002 | |
| 14 | 101.660364 | 1.219329 | 15.163 0.002 | 0.658 0.005 | 0.897 0.013 | 13.664 0.023 | 13.438 0.036 | 13.302 0.042 | 13.218 0.009 | |
| 15 | 101.695928 | 1.240098 | 11.657 0.001 | 0.331 0.001 | 0.428 0.001 | 11.001 0.018 | 10.895 0.025 | 10.821 0.021 | 10.863 0.002 | |
| 16 | 101.697027 | 1.251858 | 16.037 0.043 | 1.509 0.055 | 1.611 0.068 | 12.930 0.026 | 12.423 0.034 | 12.075 0.034 | 12.083 0.004 | |
| 17 | 101.707273 | 1.250715 | 18.082 0.005 | 2.273 0.028 | 2.860 0.006 | 12.790 0.018 | 11.691 0.026 | 11.269 0.025 | 10.937 0.003 | |
| 18 | 101.781223 | 1.227141 | 15.286 0.004 | 1.804 0.009 | 2.248 0.003 | 11.254 0.019 | 10.401 0.020 | 10.126 0.019 | 9.938 0.002 | |
| 19 | 101.756836 | 1.248329 | 15.473 0.003 | 0.840 0.003 | 1.099 0.003 | 13.624 0.019 | 13.266 0.024 | 13.119 0.030 | 13.093 0.008 | |
| 20 | 101.755078 | 1.237696 | 14.601 0.002 | 0.952 0.004 | 1.178 0.005 | 12.565 0.021 | 12.172 0.020 | 12.057 0.021 | 12.030 0.005 | |
| 21 | 101.783209 | 1.238542 | 14.248 0.003 | 0.483 0.002 | 0.690 0.003 | 13.137 0.023 | 12.998 0.030 | 12.899 0.026 | 12.834 0.007 | |
| 22 | 101.768600 | 1.242802 | 16.683 0.003 | 1.446 0.006 | 2.174 0.004 | 13.213 0.021 | 12.608 0.020 | 12.386 0.024 | 12.140 0.005 | |
| 23 | 101.768194 | 1.248966 | 16.017 0.004 | 1.770 0.005 | 2.305 0.002 | 11.783 0.019 | 10.860 0.020 | 10.555 0.021 | 10.323 0.002 | |
| 24 | 101.792152 | 1.249625 | 13.821 0.004 | 0.549 0.002 | 0.740 0.003 | 12.674 0.019 | 12.402 0.020 | 12.344 0.023 | 12.299 0.005 | |
| 25 | 101.783535 | 1.271522 | 15.903 0.003 | 1.693 0.005 | 2.090 0.003 | 12.141 0.019 | 11.370 0.020 | 11.099 0.021 | 10.916 0.003 | 10.907 0.003 |
| 26 | 101.810802 | 1.277135 | 15.134 0.002 | 0.739 0.005 | 0.936 0.005 | 13.607 0.025 | 13.327 0.038 | 13.150 0.034 | 13.165 0.008 | 13.132 0.010 |
| 27 | 101.813572 | 1.282032 | 18.224 0.027 | 1.899 0.028 | 2.541 0.008 | 13.647 0.026 | 12.714 0.026 | 12.393 0.024 | 12.085 0.004 | 12.061 0.005 |
| 28 | 101.750326 | 1.247554 | 14.367 0.004 | 0.709 0.003 | 0.858 0.006 | 12.931 0.025 | 12.598 0.028 | 12.536 0.027 | 12.502 0.006 | |
| 29 | 101.749411 | 1.261315 | 13.565 0.005 | 1.148 0.003 | 1.307 0.004 | 11.442 0.021 | 10.831 0.020 | 10.737 0.023 | 10.687 0.002 | |
| 30 | 101.772527 | 1.267760 | 15.406 0.004 | 0.834 0.003 | 1.081 0.003 | 13.596 0.023 | 13.155 0.028 | 13.017 0.037 | 13.001 0.008 | 12.995 0.010 |
| 31 | 101.740814 | 1.270879 | 17.872 0.005 | 2.871 0.041 | 3.932 0.003 | 10.489 0.019 | 8.853 0.039 | 8.118 0.015 | 7.623 0.029 | 7.629 0.011 |
| 32 | 101.783952 | 1.276780 | 17.428 0.008 | 2.170 0.016 | 2.688 0.003 | 12.529 0.023 | 11.460 0.028 | 11.071 0.023 | 10.818 0.002 | 10.815 0.003 |
| 33 | 101.790469 | 1.288697 | 12.782 0.002 | 0.597 0.003 | 0.724 0.003 | 11.595 0.019 | 11.262 0.020 | 11.226 0.017 | 11.214 0.003 | 11.210 0.004 |
| 34 | 101.797372 | 1.315962 | 12.522 0.002 | 0.774 0.002 | 0.918 0.002 | 11.018 0.019 | 10.597 0.020 | 10.511 0.021 | 10.501 0.002 | 10.472 0.003 |
| 35 | 101.763612 | 1.311435 | 13.608 0.004 | 0.417 0.005 | 0.765 0.004 | 12.270 0.018 | 12.075 0.020 | 11.984 0.021 | 11.868 0.004 | 11.845 0.005 |
2.1.3 Slitless Spectroscopy
The grism slitless spectroscopic observations were obtained to identify emission line stars using HFOSC of HCT on 2011 January 25 and 2013 November 08. The observations were carried out using a combination of Grism 5 (5200-10300 Å) or Grism 8 (5800-8350 Å) and the broadband filter (6300-6740Å). The log of observations is shown in Table 1. The emitting sources were identified by the presence of bright spot along the slitless spectra, while non-emitting sources do not show any bright spot. Thus, we have identified 16 sources as emission line sources which are discussed later in sect. 3.5.3.
2.2 ARCHIVAL DATA SETS
2.2.1 Near-Infrared Data form UKDISS and 2MASS
Near-IR photometric data towards NGC 2282 were acquired from the UKIRT Infrared Deep Sky Survey (UKIDSS, Lawrence et al. 2007), which were taken during the UKIDSS Galactic Plane Survey (GPS) (Lucas et al. 2008; data release 6). The UKIDSS GPS has saturation limits at = 13.25, = 12.75 and = 12.0 mag, respectively (Lucas et al. 2008). We therefore, replaced the saturated stars with the 2MASS PSC data. We set the 2MASS limit 0.5 magnitudes fainter than UKIDSS saturation limits following Alexander et al. (2013). In total, 150 saturated sources in UKIDSS catalog were replaced by 2MASS sources.
| ID | RA (J2000) | Dec (J2000) | Spectroscopic | Photometric * | distance ** | distance | Spectral | Remarks | ||
|---|---|---|---|---|---|---|---|---|---|---|
| (h:m:s) | (d:m:s) | (mag) | (mag) | (mag) | (mag) | modulus | (pc) | Type | ||
| 1 | 06:46:50.304 | +1:16:35.904 | 14.674 | 1.438 | 4.91 0.20 | 4.69 0.90 | 11.01 0.20 | 1592 147 | B5V | member |
| 2 | 06:46:57.282 | +1:17:45.491 | 13.858 | 0.945 | 0.64 0.15 | 7.96 0.15 | 390 30 | G8V | foreground | |
| 3 | 06:46:50.544 | +1:18:04.859 | 14.285 | 1.177 | 0.67 0.20 | 7.71 0.20 | 348 32 | K1V | foreground | |
| 4 | 06:46:40.092 | +1:18:47.447 | 13.348 | 0.735 | 0.46 0.16 | 9.20 0.17 | 692 50 | F7V | foreground | |
| 5 | 06:46:45.986 | +1:18:07.775 | 13.777 | 0.803 | 0.59 0.17 | 9.21 0.18 | 695 55 | F9V | foreground | |
| 6 | 06:46:39.456 | +1:18:38.500 | 14.037 | 0.809 | 0.86 0.21 | 10.33 0.21 | 1165 110 | F0V | foreground | |
| 7 | 06:46:51.581 | +1:18:57.756 | 10.198 | 0.337 | 1.66 0.17 | 1.61 0.71 | 11.18 0.18 | 1722 135 | B2V | HD 289120; member |
| 8 | 06:46:56.424 | +1:16:40.944 | 15.934 | 1.841 | 8.82 0.14 | 10.72 0.62 | B0.5Ve | Herbig Be; member |
-
*
Photometric ’s are calculated from extinction map. Foreground stars have not considered here.
-
**
Distance moduli refers to the intrinsic distance moduli obtained from near-IR apparent distance moduli.
2.2.2 Spitzer-IRAC data from warm mission
The IRAC observations in 3.6 and 4.5 m bands (channels 1 and 2) were available in the Spitzer archive program (Program ID: 61071; PI: Whitney, Barbara A). The data sets were taken towards NGC 2282 on May 25, 2011 at various dithered positions and with integration time of 0.4 and 10.4 sec per dither. The basic calibrated Data (version S18.18.0) were downloaded from Spitzer archive222http://archive.spitzer.caltech.edu/. The raw data were processed and the final mosaic frames were created using MOPEX (version 18.5.0) with an image scale of 1.2 arcsec pixel-1. We performed point response function (PRF) fitting method using APEX tool provided by Spitzer Science centre on all the Spitzer IRAC images to extract the magnitudes of point sources. The detailed procedure of source detection and magnitude extraction is described in Jose et al. (2013). We adopted zero point flux densities of 280.9 and 179.7 Jy for the 3.6 and 4.5 m bands, respectively, following the Warm Spitzer Observer Manual. We finally detected 3049 and 2341 number of sources within 7 radius around the cluster in IRAC 3.6 and 4.5 m bands, respectively. The IRAC data of two bands were matched with a radial matching tolerance of 1.2 arcsec. Thus our final IRAC catalog contains 3304 sources, of which, 2085 sources are detected in both bands.
2.2.3 IPHAS data
INT Photometric Survey of the Northern Galactic Plane (IPHAS) is a photometry survey using wide field camera (WFC) on the 2.5m Isaac Newton Telescope (INT) with Sloan , filters and narrow-band filter (Drew et al. 2005; Gonzalez-Solares et al. 2008). The data for NGC 2282 were obtained in all three bands from the data release 2 (Barentsen et al. 2014).
2.2.4 Multiwavelength Catalog
The multiwavelength catalog was built by cross-matching all the catalogs described in the above sections except IPHAS data. The and IRAC data were matched with a matching radius of 2. Before this, we performed several test matches by increasing the matching radius in step of 0.1 from 1.0 to 3.5. We found that the matching radius of 2 is sufficient for cross-matching two catalogs. In few cases, we got more than one matching sources, and we have taken the closest one as the best match. Following the same method, we adopted the matching radius of 2 to match between IR and optical catalog. Finally, the results of each match have been visually inspected in Optical, UKIDSS, 2MASS and Spitzer images. Our final catalog contains total 5601 number of sources within 7 radius around the cluster, but all of them do not have detection in all wavelengths. The entire photometric catalog is presented in Table 2. But, those sources with uncertainty 0.1 mag have been taken for our study to ensure good photometric accuracy.
The completeness limits at various bands were estimated from histogram turn over method (e.g. Samal et al. 2015). We considered 90% completeness of our data from the turning points of magnitudes at which cumulative logarithmic distribution of sources in the histograms deviate from linear distribution (figures are not shown). We found that the photometric data is complete down to = 21 mag, = 20 mag, = 18.5 mag, = 18 mag, = 17.5 mag, [3.6] = 15.5 mag and [4.5] = 15 mag, respectively. However, completeness is limited by various factors such as, variable reddening, central luminous sources, stellar crowding across the region etc. Bright extended sources, variable nebulosity, significant saturation in Spitzer-IRAC bands also limits the point source detections. The modest sensitivity of UKIDSS and Spitzer-IRAC observations significantly limits our study.
For cross-checking, the completeness limits of -band was also estimated by the method of inserting artificial stars of various magnitude bins into the image using IRAF (e.g. Jose et al. 2013). The frames were reduced using the same procedure used for original frame. The -band photometry was 100% complete down to 18 mag, reduced to 90% for 19-20 mag range, and 78% for the 21-21.5 mag range. The completeness limit obtained for -band using artificial star injection method fairly matches with that of the histogram analysis.
3 Analysis and Results
3.1 Stellar density and cluster radius
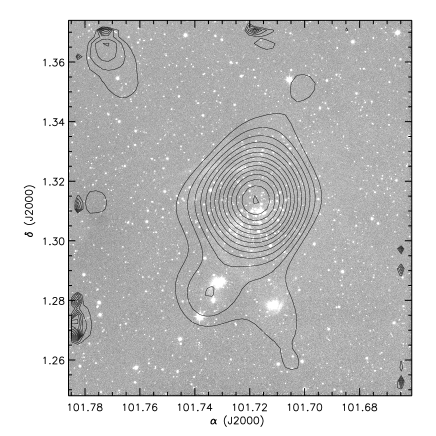
In order to understand the spatial structure of the cluster, we generated the stellar surface density map using the nearest neighborhood technique and following the method introduced by Casertano & Hut (1985). Briefly, the stellar density inside a cell of an uniform grid with centre at the coordinates (i, j) is = where, is the distance from the centre of the cell to the Nth nearest source. Value of N is allowed to vary depending upon how smallest scale structures of the field are interested to study. In Fig. 3. we have shown the surface density map which is estimated using the - band data ( 17.5 mag with photometric uncertainty of 0.1) for the stars towards NGC 2282 region overlaid on the UKIDSS -band image. This map has been obtained using a grid size of 10 10 and N=9. As evident in the IR image of the cluster (see Fig. 1b), the surface density map shows a more or less centrally concentrated clustering with a slight elongation along the north-south direction. We obtained the peak stellar density as 418 (96 ). The radius of the cluster can be considered as the semi-major axis of the outermost elliptical contour in Fig. 3. The cluster radius was thus estimated as 3.15, which agrees well with the literature value (Horner et al. 1997).
3.2 Spectral Classification of Optically Bright Sources
In this section we estimate the spectral types of 8 bright objects observed towards NGC 2282. The targets for low-resolution spectroscopy were selected on the basis of their brightness ( 13 mag) around the cluster (see Fig. 1). The coordinates and optical magnitudes of these sources are given in Table 3, and the flux calibrated, normalized spectra are shown in Fig. 4.


We classified the observed spectra using different spectral libraries available in the literature (Walborn & Fitzpatrick 1990; Jacoby, Hunter & Christian 1984; Torres-Dodgen & Weaver 1993; Allen & Strom 1995). First, we determined a specific spectral range from strong conspicuous features. For e.g., the absence of He ii 5411 Å, in a spectra constraints the spectral type as B0.5 or later. While the absence of He i 5876 Å, in a spectra limits the spectral type to A0 or later (Lundquist et al. 2014). Spectra of O- and B-type stars have the features of hydrogen and helium along with other atomic lines (e.g. O ii , C iii , Si iii , Si iv , Mg ii ). The He ii line strength appears weaker for late O-type stars and He ii 4686 is last visible in B0.5 (Walborn & Fitzpatrick 1990). If a spectrum shows He ii line at 4200 Å along with the O ii /C iii blend at 4650 Å, we can classify them to be earlier than B1. The absence of He ii 4200, He ii 4686, Mg ii 4481 and presence of weak features of silicon along with the weak O ii /C iii blends at 4070 and 4650 Å, indicates the spectral type in the range of B1B2. For B2-type spectra, He i is in its maximum strength, but for later-type stars Si ii 4128-4130 and Mg ii gets stronger (Walborn & Fitzpatrick 1990). The presence of He i lines indicates that spectral type is earlier than B5B7. The late-type sources are classified using the spectral lines TiO 5847-6058, Na i 5893, He i , , Ca i 6122, 6162, Fe ii 6456. A- and F- stars are identified comparing their equivalent width. The G-band (CH 4300 Å) appears from F-type stars. G-type stars are classified in comparisons with the equivalent width of and Mg i triplet ( 5167, 5172, 5183 Å). Finally, each source was compared visually to the standard library spectra from Jacoby et al. (1984). However, on the basis of the lowresolution spectroscopy of early type stars, it is difficult to distinguish the luminosity class between supergiants, giants, dwarfs and premain sequence stars.
Comparison with the standard spectral libraries of Jacoby et al. (1984) and Walborn & Fitzpatrick (1990), the star ID 1 is classified as B5 V as it has no features of He ii 4200, weak features of He ii 4541 and C II 4267. The star IDs 2, 3, 4, 5 and 6 are classified as G8 V, K1 V, F7 V, F9 V and F0 V, respectively, as these stars show presence of G-band (CH 4300 Å) and Mg iii triplet ( 5167 Å, 5177 Å, 5183 Å), and their luminosity classes resemble better with main-sequence stars rather than super-giants or giants. The star ID 7 is classified as B2 V as it shows weak features of Si iii 4552 along with blended C iii /O ii 4070 and C iii /O ii 4650, and absence of He ii 4200, He ii 4686, and Mg ii 4481. The star ID 8 is classified as B0.5 Ve as it shows ionized helium lines at He ii 4200, He ii 4686, He ii 5411, and He ii 5720 including strong Hα, H and H lines in emission. Based on low-resolution spectra of our targets, an uncertainty of 1 or more in the subclass estimation is expected. Photometric and spectroscopic details of all the 8 sources are given in Table 3.
3.3 Reddening towards the Region
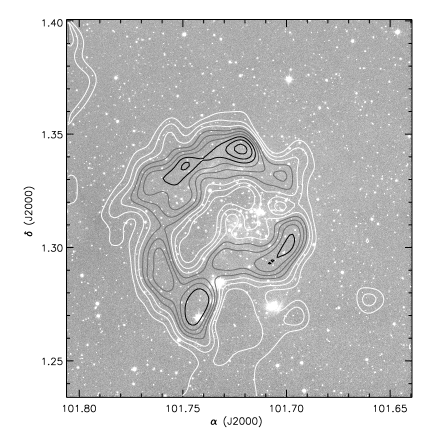
The extinction in an embedded cluster is distributed non-uniformly. It is important to know the spatial variation of extinction of the cluster to characterize the cluster members. We estimated the -band extinction towards NGC 2282 using 2MASS and UKIDSS data within an area 10 10, to understand the local extinction towards the region. We measured the value using () colours of the stars. The sources without infrared excess ( i.e., background dwarfs and non-excess sources within the field) were used to generate the extinction map. Following Gutermuth et al. (2005), we used the grid method to measure the mean value of (see Jose et al. 2013 for details). Briefly, we divided the region of our interest into small grids of size 10 10. The mean value and standard deviation of colours of 5 nearest neighbor stars from the centre of each grid was measured. We rejected any sources deviating above 3 to calculate the mean value of () at each grid position. To eliminate foreground extinction, we took only those stars having 0.12 mag to generate the extinction map (Jose et al. 2013). The () values were converted into using the reddening law given by Falherty et al. (2007), i.e., , where is the average intrinsic colour of stars, which is assumed to be 0.2 (Allen et al. 2008; Gutermuth et al. 2009). To improve the quality of the extinction map, we excluded the probable YSOs candidates (see sect. 3.5), which otherwise might show high extinction value due to near-IR excess from circumstellar disc emission. The derived extinction map is shown in Fig. 5. The extinction within NGC 2282 varies between = 1.68.7 mag with an average extinction of 0.35, which corresponds to 3.9 mag considering the extinction ratio / = 0.090 given by Cohen et al. (1981). The south-eastern part of the cluster found to be at relatively high extinction ( is 0.5 mag) compared to the average extinction of the cluster.
We also verified the extinction to each spectroscopically observed source from their photometry. According to the spectral types given in Table 3, we estimated the average interstellar extinction towards each star. We first calculated the IR colour excesses , , for each sources using their observed colours. We transformed these colour excess into visual extinction according to the extinction law, = , = , = (Cohen et al. 1981). Finally, we took the average values for each star and are given in Table 3. The extinction of HD 289120, which is the main illuminating stars of the cluster, is 1.65 mag.
3.4 Distance and Membership of the Bright Sources
The projected stars against NGC 2282 could be either the young members of the clusters, background stars or foreground stars. We estimated the membership of the candidates based on their spectral types, distance, and photometry. One can derive the distance to a star from estimated spectral type, apparent magnitudes and extinction. We calculated the optical intrinsic distance modulus and also the near-IR intrinsic distance modulus , and . We prefer near-IR intrinsic distance modulus over optical as it is relatively less uncertain on extinction and come from simultaneous three band measurements of 2MASS data. From near-IR intrinsic distance modulus, we estimated the distance to each spectroscopically observed stars and are given in Table 3. The intrinsic colours and absolute magnitudes are taken from Koorneef (1983), Schmidt-Kaler (1982) and Pecaut & Mamajek et al. (2013). The values of intrinsic distance modulus for star IDs 1 and 7 are found to be 11.01 0.20 mag, 11.18 0.18 mag, which corresponds to 1592 147 pc and 1722 135 pc, respectively. Three early B-type stars are adopted as members of the cluster. Thus, we measure the average distance to the cluster as 1650 100 pc from our spectrophotometry observations. Our estimated distance agrees well with the published value in the literature (Racine 1968; Avedisova & Kondratenko 1984; Horner et al. 1997). Considering their distances, the star IDs 2, 3, 4, 5 and 6 seem to be foreground stars. The distance to the star ID 8 could not be measured accurately, as it is an emission line star with large infrared excess due to the presence of circumstellar disc.
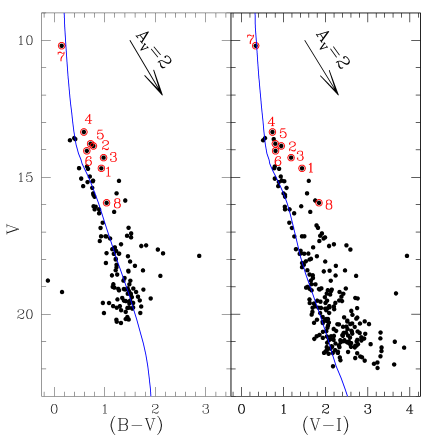
In Fig. 6, we show and colour-magnitude diagrams (CMDs) for all the stars detected in optical photometry towards NGC 2282. Spectroscopically classified stars are also marked with red circles. The solid blue curve is the zero-age main sequence (ZAMS) by Girardi et al. (2002) shifted for the distance 1.65 kpc and reddening = 0.52 mag and = 0.65 mag () = 1.25 ; Cohen et al. 1981), respectively. Since the cluster reddening is highly variable, we used the extinction of the main-sequence (MS) member, HD 289120, located at the cluster centre for corrections of theoretical isochrones. HD 289120 lie on the ZAMS locus. The star IDs 1 and 8 are also high mass members of the cluster. Though the stars with IDs 2, 3, 4, 5 and 6 fall towards right side of the ZAMS, spectroscopic analysis reveals that these stars could be foreground towards NGC 2282. For more reliable membership analysis, we used various observable signature of youthfulness such as emission at , excess emission due to presence of disc to identify the probable members of the cluster (see sect. 3.5).
3.5 Identification and Classification of YSOs
We identify and classify the YSOs towards NGC 2282 based on their IR colours. Following Gutermuth et al. (2008, 2009), we used IRAC 3.6 and 4.5 m band data along with and data to identify and classify the YSOs. The main limitations for the identification of YSOs based on the IR colours arise from the contaminations of different non-stellar sources in IR detections such as, extragalactic objects like polycyclic aromatic hydrocarbon (PAH) emitting and star-forming galaxies, active galactic nuclei (AGN), unresolved knots of shock emission, PAH-emission contaminated apertures, etc. These sources have considerable IR colours, which could mimic the colours of YSOs in colour-colour (CC) diagram. A number of candidate YSOs could be missed in the mid-IR bands due to the limited sensitivity of IRAC observations. Hence, we identify more YSOs using their near-IR colours (UKIDSS and 2MASS) from the master catalog given in Table 2. We used near-IR CC diagram to identify the additional YSOs, but we cannot classify them in to Class I or Class II category based on their near-IR colours alone. Similarly, the presence of Hα emission is considered as a significant characteristic of a YSO with ongoing disc accretion process (e.g. Dahm 2005). We identified the Hα emission line stars from our slitless spectroscopy data and IPHAS photometry survey (see sect. 3.5.3.). Below we explain the details about the various YSO selection processes.
3.5.1 Selection of YSOs from , , 3.6, 4.5 m data
In order to classify the YSOs, we used IRAC 3.6 and 4.5 m data from Spitzer and and near-IR data. The detection of YSOs based on the Spitzer data is limited here because NGC 2282 was observed during the Spitzer warm mission, which does not provide observations beyond 4.5 m. Hence we missed the longer wavelength IRAC data at 5.6, 8.0 m and MIPS at 24 m bands for improved YSO classification. Here we classify only Class I and II objects and we do not account for Class III objects as they are indistinguishable from field stars based on the data sets used in this study.
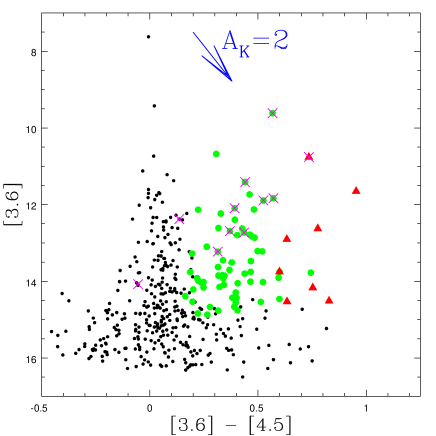
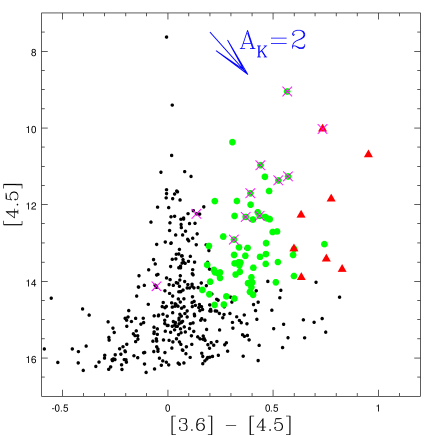
We adopted the source classification scheme introduced by Gutermuth et al. (2008, 2009) based on the IR colours. We first dereddened the data using our -band extinction map (see sect. 3.3). We minimized the inclusion of extragalactic contamination by applying a simple brightness cut in the dereddened 3.6 m photometry, i.e, all the Class I YSOs essentially have 15 mag and all the Class II YSOs essentially have 14.5 mag (Gutermuth et al. 2009). After removing the contaminants, we identified YSOs from () CC diagram shown in Fig. 7. Thus we identified 84 candidate YSOs , which includes 9 Class I and 75 Class II sources with IR excess emission. In Fig. 7, the Class I and Class II sources are shown as the red triangles and green circles, respectively, and a reddening vector for = 2 mag is also plotted by using the reddening law from Flaherty et al. (2007). The emission line sources from slitless spectroscopy are marked with magenta crosses (discussed later). Fig. 8 shows the CMDs in mid-IR bands for all the uncontaminated sources along with the candidate YSOs. Our present YSO selection is incomplete as many sources in high nebulous region might have not detected at 3.6 and 4.5 m bands as well as due to the detection limits of IRAC observations.
3.5.2 YSOs from Near-IR Colour-Colour Diagram
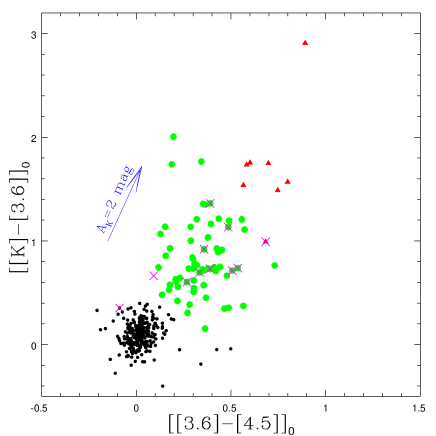
Near-IR colour-colour diagram is shown in Fig. 9a. The black solid and long dashed green line represent the locus of the intrinsic colours of dwarf and giant stars, taken from Bessel & Brett (1988). The dashed black line represents the locus of the classical T Tauri stars (CTTSs) (Meyer et al. 1997). All the intrinsic locus and photometric data points are transformed in to the CIT (California Institute of Technology) system (Elias et al. 1982) using the relations given by Carpenter et al. (2001). The parallel dashed lines represent the interstellar reddening vectors. The slope of the reddening vectors (i.e., / = 0.265, / = 0.155 and / = 0.090) are taken from Cohen et al. (1981).
We divide the near-IR space into three regions- F, T, and P. The near-IR emission of stars in ‘F’ region originate from their discless photosphere. These stars are located between the upper and middle reddening vectors in the near-IR CC diagram and they are considered to be either field stars or weak-line T Tauri stars (WTTSs)/Class III sources with no or small near-IR excess. However, it is very difficult to distinguish between WTTSs with small near-IR excess and field stars from only near-IR CC diagram (Ojha et al. 2004). The near-IR emission of ‘T’ region stars arise from both photosphere and circumstellar disc ( Lada & Adams 1992). Majority of these stars are considered to be classical T Tauri stars (CTTSs). All such sources possess accreting optically thick disc (Meyer et al. 1997). The ‘P’ region stars have more near-IR colour excess at K-band, and these stars are thought to have accreting disc. Some of them might have envelope around them and they are protostellar in nature (Rice et al. 2012).
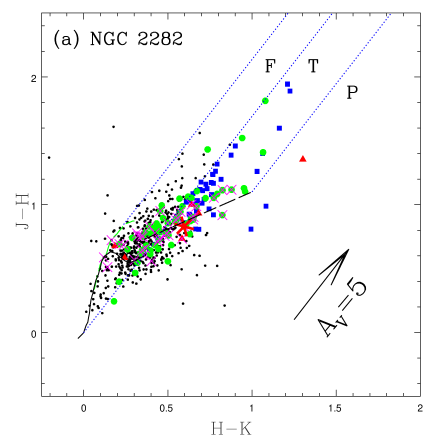
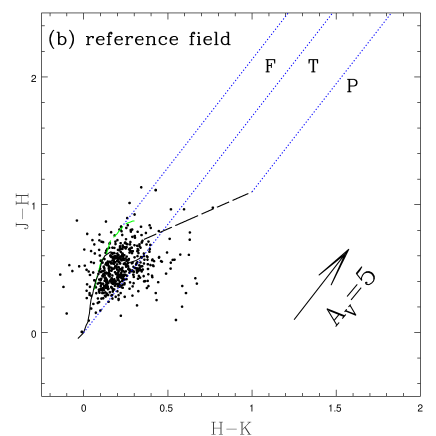
We also plotted the CC diagram for the reference field sources in Fig. 9b. The reference field region was chosen for the same area as that of the cluster (radius = 3.15) and at similar photometric depth. The reference field was selected 10 towards the North of NGC 2282 ( = = ), to avoid any superposition with the cluster region. A comparison of the reference field with our cluster region shows that almost all the stars in the reference field are confined below 0.8 mag and to the left of the middle reddening vector from 0.6 mag. Thus we assume that the ‘T’ and ‘P’ region stars are not contaminated by the field stars. Hence those sources fall in the ‘T’ and ‘P’ regions of the target field could be considered as candidate YSOs. From near-IR colour, we have selected 45 additional YSOs, which are not included in the previous YSO list (sect. 3.5.1). Only from data it is not possible to distinguish Class I and Class II objects, hence we consider them as candidate YSO sources.
3.5.3 Selection of Hα Emission Stars from Slitless Spectroscopy and IPHAS Photometry
Using slitless spectroscopy, emission-line stars were visually identified from their enhancement over the continuum. We identified 16 emitting sources and they are listed in Table 4. Of the 16, 14 sources have data sets. Ten emission stars are detected as YSOs from , , 3.6 and 4.5 m colours (1 Class I, 9 Class II). All the emission stars are plotted in the near-IR colour-colour diagram shown in 9a. The star ID 8 (see Table 3), which is classified as a B0.5 Ve star in the optical slit-spectroscopy with strong emission, is also detected with the slitless spectroscopy and falling in the ‘P’ region of CC diagram (See Fig. 9a).
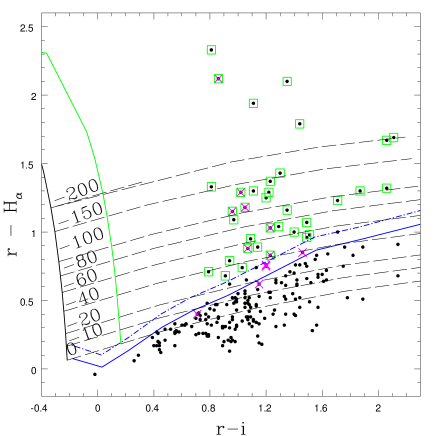
Fig. 10 presents the IPHAS () CC diagram towards NGC 2282. Black filled circles are the sources brighter than 20 with photometric uncertainty of 0.1 mag in IPHAS DR2. The identified sources are marked in Fig. 10. Two nearly vertical black and green lines represent the trend for an unreddened Rayleigh-Jeans continuum and the case of an unreddened optically thick disc accretion continuum, respectively (Barentsen et al. 2014). The black broken lines are the predicted lines of constant net emission EW. The solid and broken blue lines indicate the locus of unreddened main-sequence and that of the main-sequence stars having an Hα emission-line strength of 10 Å EW, respectively. The main-sequence emission line with EW 10 Å is chosen as CTTS threshold for Hα emission stars. However, it is difficult to confirm CTTSs solely on the basis of IPHAS photometry (Barentsen et al. 2014). Other possible Hα emission objects are evolved massive stars (e.g. Be stars, Wolf-Rayet stars, luminous blue variables), evolved intermediate-mass stars (e.g. Mira Variables, unresolved planetary nebulae) and interacting binaries (e.g. cataclysmic variables, symbiotic stars). (Barentsen et al. 2011; Corradi et al. 2008).
We selected 44 sources as emitting stars, which are located above the 3 confidence level from CTTSs threshold as mentioned above. Out of 16 emitting sources detected from slitless spectroscopy, 15 have IPHAS photometry, but only 10 satisfy the conditions for emitting stars using IPHAS photometry. This difference could be due to the variable emission activities in PMS sources as well as due to the different detection limits for these two observations. Thus we have selected 50 emitting sources from slitless spectroscopy and IPHAS photometry. Among those 50 emitting sources, 24 are classified as Class II and 3 are classified as Class I sources. Including these emission sources, and the YSOs selected from mid-IR and near-IR colours in sect. 3.5.1 and sect. 3.5.2, we have 152 candidate YSOs in NGC 2282 region, and the details are presented in Table 4.

| ID | 3.6 m | 4.5 m | Hα-emission | ||||||||
| (deg) | (deg) | (mag) | (mag) | (mag) | (mag) | (mag) | (mag) | (mag) | (mag) | (YES/NO) | |
| Class I sources | |||||||||||
| 54 | 101.723024 | 1.310400 | 17.447 0.005 | 1.323 0.018 | 2.195 0.005 | 13.677 0.026 | 12.644 0.026 | 11.958 0.027 | 10.761 0.003 | 10.026 0.002 | YES |
| 310 | 101.715435 | 1.271265 | 21.316 0.039 | 1.434 0.248 | 2.224 0.046 | 17.144 0.024 | 16.131 0.016 | 15.420 0.017 | 13.749 0.013 | 13.150 0.011 | NO |
| 313 | 101.728048 | 1.284664 | 20.794 0.033 | 1.692 0.188 | 2.195 0.036 | 17.129 0.024 | 16.393 0.021 | 16.200 0.034 | 14.514 0.021 | 13.686 0.015 | NO |
| 644 | 101.768647 | 1.344268 | 18.882 0.008 | 1.331 0.026 | 1.844 0.010 | 16.088 0.010 | 14.724 0.005 | 13.497 0.003 | 12.051 0.004 | 11.494 0.004 | YES |
| 1873 | 101.729427 | 1.289632 | 17.665 0.038 | 16.193 0.017 | 14.837 0.010 | 12.903 0.008 | 12.270 0.006 | NO | |||
| 1972 | 101.751821 | 1.318276 | 17.810 0.076 | 16.137 0.033 | 14.167 0.013 | 13.414 0.012 | NO | ||||
| 2304 | 101.717280 | 1.315665 | 17.309 0.028 | 16.674 0.027 | 16.420 0.043 | 14.532 0.046 | 13.898 0.019 | NO | |||
| 2329 | 101.712510 | 1.313155 | 15.636 0.007 | 14.838 0.005 | 14.230 0.006 | 12.626 0.007 | 11.850 0.005 | YES | |||
| 2493 | 101.734794 | 1.342232 | 19.570 0.220 | 16.985 0.036 | 14.804 0.010 | 11.650 0.004 | 10.697 0.003 | NO | |||
| Class II sources | |||||||||||
| 1 | 101.709618 | 1.276534 | 14.674 0.008 | 0.933 0.007 | 1.438 0.004 | 11.964 0.020 | 11.506 0.029 | 11.164 0.034 | 10.678 0.002 | 10.371 0.003 | NO |
| 8 | 101.735121 | 1.277934 | 15.934 0.013 | 1.037 0.010 | 1.841 0.007 | 12.061 0.023 | 11.212 0.020 | 10.572 0.023 | 9.616 0.003 | 9.049 0.002 | YES |
| 71 | 101.705376 | 1.348143 | 15.176 0.003 | 0.660 0.003 | 0.887 0.005 | 13.715 0.026 | 13.496 0.035 | 13.283 0.033 | 12.863 0.006 | 12.379 0.007 | NO |
| 72 | 101.726013 | 1.361580 | 15.389 0.003 | 0.752 0.004 | 1.070 0.003 | 13.498 0.021 | 13.114 0.032 | 12.870 0.034 | 12.233 0.005 | 11.905 0.005 | NO |
| 97 | 101.804643 | 1.326651 | 13.103 0.005 | 0.461 0.005 | 0.878 0.004 | 11.618 0.019 | 11.209 0.020 | 10.952 0.021 | 10.420 0.002 | 10.225 0.003 | NO |
| 101 | 101.775393 | 1.354269 | 15.659 0.003 | 1.161 0.004 | 1.501 0.004 | 13.017 0.023 | 12.240 0.024 | 11.840 0.023 | 11.168 0.003 | 10.974 0.003 | NO |
| 289 | 101.748231 | 1.277375 | 20.235 0.018 | 1.594 0.123 | 2.514 0.014 | 15.275 0.005 | 14.077 0.003 | 13.078 0.002 | 12.126 0.005 | 11.645 0.005 | NO |
| 298 | 101.715135 | 1.273663 | 20.994 0.037 | 1.632 0.217 | 2.548 0.031 | 16.182 0.010 | 15.294 0.008 | 14.851 0.010 | 14.212 0.018 | 14.011 0.018 | NO |
| 307 | 101.716418 | 1.277292 | 21.022 0.034 | 1.443 0.182 | 2.505 0.030 | 16.320 0.012 | 15.423 0.009 | 14.978 0.012 | 14.387 0.020 | 14.223 0.021 | NO |
| 321 | 101.719373 | 1.292577 | 19.190 0.013 | 1.621 0.050 | 2.329 0.009 | 15.042 0.004 | 13.832 0.002 | 12.973 0.002 | 11.412 0.003 | 10.972 0.003 | NO |
| 363 | 101.759568 | 1.306980 | 21.575 0.061 | 2.862 0.046 | 15.855 0.008 | 14.678 0.005 | 13.852 0.005 | 12.626 0.006 | 12.199 0.006 | NO | |
| 364 | 101.762999 | 1.308987 | 20.603 0.056 | 2.610 0.029 | 15.653 0.007 | 14.770 0.005 | 14.308 0.007 | 13.212 0.009 | 12.714 0.008 | NO | |
4 Discussion
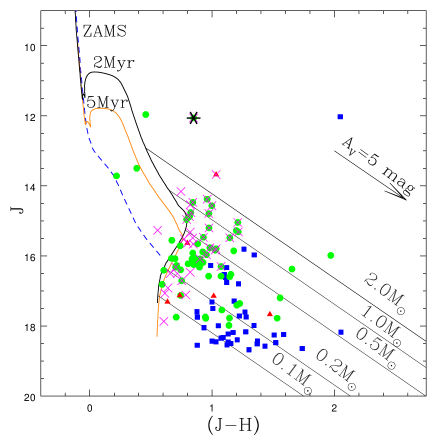
4.1 Near-IR Colour-Magnitude Diagram
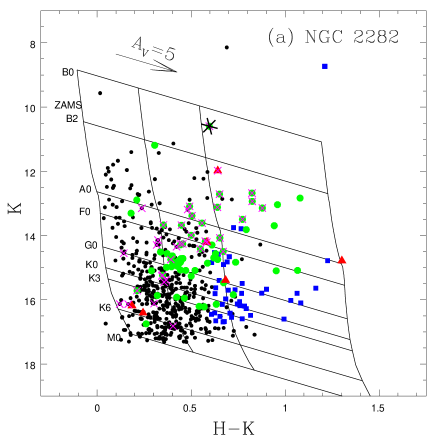
The near-IR CMD is a useful tool for understanding the nature of YSOs in the embedded star-forming regions. The near-IR CMD ( vs ) for all the stars detected towards NGC 2282 cluster is shown in Fig. 11a. The identified all sources are marked. A reference field of same area and at similar photometric depth is also shown in Fig. 11b. The nearly vertical solid lines are the loci of ZAMS reddened by visual extinction of = 0, 5, 10, 20 magnitude, respectively and corrected for cluster distance of 1.65 kpc. The slanting horizontal lines represent the reddening vectors of the corresponding spectral type made from Flaherty et al. (2007). The membership of any YSO relies on the fact that they are mainly found in the cluster area rather than in the surrounding field. We considered only those YSOs within the cluster area (radius = 3.15) to determine the cluster parameters. In the CMD given in Fig. 11a, we can see that majority of the YSOs are located within B2 to K6 spectral type. Majority of emission objects fall within B0 to F0 spectral type. A Herbig Ae/Be type star, determined as B0.5 from spectroscopic observations, falls close to B0 vector with 10 mag. This estimate matches well with the spectroscopic observations (sect. 3.2). The YSOs, determined from IR CC diagrams, share IR space with many unclassified sources marked as black dots. These might be the background sources or the weak line T Tauri sources, which are not included in our YSO survey. Spectroscopic observations are necessary for the confirmation of their membership.
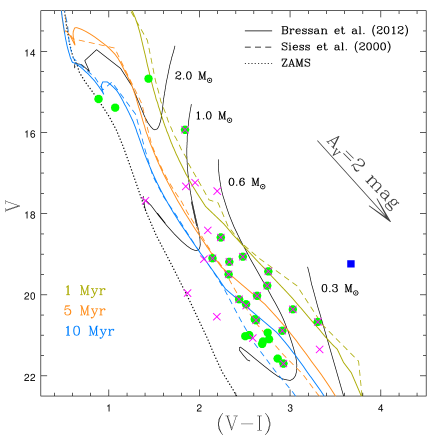
4.2 Optical Colour-Magnitude Diagram of YSOs
An Optical CMD, vs of YSOs is plotted in Fig. 12. It is an important tool to estimate the approximate ages and masses of YSOs. The solid curve in Fig. 12 represents the ZAMS, taken from Girardi et al. (2002) corrected for the cluster distance 1.65 kpc and reddening of = 0.52 mag ( = 0.65 mag) (see sect. 3.3 & 3.4). We have used the PMS isochrone and evolutionary tracks of Bressan et al.(2012) to determine the ages and masses of the YSOs. The PMS isochrones for Siess et al. (2000) is also plotted for comparison. The ages and masses of YSOs have been estimated by comparing their locations on the CMD with PMS isochrones of various ages after correcting for the distance and extinction. Since the reddening vector is nearly parallel to the isochrones, a small extinction variation would not have much effect on the age estimation of YSOs.
We have compiled photometry for the YSOs, and compare their positions on the CMD to theoretical model isochrones. The CMD positions of YSOs seem to be adequately fit between 110 Myr. Different models at low-mass end differs significantly as we can see in Fig. 12. The average age of the YSOs seem to be 2-5 Myr, which we considered as the average age of the cluster.
4.3 Mass Distribution
Since YSOs show excess emission at longer wavelengths, CM diagram is not a suitable tool to understand the mass distribution of YSOs. We used vs CM diagram to reduce the effect of excess emission. Fig. 13 shows the CM diagram for all the YSOs detected from IR colour-colour diagrams (Fig. 7, 9a, 10). The ZAMS of Giradi et al. (2002) corrected for the cluster distance of 1.65 kpc is used for comparison in Fig. 13. The PMS isochrones for 2.0 Myr and 5.0 Myr are taken from Bressan et al. (2012).
It is apparent from Fig. 13 that majority of the candidate YSOs have masses 0.12 M⊙. Few candidate YSOs (e.g. ID = 8, asterisk mark) seem to be apparently more massive and we can not determine their parameters properly as they are highly embedded. Since the low-mass end of the isochrones are very close to each other, a change of 12 Myr in age would not change the masses drastically. Thus we used a representative age of those YSOs as 2 Myr. However, such mass estimation could be associated with several errors such as presence of binary companions, circumstellar envelope, variable stars and other unknown excess emissions etc. (Samal et al. 2014).
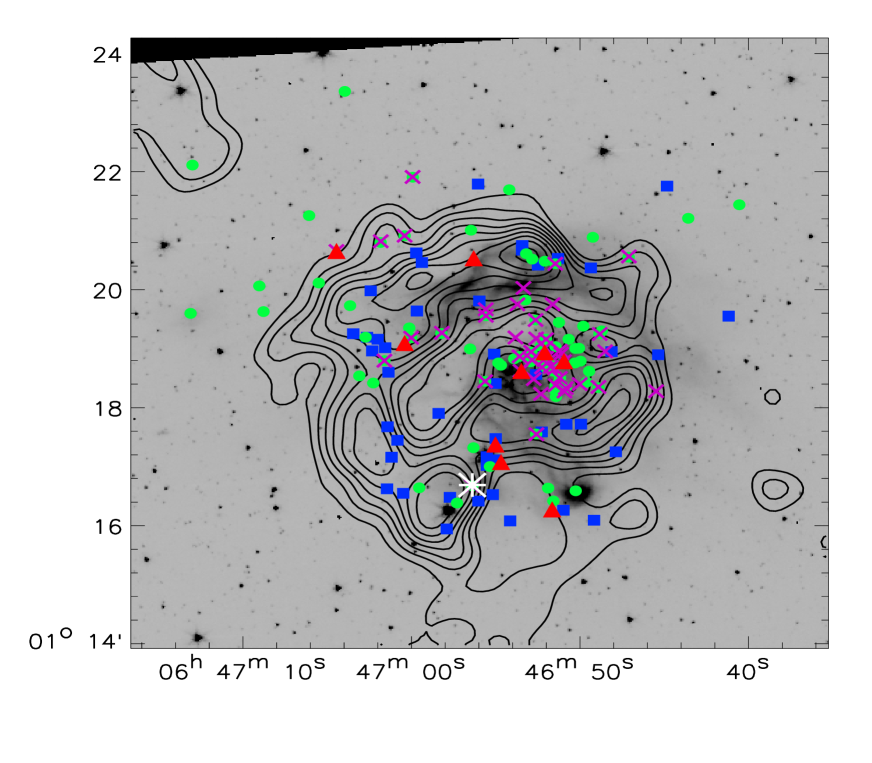
4.4 Spatial Distribution of YSOs
Spatial distribution of YSOs in the young clusters traces the star-forming history of that cloud. Fig. 14 shows the spatial distribution of the candidate YSOs within NGC 2282 (red triangles: Class I; green circles: Class II; Blue squares: candidate PMS stars and magenta crosses: emission sources) overlaid on the IRAC 3.6 m mosaic image. From Fig. 14, it is apparent that majority of YSOs are concentrated at the core region of the cluster (see sect. 3.1). Majority ( 70%) of the emitters including IR excess emitters are located in the core region, and some are scattered in the northern side of the cloud. A secondary peak is seen towards the South-Eastern part of the cluster, which harbors a Herbig B0.5 Ve star. An interesting arc is visible from East to West through North. No significant population of YSOs are seen in the Western part of the cloud. While a significant and scattered population towards North-East part of the cloud, particularly Class II, are visible. The extinction map is overplotted in Fig. 14 and it shows that majority of the YSOs are crowded mainly in the central (low extinction) areas of the region.
4.5 Disc Fraction and Age of the Cluster
YSOs are surrounded by circumstellar disc of gas and dust and the Near-IR excess emission originates from the disc (Lada & Adams 1992). The fraction of sources with excess over the entire number of sources would give an approximate age of the cluster. The disc fraction remains very high ( 80 %) at early stages ( 0.3 Myr) of the clusters and decreases with the increasing age (Haisch et al. 2001). The disc lasts for small time scale of about 315 Myr (Strom et al. 1989; Lada & Lada 1995; Haisch et al. 2001; Hillenbrand 2002; Hernández et al. 2007) and disc fraction reaches to one-half in 3 Myr time scale (Haisch et al. 2001). The NGC 2282 cluster is physically associated with molecular cloud, which indicates that the cluster has an age of 10 Myr (Leisawitz et al. 1989).
We have detected total 1050 objects from our observations within 3.15 arcmin of the cluster radius. While in similar depth of observations and area on reference field, we have detected 856 stars. After removing the field star contribution, the number of objects associated the cluster area would be 203. The number of candidate YSOs from , , 3.6, 4.5 m data is 72 in the cluster area, while from , , data the number is 40. All disc bearing Hα stars are detected as the IR excesses sources. Hence, the total number of IR excess sources within NGC 2282 is 112. Thus we estimated the disc fraction of NGC 2282 as 58% 6%. If we consider the IR excess sources from mid-IR data only, the disc fraction is 37% 5%. This disc fraction estimated in NGC 2282 is significantly larger than that of Horner et al. (1997). This is mainly because the detection limit of current study is much deeper than the former one. From disc-fraction, the age of the cluster could be in the range 25 Myr, which is in agreement with the CMD analysis.
5 Summary and Conclusions
In this paper, we have presented multiwavelength studies of a young cluster NGC 2282 in Monoceros constellation, using deep optical observations complimented with the archival data sets from IPHAS, UKIDSS, 2MASS and mid-IR data from Spitzer 3.6 and 4.5 m. We have also used the spectroscopy observations of 8 bright sources in the cluster region. The main results are summarized as follows:
-
1.
We have analysed the stellar surface density distribution of -band data using nearest neighborhood technique. The radius of the cluster has been estimated to be 3.15 from the semi-major axis of the outer most elliptical contour.
-
2.
We have estimated the spectral types and membership status of 8 bright sources located inside the cluster area using conspicuous lines and comparison of equivalent widths. We have identified three early B-type members in the cluster. Among these B-type massive members, HD 289120, a B2V type star was classified earlier, and two stars ( a Herbig Ae/Be star and a B5 V ) are classified for the first time in this work. We have estimated the distance to the cluster as 1.65 kpc from spectrophotometric analysis of those massive members.
-
3.
The -band extinction map is estimated from colours using nearest neighborhood technique, and the mean extinction within the cluster area is found to be 3.9 mag. The extinction within the cluster region seem to be non-uniform.
-
4.
From slitless spectroscopy, we have identified 16 emission line stars. Another 34 emission line stars are identified from IPHAS data, totaling 50 emission line stars towards the region.
-
5.
Using Gutermuth et al. (2008; 2009) scheme, we have classified 9 Class I and 75 Class II objects from mid-IR data. Other candidate YSOs are identified from near-IR CC diagram. We have identified 152 candidate YSOs from IR excess and emission towards the region.
-
6.
We characterized these YSOs from various colour-magnitude diagrams. From CMD, we have estimated the cluster age which is in the range of 25 Myr. From mid-IR data, we have estimated the disc fraction of 58%, which corresponds to an age of 2-5 Myr. The masses of the candidate YSOs are found to be in the range 0.1 to 2.0 M⊙ in the CMD.
-
7.
The morphology of the region has been studied from spatial distribution of YSOs, stellar density distribution, signature of dust in various optical-infrared images along with the extinction map.
Acknowledgments
We thank the anonymous referee for valuable comments which further improved the quality of the paper. This research work is financially supported by S N Bose National Centre for Basic Sciences under Department of Science and Technology, Govt. of India. This publication makes use of data from The UKIRT Infrared Deep Sky Survey or UKIDSS which is a next generation near-infrared sky survey using the wide field camera (WFCAM) on the United Kingdom Infrared Telescope on Mauna Kea in Hawaii. We also use data from Two-micron All-Sky Survey (2MASS), which is a joint project of the University of Massachusetts and Infrared Processing and Analysis Center/California Institute of Technology, funded by National Aeronautics and Space Administration and the National Science Foundation. This paper uses data observations made with the Spitzer Space Telescope, which is operated by the Jet Propulsion Laboratory, California Institute of Technology, under contract with NASA. The authors are thankful to the HTAC members and staff of HCT, operated by Indian Institute of Astrophysics (Bangalore); JTAC members and staff of 1.04m Sampurnanand telescope operated by Aryabhatta Research Institute of Observational Sciences ( Nainital).
References
- AllenLE (2004) Allen L. E., Calvet, N., D’Alessio, P., Merin, B., Hartmann, L., Megeath, S. T., Gutermuth, R. A., Muzerolle, J., Pipher, J. L., Myers, P. C., Fazio, G. G., 2004, ApJS, 154, 363
- AllenLE (1995) Allen L. E., Storm K. M. 1995, AJ, 109, 3
- AllenTS (1995) Allen T. S. et al. 2008, ApJ, 675, 491
- Alexander (2013) Alexander, M. J., Kobulnicky, H. A., Kerton, C. R., & Arvidsson, K., 2013, ApJ, 770, 1
- Avedisova (1984) Avedisova, V. S., & Kondratenko, G. I., 1984, Nauchnye Informasii, 56, 59
- Barentsen (2011) Barentsen et al. 2011, MNRAS, 415, 103
- Barentsen (2014) Barentsen et al. 2014, MNRAS, 444, 3257
- Bessell (1988) Bessell M. & Brett J. M., 1988, PASP, 100, 1860
- Blitz (1982) Blitz, L., Fich, M., & Stark, A. A. 1982, ApJS, 49, 183
- Bressan (2012) Bressan A., Marigo P., Girardi L., Bernado S., Cero C. D., Rubele S. & Nanni A., 2012, MNRAS, 427, 127
- Briceno (2002) Briceno, C., Luhman, K. L., Hartmann, L., Stauffer, J. R., & Kirkpatrick, J. D., 2002, ApJ, 580, 317
- Carpenter (2001) Carpenter J. M., 2001, AJ, 121, 2851
- Casertano (1985) Casertano, S. & Hut, P., 1985, ApJ, 298, 80
- Chini (1984) Chini, R., Mezger, P. G., Kreyna, E., & Gemnd, H. P., 1984, A&A, 135, L14
- Cohen (1981) Cohen J. G., Frogel J. A., Persson S. E., Ellias J. H., 1981, ApJ, 249, 481
- Corradi (2008) Corradi et al. 2008, A&A 480, 409
- Cutri (2003) Cutri R. M., et al., 2003, The IRSA 2MASS All Sky Point Source Catalog, NASA/IPAC Infrared Science Archive, http://irsa.ipac.caltech.edu/applications/Gator
- Dahm (2005) Dahm S., 2005, AJ, 130, 1805
- Drew (2005) Drew et al. 2005, MNRAS, 362, 753
- Elias (1982) Elias et al. 1982, AJ, 87, 1029
- Evans (2009) Evans, II, N. J., Dunham, M. M., Jørgensen, J. K., et al. 2009, ApJS, 181, 321
- Flaherty (2007) Flaherty K. M., Pipher J. L., Megeath S. T., Winston E. M., Gutermuth R. A., Muzerolle J., Allen L. E., Fazio G. G., 2007, ApJ, 663, 1069
- Girardi (2002) Girardi., Bertelli G., Chiosi C., Groenewegen M. A. T., Marigo P., Salasnich B., Weiss A., 2002, A&A, 391, 195
- González (2005) González-Solares E. A. et al. 2008, MNRAS, 388,89
- Gutermuth (2005) Gutermuth R. A., Megeath S. T., Pipher J. L., Williams J. P., Allen L. E., Myers P. C., Raines S. N. 2005, ApJ, 632, 397
- Gutermuth (2008) Gutermuth R. A., Myers P. C., Megeath S. T., Allen L. E., Pipher J. L., Muzerolle J., Porras A., Winston E., Fazio G., 2008, ApJ, 674, 307
- Gutermuth (2009) Gutermuth R. A., Megeath S. T., Myers P. C., Allen L. E., Pipher J. L., Fazio G. G., 2009, ApJs, 184, 18
- Haisch (2001) Haisch, K. E. Jr., Lada, E. A. & Lada, C. J., 2001, ApJ, 553, L153
- Hernández (2007) Hernández, J., Hartmann, L.,Megeath, T., et al. 2007, ApJ, 662, 1067
- Herczeg (2014) Herczeg, G. J., & Hillenbrand, L. A., 2014, ApJ, 786, 97
- Hillenbrand (1997) Hillenbrand, L. A. 1997, AJ, 113, 1733
- Hillenbrand (2002) Hillenbrand, L. A. 2002, arXiv: astro-ph/0210520
- Horner (1997) Horner D. J., Lada E. A., Lada C. J., 1997, AJ, 113, 5
- Jacoby (1984) Jacoby G. H., Hunter D. A., Christian C. A., 1984, ApJS, 56, 257
- Jose (2012) Jose J., Pandey A. K., Ogura K., Samal. M. R., Ojha D. K., Bhatt B. C., Chauhan N., Eswaraiah C., Mito H., Kobayashi N., Yadav R. K., 2012, MNRAS, 424, 2486
- Jose (2013) Jose J., Pandey A. K., Samal M. R., Ojha D. K., Ogura K., Kim J. S., Kobayashi N., Goyal A., Chauhan N., Eswaraiah C., 2013, MNRAS, 432, 3445
- Kenyon (1995) Kenyon S., & Hartman 1995, ApJS, 101, 117
- Kislyakov (1995) Kislyakov, A. G., & Turner B. E. 1995, AZh, 72, 168
- Koorneef (1983) Koorneef J., 1983, A&A, 128, 84
- Kunter (1980) Kutner, M. L., Machnik, D. E., Tucker, K. D., & Dickman, R. L., 1980, ApJ, 237, 734
- Lada & Adams (1992) Lada C. J., Adams F. C., 1992, ApJ, 393, 278
- Lada & Lada (1995) Lada, E. A., & Lada, C. J., 1995, AJ, 109, 1682
- Lada & Lada (2003) Lada C. J., & Lada E. A., 2003, ARA&A, 41, 57
- Lada (1994) Lada C. J., & Lada E. A., Cliemens D. P., Bally J., 1994, ApJ 429, 694
- Lada (2010) Lada C. J., Lombardi M., Alves J. F., 2010, ApJ, 724, 687
- Lada (1991) Lada C. J., Evans, N. J., Depoy, D. L., & Gatley, I., 1991, ApJ, 371, 171
- Landolt (1992) Landolt A. U., 1992. AJ, 104, 340
- Leisawitz (1989) Leisawitz D., Bash F. N. & Thaddeus P., 1989, ApJS, 70, 731
- Lundquist (2014) Lundquist M. J., Kobulnicky H. A., Alexander M. J., Kerton C. R., Arvidsson K., 2014, ApJ, 784, 111
- Lawrence (2007) Lawrence et al. 2007; MNRAS, 379, 1599
- Lucas (2008) Lucas et al. 2008, MNRAS, 391, 136
- Luhman (2004) Luhman, K. L., Peterson, D. E., Megeath, S. T., 2004, ApJ, 617, 565
- Meyer (1997) Meyer M., Calvet N., Hillenbrand L. A., 1997, AJ, 114, 288
- Megeath (2004) Megeath, S. T., Gutermuth, R. A., Allen, L. E., Pipher, J. L., Myers, P. C., & Fazio, G. G., 2004, ApJS, 154, 367
- Ojha (2004) Ojha D. K. et al., 2004, ApJ, 608, 797
- Oke (1990) Oke J. B. 1990, AJ, 99, 5
- Pecaut (2004) Pecaut M. J. & Mamajek, E. E., 2013, ApJS, 208, 9
- Persi (1994) Persi, P., Roth, M., Tapia, M., Ferrari-Toniolo M., & Marenzi, A. R., 1994, A&A, 282, 474
- Petrossian (1985) Petrossian, V. M., 1985, ATR, 22, 423
- Prabhu (2014) Prabhu T.P. 2014, Proc. of Ind. Nat. Sc. Acad., 80, 887
- Rebull (2010) Rebull, L. M., Padgett, D. L., McCabe, C.-E., et al. 2010, ApJS, 186, 259
- Racine (1968) Racine, R., 1968, AJ, 73, 233
- Rice (2012) Rice, T., Wolk, S., Aspin, C., 2012, ApJ, 755, 65
- sagar (1999) Sagar, R., “Some new initiatives in optical astronomy at UPSO, Nainital”, 1999, in Current Science, 77, 643-652
- Samal (2015) Samal M. R., Ojha D. K., Jose J., Zavagno A., Takahashi S., Niechel B., Kim J. S., Chauhan N., Pandey A. K., Zinchenko I., Tamura M., Ghosh S. K., 2015, A&A, 581, 5S
- Samal (2014) Samal M. R., Zavagno A., Deharveng L., Molinari S., Ojha D. K., Paradis D., Tigé J., Pandey A. K., Russeil D., 2014, A&A 566, A122
- Schmidt-kaler (1982) Schmidt-Kaler Th., 1982, in Schaifers K., Voigt H. H., Landolt H., eds, Landolt-Bornstein, Vol. 2b, Springer, Berlin, p. 19
- Stetson (1987) Stetson, P. B., 1987, PASP, 99, 191
- Stetson (1992) Stetson, P. B., 1992, in Astronomical Society of the Pacific Conference Series, Vol. 25, Astronomical Data Analysis
- Strom (1989) Strom, K. M., Strom, S. E., Edwards, S., Cabrit S., Skrutskie, M. F., 1989, AJ, 97, 1451
- Tapia (1997) Tapia, M., Persi, P., Bohigas, J., & Ferrari-Toniolo, M., 1997, AJ, 113, 1769
- Torres-Dodgen (1993) Torres-Dodgen A. V., Weaver W. B., 1993, PASP, 105, 693
- Van (1966) Van der Berg, S., 1966, AJ, 71, 990
- Wachmann (1996) Wachmann A. A., 1996, Astr. Abh. Stern. Hamburg-Bergedorf, 7, 341
- Walborn (1990) Walborn N. R., Fitzpatrick E. L., 1990, PASP, 102, 379