A fully cosmological model of a Monoceros-like ring
Abstract
We study the vertical structure of a stellar disk obtained from a fully cosmological high-resolution hydrodynamical simulation of the formation of a Milky Way-like galaxy. At the present day, the disk’s mean vertical height shows a well-defined and strong pattern, with amplitudes as large as 3 kpc in its outer regions. This pattern is the result of a satellite – host halo – disk interaction and reproduces, qualitatively, many of the observable properties of the Monoceros Ring. In particular we find disk material at the distance of Monoceros ( 12–16 kpc, galactocentric) extending far above the mid plane ( 30∘, 1–2 kpc) in both hemispheres, as well as well-defined arcs of disk material at heliocentric distances kpc. The pattern was first excited Gyr ago as an mode that later winds up into a leading spiral pattern. Interestingly, the main driver behind this perturbation is a low-mass low-velocity fly-by encounter. The satellite has total mass, pericentre distance and pericentric velocity of of the host, kpc, and 215 km/s, respectively. The satellite is not massive enough to directly perturb the galactic disk but we show that the density field of the host dark matter halo responds to this interaction resulting in a strong amplification of the perturbative effects. This subsequently causes the onset and development of the Monoceros-like feature.
keywords:
chaos: galaxies – galaxies: dynamics – methods: –body simulations1 Introduction
Several recent studies based on different astrometric catalogues have revealed a complex vertical structure in the Galactic disk. These results have accumulated evidence in favor of an asymmetry about the Galactic mid-plane. The first of this series of studies was presented by Widrow et al. (2012). Using a sample of 11,000 main sequence stars from the Sloan Extension for Galactic Understanding and Exploration (SEGUE) survey, they showed that the Solar Neighborhood has a north-south asymmetry in both the number count and the mean vertical velocity distribution of stars. The study shows a 10 per cent number count deficit (excess), i.e. (north south)/(north south), at pc ( pc) from the Galactic mid-plane and a vertical velocity gradient of 3–5 km s-1 kpc-1. While the asymmetry in the vertical velocity suggests a breathing mode, i.e., rarefaction and compression of the Galactic disk, the stellar number counts clearly suggest a bending mode, i.e., a local displacements of the disk from the midplane. These results were later supported by Yanny & Gardner (2013), who carefully characterized the effects that uncertainties and potential biases in the data set could have on the discovery of vertical perturbations. In the following year, the presence of bulk vertical motions in the disk was confirmed by studies based on the Radial Velocity Experiment (RAVE) and the LAMOST/LEGUE survey (Carlin et al., 2013; Williams et al., 2013). Williams et al. (2013) mapped out bulk motions as a function of Galactocentric radius and found evidence for compressional motion outside the solar circle and rarefaction inside. The observed peak vertical bulk velocities are as large as 15 km s-1.
The presence of a bending mode has also been supported by several studies. Using a sample of main sequence turn-off stars provided by Pan-STARRS1 (Kaiser et al., 2010), Slater et al. (2014, hereafter S14) mapped the stellar distribution at galactic latitudes , up to heliocentric distances of kpc. Their study revealed a much more complex morphology of the Monoceros (Mon) Ring than previously known. As discussed by S14, the Mon ring was originally identified as an overdensity of stars at kpc from the Sun, spanning Galactic latitudes from to the edge of the Sloan Digital Sky Survey (SDSS) footprint at and in Galactic longitude extending between and (Newberg et al., 2002; Rocha-Pinto et al., 2003; Yanny et al., 2003; Belokurov et al., 2006). S14 showed that this structure, which can be observed in both the North and South Galactic hemispheres, exhibits stream-like features and sharp edges. More importantly, they saw a North-South asymmetry, with the southern and northern parts dominating the regions closer and further from the Sun, respectively.
More recently, Xu et al. (2015) showed that the SDSS number counts of main-sequence stars at Galactic latitudes exhibit a clear and radially extended oscillatory behaviour. This corresponds to variations of the stellar density asymmetry whose amplitude increases as a function of distance from the Sun, in the direction of the Galactic anticenter. In particular, they identified four “substructures” that represent the locations of peaks in the oscillations of the disk midplane. These four peaks are located at an approximate distance of 10.5 kpc (north), 13 kpc (south), 16.5 kpc (north) and 21 kpc (south) from the Galactic center. The last two peaks correspond to the Mon ring and Triangulum-Andromeda (TriAnd) cloud (Rocha-Pinto et al., 2004; Majewski et al., 2004), respectively. This interpretation of the data was supported by Price-Whelan et al. (2015), who studied the number ratio of RR Lyrae to M giant stars, , associated with the TriAnd and TriAnd2 clouds (Martin, Ibata & Irwin, 2007). They find that these two ring-like over-densities, the latter located at kpc, have stellar populations quite unlike any of the known satellites of the Milky Way and more similar to stars born in the much deeper potential of the Galactic disk.
Given the wealth of observations suggesting an asymmetric disk vertical structure it is interesting to explore possible formation scenarios and to identify the main physical mechanisms driving these oscillations. Naively one would expect vertical modes to be excited by external perturbations. However, a series of recent studies have shown that breathing modes can arise as a result of the interaction between disk stars and the bar (Monari, Famaey & Siebert, 2015) or spiral arms (Faure, Siebert & Famaey, 2014; Debattista, 2014). Even though these perturbations are likely to be taking place in the Galactic disk, they cannot however account for the observed bending modes. In contrast, Widrow et al. (2014) (see also Widrow & Bonner, 2015) showed that a satellite galaxy plunging through the mid-plane of the disk can simultaneously excite both types of mode. The relative strength of these modes depends strongly, among other factors, on the vertical velocity of the passing satellite in comparison to that of the disk’s stars.
Several numerical models have been studied in the past to understand the effects that a satellite-disk interaction can have on the vertical structure of the disk (e.g., Quinn, Hernquist & Fullagar, 1993; Velazquez & White, 1999; Villalobos & Helmi, 2008; Kazantzidis et al., 2009; Kim et al., 2014; Feldmann & Spolyar, 2015). Purcell et al. (2011) presented a set of simulations of the interaction between the Milky Way disk and the Sagittarius dwarf spheroidal (Sgr). Their study showed that such interaction can qualitatively reproduce many of the morphological features observed in the Galactic disk, including a Mon ring-like feature. Gómez et al. (2013, hereafter G13) re-analyzed these simulations and showed that they can also reproduce the observed local North-South asymmetry, as well as perturbations in the in-plane velocity field observed on a sample of SEGUE F/G dwarf stars (Gómez et al., 2012). In these simulations, the local north-south asymmetry is a manifestation of a global oscillating mode perturbing the disk located at galactocentric distances kpc. Price-Whelan et al. (2015) re-ran these simulations with higher numerical resolution to better sample the outer galactic regions. They find that rings of offset material with respect to the mid-plane of the disk can be found at distances as large as 30 kpc, reminiscent of the TriAnd clouds. Despite this success, these simulations fail to deposit enough disk material at the observed galactocentric heights, especially in the outer regions.
Vertical perturbations in a galactic disk can also arise from the disk-host dark halo interaction (see Sellwood, 2013, for a recent review). Either a misaligned DM halo (with respect to the disk) or the late time accretion of material can provide enough torque to form strong warps (e.g. Debattista & Sellwood, 1999; Jiang & Binney, 1999; Shen & Sellwood, 2006; DeBuhr, Ma & White, 2012; Aumer & White, 2013; Yurin & Springel, 2014). In addition, as shown by Vesperini & Weinberg (2000), even an encounter with a low-mass, low-velocity fly-by that penetrates the outer regions of a galaxy can generate asymmetric features in the host DM halo density field. These density perturbations can be efficiently transmitted to the inner parts of the primary system and subsequently perturb an embedded galactic disk. Such perturbations can induce the formation of vertical patterns (e.g. Weinberg, 1998).
In this work we study the vertical structure of a Milky Way-like galaxy formed in fully cosmological hydrodynamical simulation. The simulated disk analyzed here is obtained from the highest numerical resolution simulation of the suite presented by Marinacci, Pakmor & Springel (2014, hereafter M14). As discussed by M14, this system is one of the best Milky Way-look alikes among the suite. It is strongly disk–dominated with a realistic rotation curve, a surface density profile close to exponential, and both an age distribution and a size that are consistent with expectations from large galaxy surveys in the local Universe. In Section 2 we briefly review the main properties of the simulation. We characterize the time evolution of the disk’s vertical structure in Section 3 and show that, at the present day, it shows a strong and well defined vertical pattern that matches many of the observational properties of the Mon ring. In Section 4 we identify and characterize the main driving source of this vertical perturbation. We summarize and discuss our results in Section 5.
2 The Simulations
In this work we analyze a cosmological hydrodynamical simulation of the formation of a Milky Way-like galaxy. In what follows we briefly summarize the methodology and the main characteristics of this simulation.
Our work focuses on one of the Milky Way-like galaxies first introduced in M14. Following previously adopted nomenclature, we will refer to this galaxy as Aq-C-4. The simulations were run adopting a CDM cosmology with parameters , , , , , and Hubble constant km s-1 Mpc-1 = 73 km s-1 Mpc-1. The halo was first identified in a lower resolution version of the Millennium-II Simulation (Boylan-Kolchin et al., 2009) which was carried out within a periodic box of side 125 Mpc. Applying the “zoom-in” technique, the galaxy was simulated multiple times at different resolutions, increasing in each step the mass-resolution by a factor of 8. After setting up the initial dark matter distribution, gas was added by splitting each dark matter particle into a dark matter particle and gas cell pair. The masses assigned to each are determined from the cosmological baryon mass fraction. The dark matter particle and gas cell in each pair are separated by a distance equal to half the mean inter-particle spacing. Their phase-space coordinates are chosen such that the centre of mass and velocity of the pair is the same as the original dark matter particle.
The simulations were carried out using the moving-mesh code AREPO (Springel, 2010). AREPO solves the gravitational and collisionless dynamics by using a TreePM approach (Springel, 2005). To follow the evolution of the gas component this code solves the Euler equations on an unstructured Voronoi mesh by adopting a finite-volume discretization. The main advantage of AREPO is that the set of points generating its unstructured Voronoi mesh are allowed to move freely, thus inducing a transformation of the mesh that adapts itself to the characteristics of the flow. For more details about this method, see Springel (2010) and Vogelsberger et al. (2012).
The simulations include treatments for the critical physical processes that govern galaxy formation, such as gravity, gas cooling/heating, star formation, mass return and metal enrichment from stellar evolution, and feedback from stars and supermassive black holes. The parameters that regulate the efficiency of each process have been selected by contrasting the results obtained from cosmological simulations to the corresponding observational quantities (Vogelsberger et al., 2013, M14). The resulting fiducial settings produce a good match to the stellar mass to halo mass function, the galaxy luminosity functions, the history of the cosmic star formation rate density and several other important observables.
As discussed by M14, Aq-C-4 is one the most similar to the Milky Way among the models analyzed in their work. It has a flat rotation curve that peaks at km s-1 at kpc. A decomposition of the stellar surface density profile into an exponential disk and a Sérsic profile yields a disk scale length and a bulge effective radius of approximately 3.1 and 0.8 kpc, respectively. The decomposition results in a disk-to-total mass ratio, D/T . A more robust determination of D/T based on a kinematic decomposition using all star particles within yields a value of 0.67. Both results indicate the presence of a dominant disk. The resulting galaxy falls well within the observed size-luminosity relation in the B band and matches the Tully-Fisher relation. Also it exhibits a present day gas fraction in reasonable agreement with the Milky Way. Behind this well characterized disk lies a quiet formation history with no significant perturbations to its steady slow growth since . Interestingly, the latest external perturbation experienced by this stellar disk takes place close to , approximately 2.7 Gyr ago. As we will show later in Section 4, a fly-by encounter with a satellite causes the vertical pattern observed in the disk at the present day. The main properties of this model at the present day are summarized in Table 1
Throughout this paper, unless otherwise stated, we define a disk particle to be any star particle that i) shares the same sense of rotation as the overall disk, as determined by the sign of the -component of its angular momentum, ii) has a vertical velocity and iii) is located at kpc. These very simple selection criteria serve to significantly suppress contamination from the accreted component of the stellar halo. Tests performed with stronger selection criteria showed no significant differences in our results. Furthermore, as previously mentioned, this galaxy is strongly disk dominated. Thus, contamination from the spheroidal component is minimal.
| Run | ||||||||||
| Aq-C-4 | 234.4 | 8.39 | 5.31 | 145.71 | 1.53 | 1.63 | 5.4 | 0.51 | 2.70 | 340 |
3 Galactic disk’s vertical structure
In order to characterize the present day disk’s vertical structure, we have carefully aligned the disk with the X–Y plane. This is done by iteratively computing, and aligning with the Z-direction, the total angular momentum of the star particles located within 5 kpc radius cylinders of decreasing height. The star particles considered for this procedure have been chosen to have ages Gyr. In this way we i) take into account only the coldest component of the stellar disk and ii) we minimize contamination from the spheroidal (older) stellar component.
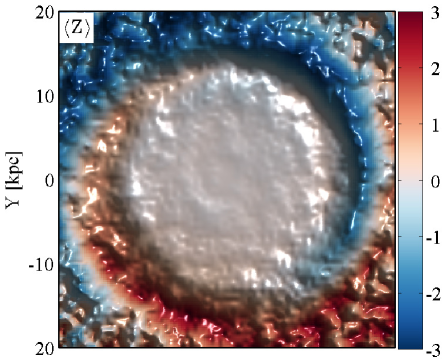
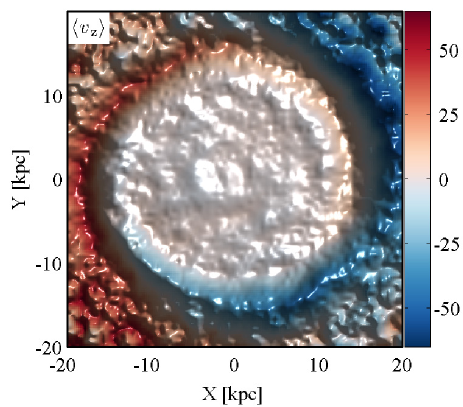
Following G13, to obtain a map of the mass-weighted mean height, , we grid the disk with a regular Cartesian mesh of bin size = 0.5 kpc aligned with the X-Y plane. On each grid node we centre a 1 kpc radius cylinder of 10 kpc height and compute the mass-weighted . The top panel of Figure 1 shows such a map out to kpc. The outer galactic disk shows a strong and well-defined vertical pattern that becomes noticeable at kpc. The inner galactic regions appear unperturbed. Rather than a set of perfect concentric rings, the vertical pattern shows a spiral morphology that winds into the inner regions with its amplitude gradually decreasing. Note as well, the antisymmetric shape of the vertical pattern about the galactic centre. The bottom panel of Figure 1 shows a map of the mass-weighted mean vertical velocity of the galactic disk, . The vertical pattern is also very clear in the map. The amplitude of this perturbation is very large, especially in the outer region of the disk, where km/s. There is a significant anti-correlation with respect to the map. This can be more clearly seen in Figure 2, where we show (red lines) and (green lines) as a function of galactocentric radius along two pairs of diametrically opposed galactic longitudes. In this figure we observe a near-antisymmetric behaviour along these diametrically opposed lines in both and . This figure also shows a very clear oscillatory behaviour. At galactocentric radii where is extremal, km/s, whereas when is extremal, kpc.


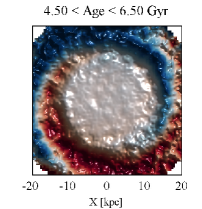
In Figure 3 we show the time evolution of the vertical disk structure over a period of Gyr. The onset of the perturbation is at a lookback time Gyr (see e.g. top second panel). The pattern is long-lived and coherent after this time. The vertical perturbation initially has the morphology expected for a typical () warp. As time goes by, the pattern slowly winds up to give rise to the spiral shape observed at the present day.
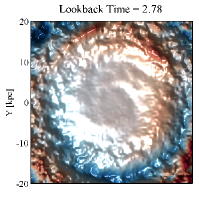

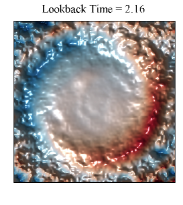
It is interesting to notice the small azimuthal displacement of the vertical pattern between consecutive snapshots. First of all, note that at kpc, the radius at which the vertical pattern becomes noticeable, the azimuthal period of a star particle on a perfect circular orbit is Gyr. Here is the circular frequency at the given . This period coincides almost perfectly with the time between consecutive snapshots, Gyr. Thus, the small azimuthal evolution of the pattern indicates similar values for the star particle’s angular and vertical frequencies in the outer regions of the disk. For example, assuming a spherical dark matter halo, in the disk’s outer regions where its mass can be regarded as negligible, the circular, , and vertical, , frequencies are expected to be equal (Binney & Tremaine, 2008). In a more general flattened potential, . To estimate a star particle’s vertical period, let us assume locally a uniform density disk. In such a case, it can be shown that , where is the total local density. At kpc we find Gyr, a very similar value to , as expected. For kpc we find .
In spite of these similar angular and vertical frequencies, it is clear from Figure 3 that the initial pattern winds up significantly over a period of Gyr. In agreement with the empirically derived rules of Briggs (1990), an initial warp gets distorted into a leading spiral pattern. The reason for this has been explained in great detail by Shen & Sellwood (2006, hereafter, SS06). In this work, an initially relaxed disk is subjected to the torque of a massive outer torus, introduced to emulate the effect of a misaligned outer DM halo. The resulting torque causes the disk to precess retrograde at a rate that is proportional to galactocentric distance, i.e. . Because of the disk’s self-gravity the inner disk, which is strongly cohesive, precesses slowly as a whole in a retrograde manner about the symmetry axis of the torus, while the outer disk precesses more rapidly generating a warp. The developing misalignment between the inner and outer disk causes the particles in the outer disk to feel an additional torque from the massive inner disk. SS06 showed that the inner disk’s torque also causes the outer disk to precess retrograde. However, it does so at a rate that decreases with galactocentric distance, i.e. . In isolation (i.e., neglecting the torque from the massive outer torus), the precession rate associated with the inner disk’s torque would induce the formation of a leading spiral pattern. Thus, the orientation of the resulting spiral pattern (leading or trailing) depends on the relative magnitudes of the two torques111A trailing spiral pattern is obtained if the torque from the massive outer torus dominates over that from the inner disk.. In our simulation the pattern rapidly starts to wind up into a leading spiral. This indicates that the torque induced by the inner disk starts to dominate right after the pattern has been excited. We will show that this is indeed the case in Section 4.3.
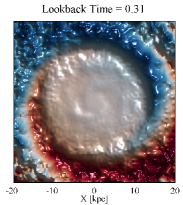
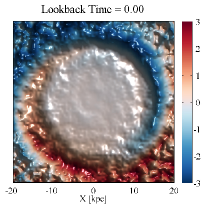
The maps reveal that, at the present day, the vertical pattern spans a very large range in galactic longitude. (see Figure 1). For example, the arm above the mid-plane covers in galactic longitude, which is reminiscent of the Mon ring. We further explore this in Figure 4, where we show maps of star particle counts in Galactic coordinates centred on the galactic anticenter. For this analysis we have selected star particles with ages younger than 5 Gyr. This allows us to avoid significant contamination from the stellar halo and the bulge. In addition, as we will show later in Section 4.2, the vertical pattern is significantly better defined on this population of star particles. We chose the Sun’s location at kpc. This particular choice is arbitrary and serves to enhance the similarities between our models and the observed morphology of the Mon ring. We divide the star particles into three three heliocentric distance bins in order to emulate the distance ranges covered by the three magnitude slices considered by S14:
-
•
Near – kpc
-
•
Mid – kpc
-
•
Far – kpc
Note that, to emulate the distance smearing due to the magnitude spread of the MSTO stars, we allow the distance cuts to overlap slightly. Many similarities between our mock data set and the Mon ring, as presented in Figure 4 of S14, are found. First and foremost, material from the galactic disk can be found at galactic latitudes as large as in both the north and the south. This is true even for the far slice, revealing that the disk has been perturbed to very large heights in its outer parts. Clear arcs of stellar material are visible at various galactic longitudes, especially in the central range. These feature are reminiscent of the arcs seen in Figure 3 of S14 (features A, B and C). The arcs are also noticeable at the farthest distances, particularly on the north side of the disk. While in the near range the perturbed disk is dominated by material in the south, the north side of the disk becomes more prominent in the middle range, with the same general morphology as nearby. Most of these similarities are not reproduced by previous simulations that attempted to model the Mon ring either as tidal debris from a disrupting satellite or as a vertically perturbed pre-existing galactic disk (e.g., S14).
4 The perturber and its perturbations
In the previous section we have shown that our fully cosmological model of a Milky Way-like disk shows a well defined and strong vertical pattern that can reproduce many of the features associated with the Mon ring. In this Section we explore which agents are responsible for the excitation of this vertical pattern.
As previously discussed in Section 1, vertical bulk motions on a disk can arise as a result of the global stellar response to spiral structure or a bar (Faure, Siebert & Famaey, 2014; Debattista, 2014; Monari, Famaey & Siebert, 2015). The vertical motions induced by such mechanisms are compressive (towards the mid-plane) and rarefactive (away from the mid-plane). As a consequence, these perturbations, known as breathing modes, cannot explain the vertical oscillation of the disk’s midplane either in the Milky Way or in our simulation. (Widrow et al., 2012; Yanny & Gardner, 2013; Xu et al., 2015; Price-Whelan et al., 2015).
This oscillatory behavior, usually described as a bending mode, is likely to be excited by some external perturbation, such as a misaligned outer DM halo or the accretion of cold gas or infalling satellites (e.g. Ostriker & Binney, 1989; Quinn, Hernquist & Fullagar, 1993; Debattista & Sellwood, 1999; Jiang & Binney, 1999; Velazquez & White, 1999; Shen & Sellwood, 2006; DeBuhr, Ma & White, 2012). Note that satellites passing through the plane of the disk can excite both bending and breathing modes (Widrow et al., 2014). Which modes dominate in such a scenario depends strongly on the relative velocity of the satellite with respect to the galactic disk.

4.1 A putative perturbing satellite
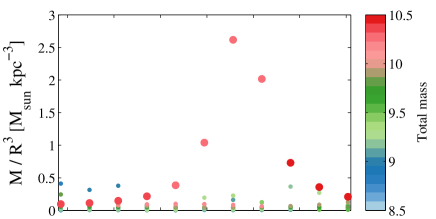
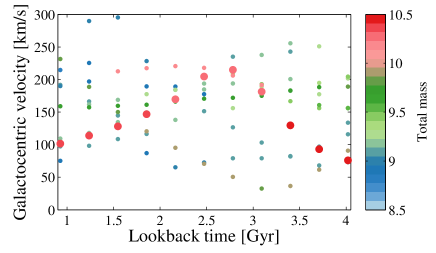
We start by exploring which satellite might induce such a bending mode in our Milky Way-like disk. In the top panel of Figure 5 we show the time evolution of the tidal force exerted on the host by the 20 most massive satellites as a function of time. Points are colour coded according to the mass of each satellite at the corresponding time. Motivated by Figure 3, where we identify the onset of the perturbation as Gyr, we focus our analysis on the time period Gyr. It is evident from this top panel that there is only one plausible perturber interacting with the disk at . This satellite has a total mass at infall and pericentre radius of kpc. This is shown in the middle panel of Figure 5, where we plot the simulated galactocentric distance of each satellite at different times. The pericentre passage takes place at Gyr. The other massive satellites during this 3 Gyr time span are either too low-mass () or have pericentre passages at distances larger or similar to that of our candidate. The bottom panel of Figure 5 shows the time evolution of the galactocentric velocity of the same satellite subset. The velocity at pericentre of the perturbing satellite is km s-1.
Note that the configuration of this disk-satellite interaction differs significantly from those considered in previous studies, where the satellites repeatedly plunge through the galactic plane. In fact, it is very unlikely that this satellite’s tidal field alone could account for the observed strong vertical pattern (see Section 4.3). Instead, this interaction can be described as a low-velocity fly-by that crosses the plane of the disk at a relatively large galactocentric distance. Interestingly, as discussed in detail by Vesperini & Weinberg (2000), a low-mass, low-velocity fly-by that penetrates the outer regions of a galaxy can generate asymmetric features in the host DM halo density field. These perturbations can be efficiently transmitted to the inner parts of the primary system affecting the deeply embedded galactic disk. Furthermore, the excited modes are expected to be weakly damped, thus persisting well after the satellite’s pericentric passage. We will explore whether this mechanism is acting in our host galaxy in Section 4.4.
4.2 Time evolution of the host’s baryonic component
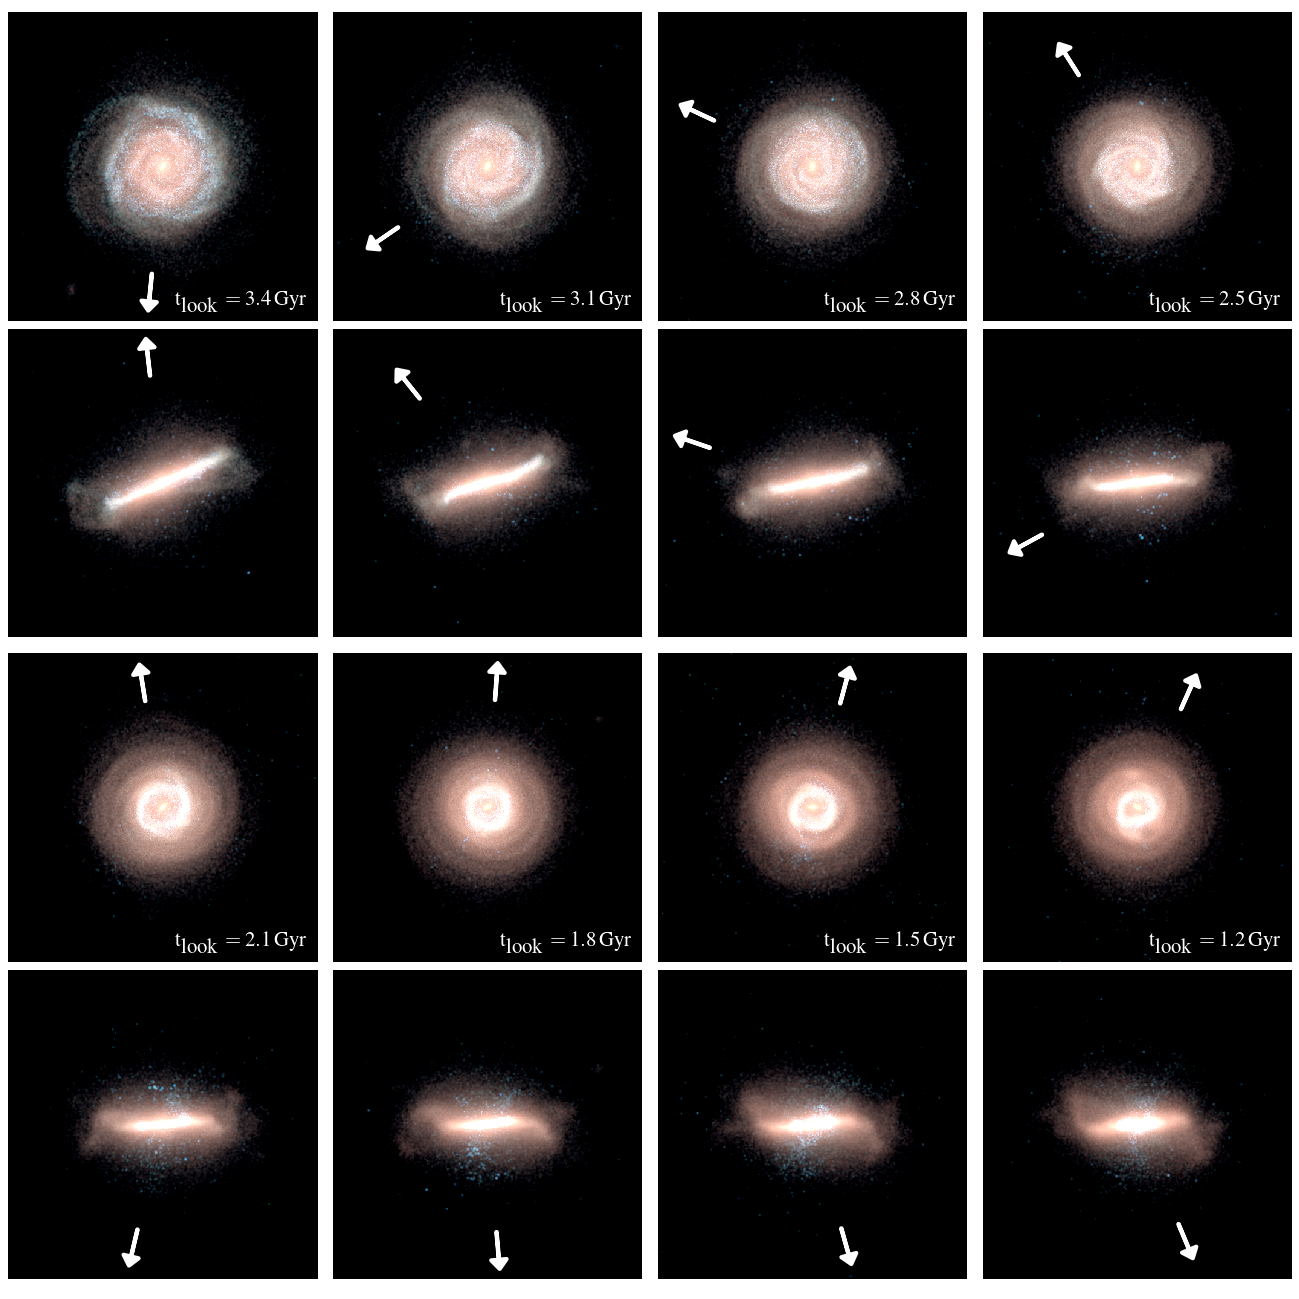
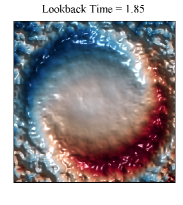
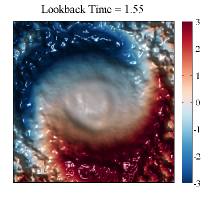
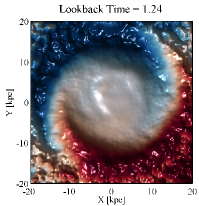
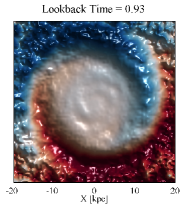
In Figure 6 we follow the time evolution of the star component from Gyr to Gyr. These panels display the stellar mass distribution within a 80 kpc cube in two orthogonal projections that are kept fixed in time and were chosen such that at Gyr the disk is shown both face-on and edge-on. As in M14, the images were constructed by mapping the K-, B- and U-band luminosities to the red, green and blue channels of a full colour composite image. Young stellar populations hence appear blue, old stellar components appear red. In all panels the same logarithmic mapping of stellar luminosity to image intensity is used. Note the evolution of the stellar disk’s morphology, as inferred from its stellar luminosity. As discussed by M14, during and after the satellite’s closest approach, the star formation is affected in disks and is restricted to a narrow inner ring. This changes the appearance of the disk. As time goes by, the stellar disk tilts significantly.
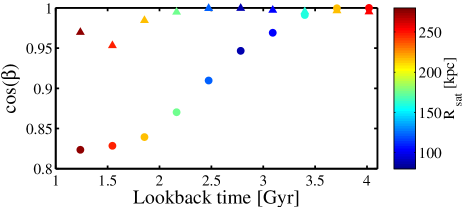
The dots in Figure 7 show the time evolution of the stellar disk’s angular momentum orientation with respect to its initial orientation at Gyr. To compute the orientation we select, at Gyr, all the star particles that are younger than 5 Gyr. These same star particles are used to compute the angular momentum vector at later times. Different criteria defining the angular momentum vector at each snapshot do not affect our results. During the fly-by the host stellar disk tilts by an angle of . This shift in the angular momentum takes place over a Gyr time period. Note that similar changes of the orientation of disk angular momentum vector have been previously measured in hydrodynamical simulations of Milky Way-like galaxies (e.g. DeBuhr, Ma & White, 2012; Aumer & White, 2013; Yurin & Springel, 2014), where they are often not due to satellite effects.
As shown by Scannapieco et al. (2009), a misalignment between the cold gas disk and the stellar disk can destabilize the system, triggering significant perturbations that can even destroy a pre-existing stellar disk. The filled triangles in Figure 7 show the time evolution of the angle between the two disks. They remain well aligned throughout the relevant period of time. This suggests that this mechanism is not playing a role in exciting of the disk’s vertical perturbation. Our results are in good agreement with those presented by Scannapieco et al. (2009), where the same system was studied using a different hydrodynamical technique.
Roškar et al. (2010, hereafter R10) presented a possible mechanism for the formation of outer galactic warps based on the misalignment between inner stellar disk and the surrounding hot gas halo. As discussed by R10, cold gas infalling onto a pre-existing disk can be strongly torqued by the surrounding hot gas halo. By the time the cold gas reaches the star forming regions of the disk, its angular momentum is aligned with that of the hot gas. If the spin of the hot gas halo is not aligned with that of the inner disk, a misaligned outer disk forms composed of newly accreted material. The main characteristic of this mechanism is that it does not involve significant warping of the pre-existing disk. The outer stellar warp is heavily dominated by newly formed stars. In their simulations, old stars in these outer regions can also be seen at large distances from the midplane but their morphology is that of a thickened population. If this mechanism is playing a role in our system, the of the old population should lie close to 0 kpc at all radii. The left panel of Figure 8 shows the map of star particles that, at Gyr, have ages Gyr. For comparison, the right panel shows the map of the star particles that, at this time, have an age Gyr. It is clear that both sets of star particles exhibit nearly the same vertical perturbation. This indicates that the mechanism introduced by R10 is not playing a significant role in our system.
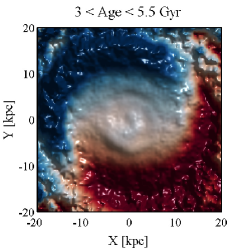
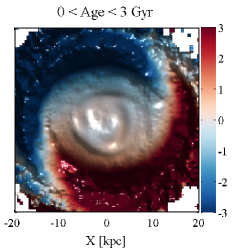
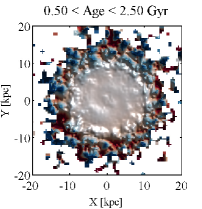
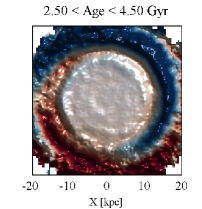
In Figure 9 we dissect our present day galactic disk by selecting star particles that were born within different 2 Gyr time intervals. Each panel shows the map obtained from a different subset of star particles. As expected from our previous discussion, star particles younger than Gyr show no sign of vertical perturbations. These stars are born after the onset of the observed vertical pattern ( Gyr) and within the inner kpc; a region where the disk has not been vertically perturbed. Interestingly, the vertical pattern is best resolved when considering star particles within the age range Gyr. Recall that this time interval approximately corresponds with as well as with the most significant perturber pericentre passage. When considering older subsets of star particles we find that the vertical pattern gradually degrades until it almost disappears for star particles older than Gyr.
The relationship between the age of star particles and the vertical structure of the disk can be understood from Figure 10. Here we show the mass-weighted vertical dispersion, , for subsets of star particles binned by age. This quantity provides a measure of disk scale-height as a function of galactocentric radius. The present day age of the star particles within each bin is indicated in the top left corner of the figure. The solid lines show for disk stars selected at Gyr. In other words, the stellar age bin Gyr corresponds to star particles that, at Gyr, were born during the last 2 Gyr. This recently born population exhibits a very cold distribution, with values of kpc within the inner 8 kpc. Note that the contiguous stellar age bin, with ages Gyr, shows nearly the same value of at all radii. This indicates that the disk has not suffered any violent heating episodes during this period. For older stellar populations, the value of increases systematically at all radii, indicating heating of the disk either by secular evolution or by tidal interactions with other satellite galaxies. The dashed lines show, for the same subset of stellar particles, the present day value of . It is evident that, for kpc, the younger stellar populations have been strongly vertically heated during the last Gyr. The older age bins are composed of stellar populations that, at Gyr, were progressively hotter with increasing age. Thus, they are less susceptible to further heating than their younger counterparts. Note that the hotter the population was at , the faster the vertical pattern mixes.

4.3 Where is the torque coming from?
We now characterize the source of the external perturbation that, at , is exerted on the galactic disk and induces the observed vertical pattern. As previously discussed, the required torque could arise from a misaligned DM halo with respect to the disk or a close encounter with a companion galaxy.
To explore whether there is a significant misalignment between the disk and the DM halo we compute, at every snapshot time, the DM halo inertia tensor,
| (1) |
considering particles located within different spherical shells. Here indicates the total number of particles within each shell. Four different shells, defined as kpc, kpc, kpc and kpc are selected in order to characterize separately the behaviour of the DM halo’s inner and outer regions. We will refer to them as , where and indicate the lower and upper radial limits of each shell. Once these tensors are computed they can be diagonalized to obtain the directions of the principal axes and their relative strengths.
In Figure 11 we show, with solid dots, the time evolution of the angle between the angular momentum of the galactic disk222Using the inertia tensor of the disk to determine its orientation yields the same results. and the semi-minor axis of the innermost DM shell, i.e., . The colour coding indicates the galactocentric distance of the satellite galaxy identified in Section 4.1. We find that the inner DM halo and the galactic disk are very well aligned at all times. The open squares show the time evolution of the angle between the semi-minor axes of the two innermost DM shells, . Note that these two shells are also very well aligned at all times. As we move into the outer regions of the DM halo, a misalignment becomes noticeable. The open triangles and diamonds show the angles between and , respectively. Note that the two outer DM shells are also misaligned with respect to each other. The outermost shell shows the largest misalignments. Our results are in very good agreement with previous studies (e.g. Bailin et al., 2005; DeBuhr, Ma & White, 2012; Aumer & White, 2013). Using cosmological hydrodynamical simulations, Bailin et al. (2005) find that, while the inner regions of DM halos, , are well aligned with the disk, the outer regions are unaffected by the disk’s presence and are often differently oriented. In our simulations, kpc.
For the shell the misalignment with the inner shell, , decreases as the satellite approaches. It reaches a minimum value before the satellite’s pericentre passage and then it remains approximately constant until Gyr. A similar behaviour is observed for , although the misalignment stops decreasing just after pericentre. In contrast, we find that, at all times, these four DM shells are very well aligned along their semi-major axes.
From the previous analysis it remains unclear whether the misalignment along the semi-minor axis of the outer DM halo could be the main driver of the disk’s vertical pattern. Recall that the vertical pattern has a relatively sudden onset at . As previously discussed, the DM shell reaches a constant orientation with respect to the inner halo prior to this onset. In fact, the misalignment is largest before the onset. The outermost shell, , seems too distant to exert a torque that could vertically perturb the disk.
To clearly identify the main torquing source we compute the time evolution of the torque exerted by the previously defined DM shells on a given ring of disk particles. In addition, to use as a normalization, we compute the net torque exerted by all DM halo particles within kpc.
We focus our attention on the ring of disk particles located within kpc since, at this galactocentric radius, the vertical pattern can be clearly observed at all times (after ). In order to isolate the torque exerted by the DM particles contained in each individual shell, we proceed as follows. First, at every simulation snapshot, disk particles within kpc are selected. By computing and diagonalizing the mass tensor associated with this particle subset, we obtain the orientation of the ring with respect to an inertial frame. The whole system is rotated such that the ring’s plane is aligned with the X-Y plane. Subsequently, a set of 2000 test particles333The number of test particle is chosen such that convergence is found in our results. are uniformly azimuthally distributed at kpc. A mass is assigned to each test particle. Here represents the disk stellar mass enclosed within the ring. Finally, the resulting torque on the ring is computed as
| (2) |
where represents the galactocentric distance to each test particle and
| (3) |
Here, represents the number of DM particles enclosed within a given spherical shell. Note that since we are only interested in identifying the torque responsible for the ring’s tilting, from now on we will focus on the torque’s component perpendicular to the ring’s angular momentum (i.e., in the X-Y plane; the Z-component of the torque only affects the magnitude of the angular momentum).
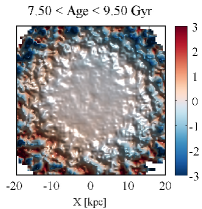
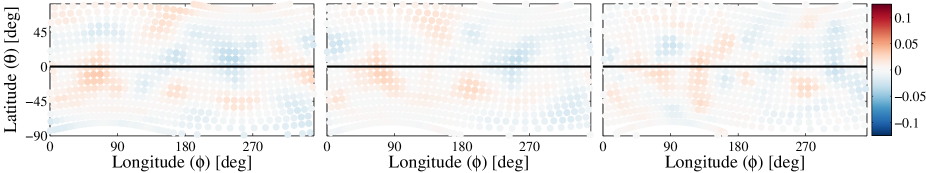
The black dots in the top panel of Figure 12 show the time evolution of the torque associated with the overall DM halo within 80 kpc, dm(0-80). This figure clearly reveals that the torque increases rapidly from Gyr, where it is almost vanishing, to Gyr, where its magnitude peaks. Interestingly, this time not only coincides with the onset of the vertical pattern, , but also with the satellite pericentre passage, as indicated by the vertical dashed line. After the torque reaches its maximum, it slowly decays again over a period of 2 Gyr to small values. Note that this behaviour does not correlate with the time evolution of the DM halo misalignment, at least within the inner 50 kpc. As previously discussed, the two innermost DM shells, dm(0-10) and dm(10-25), remain very well aligned, at least, until Gyr. In fact, the shell dm(10-25) becomes slightly more misaligned at late times, where we observe the intensity of DM torque to continue its decay. The misalignment of the DM shell dm(25-50) ceases to evolve before the pericentre passage, remaining constant for the rest of this period.
To further explore this we show, with differently colored symbols, the contribution to the total DM torque from each shell. The red squares show the time evolution of the torque associated with the inner DM shell, dm(0-10). Clearly, this part of the DM halo exerts a negligible torque on the ring. The torque exerted by the outer DM shell dm(50-80), indicated with blue diamonds, is also negligible. The green dots show the torque associated with dm(25-50). We find that this shell contributes of the total DM torque. Its evolution follows that of the overall DM halo torque, and is uncorrelated with the time evolution of this shell’s misalignment. As shown by the magenta dots, of the DM torque is coming from the inner shell dm(10-25), a shell that is well aligned with the disk and the inner halo during this period. The bottom panel of Figure 12 compares the time evolution of the DM halo torque with that due to the satellite itself. As before, the dots show the torque exerted by the overall DM halo. The colour coding indicates the satellite’s galactocentric distance. The black solid squares shows the torque exerted by the satellite444The torque associated with the gaseous galactic component is negligible at all times.. Note that the time evolution of these two is well correlated, peaking at the satellite’s pericentre passage in both cases. However, in this panel the satellite’s torque has been scaled up by a factor of 40 to allow a direct comparison.
These results show that the torque exerted on the galactic disk is driven mainly by the response of the DM halo to the satellite’s fly-by, rather than to a halo - disk misalignment or to the satellite itself. In other words, the DM halo is acting as an amplifier of the satellite’s perturbation. This type of halo - satellite interaction has been studied in the past by several authors. In particular, Vesperini & Weinberg (2000) showed that a low–mass, low–velocity fly-by can cause significant distortions in its host halo that can subsequently perturb an embedded stellar disk. In what follows we explore whether this perturbation, known as a DM halo wake, is indeed present in our system.


4.4 Dark matter halo wake
In the previous Section we have shown that a ring of disk particles, at kpc, is subject to a strong and transient torque that plausibly induces the disk’s vertical pattern. The driving force behind this torque is the DM halo, especially its inner regions. More than of the torque comes from the DM distribution in kpc, whereas the DM halo particles outside kpc have a negligible effect. We have also shown that this transient torque is not correlated with a misalignment between the disk angular momentum vector and the corresponding spherical DM halo shell. Instead, we find its behaviour to be strongly correlated with the orbital phase of the fly-by encounter. The DM halo torque peaks exactly at the satellite’s pericentre, simultaneously with the torque exerted by the satellite itself.
Our results suggest that the DM halo is acting as an amplifier of the perturbation exerted by the satellite, increasing its magnitude by a factor of . It has been long known that a satellite galaxy orbiting its host can induce strong distortions on the host’s DM halo density field. The response of the DM halo to the satellite perturbation is commonly described as a wake and is governed by resonant dynamics (see Choi, 2007, for a detailed and clear review). Resonances between the orbital frequencies of a satellite galaxy and the host halo can induce an exchange of energy and angular momentum. For simplicity, let us assume a satellite orbiting on a circular orbit about a spherically symmetric non-rotating host. A resonance in such system is defined as
| (4) |
Here and are the radial and azimuthal orbital frequencies of a dark matter particle, the frequency of the azimuth of the ascending node and and are integer numbers. In a host as defined above and . The quantity specifies the order of the resonance. In general, the strongest resonances are those associated with corrotation, i.e., . Furthermore, the power of a resonance decays as , where r is the distance from the satellite (e.g. Weinberg, 1989). Thus, the lower the order of the resonance, the stronger the response. The most relevant resonances are the dipole, and the quadrupole, . The resulting wake on the DM overdensity field can be thought of as the superposition of different modes excited by the resonant interaction between the DM halo and the orbiting satellite. Interestingly Weinberg (1994) showed that the lower order modes, especially , are very weakly damped and thus, such modes can persist for long periods of time (see also Ideta, 2002). The perturbation induced on the DM halo during the interaction can be efficiently transmitted to the inner regions of the halo, where it can affect the structure of an embedded stellar disk (Weinberg, 1995, 1998; Vesperini & Weinberg, 2000).
Vesperini & Weinberg (2000, hereafter VW00) studied the response of a DM halo to a fly-by encounter. This study showed that even an unbound satellite that penetrates the outer regions of a host’s DM halo can lead to strong asymmetries in the inner regions of the host. The strength of the response depends on both the velocity of the satellite and its pericentre distance. Low velocity and close encounters induce stronger perturbations. For example, a satellite with a mass , and a pericentric velocity and distance of 200 km/s and 54 kpc respectively, can induce a perturbation with an energy that is comparable to the total (background) energy of a MW-like host. The peak of the response occurs after the satellite pericentre passage and decays slowly thanks to the weakly damped modes.
The configuration studied by VW00 is similar to the fly-by discussed in Section 4. In what follows, we explore whether this fly-by induces an overdense wake in the host DM halo. Identifying such a wake in a fully cosmological triaxial DM halo is not a trivial task. Because of its underlying triaxial structure, an overdensity pattern relative to a spheroid or axisymmetric “mean” DM halo is expected, even without an external perturbation. Furthermore, noise associated with numerical resolution could significantly affect the structure of any induced wake (Choi, 2007). Fortunately, the particle resolution in our host DM halo () is large enough to resolve the important resonances, at least within the relevant radial range (i.e. kpc, Choi, 2007; Weinberg & Katz, 2007).
As previously discussed, the strongest resonance corresponds to a dipolar response of the DM density field which should dominate the morphology of the wake. Note however that higher modes modify the structure so that it differs from a perfect dipole. The dipolar response of the halo density field can be thought of as a displacement of its center of mass with respect to the center of density or central cusp (e.g. White, 1983; Weinberg, 1989). The distribution of such asymmetries in the inner regions of dark halos, and their correlation to the accretion of external material, have been identified and characterized in detail by Gao & White (2006) using the Millennium Simulation (Springel et al., 2005).
To identify such dipolar structure in our host DM halo, we define a system of reference based on the phase-space coordinates of the host’s most bound DM particle (see, e.g., Gao & White, 2006; Choi, 2007). We then obtain a DM overdensity, field as follows:
-
•
We generate a three dimensional grid in polar coordinates, centred on the bottom of the system’s potential well. The spacing between the grid elements is defined as , where is in kpc. Here and represent galactocentric latitude and longitude, respectively.
-
•
For every grid point, we select all DM particles located within a sphere of radius and compute a local DM density, . The radius of each sphere is allowed to increase with galactocentric radius to account for the uniformly spaced grid in polar coordinates. In addition, it serves to smooth out noise due to particle resolution, thus enhancing plausible global overdensity features.
-
•
For every grid point at a given distance , we also select all DM particles within a galactocentric spherical shell defined as , and compute a spherical averaged density, .
-
•
Finally, an overdensity field, , is obtained as
(5)


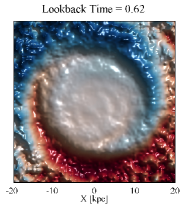
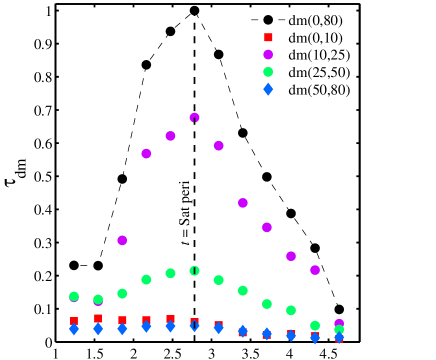
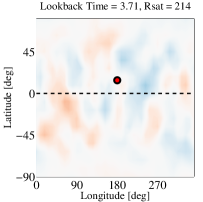
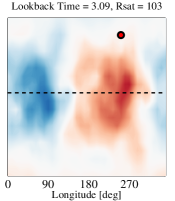
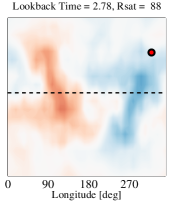
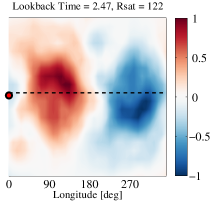
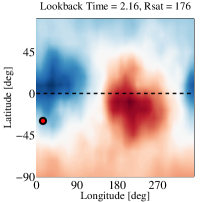
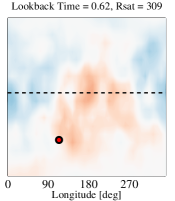
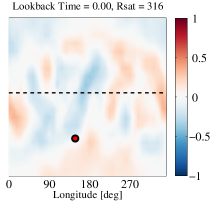
The top panels of Figure 13 show overdensity maps obtained 1 Gyr prior to the satellite’s pericentre passage ( Gyr) at three different galactocentric distances. Since our DM halo is triaxial, we have oriented the maps with respect to the direction of the shell’s principal axes. This orientation is derived from equation (1) considering only DM particles enclosed within the corresponding shell. The triaxial shape of this halo can be clearly appreciated in these maps, with the semi major, intermediate and minor axis pointing in the directions , and , respectively. To explore whether a dipolar mode is concealed by the triaxial shape of the halo we first rotate each map by in , then flip the resulting maps about , and finally compute
| (6) |
The result of this procedure is to erase quadrupolar features while enhancing any plausible underlying dipole associated with the DM halo wake555Note that any quadrupolar mode excited by the DM halo – satellite interaction would also be erased.. The second row of panels shows at the same time as above. These maps have been re-oriented such that the plane is perpendicular to the angular momentum vector of the inner stellar disk ( kpc). Note that, at these radii, we obtain maps without structure after removing the quadrupolar feature, except for some residual noise. In contrast, the third row of panels shows the same , 0.3 Gyr after the satellite pericentre passage ( Gyr). A very clear dipolar feature, with an amplitude of can now be observed. This is a direct indication that a wake has been excited in the host by the satellite. In Figure 14 we follow the time evolution of this dipolar feature. To enhance its signature we stack all the resulting obtained from to 20 kpc. At every snapshot we look for the peak value of the resulting map. We use the maximum of these peak values to normalize all maps. As before, maps are oriented with respect to the inner galactic disk. The colour coded dot indicates the direction of the satellite, as seen from the galactic centre. Before the satellite pericentre passage (top leftmost panel), at Gyr, the map does not show any dipole signatures. As the satellite approaches, a clear signature grows. As expected from VW00, this peaks just after pericentre passage and then slowly degrades. By the present day (bottom rightmost panel), the dipolar signature has vanished.


5 Discussion and conclusions
In this work we have analyzed a fully cosmological hydrodynamical simulation of the formation of a Milky Way-like galaxy. As discussed by M14, the final system is strongly disk–dominated with a realistic rotation curve, a surface density profile close to exponential, and both stellar age distribution and size that are consistent with expectations from large galaxy surveys in the local Universe.
We have focused our interest on the evolution of the vertical structure of the stellar disk. For this purpose we have created maps of the mean height of the disk within kpc at various times. Our results show the present day disk configuration to have a strong and well defined vertical pattern, with amplitudes as large as kpc. The pattern becomes noticeable at kpc, and increases its amplitude as we move away from the galactic center. The inner disk, kpc has a smoother vertical structure, with kpc. This configuration is reminiscent of what has been observed in the outer Galactic disk (Slater et al., 2014; Xu et al., 2015; Price-Whelan et al., 2015). Indeed, the outer Milky Way (MW) disk exhibits an oscillating asymmetry whose amplitude increases with Galactocentric radius, with material visible at large Galactic latitudes (). The mean vertical velocity of our simulated disk, , has a similar structure to , with values as large as 65 km/s in the outer disk. By contrasting the phases of the and the maps, we have clearly exposed the oscillatory behaviour of the vertical pattern.
Maybe the most interesting feature of the disk’s present day vertical structure is the large span in galactic longitude () covered by this pattern. By creating maps of star particle counts, we have compared its structure to the Mon ring as seen by Pan-STARRS1 (S14). As shown by S14, the Mon ring exhibits a complex morphology with both stream-like features and sharp edges both north and south of the disk. A comparison between our mock data set and the Mon ring reveals considerable similarities. Material from the simulated galactic disk can be found at the correct galactic latitudes at all radii and on both side of the disk. Previous numerical attempts to reproduce the Mon ring based on models in which the disk is strongly distorted by an accretion event have failed to deposit material at the correct heights (e.g. Kazantzidis et al., 2009; Gómez et al., 2013; Price-Whelan et al., 2015). Furthermore, well defined arcs of disk material can be found at large and intermediate galactocentric distances, in agreement with the structure observed by S14. Unlike previous studies, where these arc-like structures were associated with tidal debris from disrupted satellites (e.g. Grillmair, 2006, 2011), S14 showed that they have positions and morphologies that are suggestive of a connection to the Mon ring.
To characterize the origin of this vertical pattern in our simulated galaxy, we have followed the time evolution of the system and explored the main sources of perturbations. The onset of the pattern is relatively sudden and takes place approximately at . Initially, it shows an configuration but quickly starts to wind up into a leading spiral. This indicates that the external source of the torque, responsible for the onset of the perturbation, has decayed over time leaving behind a misaligned outer disk. As discussed by SS06, after this point the main torque on this misaligned outer material comes from the inner disk. This causes the outer disk to precess retrograde at a rate that decreases with galactocentric distance, giving rise to the leading spiral shape.
At all star particles in the disk are similarly perturbed, regardless of their age. This rules out a scenario in which the initial warp reflects the formation of a misaligned outer disk from newly accreted material (e.g. Roškar et al., 2010). However, we find that, at the present day, the vertical pattern is significantly more coherent in the subpopulation of star particles that were born just before . Older populations were previously heated by secular evolution or previous accretion events and, as a result, the vertical pattern in their distributions more rapidly mixes.
To identify the main source driving this vertical pattern, we have characterized the distribution of satellite galaxies that interact with our host at . The most significant perturber is a low-velocity fly-by with a pericentre passage at Gyr. This satellite has a total mass of , a pericentre at kpc and a velocity at pericentre of km/s. Even though it is not massive enough to directly perturb the galactic disk, we find that it significant distorts the halo density field which subsequently perturbs the embedded stellar disk.
The mechanism underlying this satellite – halo – disk interaction was presented by Vesperini & Weinberg (2000). The response of the halo is determined by a resonant interaction with the satellite. Its strength depends not only on the mass of the perturber, but also on its pericentre distance and velocity. The lower the velocity, the stronger the response, which manifest as a density wake that can be represented as a superposition of several resonant modes. The strongest of them are the dipole and quadrupole which are only weakly damped. In particular, the dipolar response of the halo can be thought of as a displacement of the halo center of mass with respect to the central density cusp. To search for such a dipolar response, we created halo overdensity maps at various times, centering our coordinates on the bottom of the potential well. This analysis showed a clear and strong dipolar response in the inner halo ( kpc) that is well correlated with the satellite pericentre passage. As expected from VW00, the dipolar perturbation peaks just after the satellite’s pericentre and can be observed for, at least, 1 Gyr after this moment. Indeed, we find that the torque exerted on the stellar disk comes, almost completely, from the inner halo. The time evolution of the halo torque and that exerted by the satellite itself are well correlated, even though the satellite is not itself massive enough to significantly perturb the disk. The halo is acting to strongly amplify the satellite’s perturbation. Approximately of the torque comes from halo material lying at radii between 10 and 25 kpc. This inner halo is well aligned with the galactic disk during the generation of the vertical pattern, confirming that the torque is not primarily driven by a misalignment between the principal axes of the disk and halo.
The mechanism driving the vertical pattern in our simulated disk could, at least, be partially responsible for the perturbed vertical structure of our Galactic disk. It is thus interesting to consider what satellite could have induced a density wake in the Galactic halo to perturb the outer Galactic disk. The first plausible candidate is the Sagittarius dwarf galaxy (Sgr). As previously discussed, a model of the interaction between this galaxy and the Galactic disk can account for many of the global and local morphological features observed in the Galactic disk (Purcell et al., 2011; Gómez et al., 2012, 2013; Price-Whelan et al., 2015). These models, however, fail to deposit enough material at the required height to reproduce the observed distribution of main sequence turn-off stars and RR Lyrae in the outer MW disk (S14, Price-Whelan et al., 2015). An important assumption in these simulations relates to initial set-up of the Sgr-like models. The satellites are launched 80 kpc from the galactic centre in the plane of the MW-like disk, with their DM halo mass profiles truncated at the instantaneous Jacobi tidal radius. This reduces the initial bound mass of the Sgr models, of the order of , by a factor of . Perturbations on the host halo density field that could have occurred during the virial-radius infall and this ‘initial’ location are thus neglected. To study whether such perturbations (and their associated density wake) are strong enough to bring the structure of the simulated disk into better agreement with observations, new simulations that initially place Sgr models outside the host’s virial radius are required. We defer this analysis to a follow up study.
Another plausible perturber is the Large Magellanic Cloud (LMC). Recent studies based on the SMC-LMC orbital history before infall into the MW and on the dynamical state of galaxies in the Local Volume suggest a total LMC mass at infall of (Besla et al., 2012; Peñarrubia et al., 2015). Thus, this galaxy could be massive enough to significantly perturb the Galactic disk due both to its own tidal field and to the subsequent halo density wake. Note however that current measurement of the LMC proper motion suggest that this galaxy is currently undergoing its first pericentre passage (Besla et al., 2007; Kallivayalil et al., 2013). Thus, it remains to be studied whether the mechanism discussed in this work has had enough time to act. Clearly, new numerical models of the Milky Way-LMC interaction are required in order to reassess the impact of our most massive companion on the morphology of our own Galaxy.
Acknowledgements
FAG would like to thank Monica Valluri, Eric Bell, and Victor Debattista for very useful discussions and suggestions. RG and VS acknowledge support through the DFG Research Centre SFB-881 ’The Milky Way System’ through project A1. VS and RP acknowledges support by the European Research Council under ERC-StG grant EXAGAL-308037.
References
- Aumer & White (2013) Aumer M., White S. D. M., 2013, MNRAS, 428, 1055
- Bailin et al. (2005) Bailin J. et al., 2005, ApJL, 627, L17
- Belokurov et al. (2006) Belokurov V. et al., 2006, ApJL, 642, L137
- Besla et al. (2007) Besla G., Kallivayalil N., Hernquist L., Robertson B., Cox T. J., van der Marel R. P., Alcock C., 2007, ApJ, 668, 949
- Besla et al. (2012) Besla G., Kallivayalil N., Hernquist L., van der Marel R. P., Cox T. J., Kereš D., 2012, MNRAS, 421, 2109
- Binney & Tremaine (2008) Binney J., Tremaine S., 2008, Galactic Dynamics: Second Edition. Princeton University Press
- Boylan-Kolchin et al. (2009) Boylan-Kolchin M., Springel V., White S. D. M., Jenkins A., Lemson G., 2009, MNRAS, 398, 1150
- Briggs (1990) Briggs F. H., 1990, ApJ, 352, 15
- Carlin et al. (2013) Carlin J. L. et al., 2013, ApJL, 777, L5
- Choi (2007) Choi J.-H., 2007, PhD thesis, School: University of Massachusetts Amherst
- Debattista (2014) Debattista V. P., 2014, MNRAS, 443, L1
- Debattista & Sellwood (1999) Debattista V. P., Sellwood J. A., 1999, ApJL, 513, L107
- DeBuhr, Ma & White (2012) DeBuhr J., Ma C.-P., White S. D. M., 2012, MNRAS, 426, 983
- Faure, Siebert & Famaey (2014) Faure C., Siebert A., Famaey B., 2014, MNRAS, 440, 2564
- Feldmann & Spolyar (2015) Feldmann R., Spolyar D., 2015, MNRAS, 446, 1000
- Gao & White (2006) Gao L., White S. D. M., 2006, MNRAS, 373, 65
- Gómez et al. (2013) Gómez F. A., Minchev I., O’Shea B. W., Beers T. C., Bullock J. S., Purcell C. W., 2013, MNRAS, 429, 159
- Gómez et al. (2012) Gómez F. A. et al., 2012, MNRAS, 423, 3727
- Grillmair (2006) Grillmair C. J., 2006, ApJL, 651, L29
- Grillmair (2011) Grillmair C. J., 2011, ApJ, 738, 98
- Ideta (2002) Ideta M., 2002, ApJ, 568, 190
- Jiang & Binney (1999) Jiang I.-G., Binney J., 1999, MNRAS, 303, L7
- Kaiser et al. (2010) Kaiser N. et al., 2010, in Society of Photo-Optical Instrumentation Engineers (SPIE) Conference Series, Vol. 7733, Society of Photo-Optical Instrumentation Engineers (SPIE) Conference Series, p. 0
- Kallivayalil et al. (2013) Kallivayalil N., van der Marel R. P., Besla G., Anderson J., Alcock C., 2013, ApJ, 764, 161
- Kazantzidis et al. (2009) Kazantzidis S., Zentner A. R., Kravtsov A. V., Bullock J. S., Debattista V. P., 2009, ApJ, 700, 1896
- Kim et al. (2014) Kim J. H., Peirani S., Kim S., Ann H. B., An S.-H., Yoon S.-J., 2014, ApJ, 789, 90
- Majewski et al. (2004) Majewski S. R., Ostheimer J. C., Rocha-Pinto H. J., Patterson R. J., Guhathakurta P., Reitzel D., 2004, ApJ, 615, 738
- Marinacci, Pakmor & Springel (2014) Marinacci F., Pakmor R., Springel V., 2014, MNRAS, 437, 1750
- Martin, Ibata & Irwin (2007) Martin N. F., Ibata R. A., Irwin M., 2007, ApJL, 668, L123
- Monari, Famaey & Siebert (2015) Monari G., Famaey B., Siebert A., 2015, ArXiv e-prints
- Newberg et al. (2002) Newberg H. J. et al., 2002, ApJ, 569, 245
- Ostriker & Binney (1989) Ostriker E. C., Binney J. J., 1989, MNRAS, 237, 785
- Peñarrubia et al. (2015) Peñarrubia J., Gómez F. A., Besla G., Erkal D., Ma Y.-Z., 2015, ArXiv e-prints
- Price-Whelan et al. (2015) Price-Whelan A. M., Johnston K. V., Sheffield A. A., Laporte C. F. P., Sesar B., 2015, ArXiv e-prints
- Purcell et al. (2011) Purcell C. W., Bullock J. S., Tollerud E. J., Rocha M., Chakrabarti S., 2011, Nature, 477, 301
- Quinn, Hernquist & Fullagar (1993) Quinn P. J., Hernquist L., Fullagar D. P., 1993, ApJ, 403, 74
- Rocha-Pinto et al. (2003) Rocha-Pinto H. J., Majewski S. R., Skrutskie M. F., Crane J. D., 2003, ApJL, 594, L115
- Rocha-Pinto et al. (2004) Rocha-Pinto H. J., Majewski S. R., Skrutskie M. F., Crane J. D., Patterson R. J., 2004, ApJ, 615, 732
- Roškar et al. (2010) Roškar R., Debattista V. P., Brooks A. M., Quinn T. R., Brook C. B., Governato F., Dalcanton J. J., Wadsley J., 2010, MNRAS, 408, 783
- Scannapieco et al. (2009) Scannapieco C., White S. D. M., Springel V., Tissera P. B., 2009, MNRAS, 396, 696
- Sellwood (2013) Sellwood J. A., 2013, Dynamics of Disks and Warps, Oswalt T. D., Gilmore G., eds., p. 923
- Shen & Sellwood (2006) Shen J., Sellwood J. A., 2006, MNRAS, 370, 2
- Slater et al. (2014) Slater C. T. et al., 2014, ApJ, 791, 9
- Springel (2005) Springel V., 2005, MNRAS, 364, 1105
- Springel (2010) Springel V., 2010, MNRAS, 401, 791
- Springel et al. (2005) Springel V. et al., 2005, Nature, 435, 629
- Velazquez & White (1999) Velazquez H., White S. D. M., 1999, MNRAS, 304, 254
- Vesperini & Weinberg (2000) Vesperini E., Weinberg M. D., 2000, ApJ, 534, 598
- Villalobos & Helmi (2008) Villalobos Á., Helmi A., 2008, MNRAS, 391, 1806
- Vogelsberger et al. (2013) Vogelsberger M., Genel S., Sijacki D., Torrey P., Springel V., Hernquist L., 2013, MNRAS, 436, 3031
- Vogelsberger et al. (2012) Vogelsberger M., Sijacki D., Kereš D., Springel V., Hernquist L., 2012, MNRAS, 425, 3024
- Weinberg (1989) Weinberg M. D., 1989, MNRAS, 239, 549
- Weinberg (1994) Weinberg M. D., 1994, ApJ, 421, 481
- Weinberg (1995) Weinberg M. D., 1995, ApJL, 455, L31
- Weinberg (1998) Weinberg M. D., 1998, MNRAS, 299, 499
- Weinberg & Katz (2007) Weinberg M. D., Katz N., 2007, MNRAS, 375, 425
- White (1983) White S. D. M., 1983, ApJ, 274, 53
- Widrow et al. (2014) Widrow L. M., Barber J., Chequers M. H., Cheng E., 2014, MNRAS, 440, 1971
- Widrow & Bonner (2015) Widrow L. M., Bonner G., 2015, MNRAS, 450, 266
- Widrow et al. (2012) Widrow L. M., Gardner S., Yanny B., Dodelson S., Chen H.-Y., 2012, ApJL, 750, L41
- Williams et al. (2013) Williams M. E. K. et al., 2013, MNRAS, 436, 101
- Xu et al. (2015) Xu Y., Newberg H. J., Carlin J. L., Liu C., Deng L., Li J., Schönrich R., Yanny B., 2015, ApJ, 801, 105
- Yanny & Gardner (2013) Yanny B., Gardner S., 2013, ApJ, 777, 91
- Yanny et al. (2003) Yanny B. et al., 2003, ApJ, 588, 824
- Yurin & Springel (2014) Yurin D., Springel V., 2014, ArXiv e-prints