Critical nonequilibrium relaxation in the Swendsen-Wang algorithm in the Berezinsky-Kosterlitz-Thouless and weak first-order phase transitions
Abstract
Recently we showed that the critical nonequilibrium relaxation in the Swendsen-Wang algorithm is widely described by the stretched-exponential relaxation of physical quantities in the Ising or Heisenberg models. Here we make a similar analysis in the Berezinsky-Kosterlitz-Thouless phase transition in the two-dimensional (2D) XY model and in the first-order phase transition in the 2D Potts model, and find that these phase transitions are described by the simple exponential relaxation and power-law relaxation of physical quantities, respectively. We compare the relaxation behaviors of these phase transitions with those of the second-order phase transition in the 3D and 4D XY models and in the 2D -state Potts models for , and show that the species of phase transitions can be clearly characterized by the present analysis. We also compare the size dependence of relaxation behaviors of the first-order phase transition in the 2D and Potts models, and propose a quantitative criterion on “weakness” of the first-order phase transition.
pacs:
05.10.Ln,64.60.Ht,75.40.CxI Introduction
The cluster algorithms have been proposed to overcome the critical slowing down. The dynamical critical exponent () in the local-update algorithms was reported to be reduced of one order by the cluster algorithms SW ; Wolff . In numerical calculations, this exponent was evaluated from size dependence of the correlation time of equilibrium autocorrelation functions of physical quantities at the critical temperature, . It was gradually revealed that to distinguish power-law behavior with such a small exponent from logarithmic behavior, , is quite difficult Heermann ; Baillie .
Then, larger-scale calculations based on nonequilibrium relaxation (NER) NERrev showed Gunduc ; Du that a critical relaxation faster than power law (symbolically represented as ) might exist in the cluster algorithms. Quite recently, the present authors showed that the explicit form of such a nontrivial critical relaxation is given by the stretched-exponential time dependence, initially in the two-dimensional (2D) Ising model in the Wolff algorithm from the perfectly-ordered state Nonomura14 , and then in the 3D Heisenberg model in the Swendsen-Wang (SW) algorithm from the perfectly-disordered state Nono-Hei .
In the standard NER based on the local-update algorithms, a physical quantity of large enough size shows a power-law critical relaxation , with the critical exponent of the quantity and of the correlation length for decaying () or ordering () processes. The critical temperature can be evaluated from the power-law behavior (or linearity of the - plot), and the critical exponents can be obtained from the mixed exponents of some quantities and scaling relations.
Once the functional form of the critical relaxation in the cluster NER is established, analysis similar to that in the standard NER becomes possible, and the critical temperature can be evaluated from the stretched-exponential behavior Nono-Hei . However, the critical exponents are not included in the stretched-exponential time dependence, and such information can be obtained only from the nonequilibrium-to-equilibrium scaling Nonomura14 , a kind of finite-size scaling which couples the short-time critical relaxation and equilibrium size dependence. Although this procedure ensures the nontrivial stretched-exponential behavior in the cluster NER, necessity of multiple sizes is not so favorable as the standard NER, and necessity of relaxation data until the vicinity of equilibrium is also not favorable because numerical merit in comparison with conventional equilibrium simulations becomes obscure.
In the present article we numerically show that the essential merit of the cluster NER is exhibited in the Berezinsky-Kosterlitz-Thouless (BKT) and weak first-order phase transitions. Critical relaxation behaviors in the cluster NER are qualitatively different in the BKT or weak first-order phase transitions and in the second-order phase transition, and nontrivial physical results can be obtained only from initial relaxation behaviors.
The outline of the present article is as follows. In section II, the basic scaling form of magnetization in the critical relaxation with respect to time and size is exhibited. In section III, we calculate this time dependence in the 2D, 3D and 4D XY models, and show that the peculiar behavior in 2D characterizes the BKT phase transition. In section IV, critical relaxation in the 2D -sate Potts models are compared with each other for , and the qualitative difference between (second-order phase transition) and (first-order phase transition) is displayed. The size dependence of the ordering process in the first-order phase transition is investigated for and , and weak-first-order nature for is visualized. In section V, numerical results in the present article are discussed. The meaning of the universal stretched-exponential exponent observed in the 3D and 4D XY models is considered, and a quantitative criterion on “weakness” of the first-order phase transition is proposed. In section VI, the above descriptions are summarized.
II Formulation
In the present article the 2D Potts models are analyzed with the SW algorithm SW , and the XY models are treated with the “embedded-Ising-spin” scheme proposed by Wolff Wolff , although spin clusters are generated in the whole system after the SW algorithm, not after Wolff’s single-cluster scheme (the so-called Wolff algorithm) Wolff . Since the purpose of the present article is to exhibit nontrivial critical relaxation in the BKT and weak first-order phase transitions, here we do not intend to evaluate the critical temperature precisely. Instead, we use the exact value [] in the 2D -state Potts model on a square lattice with coupling . In the 3D and 4D XY models, a rather rough evaluation of is enough for the estimation of the stretched-exponential exponent. In the 2D XY model, the BKT phase transition results in a large finite-size effect, and size dependence of is crucial. In this case a recent large-scale simulation by Komura and Okabe Komura is referred to.
In the XY models, we concentrate on the nonequilibrium ordering from the perfectly-disordered state, because early-time deviation from the stretched-exponential form is much smaller than that of the decay from the perfectly-ordered state in vector spin models Nono-Hei . The absolute value of the magnetization behaves as
| (1) |
with the spatial dimension , the “relaxation time” depending on a quantity and the exponent independent of quantities. Here the size dependence originates from the normalized random-walk growth of clusters. In order to evaluate the exponent simply, we utilize the double-log plot,
| (2) |
which is directly derived from Eq. (1). Here stands for the coefficient of rhs of Eq. (1) including size dependence. The unknown coefficient can be determined by aligning the early-time data on a straight line.
In the 2D Potts models, we calculate both decay from the perfectly-ordered state and ordering from the perfectly-disordered state, because the relaxation process becomes slower and slower as the number of state increases, and whether the system is still trapped by the pure ordered or disordered stable states or already arrives at equilibrium (coexistence of the two stable states) in the first-order phase transition can be distinguished only by comparing these two relaxation processes. Weakness of the first-order phase transition is mainly characterized by the ordering process from the perfectly-disordered state.
III Numerical results in the XY models: BKT versus second-order phase transitions
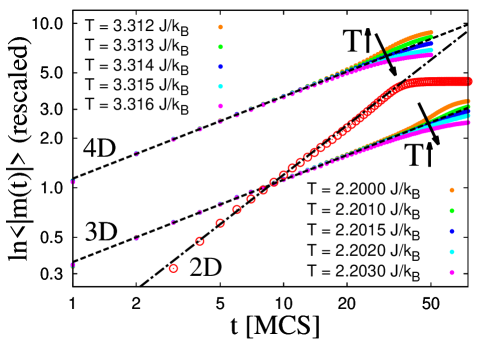
First, a double-log plot of the absolute value of magnetization obtained from ordering from the perfectly-disordered state is displayed in Fig. 1 for the 3D XY model for and for the 4D XY model for . In the 3D XY model, the tangent of early-time behavior is almost unchanged for varying the temperature for with , and . Similar behavior is observed for the 4D XY model for with , and . The exponent is also observed in the 3D Heisenberg model Nono-Hei , and this exponent might be universal in vector spin models.
Then, the absolute value of magnetization in the 2D XY model for (total number of spins is the same as that in the 3D XY model for ) is also plotted in the same figure (open circles). Here the data at are exhibited following for Komura . Aside from initial a few Monte Carlo steps (MCS), these data are well on a straight (chain) line with , and . Such time dependence is clearly different from those in the 3D and 4D XY models characterized by .
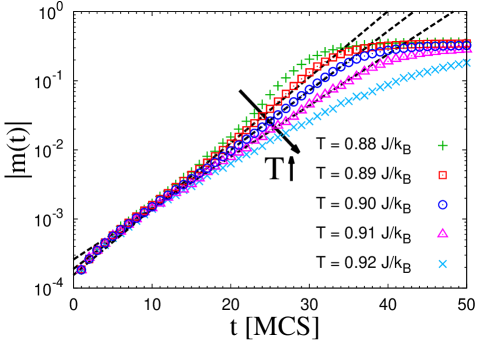
The case is nothing but the simple-exponential time dependence. In such a case a naive semilog plot is more convenient and reliable than the double-log plot, because the unknown parameter does not appear. The data for are plotted in Fig. 2, and at least the data for (squares), (circles) and (triangles) seem consistent with the simple-exponential time dependence (dashed lines). The nontrivial simple-exponential behavior in two dimensions suggested in Fig. 1 is confirmed, and such a breakdown of the universal relaxation behavior in XY models only in two dimensions would be the consequence of the BKT phase transition, which occurs only in two dimensions.
IV Numerical results in the 2D -state Potts models for various
IV.1 Comparison between the second-order () and first-order () phase transitions
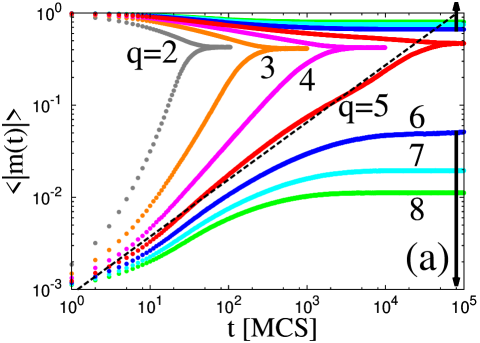
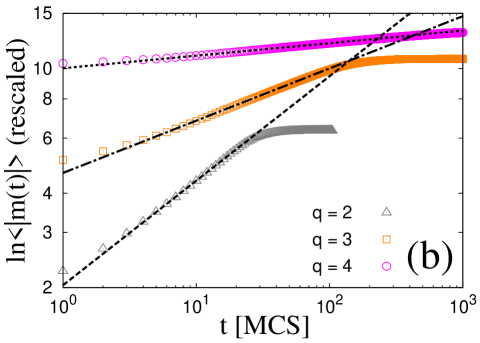
Decaying behavior from the perfectly-ordered state and ordering behavior from the perfectly-disordered state in the 2D -state Potts models for and are summarized in Fig. 3(a), namely the log-log plot of time dependence of the absolute value of magnetization at the exact . This model exhibits the second-order phase transition for , which results in the stretched-exponential time dependence in the critical cluster NER. As shown in Fig. 3(b), equilibration becomes slower as the number of state increases, and the exponent decreases from (dashed line) at (Ising case, triangles) Nonomura14 . At (squares), this exponent seems consistent with (chain line). At (circles), the exponent is much reduced and a preliminary estimate from these data is . In this figure we draw a dotted guide line with . Note that a few initial-time data points are not on straight lines, and the deviation is much larger than the cases in the 3D and 4D XY models as displayed in Fig. 1. Since Potts variables take discrete values, initial clusters are generated discontinuously in this model, and deviation in the initial relaxation process is inevitable. Further investigations for and will be given elsewhere.
This model shows the first-order phase transition for , and the trapping behavior to pure astable states, which is a typical sign of the first-order phase transition, is observed for , and the magnetization gap increases as increases (drawn by arrows) Baxter82 . This behavior has already been reported in NER based on the local-update algorithm at Ozeki03 , and also based on the SW algorithm at Kasono . In these cases initial relaxation processes are described by the power-law relaxation, and then saturate into pure stable states. At for , such behavior is replaced by convergence to equilibrium (coexistence of two stable states) almost in a power law (drawn by the dashed line).
IV.2 Comparison of the size dependence in the first-order phase transition for and
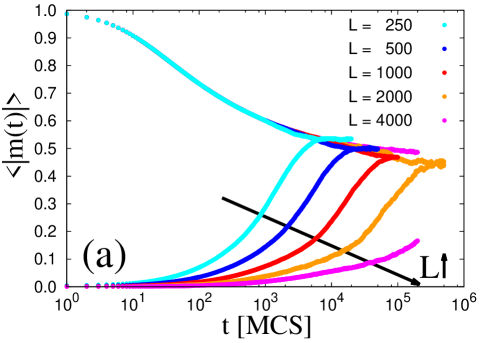
In order to understand the origin of such nontrivial behavior in the first-order phase transition at , size dependence of the data is investigated. The data corresponding to Fig. 3(a) for various system sizes at are plotted in Fig. 4(a) in an inverse semilog plot (the -axis is drawn in a log scale), and the data for converge to equilibrium up to MCS. In this figure the data in the decaying process are on a single curve until the system in each size approaches the vicinity of equilibrium. The equilibrium value of magnetization decreases systematically as the system size increases. Note that fluctuating behavior for is because of the limited number of averaged random-number sequences. Since the relaxation time until equilibrium seems proportional to in this case, numerical efforts are proportional to together with trivial increase proportional to volume .
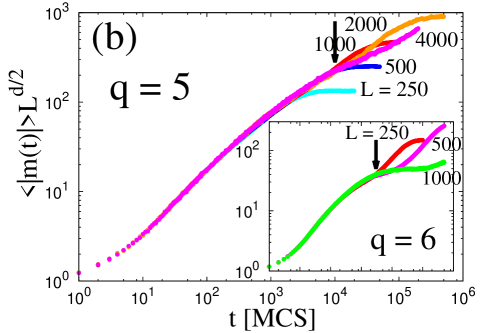
In Fig. 4(b), the data in the ordering process from the perfectly-disordered state at are plotted in a log-log scale by taking the size dependence of random-walk growth (1) into account. The data for various system sizes are on a single curve after adjusting this size dependence up to the onset of trapping behavior indicated by the arrow. Such behavior becomes clearer in comparison with the data at for smaller sizes in the inset. The apparent trapping behavior for is not observed for smaller sizes, and the waving behaviors for and at seem comparable to those for and at , respectively. This correspondence suggests that the clear trapping behavior may not be observed at even for , which is beyond reach numerically at present.
V Discussion
Simple-exponential critical relaxation in the 2D XY model is quite nontrivial, because such behavior is usually observed above (from the perfectly-ordered state) or below (from the perfectly-disordered state). Such anomalous critical relaxation looks suitable for the anomalous BKT phase transition specific to two dimensions. Actually, equivalence of the exponent of the stretched-exponential behavior in the 3D and 4D XY models is equally nontrivial, because the upper critical dimension of the XY model is four; that is, dynamical behaviors in the cluster NER might be different from the mean-field one even above . Further investigations on this topic in the Ising models are now in progress Nono-letter .
The waving behavior in the ordering process of magnetization in the 2D Potts model could be regarded as the sign of trapping behavior to pure stable states, which is characteristic to the first-order phase transition. However, the onset of this behavior coincides with that of the saturation behavior toward equilibrium for , as shown in Fig. 4(b). That is, no explicit behaviors to represent the first-order phase transition can be observed for . Such a critical system size can be much larger when the first-order phase transition is much weaker, and direct numerical evidence of the first-order phase transition becomes beyond reach in such a case.
It would rather be a quantitative criterion of the “weak first-order phase transition” that no signs of trapping behavior to pure stable states are observed even in the numerically-accessible maximum system size. Nevertheless, power-law behavior in the cluster NER exists even in such a case. Analytic treatment of the cluster NER is possible in the infinite-range model, and the study on the infinite-range Potts model exhibits Tomita similar power-law behavior in the first-order phase transition.
VI Summary
In the present article the BKT phase transition in the 2D XY model and the (weak) first-order phase transition in the 2D Potts model are analyzed with the nonequilibrium relaxation (NER) in the Swendsen-Wang algorithm. Ordering process shows the simple-exponential critical relaxation in the former, and it shows the power-law critical relaxation in the latter. Both behaviors are qualitatively different from those in the second-order phase transition such as in the 3D and 4D XY models or in the 2D Potts model for , which show the stretched-exponential critical relaxation. These behaviors can be regarded as the essential merit of the cluster NER, because nontrivial physical results can be obtained only from initial relaxation behaviors in these cases similarly to those in the standard NER.
The simple-exponential relaxation in the 2D XY model corresponds to in the stretched-exponential time dependence (1), and such relaxation is usually observed above or below . The critical relaxation in the 3D and 4D XY models is characterized by the exponent (such universality of the exponent independent of the spatial dimension is also nontrivial), and this large deviation of ensures anomaly in the BKT phase transition. The first-order phase transition in the 2D Potts models is characterized by the trapping behavior to pure stable states in dynamical processes, which is not observed in the 2D Potts model within the numerically accessible system sizes. Size dependence in the first-order phase transition is clarified by a kind of finite-size scaling analysis including the random-walk growth of spin clusters, and a quantitative criterion on the “weak first-order phase transition” is proposed.
Acknowledgments
The random-number generator MT19937 MT was used for numerical calculations. Most calculations were performed on the Numerical Materials Simulator at National Institute for Materials Science.
References
- (1) R. H. Swendsen and J.-S. Wang, Phys. Rev. Lett. 58, 86 (1987).
- (2) U. Wolff, Phys. Rev. Lett. 62, 361 (1989), Nucl. Phys. B 322, 759 (1989).
- (3) D. W. Heermann and A. N. Burkitt, Physica A 162, 210 (1990).
- (4) C. F. Baillie and P. D. Coddington, Phys. Rev. B 43, 10617 (1991).
- (5) As a recent review, Y. Ozeki and N. Ito, J. Phys. A 40, R149 (2007).
- (6) S. Gündüç, M. Dilaver, M. Aydin, and Y. Gündüç, Comp. Phys. Commun. 166, 1 (2005).
- (7) J. Du, B. Zheng, and J.-S. Wang, J. Stat. Mech. (2006), P05004.
- (8) Y. Nonomura, J. Phys. Soc. Jpn. 83, 113001 (2014).
- (9) Y. Nonomura and Y. Tomita, arXiv:1508.05218 (Phys. Rev. E in press).
- (10) Y. Komura and Y. Okabe, J. Phys. Soc. Jpn. 81, 113001 (2012).
- (11) R. J. Baxter, J. Phys. A: Math. Gen. 15, 3329 (1982).
- (12) Y. Ozeki, K. Kasono, N. Ito, and S. Miyashita, Physica A 321, 271 (2003).
- (13) K. Kasono, Meeting Abstracts of Phys. Soc. Jpn. 66-1, 294 (2011), 66-2, 214 (2011) (in Japanese).
- (14) Y. Nonomura and Y. Tomita (unpublished).
- (15) Y. Tomita and Y. Nonomura (unpublished).
- (16) M. Matsumoto and T. Nishimura, ACM TOMACS 8, 3 (1998). Further information is available from the Mersenne Twister Home Page, currently maintained by M. Matsumoto.