∎
Largo E. Fermi 5
I-50125 Firenze
Italy
22email: mbeltran@arcetri.astro.it
Senior Scientific Visitor at ESO Chile
33institutetext: W.J. de Wit 44institutetext: European Southern Observatory
Alonso de Córdova 3107
Vitacura, Casilla 19001
Santiago de Chile
Chile
44email: wdewit@eso.org
ACCRETION DISKS IN LUMINOUS YOUNG STELLAR OBJECTS
Abstract
An observational review is provided of the properties of accretion disks around young stars. It concerns the primordial disks of intermediate- and high-mass young stellar objects in embedded and optically revealed phases. The properties were derived from spatially resolved observations and therefore predominantly obtained with interferometric means, either in the radio/(sub)millimeter or in the optical/infrared wavelength regions. We make summaries and comparisons of the physical properties, kinematics, and dynamics of these circumstellar structures and delineate trends where possible. Amongst others, we report on a quadratic trend of mass accretion rates with mass from T Tauri stars to the highest mass young stellar objects and on the systematic difference in mass infall and accretion rates.
Keywords:
Accretion, accretion disks Techniques: high angular resolution Techniques: interferometric Stars: formation1 Introduction
Circumstellar disks are an essential ingredient of the star and planet formation process. They are found around young stars associated with molecular clouds at a high incidence rate (Hernández et al., 2007). A disk forms naturally from centrally infalling material under the influence of gravity and the redistribution of specific angular momentum by torques (Turner et al., 2014). The disk provides for continued accretion of material onto the growing star and, as such, is a key element of the accretion dynamics. In addition, the prevalent physical conditions within disks are conducive to the formation and growth of planetary bodies (Williams & Cieza, 2011). The disks around nearby solar-type stars have been studied to great extent and detail, but the number of disk studies of more distant, massive stars (of equivalent spectral type A and earlier) is comparatively small. Our knowledge of the physical properties of massive star disks is commensurately more uncertain. The aim of this review is to summarize and put in perspective our current knowledge of accretion disks around intermediate-mass (IM) and high-mass (HM) young stars. Our approach makes use of spatially resolved observations whenever possible in order to reliably identify and isolate circumstellar structures and evaluate their role in the accretion process. Such data are often obtained with interferometers. Resolved observations facilitate direct comparisons with the more nearby low-mass stars for which disks are readily spatially resolved. A review like the one presented here is justifiable because in recent years interferometers in the radio/(sub)millimeter (radio/mm) wavelength range, as well as those that operate in the optical/infrared (optical/IR) wavelength range have undergone substantial technical developments, which have resulted in significant improvements of the data quality and observational efficiency.
In the current era of the Atacama Large Millimeter Array (ALMA), (sub)millimeter interferometry probes angular scales of 10 milli-arcsecond at unprecedented sensitivity. Although such angular scales were already accessible with Very Long Baseline Interferometry (VLBI) techniques for non-thermal phenomena (e.g. maser emission), ALMA opens these scales for observing thermal processes. It unlocks thereby a plenitude of diagnostics for the physical conditions in all kinds of astronomical objects. Thermal processes are also accessed by optical/IR interferometric arrays, like for instance the Very Large Telescope Interferometer (VLTI, Mérand et al. 2014) and the Center for High Angular Resolution Astronomy array (CHARA, ten Brummelaar 2005). Their continual improvement and the development of new beam combining instrumentation have resulted in a strong increase of astronomical discoveries and advancements at 1–10 milli-arcsecond scale. Indeed, some of the current optical/IR facilities are now producing synthesized images in a similar way to those produced by radio/mm interferometers (Berger et al., 2012). A review of the astronomical progress from high angular resolution techniques across wavelength regimes condenses an already large literature volume on star and planet formation and is therefore a necessary and timely exercise.
In the field of Galactic star and planet formation, the angular resolution and sensitivity achieved by radio/mm and optical/IR interferometry (OI)111From here on, we will use assume OI to stand for the technique that performs real-time, square-law interferometry with separate telescopes and which covers both the optical and IR wavelength regimes. We will use the term radio/mm interferometry to indicate the heterodyne technique employing coherent amplification and product correlators (usually in the sub-mm, mm and cm wavelength regimes). allow us for the first time to investigate the phenomena that shape the circumstellar environment less than 100 au from an accreting star; a scale at which our understanding of the star and planet formation process is least certain (Armitage, 2011). Here important accretion disk processes are expected to take place and the interaction between the disk and the star to become manifest, especially for stars in the high-mass regime (Zinnecker & Yorke, 2007). Increased spatial resolution is crucial for star formation in the high-mass regime, where, due to the typical distances of the sources (1–2 kpc), the angular resolution achieved to date has proven to be insufficient to probe the close by circumstellar structure of the (proto)star222We will use the term (proto)star when referring to high-mass young stellar objects to highlight the fact that most of them have already reached the zero age main sequence but are still actively accreting.. In fact, and as we will summarize, the progress made in recent years by radio/mm and optical/IR interferometers has made important breakthroughs in the field of disks around IM and HM young stellar objects (YSOs). These have permitted to qualify and sometimes quantify disk properties and feed ideas regarding the formation of high-mass stars.
This observational review focuses on the properties of circumstellar disks of young high-mass stars, their evolution with time and their dependency on star mass as derived from spatially resolved observations. As most of the presented data is taken with interferometers, we provide a brief description of the basic principles behind astronomical interferometry in Sect. 2. For background purposes, we present a general vision of disks around young stars as a function of stellar mass, from the low- to the high-mass regime in Sect. 3. We refrain from detailing the fragmentation and core formation process in the earliest phases of star and planet formation (Bergin & Tafalla, 2007; McKee & Ostriker, 2007; André et al., 2014), but start the observational story of circumstellar disks from the Class 0 stage until the pre-main sequence phase for stars of early spectral type. Somewhat more technically, Sect. 4 describes the tracers and methods to derive the properties of disks with interferometric techniques alongside published examples. The bulk of the review in Sect. 5 constitutes a detailed characterization of disks of intermediate- and high-mass young stars in the early embedded phase and during the pre-main sequence. This collection of data forms the basis to discuss the properties of the disk and the mass accretion rate as a function of stellar mass and time, presented in Sect. 6. Finally we summarize our findings and provide an outlook of future instrumentation developments that will help to tackle the open issues in this area. The desired outcome of this review is an improved perspective of the evolution of young star circumstellar disks as function of time and mass.
2 Interferometry and synthesis imaging
In this partly didactical section, we briefly clarify principles and terminology related to astronomical interferometers and stellar interferometry. The section is motivated to provide the general reader with a better understanding of the reviewed interferometric data, as interferometry is (still) less commonly used by astronomers than standard techniques like spectroscopy. Although the physical principle behind optical/IR and radio/mm interferometry is the same, the respective implementations pose different challenges with their own technical solutions as we will briefly discuss next. We refer to Monnier & Allen (2012) for an extensive review on similarities and differences between optical and radio interferometric detection techniques.
2.1 The physical basis
Stellar interferometry works because individual (monochromatic) photons from a point source produce identical fringe patterns when the photon is interfered after propagating through two separate apertures. Yet, the interference patterns produced by photons coming from an extended source are shifted with respect to each other. The overlap of shifted fringe patterns from an extended source results in a lowering of the contrast (i.e. the visibility ) between the light and dark bands. This manifestation is a direct measure of the size of the luminous object, as first pointed out by Fizeau (1868). Therefore, any astronomical source seizes to be point-like when the distance between the apertures is large enough. The angular resolution of an instrument with a single aperture is diffraction-limited by its diameter , . On the other hand, the angular resolution of an aperture array (interferometer) is equivalent to that reached by an instrument the size of the entire array, , where is the maximum baseline between the apertures in the array. Typical maximum baselines range from a few 10 m to a few km for radio/mm interferometers, and from a few 10 m to a few 100 m for optical/IR interferometers. Because of that interferometers usually achieve a much higher angular resolution than that obtained by a single aperture operating at the same wavelength. In practice, astronomical interferometers are designed to measure the amplitude and phase of the visibility function . The observations aim to cover a range of baseline lengths and angles, where each combination corresponds to a point in the plane. The key notion of astronomical interferometry is that the measured 2-D visibility function corresponds to the Fourier transform of the source’s brightness distribution on the sky, .
Astronomical interferometers are used across the light spectrum, from optical to radio wavelengths making use of telescopes and antennas. Aperture synthesis, which is the technique that produces astronomical images from interferometric data, was first developed by radio astronomers and has been successfully used since the 1950s (see e.g., Ryle & Hewish 1960 and references therein). OI is technically quite demanding and this has resulted in the fact that the technique has been lifted from an experimental approach to a more common astronomical tool only during the first decade of this century. It is only recently that aperture synthesis imaging has been achieved in OI with separate apertures (Baldwin 1996).
2.2 Comparing optical/IR with radio/mm interferometry
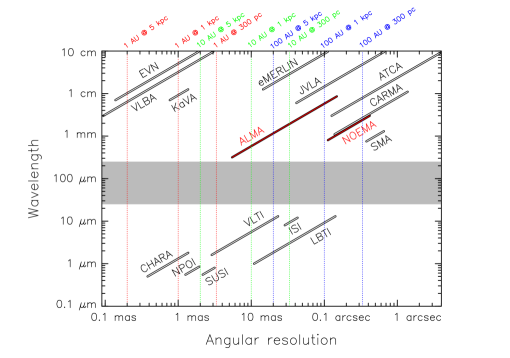
In astronomical interferometry the angular resolution of an array is determined by the largest baseline length. The image quality and the array sensitivity are strongly dependent on the total number of independent baselines and thus on the number of individual apertures (antennas or telescopes). The number of baselines for an array with apertures amounts to . The extensive experience with astronomical interferometers in the radio/mm range has resulted in the construction and successful operation of large (sub)millimeter arrays over the recent years. These arrays are exquisitely suitable for aperture synthesis: (1) the Plateau de Bure Interferometer (PdBI) has operated with 6 antennas and is currently being upgraded to include 12 antennas and renamed to NOEMA; (2) the Submillimeter Array (SMA) located on Mauna Kea has 8 dishes; and (3) the Combined Array for Research in Millimeter-wave Astronomy (CARMA) employs 23 antennas. The two most powerful (sub)millimeter arrays are the Jansky Very Large Array (JVLA) with 27 antennas, which operates at centimeter and 7 mm wavelengths and offers 351 baselines, and of course ALMA with 50 antennas that deliver a total of 1225 baselines for a single, instantaneous observation. In contrast, the current optical/IR arrays have only a small number of apertures resulting in a much less efficient filling of the plane. The optical array with the largest number of telescopes is currently the CHARA interferometer with 6 elements. This array also offers the longest baselines, delivering a spatial resolution below 1 milli-arcsecond (see Fig. 1). The most productive optical/IR interferometer to date is the VLTI which operates at NIR and MIR wavelengths. It is the only, so-called, large aperture optical interferometer currently in use. The VLTI can combine the light coming from either the four 8.2-m Unit Telescopes (UTs) or the four 1.8-m Auxiliary Telescopes (ATs) rendering the array as the most sensitive. Optical interferometers make use of both Earth rotation and movable telescopes to increase the coverage. Radio/mm interferometers rely on the high number of apertures to produce high fidelity astronomical images. On the other hand, in OI, physical interpretation of the high angular resolution data is mostly performed in Fourier space by fitting the visibility function to models in OI.
Some of the differences in the technical implementation of astronomical interferometry between radio/mm and optical/IR are caused by the differences in atmospheric properties between these two wavelength regimes. The effects of a turbulent atmosphere are much stronger at shorter optical wavelengths than at the long wavelength, radio end. In particular, the coherence time at optical/IR wavelengths is on the order of milliseconds and the Fried parameter (or coherence length) is tens of cm. This means that in practice wavefront restoration (e.g., by adaptive optics or monomode fibres) and stabilization of fringe positions on the detector (by a fringe-tracker) are required for exposures longer than milliseconds in optical/IR. The wavefront distortions are not important in the radio/mm range where the coherence time is on the order of minutes. The spatial scale of the atmospheric turbulence is also larger than the antenna size, and therefore it is possible to make use of phase referencing by switching between target and a nearby source with known fringe phase (i.e. the phase calibrator). In the optical domain this is not possible as the phase is subject to the atmospheric distortions. Yet, partial information on the fringe phase is retrieved by means of the so-called closure phase. This quantity can be extracted from the data when using three or more apertures. Otherwise, dual-beam interferometry and an accurate metrology like for narrow-angle astrometry can be employed (Malbet et al., 2000). Nonetheless, studies of the phase difference (or differential phase) between continuum and atomic line transitions in astronomical sources have proven to be powerful techniques in OI, allowing to measure photocentric displacement and asymmetries on angular scales of tens of micro-arcseconds (e.g. Wheelwright et al., 2012b).
In radio/mm interferometry, the actual detection of the photon occurs at the antenna by means of the heterodyne technique. In this technique, the in-coming signal is coupled to an extremely stable reference signal and amplified. One records the resulting amplitude and phase of the mixed wave. The sinusoidal signals of each antenna are then digitized and cross-correlated by electronics in the correlator. The resulting interference signal, which consists of the visibility amplitude and phase, depends only on the geometry of the antenna pair in relation to the source. The nature of optical light is such that the signal cannot be stored and amplified with conservation of the photon’s phase (e.g., Oliver 1965). As a result, a heterodyne technique and a post-detection, electronic cross-correlation process as implemented in the radio/mm is simply not possible; the phase of the optical photon is randomnized in the amplification process333The boundary wavelength between the techniques is m.. In OI, the photon that propagates through two (or more) telescopes needs to be recombined in the same place (the detector) at the same time. To achieve this, one requires: (1) a light-path delay system in order to cancel out the difference in path length between telescopes; and (2) a dedicated instrument that performs the actual light-beam combination and final detection of the fringes. The beam-combiner splits the incoming light from each telescope as each ‘photon’ can only be used once (unlike the radio case). For example, in a three telescope beam combiner the light from each telescope is split in two to allow combination with the other telescopes.
Figure 1 shows the maximum angular resolution provided by the different interferometers operating at the different wavelength domains. As seen in this figure, the maximum angular resolution obtained at radio/mm and optical/IR wavelengths is quite similar if one takes into account VLBI techniques. In such a case, the angular resolution in the radio/mm regime can be as high as 1 micro-arsecond. Otherwise, the maximum angular resolution is 5 milli-arcsecond and is achieved by ALMA at the shortest wavelength (0.35 mm; Band 10) and largest configuration (15 km). This angular resolution is similar to the angular resolution offered by, e.g. the VLTI. This complementarity is of interest to high-mass star formation studies in, for example, uniting hot accretion physics with the cold disk physics aiming for a complete picture of a massive star accretion disk.
3 Disks along the stellar mass sequence
This section provides the reader with background to the study of young stars and their disks. It follows the established division of (young) stars in three separate stellar mass intervals to which we adhere. These are the low-, the intermediate- and the high-mass intervals. The dividing mass values that separate the three groups are 2 and 8 M⊙. The upper mass threshold that identifies the high-mass stars follows from (1) the limiting mass for which a pre-main sequence (PMS) phase can be observationally identified and (2) the mass at which the effective surface temperature produces ultraviolet photons able to ionize significantly the young star’s environment. The lower mass threshold is somewhat arbitrary. It has some relation to convective and radiatively stable stellar interiors during the PMS contraction phase. The character of the stellar interior affects the topology of the surface magnetic field which is an important ingredient in the accretion process. We will review the properties of disks of intermediate-mass and high-mass (proto)stars in detail in Section 5, while here we describe in broad lines the characteristics of the young stars and their disks according to mass.
3.1 Disks in low-mass YSOs
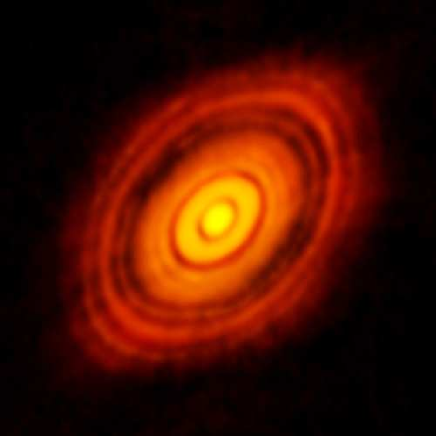
Circumstellar disks of young stars were imaged for the first time by the Hubble Space Telescope. Its superior spatial resolution produced a detailed view of elongated structures and dark, dusty lanes associated with the low-mass stars in M 42 (O’Dell & Wen, 1993). These high angular resolution observations in the optical confirmed however the conclusions of a series of low resolution, millimeter ( e.g., Beckwith et al., 1990) and infrared (e.g., Cohen et al., 1989) observations performed in the 80s. The strong IR excess discovered by the InfraRed Astronomical Satelite (IRAS) in non-mass losing stars like Vega and Pictoris, reinforced the notion of detectable proto-planetary systems made from the prenatal cloud (Aumann et al., 1984). These studies indicated that the shape of the dusty structures surrounding young stars is necessarily non-spherical. A relatively high mass measured for the dust structures combined with a low visual extinction seen towards these stars can only mean that the dust is confined to a limited solid angle from the vantage point of the central star (Beckwith et al., 1990). The angular resolution and sensitivity of times past contrast starkly with the enormous wealth of information at hand in the recent ALMA observations of HL Tau using the longest array baselines (15 km). The ALMA Long Baseline Campaign confirms unequivocally the conclusions drawn in the 80s that protoplanetary disks must be present. Courtesy of ALMA, the most detailed millimeter image of a protoplanetary disk around a young solar-type star is depicted in Fig. 2. The disk is characterized by an impressive, yet anticipated, series of rings and gaps that could indicate the presence of forming planets (Partnership ALMA 2015).
The evolution of the disk, its connection to the larger molecular envelope and to the inner central star is cornerstone to our understanding of star and planet formation. From a functional point of view, the disk provides a way for potential energy to be converted into radiation and kinetic energy and thereby powering dynamical phenomena such as collimated jets and winds. The protoplanetary disk is the vehicle with which matter is brought to the stellar surface as close as possible and finally deposited on to it. Accretion of this material is envisaged to be magnetically controlled. A structured magnetosphere links the disk material to the star surface by accretion funnel flows anchored in the disk at the radius where the stellar magnetic field pressure is overcome by the ram pressure of the inflowing material. This happens approximately at the co-rotation radius. The material is lifted up from the disk and travels at nearly free-fall velocity to the star, where it creates a shocked hot spot (Hartmann, Hewett & Calvet 1994). This magnetic view of accretion in protoplanetary disks finds support by many observations as is overviewed in e.g., Bouvier et al. (2007).
Basic properties of the low-mass star disks such as size, mass and velocity field have been determined from high-angular resolution observations in the optical and the sub-millimeter (e.g., Beckwith et al., 1990; Burrows et al., 1996; Padgett et al., 1999). In such studies, the dust continuum and/or gas emission of the disk reveal typical radii of 100–300 au. However, low-mass star disks have been detected with radii as large as 700–800 au (e.g., Piétu et al., 2007; Andrews & Williams, 2007). The disk masses traced by dust continuum emission at millimeter and sub-millimeter wavelengths range from 10-3–10-1 (Williams & Cieza, 2011). Interferometric molecular line emission observations of low-mass YSOs have revealed that the velocity field of the circumstellar disks is consistent with Keplerian rotation (e.g., Simon et al., 2000; Piétu et al., 2007), even for the youngest Class 0 objects, as recently confirmed by CARMA and ALMA observations (L1527 IRS: Tobin et al., 2012; Ohashi et al., 2014; VLA 1623: Murillo et al., 2013; HH 212: Lee et al., 2014; Codella et al., 2014).
3.2 Disks in intermediate-mass YSOs
Arguably the best view of the formation and evolution of accretion disks in star formation we owe to IM stars. This mass range covers stars with Zero Age Main Sequence (ZAMS) masses of 2 to 8 , corresponding to bolometric luminosities of 50–2000 . The A and B-type stars comprising the IM range carry a special importance as they form the transitional group for various stellar astrophysical phenomena. For example, the IM range covers the transition in star formation between isolated and clustered formation, in stellar interiors between convective and radiative interiors and in stellar angular momentum evolution between slow and fast rotators. For disk studies, the IM stars offer observational advantages as the stars are bright and relatively close-by rendering the disks bright at most wavelengths while subtending a large solid-angle on the sky. Importantly and similar to what has been demonstrated for the solar-type stars, the existence of circumstellar disks in the embedded protostellar phase has been established unambiguously by observations (Zapata et al., 2007; Sánchez-Monge et al., 2010; van Kempen et al., 2012; Takahashi et al., 2012). The properties of these IM star disks are similar to those of their lower-mass counterparts (Beltrán, 2015). However, whether they are in Keplerian rotation is still a matter of debate (Sánchez-Monge et al., 2010).
The disks persist well into the PMS phase (see e.g., Mannings, 1994; Mannings et al., 1997), although it is believed that the mass delivered to the star in this phase is only a small fraction of the final star mass. Yet the process of depositing material onto the stellar surface and the related phenomena like jet and disk-wind generation, the structure of the disk and the question of how the disk disperses can all be investigated in detail along the PMS evolution of IM stars. Moreover, as the central stars can be age-dated by means of evolutionary tracks, the time evolution of the disk can be determined.
The best examples of IM PMS stars are the Herbig Ae/Be (HAeBe) stars (Herbig, 1960; Strom et al., 1972; Hillenbrand et al., 1992). They are relatively easily identifiable by optical spectra, their spectral energy distributions (SEDs) with near-IR excess by dust emission, and their association with dark or scattering nebulae on scales of tens of arcsecond. The HAeBe stellar group (e.g. The et al., 1994) has been instrumental in establishing detailed properties of disks. The dominance of circumstellar dust emission is the base for the group I/II subdivision among this class (Meeus et al., 2001). The sub-division finds a physical basis in the structure of the disk, where group I sources have mid-IR bumps produced by a flared disk and group II sources lack this emission and are suspected of having geometrically flat disks. This SED based idea is found to be consistent with resolved observations using mid-IR interferometry (Leinert et al. 2004, Di Folco et al. 2009). Such spatially resolved mid-IR observations also provide an increase in the number of HAeBe disks with evidence for gaps, i.e., near discontinuous jumps in the radial density distribution (Panić et al., 2014; Matter et al., 2014). A correlation is emerging between the presence of gaps and the flared geometry of the disk (Maaskant et al., 2013). This is furthermore supported by near-IR scattered light images of the outer disk, where the group II disks are rather featureless, while the group I sources show the hallmarks of ongoing dispersal, like multiple spiral arms, disk gaps, pericentre offsets, and asymmetric shadowing of the outer disk favouring dynamical clearing by sub-stellar objects (see the overview by Grady et al., 2015).
3.3 Disks in high-mass YSOs
The picture and the role of accretion disks in young stellar objects become increasingly unclear for the higher mass (proto)stars. The high-mass adjective in our context applies to objects with ZAMS masses of and upwards and corresponds to OB-type stars with a limiting spectral type B 3V. Among this class of stars, the very existence of disks during the formation phase has been under debate. According to established PMS theory and the related idea of the stellar birthline (Stahler et al., 2000), stars more massive than 8 reach the ZAMS still deeply embedded in their molecular surroundings. Stellar winds and radiation pressure from the newly formed early-type star may halt the infall of material (in case of spherical symmetry), thus preventing further growth of the protostellar nucleus (Kahn, 1974; Wolfire & Cassinelli, 1987). In the past years, different theoretical scenarios have been proposed as possible solutions for the formation of OB-type stars, from non-spherical accretion (Nakano et al., 1995; Jijina & Adams, 1996) to stellar mergers (Bonnell et al., 1998). However the theoretical ideas appear to converge to a disk-mediated accretion scenario nonetheless. In fact, models suggesting massive star-formation initiated by a monolithic collapse of a turbulent molecular core (McKee & Tan, 2002; Krumholz et al., 2009), those based on competitive accretion for core material (Bonnell & Bate, 2006), and those that propose Bondi-Hoyle accretion for the growth of the star (Keto, 2007) all predict the existence of a circumstellar accretion disk (see Tan et al., 2014, for a review of high-mass star-formation mechanisms). This is hardly surprising as the disk is a natural mechanism to redistribute angular momentum.
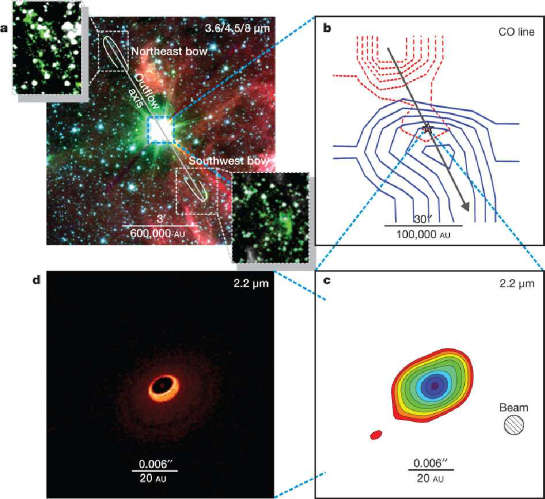
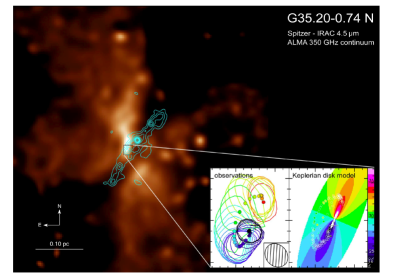
From an observational point of view, a growing number of disk candidates have been detected around high-mass YSOs in recent years. It should however immediately be clarified that the accumulated evidence for disks in young OB stars does not extend to stars beyond a mass limit of 25–30 or 10. The disks of these sources (of early-B and late O-type) have been spatially resolved using line and continuum tracers from infrared to centimeter wavelengths (e.g., IRAS 20126+4104: Cesaroni et al., 2005, 2014; Cepheus A HW2: Patel et al., 2005; IRAS 134816214: Kraus et al., 2010, see Fig. 3; CRL 2136: de Wit et al., 2011). The kinematics of the high-density gas towards B-type (proto)stars has been studied at high-angular resolution () only for a handful of sources. However, for these few YSOs, molecular line observations reveal that the velocity field, like for their low-mass counterparts, would be consistent with Keplerian rotation (e.g., IRAS 20126+4104: Cesaroni et al., 2005, 2014; AFGL 2591 VLA3: Wang et al., 2012a; G35.200.74N B: Sánchez-Monge et al., 2013, 2014, see Fig. 4; G35.03+0.35: Beltrán et al., 2014). Moreover, for those massive YSOs that are bright enough in K-band, the kinematics has been investigated by means of the line profiles of CO first overtone transitions in the NIR(Bik & Thi, 2004; Blum et al., 2004). The CO bandhead profile is successfully reproduced by emission from material in Keplerian rotation in the inner few astronomical units from the central star (Ilee et al., 2013). That the CO molecules are in Keplerian rotation around the star can also be concluded from the astrometric drift of the photocenter as function of the velocity resolved bandhead emission. The drift was measured on sub-milliarcsecond angular scales (Wheelwright et al., 2010) and provides strong evidence for the presence of disks on linear scales of a few au near embedded early-B and late-O type stars.
For stars of the highest stellar mass (), the existence of circumstellar disks has remained elusive up to now. This observational result is probably unsettling for theory and simulations that show that radiation pressure does not prevent disk accretion to form stars up to 140 (Krumholz et al., 2009; Kuiper et al., 2010). However the problem maybe more serious in that no genuine (proto)star is currently known that would constitute an accreting hydrostatic object with a mass over this limit. Nonetheless, huge (0.1 pc), dense ( cm-3), massive (a few 100 ), rotating cores have been detected around early O-type (proto)stars in studies performed at spatial resolutions attainable before the advent of ALMA. These objects are in all likelihood non-equilibrium structures enshrouding young stellar clusters and not merely individual massive stars (see Cesaroni 2007; Beltrán et al., 2011 and references therein). These rotating structures are referred to as toroids, so as to distinguish them clearly from accretion disks in Keplerian rotation which they clearly cannot be (e.g., Beltrán et al., 2005). The open question is whether higher angular resolution observations with ALMA will demonstrate the presence of circumstellar (or circumcluster) disks interior to the rotating toroids.
Our knowledge of the formation of the most massive stars is incomplete and it is uncertain whether these stars conform to the disk-mediated accretion scenario. Milli-arcsecond resolution studies will be able to shed more light on the accretion dynamics of the high-mass stars. In particular and under the assumption that accretion onto a low-mass object be universal, a growing object should produce a jet-driven outflow very soon in its evolution. Could the launching of the ouflow be quenched initially by the massive envelope or the prevalent strong gravitational forces? What would be the influence of the irradiation of the disk by a high-mass star and how tenacious is the disk in withstanding this additional eroding force? Because of the accumulating evidence for disks in stars with masses less than 30 and the lack of evidence of disks for stars above this threshold, we will discuss these issues and related questions for both groups separately in Sect. 5.
4 Deriving properties of YSO disks
Disks around IM and HM (proto)stars are deeply embedded in the innermost part of the surrounding infalling envelopes. As a result, identifying candidate accretion disks, especially around embedded HM (proto)stars, requires a careful selection of targets and tracers to overcome the problems related to the nature of massive star-forming regions. The most important of these are the large distances, the high dust extinction factors, the high multiplicity that characterizes these stars, and the complexity of the environment typical of the clustered mode of high-mass star formation. The onset of the clustered mode of star formation becomes manifest among the intermediate-mass A and B-types (Testi et al., 1999) and only few O-type stars may form in isolation (de Wit et al., 2005). The increasingly shorter time-scale of formation compounded with the shape of the IMF results in low probabilities of finding a Class 0 massive (proto)star or massive starless cores. Moreover, the clustered formation mode makes it very difficult to trace back the physical characteristics of the parent cloud and to derive the initial conditions for massive star formation. To overcome these problems, high-sensitivity and high-angular resolution observations are needed to study the earliest phases of IM and HM (proto)stars. True accretion disks are probably spawned at the radius where the centrifugal force of the infalling envelope is balanced by gravity (Terebey et al., 1984). Resolved observations of Keplerian disks near IM young stars with ALMA show outer radii of a few times 100 au (e.g. Pineda et al. 2014). Resolving such structures around HM (proto)stars requires sub-arcsecond angular resolution already for the Orion molecular cloud, the nearest high-mass star-forming (HMSF) region at 410 pc. The situation is slightly more favourable for IM protostars, but even for them, minimal typical distances are 300 pc. In Sect. 4.1 we discuss the tracers used to identify disks around IM and HM (proto)stars from near-IR to centimeter wavelengths.
| Core | (kpc) | () | () | (au) | () | (/yr) | Refs.d | |
|---|---|---|---|---|---|---|---|---|
| Serpens FIRS 1 | 0.31 | 46 | 0.1 | 65 | 2.5 | — | 1 | |
| OMC-2/3–MM6 Main | 0.414 | 60 | 0.32 | 500 | 2.6 | 2.4 | 2 | |
| L1641 S3 MMS1 | 0.465 | 70 | 7.6 | 400 | 2.7 | — | 3 | |
| Cepheus E | 0.73 | 78 | 1.4 | 440 | 2.8 | 2.0 | 4, 5 | |
| OMC-2/3–MM7 SMM | 0.414 | 99 | 1.3 | 370 | 3.0 | — | 6, 7 | |
| IRAS 20050+2720 A | 0.70 | 280 | 5.6 | 1650 | 4.0 | 2.7 | 8, 9 | |
| IRAS 22198+6336 MM2 | 0.76 | 370 | 0.95 | 200 | 4.2 | 4.9 | 10, 11 | |
| IC1396N BIMA2 | 0.75 | 440 | 0.36 | 110 | 4.4 | 7.5 | 12, 13 | |
| NGC 2071 A (IRS 3) | 0.422 | 440 | 0.27 | 100 | 4.4 | — | 3, 14 | |
| NGC 2071 B (IRS 1) | 0.422 | 440 | 0.23 | 100 | 4.4 | — | 3, 14 | |
| H288 | 2.0 | 480 | 12.4 | 3000 | 4.4 | 2.2 | 15 | |
| IRAS 00117+6412 MM1 | 1.8 | 500 | 2.0 | 1700 | 4.5 | 4.5 | 16 | |
| NGC7129 FIRS 2 | 1.25 | 500 | 2.7 | 400 | 4.5 | 3.8 | 10, 17, 18 | |
| IRAS 00117+6412 MM2 | 1.8 | 600 | 1.6 | 1800 | 4.7 | — | 16 | |
| IRAS 22172+5549 MM2 | 2.4 | 800 | 2 | 750 | 5.1 | 7.7 | 14, 19 | |
| OMC-2 FIR4 | 0.42 | 920 | 5.0 | 2000 | 5.4 | — | 20, 21, 22 | |
| CB3-1 | 2.5 | 930 | 0.66 | 600 | 5.4 | — | 23, 1 | |
| CB3-2 | 2.5 | 930 | 0.25 | 330 | 5.4 | — | 23, 1 | |
| S235 NE–SW core A | 1.8 | 1000 | 30 | 6600 | 5.4 | 2.0 | 24, 25 | |
| IRAS 20293+3952 A | 2.0 | 1050 | 8.8 | 1800 | 5.5 | 7.0 | 26, 27 | |
| L1206 | 0.91 | 1200 | 12 | 1600 | 5.6 | 5.5 | 28 | |
| IRAS 05345+3157 C1-a | 1.8 | 1400 | 2.0 | 1850 | 6.0 | 8.7 | 29 | |
| IRAS 05345+3157 C1-b | 1.8 | 1400 | 0.35 | 1650 | 6.0 | — | 29 | |
| IRAS 05345+3157 C2 | 1.8 | 1400 | 1.6 | 1340 | 6.0 | — | 29 | |
| IRAS 23385+6053 | 4.9 | 1500 | 28.5 | 2700 | 6.1 | 2.3 | 30, 31 | |
| IRAS 20343+4129 IRS 1 | 1.4 | 1500 | 0.73 | 2800 | 6.1 | 8.7 | 32 | |
| AFGL 5142 MM1 | 1.8 | 2300 | 4.4 | 520 | 7.2 | 4.7 | 14, 33 | |
| AFGL 5142 MM2 | 1.8 | 2300 | 3.2 | 320 | 7.2 | — | 14 | |
| OMC1-S 139409 | 0.460 | 1e | 0.14f | 120f | 12 | — | 34 | |
| OMC1-S 134411 | 0.460 | 1e | 0.20f | 80f | 12 | — | 34 |
Notes:
a Masses estimated assuming the dust opacities of Ossenkopf & Henning (1994);
b Masses estimated from the simulated clusters (see § 4.5);
c Outflow parameters corrected for opacity and assuming a mean inclination angle of the outflow of 32.7∘;
d References for the core parameters:
1: Fuente et al. (2007);
2: Takahashi et al. (2012);
3: van Kempen et al. (2012);
4: Moro-Martín et al. (2001);
5: Froebrich et al. (2003);
6: Takahashi et al. (2008);
7: Takahashi et al. (2013);
8: Beltrán et al. (2008);
9: Froebrich (2005);
10: Sánchez-Monge et al. (2010);
11: Palau et al. (2011);
12: Neri et al. (2007);
13: Beltrán et al. (2002);
14: Palau et al. (2013);
15: Gueth et al. (2001);
16: Palau et al. (2010);
17: Fuente et al. (2001);
18: Fuente et al. (2005);
19: Fontani et al. (2004a);
20: Kim et al. (2008);
21: Crimier et al. (2009);
22: López-Sepulcre et al. (2013);
23: Launhardt & Henning (1997);
24: Felli et al. (2004);
25: Saito et al. (2008);
26: Palau et al. (2007a);
27: Beuther et al. (2004);
28: Beltrán et al. (2006c);
29: Fontani et al. (2009);
30: Fontani et al. (2004b);
31: Molinari et al. (1998);
32: Palau et al. (2007b);
33: Zhang et al. (2007); 34: Zapata et al. (2007);
e Bolometric luminosity of the whole OMC1-S region.
f and estimated with CH3CN at 1.3 mm. At 7 mm, Zapata et al. (2007) have resolved the 1.3 mm
continuum emission towards both IM protostars OMC1S 139–409 and 134–411 into two
compact binary systems with radii of 20–25 au and masses 0.1 .
| Core | (kpc) | () | () | (au) | (km s-1) | () | () | (km s-1) | (/yr) | Refs.e | |
|---|---|---|---|---|---|---|---|---|---|---|---|
| IRDC 182231243 | 3.7 | 1 | 47 | 14000 | 1.5 | — | — | 1.8 | 5.5 | 1 | |
| NGC6334 I(N) SMA1b | 1.3 | 1 | 4.3 | 800 | 3.5 | — | 5.5 | 8.8 | — | 2, 3 | |
| AFGL 490 | 1.0 | 2 | 4.1 | 1600 | 1.3 | 8–10g | 7 | 3.0 | — | 4, 5 | |
| G192.163.82 | 2.0 | 3 | 11 | 2100 | 3.0 | 8 | 8 | 1.5 | 3.8 | 6, 7, 8, 9 | |
| IRAS 04579+4703 | 2.5 | 4 | 8 | 5000 | 1.0 | 7 | 8.5 | 3.6 | 1.7 | 10, 11, 12 | |
| GH2O 92.67+3.07 | 0.80 | 4.7 | 12h | 7200 | 1.2 | 6i | 9 | 3.0 | 2.7 | 13 | |
| G35.03+0.35 A | 3.2 | 6.3 | 0.75 | 2200 | 2.0 | 11 | 10 | 8.5 | — | 14 | |
| IRAS 20126+4104 | 1.7 | 1 | 0.9 | 3600 | 1.3 | 7–10g | 12 | 3.0 | 1.3 | 15, 16, 17 | |
| G23.010.41 | 4.6 | 1 | 41 | 6000 | 0.6 | 18 | 12 | 8.3 | 2.0 | 18, 19, 20 | |
| NGC7538S MM2 | 2.7 | 1.5 | 5.0 | 1000 | 1.0 | — | 13 | 4.0 | — | 21 | |
| AFGL 2591 VLA3 | 1.0 | 2 | 0.41 | 400 | 2.2 | 16 | 14 | 1.5 | — | 22, 23 | |
| IRAS 181622048 MM1 | 1.7 | 2 | 4.9 | 800 | 2.0 | — | 14 | 5.5 | — | 24 | |
| IRAS 181511208 | 3.0 | 2 | 43 | 5000 | 2.0 | 15 | 14 | 1.9 | — | 25, 26, 27 | |
| G16.590.05 | 4.7 | 2 | 75 | 600 | 7.2j | — | 14 | 5.6 | 3.8 | 19, 28, 29 | |
| S255IR SMA1 | 1.59 | 2 | 3.8 | 1850 | 1.0 | — | 14 | — | 6.2 | 30 | |
| Cepheus A HW2 | 0.725 | 2.5 | 2.2 | 360 | 3.5 | 15 | 15 | 4.0 | 1.7 | 31, 32, 33, 34 | |
| G35.20+0.74 N A | 2.19 | 3 | 1.0 | 1500 | 1.5 | — | 16 | 4.5 | — | 35 | |
| G35.20+0.74 N B | 2.19 | 3 | 0.9 | 2600 | 1.0 | 18g | 16 | 2.8 | — | 35 | |
| IRAS 180891732 | 3.6 | 3.2 | 68 | 3600 | 3.0 | — | 16.6 | 6.0k | — | 36, 37, 38 | |
| G240.31+0.07 | 5.3 | 3.2 | 133 | 10000 | 2.5 | — | 16.6 | 1.7 | 6.4 | 39, 40, 41 | |
| G24.78+0.08 C | 7.7 | 3.3 | 95l | 3500l | 0.5 | — | 17 | 3.5 | 4.7 | 42, 43, 44 | |
| G24.78+0.08 A1 | 7.7 | 3.3 | 130m | 4600m | 1.5 | 18 | 17 | 7.0 | — | 42, 43, 44 | |
| G24.78+0.08 A2 | 7.7 | 3.3 | 87n | 3500n | 0.75 | — | 17 | 7.0 | 2.3 | 42, 43, 44 | |
| IRAS 165474247 | 2.9 | 6.2 | 22 | 1500 | 1.7 | — | 21 | 7.6 | — | 18, 45, 46 | |
| IRAS 165623959 | 1.7 | 7 | 7.6 | 3000 | 2.2 | — | 22 | 5.0 | — | 47 | |
| NGC7538 IRS 1 | 2.7 | 8 | 18 | 1000 | 3.0 | 30 | 23 | 10.0 | — | 21, 48, 49 | |
| IRAS 18566+0408 | 6.7 | 8 | 263 | 7000 | 3.0 | 25 | 23 | 8.3 | 2.3 | 18, 50, 51 | |
| IRAS 23151+5912 | 5.7 | 1 | 11 | 2150 | 3.0 | 8 | 25 | 6.2 | 3.6 | 52, 53, 54 | |
| W33AMM1 Main | 3.8 | 1 | 16 | 1900 | 3.0 | — | 25 | 6.8 | 5.6 | 55 | |
| NGC6334I SMA1 Main | 1.7 | 1 | 37 | 280 | 5.1 | — | 25 | 8.0 | — | 2, 56 | |
| IRAS 183600537 MM1 | 6.3 | 1.2 | 124 | 22000 | 1.5 | — | 27 | 3.4 | 1.1 | 12, 57 | |
| W3 IRS 5 | 2.0 | 2 | 13.4 | 2000 | 2.5 | — | 32 | 4.5 | — | 58, 59 | |
| G28.87+0.07 | 7.4 | 2 | 78 | 6000 | 0.5 | — | 32 | 9.1 | 1.1 | 19, 28 | |
| G31.41+0.31 | 7.9 | 3 | 653 | 3600 | 2.5 | 25o | 38 | 8.0 | — | 42, 43, 60, 61, 62 | |
| G10.620.38 | 3.5 | 4 | 80 | 3400 | 2.1 | — | 42 | 6.0 | — | 63 | |
| G20.080.14N | 12.3 | 6.6 | 28 | 5000 | 3.5 | 25 | 52 | 8.2 | 3.9 | 64, 65 | |
| G29.960.02 | 6.2 | 8 | 88 | 4000 | 1.6 | 33 | 56 | 9.0 | 7.8 | 63, 66 | |
| W51e8 | 5.4 | 1.5 | 116 | 8200 | — | 75 | 9.0 | — | 18, 67 | ||
| W51e2 E | 5.4 | 1.5 | 157 | 8000 | 2.5 | 15 | 75 | 8.0 | 1.6 | 18, 67, 68, 69 | |
| G19.610.23 | 12.6 | 2.2 | 401 | 6300 | 1.0 | — | 80 | 10.0 | 3.9 | 63 | |
| W51 North | 6.0 | 3 | 248 | 20000 | 1.5 | — | 87 | 8.0 | 1.7 | 70, 71, 72 |
Notes:
a Masses estimated assuming the dust opacities of Ossenkopf & Henning (1994);
b estimated from the Lyman-continuum photons (see § 4.5);
c Masses estimated from the simulated clusters (see § 4.5);
d Outflow parameters corrected for opacity and assuming a mean inclination angle of the outflow of 32.7∘;
e References for the core parameters:
1: Fallscheer et al. (2009);
2: Beuther et al. (2008);
3: Hunter et al. (2014);
4: Schreyer et al. (2002);
5: Schreyer et al. (2006);
6: Shepherd et al. (2001);
7: Liu et al. (2013);
8: Shepherd et al. (2004);
9: Shepherd et al. (1998);
10: Sánchez-Monge et al. (2008);
11: Xu et al. (2012);
12: Molinari et al. (1996);
13: Bernard et al. (1999);
14: Beltrán et al. (2014);
15: Cesaroni et al. (2005);
16: Shepherd et al. (2000);
17: Cesaroni et al. (2014);
18: Hernández-Hernández et al. (2014);
19: Furuya et al. (2008);
20: Sanna et al. (2014);
21: Beuther et al. (2012);
22: Wang et al. (2012);
23: van der Tak & Menten (2005);
24: Fernández-López et al. (2011);
25: Fallscheer et al. (2011);
26: Watt & Mundy (1999);
27: Tackenberg et al. (2014);
28: Rosero et al. (2013);
29: Sanna et al. (2010);
30: Wang et al. (2011);
31: Patel et al. (2005);
32: Torrelles et al. (1996);
33: Comito et al. (2007);
34: Gómez et al. (1999);
35: Sánchez-Monge et al. (2014);
36: Beuther & Walsh (2008);
37: Beuther et al. (2005);
38: Beuther et al. (2002a);
39: Qiu et al. (2009);
40: Qiu et al. (2014);
41: Chen et al. (2007);
42: Beltrán et al. (2004);
43: Beltrán et al. (2005);
44: Beltrán et al. (2011b);
45: Rodríguez et al. (2008);
46: Franco-Hernández et al. (2009);
47: Guzmán et al. (2014);
48: Campbell & Thompson (1984);
49: Mallick et al. (2014);
50: Zhang et al. (2007);
51: Carral et al. (1999);
52: Beuther et al. (2007);
53: Rodríguez-Esnard et al. (2014);
54: Qiu et al. (2007);
55: Galván-Madrid et al. (2010);
56: Hunter et al. (2006);
57: Qiu et al. (2012);
58: Rodón et al. (2008);
59: Wang et al. (2013);
60: Girart et al. (2009);
61: Cesaroni et al. (2011);
62: Osorio et al. (2009);
63: Beltrán et al. (2011a);
64: Galván-Madrid et al. (2009);
65: Yu & Wang (2013);
66: Beltrán et al. (2013);
67: Klaassen et al. (2009);
68: Gaume et al. (1993);
69: Shi et al. (2010);
70: Zapata et al. (2008);
71: Zhang & Ho (1997);
72: Zapata et al. (2009);
f The bolometric luminosity is low because this object is an IRDC and therefore in a very early evolutionary phase.;
g estimated from the fitting of the velocity field assuming Keplerian rotation;
h The mass of this core has been estimated from CS (Bernard et al., 1999);
i estimated from the mass infall rate and the dynamical age of the outflow;
j estimated from CH3OH maser emission;
k estimated from single-dish observations (Beuther et al., 2002a).
l Beltrán et al. (2011b) estimated a mass of 22–48 (for a dust opacity of 1 cm2 g-1) and a radius of
1500 au with PdBI and SMA higher angular resolution () observations.
m Beltrán et al. (2011b) estimated a mass of 13 (for a dust opacity of 1 cm2 g-1) and a radius of
1800 au with PdBI and SMA higher angular resolution () observations.
n Beltrán et al. (2011b) estimated a mass of 18 (for a dust opacity of 1 cm2 g-1) and a radius of
2700 au with PdBI and SMA higher angular resolution () observations.
o estimated from SED modeling.
p Upper limit because estimated from the OCS velocity gradient that could be contaminated by outflow emission (Klaassen et al., 2009).
Spatially resolved observations characterize YSO disks according to a number of basic quantities: (1) inner and outer radius; (2) radial profiles of scale height and surface density; (3) total mass; and (4) mass accretion rate. These quantities change and evolve with stellar mass, envelope mass, the evolutionary stage or YSO class, and bolometric luminosity. Our knowledge of the evolution of disks, especially around young, embedded IM and HM (proto)stars, in terms of the above mentioned four properties is currently quite sparse, hampered by insufficient resolution and sensitivity. It is not clear yet when in the star-formation process the disk forms and becomes the vehicle of mass and angular momentum transport. The disk could already be established during the Class 0 phase of a low-mass object. The properties of optically revealed pre-main sequence disks of low- and intermediate-mass stars are better known. Yet for the HM (proto)stars, an extensive disk census combined with detailed disk views needs to be established with forthcoming observations. In Sect. 4.2 to 4.7 we describe the predominantly interferometric methods employed that allow to derive disk properties.
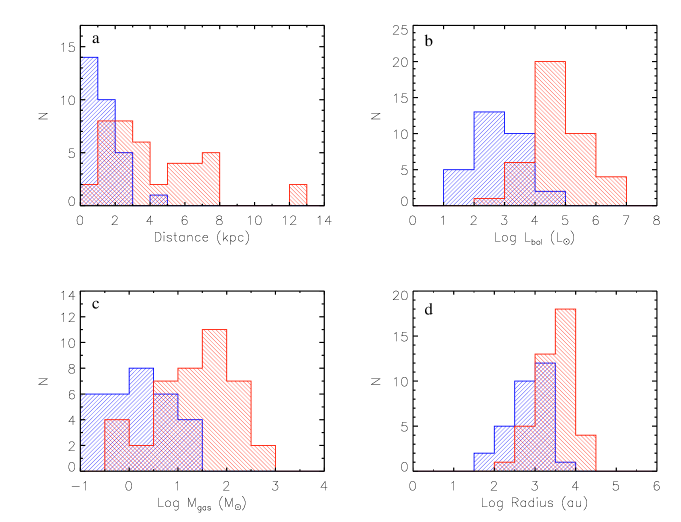
To analyze the properties of disks around massive embedded (proto)stars in a statistical way, we have compiled a list of IM and HM disk candidates from different studies based on (sub)millimeter interferometric observations. As explained before, because of the distance and complexity of IM and HM star-forming regions, high-angular resolution observations are needed to distinguish the emission of different embedded sources and to better trace the properties of their surrounding structures. What is more, interferometric observations have the advantage of limiting the contribution of the surrounding envelopes to the estimated quantities, because some (most) of the extended envelope emission is being filtered out by the interferometer if short-spacing information is not available. Table 1 shows the distance , bolometric luminosity , mass , radius , and mass of the central star for the rotating structures found around IM disk candidates. Table 2 shows the same properties and includes also the rotation velocity and line width for the HM disk candidates. Figure 5 shows the histograms of , , , and for the IM and HM (proto)stars in the tables. Table 2 also shows the stellar mass of the HM sources estimated in two different ways: from the Lyman-continuum photons when available, , and from simulated clusters, (see Section 4.5).
We have searched the literature for interferometric observations of molecular outflows for the candidate disk IM and HM sources. High-angular resolution observations are necessary to disentangle the emission of possible different outflows powered by different sources in these very clustered environments. Because for some molecular outflows the parameters have been corrected for inclination angle and for others the inclination angle is not known, we have decided to assume a mean inclination angle of 32.7∘ with respect to the plane of the sky (Bontemps et al., 1996) for all the outflows. Therefore, the parameters of all the outflows were re-calculated assuming this inclination angle. Regarding the opacity of the emission, we applied a correction factor of 3.5 (Cabrit & Bertout, 1992) to the parameters of those outflows observed with (partially) optically thick tracers, like for example 12CO, and not corrected for opacity. Tables 1 and 2 show the corrected values of the mass loss rate for HM and IM disk candidates, respectively.
4.1 Disk tracers
When searching for disks around IM and HM (proto)stars at millimeter wavelengths, optically thin and high-density tracers are required because the structure is relatively hot and dense. Cesaroni et al. (2007) discuss the main techniques used to search for disks in HM YSOs and categorize them in: continuum emission, thermal line emission, and maser emission. Based on the fact that the dust in the disk emits as a grey-body peaking at 100 m, continuum observations from IR to (sub)millimeter wavelengths have been performed to search for disks around IM and HM (proto)stars. Because of the high visual extinctions of the HM star-forming regions, observations in the NIR (and sometimes even in the MIR) may not attain sufficient depth to detect the disk. The sources which are detected at IR wavelengths are either somewhat advanced in their early evolution or have a favourable orientation where the line-of-sight intersects the envelope cavities created by the outflow, in both cases lowering the total extinction and revealing the innermost parts.
Optical/infrared interferometry reaches typical spatial resolutions of 1 mas in the NIR and 10 mas in the MIR (see Fig. 1). This technique provides therefore access to the inner disk at linear scales of 1-10 au and to the interaction zone between envelope and outflow at 100 au for objects located at 1 kpc. The observed flux in this wavelength range is dominated by thermal dust emission conveniently at sublimation temperature of 1500 K (“hot”) in the NIR or at a typical temperature of 300 K (“warm”) in the MIR. Access to velocity fields is provided by those beam combining instruments employing a dispersive element of at least intermediate spectral resolution (). The technique of spectro-interferometry can resolve therefore both spatially and spectrally the atomic and molecular gas in the inner disk region. The infrared interferometric instruments deliver visibility and phase data. Using spectral differential phase, the nominal spatial resolution of the interferometer can be superseded by a factor 100 when probing the photo-centre shifts encoded in the differential phase signal between spectral line and continuum emission. Differential phase precisions of 30 as have been reached for measurements of the 12CO first overtone bandhead emission arising in a Keplerian disk (Wheelwright et al., 2012b). The inner disk physics of most intermediate mass PMS stars are within reach of OI, yet most of the deeply embedded sources (mostly the high-mass stars) and the intrinsically faint sources (the low-mass stars) are currently too faint even for the sensitivity offered by optical interferometers using 8m-class telescopes (ESO’s VLT-I and the LBT-I) and only a few exceptionally bright sources of these classes have been studied in detail.
Millimeter line emission from high-energy levels of low-abundance molecular species are used to probe the velocity field of the bulk of the disk mass. Complex organic molecules, such as CH3OH, CH3CN, and HCOOCH3, including isotopomers and vibrationally excited transitions, with excitation energies 1000 K and pre-biotic molecules, such as CH2OHCHO, are abundant in HM star-forming regions and also in a few IM star-forming regions (see Beltrán, 2015, and references therein). The large bandwidth of current radio/mm interferometers allows us to study the physical properties and velocity field of these embedded (proto)stars in many different species, covering a broad range of excitation conditions, as recently demonstrated by ALMA observations at 850 m of B-type (proto)stars: G35.20+0.74N A and B (Sánchez-Monge et al., 2014) and G35.03+0.35 A (Beltrán et al., 2014).
Alternative strategies to search for massive YSO disks were proposed by Hoare et al. (1994) and Hoare (2006) for the massive YSO sources S 106 and S 140-IRS1 by means of centimeter emission. It potentially traces ionized equatorial winds driven by the radiation pressure of the central star and inner disk acting on the surface layers of the disk. Indeed, these observations have revealed elongated disk-like structures perpendicular to molecular outflows that have been interpreted as produced by such equatorial disk winds. Such winds can also be traced using IR hydrogen recombination lines accessible to OI and exploited for example in the study of the disk of the young B 1.5V star MWC 297 (Malbet et al., 2007). Circumstellar disks can also be studied with maser emission, as nicely demonstrated by the multi-epoch SiO maser emission VLBI observations of the HM (proto)star Orion Source I (Matthews et al., 2010). Because of the strength and compactness of their emission, masers can be observed with VLBI techniques that can provide angular resolutions of a few mas. The advantage of using masers to study circumstellar disks is that they are very bright, the drawback is that their emission is sensitive to the excitation conditions, which makes it hard to estimate the physical parameters of the disks. In addition, the interpretation of maser emission is complicated and ambiguous, and sometimes the same maser species have been claimed to trace disks and outflows simultaneously. For example, Norris et al. (1998) and Pestalozzi et al. (2004) interpret CH3OH masers as originating in disks rotating about massive YSOs, while De Buizer (2003) finds evidence that methanol masers are associated with outflows. Therefore, any possible evidence of disks from maser lines has to be confirmed by the presence of a jet/molecular outflow perpendicular to the distribution of the masers.
4.2 Estimating inner and outer radii
Disk outer radii are estimated from either resolved dust continuum emission or from line emission of high-density tracers. Such observations are performed at long wavelengths, given the low temperatures of the outer disk. This strategy can be applied to embedded sources and to PMS sources by means of (sub)millimeter interferometers (e.g., Öberg et al. 2011). Importantly, the radii estimated from molecular tracers are often found to be larger than those estimated from dust continuum emission. One possible explanation is that the gaseous emission of the envelope is difficult to disentangle from that of the disk. Alternatively, the gaseous disk could be intrinsically larger than the dusty one. Tables 1 and 2 list the outer radii for the rotating structures around IM and OB-type (proto)stars estimated from line emission when possible. Otherwise, the value was estimated from the dust continuum emission.
The inner disk boundary is a crucial parameter for a number of reasons. The inner radius is required for estimating the accretion energy released in the disk with respect to that which is released on the star. The inner disk also represents the zone where the interaction between disk and star is strongest and where processes take place by which the material actually lands on the star (magneto-spheric or boundary layer accretion) and where disk erosion and planet formation are manifest. Direct spatial information on the inner disk and its associated accretion physics requires a linear resolution between 10 au and approximately the stellar radius. For most stars, such scales are only indirectly accessible through spectroscopic techniques like high resolution spectroscopy, spectro-astrometry and spectro-polarimetry, i.e. techniques that have proven their efficacy in the optical and near-IR wavelength range (see e.g. Meynet et al., 2015). Such spatial scales and even smaller (1 au) can also easily achieved by maser emission VLBI observations. To actually resolve the inner radii of disks, an angular resolution of approximately 35 mas for the embedded IM protostars, and better than 10 mas for HM ones is required. ALMA can achieve angular resolutions of 25 mas in Band 6 (1 mm) and of 40 mas in Band 7 (0.85 mm), with baselines of 10 and 5 km, respectively bringing the inner radii of embedded IM stars within reach. Resolutions beyond these scales can in principle be obtained in Bands 9 (0.45 mm) and 10 (0.35 mm) at baselines of 10–15 km, but it is not clear if the array sensitivity is enough to detect the inner disk emission. An additional complication could be introduced by the optical thickness of the dust emission at those wavelengths that could prevent the detection of line emission.
On the other hand, OI provides the means to resolve spatial scales of 10 au and disk regions even closer to the central star (1 au), accessing the thermal processes related to the accretion dynamics (see Fig. 1). Given that the average dust sublimation temperature is 1500 K, a temperature for which the corresponding blackbody emission peaks at 2 m, OI can probe directly the angular size of the dust sublimation region. For a substantial sample of young stellar objects, especially the HAeBe stars, these measurements can be obtained, depending of course on the brightness of the source and the distance. Often however the uv-plane coverage of OI measurements is rather sparse. Hence, the measured visibility and phase measurements are compared to model geometries in order to translate visibilities to angular scales. The assumption in this approach is that the adopted model is an idealization of the actual shape of the emission region on the sky. It makes sense to assume simple models initially when only a limited number of visibility measurements are available. Popular geometries to which visibilities are compared are rings, uniform brightness disks, and Gaussians. These mathematical functions have relatively simple Fourier transforms and can be readily compared to the visibility data. The derived sizes can be referred to as equivalent ring size, i.e., the size (in milli-arcsecond) if the emission region were identical to a ring. Difference in visibility function of the simple geometrical models become only clear in the second lobe, where for example, the power of a ring starts to diverge significantly from that of a uniform disk (for graphical examples see e.g., Tycner et al., 2006) or a ring without structure to one with structure, c.f., the discussion regarding the rounded and straight inner dust rims in HAeBes (see Sect. 5.1.2). The mathematical functions can be found in textbooks related to interferometry schools like the Michelson summer schools or the VLTI schools (e.g., Perrin & Malbet, 2003).
A slight sophistication in modelling the visibility functions of the inner disk is possible when OI observations are performed employing a dispersive element. Most beam-combining instruments deliver spectrally dispersed visibility and phase. The OI data can then be interpreted in terms of simple geometries at different black-body temperatures. This makes physical sense if the disk emission is optically thick. For a disk without accretion heating, i.e., a passive, geometrically flat, irradiated dust disk, it can be shown that the resulting radial temperature gradient will have a power law with exponent (Adams & Shu, 1986), the same exponent as for a steadily accreting, thin disk (Shakura & Sunyaev, 1973). The temperature gradient becomes less steep (exponent of ) for flared disks (Kenyon & Hartmann, 1987) as it intercepts more stellar radiation and is consequently hotter. Temperature gradient models are in common use to approximate the inner rim of the disk and the degree of flaring (e.g. Eisner et al., 2007; Kreplin et al., 2012).
A next level of sophistication in deriving physical parameters of disks, OI studies often adopt radiative transfer (RT) modelling aimed at reproducing the SEDs and interferometric observables. The geometries of the RT models are characterized by many parameters which could complicate the analysis. Popular RT codes publicly available and suitable for young star disk studies are RADMC (Dullemond, 2011), HoChunk (Whitney et al., 2013), MC3D (Wolf, 2003), MCFOST (Pinte et al., 2006). Model-to-data comparison yields constraints on the free parameters of the chosen model, like scale height and flaring index, inner rim distance, inclination and P.A. For example, in Di Folco et al. (2009) the flaring of the disk of the famous A0 V PMS star AB Aur is determined thanks to spectrally and spatially resolved MIR N-band observations.
4.3 Estimating scale height profiles
To investigate whether IM and HM circumstellar disks are geometrically thin like those around low-mass YSOs (e.g., Padgett et al., 1999), one can measure the hydrostatic scale height .
For the younger embedded sources, in most cases cannot be estimated directly from millimeter maps because the interferometric observations do not resolve the emission. However, according to Cesaroni et al. (2014), it can be estimated following
| (1) |
where is the line width of the high-density tracers, is the outer radius of the disk, and is the mass of the central star. As these authors state, this expression is obtained by replacing with in Eq. (3.14) of Pringle (1981), which calculates the local structure of a geometrically thin disk in hydrostatic equilibrium and isothermal in the direction.
4.4 Estimating disk masses
The mass of the disk determines its dynamical state, a critical property for the evolution of the disk. The state can be typified as either self-gravitating and in non-Keplerian rotation or centrifugally supported. The bulk of the disk material is cold and its total mass can be effectively estimated by the thermal emission from dust. Under the assumption that the emission at (sub)millimeter wavelengths is fully optically thin one can use:
| (2) |
The parameters in this equation are the following: is the flux density, is the distance to the source, is the dust opacity coefficient, is the gas-to-dust mass ratio, and is the Planck function with temperature . The above conversion relation from flux to is subject to uncertainties mainly in , , and . We briefly step through the systematics of these three parameters.
The gas-to-dust mass ratio in a disk is usually assumed to be 100, the typical value for the interstellar medium (ISM). In other words, only 1% of the disk mass is in dust particles. The total mass of a disk is practically the same as the gas mass. However, the physical conditions dominating the disk are likely to be much unlike those found in the ISM. The gas-to-dust ratio could actually be lower in circumstellar disks due to gas removal. Dust related processes such as grain growth and dust settling could result in a predominantly gaseous disk atmosphere that would be subject to photo-evaporation leading to gaseous disks winds or to the selective accretion of gas onto the central star (e.g., Williams & Best, 2014). These processes would result in an overestimate of the disk mass based on dust emission.
An estimate of the dust temperature can be obtained by fitting the Spectral Energy Distribution (SED) with black-body curves. Alternatively, by assuming local thermodynamic equilibrium (LTE), one could adopt the rotation temperature of the high-density molecular tracers. However, if dust and gas are not perfectly coupled, then can differ by a few degrees from the temperature estimated of the high-density tracers (Goldsmith, 2001; Juvela & Ysard, 2011).
The principal source of uncertainty in Eq. 2 is however the dust opacity coefficient . It depends on the composition and properties of the dust particles themselves in particular on the dust opacity power-law index (). Different studies have computed different dust opacity laws (e.g., Hildebrand, 1983; Draine & Lee, 1984; Ossenkopf & Henning, 1994) that yield disk mass estimates differing by a factor 4–5 (Beuther et al., 2002a). We underline that the disk masses presented in our compiled sample of (proto)stars are re-calculated assuming a dust opacity of 1 cm2 g-1 at 1.4 mm Ossenkopf & Henning (1994). The dust opacity power-law index used is 2, except for those sources for which an accurate determination of this coefficient has been made (e.g., G192.163.82: Shepherd et al., 2001). All mass estimates are based on dust emission, except the source GH2O 92.67+3.07, for which Bernard et al. (1999) estimated from CS observations.
Apart from the systematic uncertainties in the input parameters, an additional source of uncertainty on the disk mass worth mentioning, relates to the achieved spatial resolution and the nature of the sources. Insufficient angular resolution makes it very difficult to disentangle the disk emission from that of the envelope and would lead to serious overestimates of the disk mass. Interferometers have the advantage of spatially filtering out the most extended envelope emission, and decrease the bias on the disk mass estimates.
4.5 Estimating star masses
Stellar masses are ideally estimated through dynamical considerations. Modelling the rotation in a Keplerian disk could however be achieved only for a small number of HM (proto)stars in the (sub)millimeter (e.g., IRAS 20126+4104: Cesaroni et al., 2005, 2014) and in the near-IR (e.g., W33A: Davies et al., 2010). At the youngest stage, is mostly estimated from the bolometric luminosity and a ZAMS assumption. In later stages, young OB star masses relate to the emitted UV radiation. This radiation rapidly ionizes the surroundings of the forming star and creates an Hii region. Assuming that the centimeter continuum emission comes from an optically thin Hii region, one can deduce the Lyman-continuum photons emitted per second () (e.g., Mezger & Henderson, 1967) and relate it to the spectral type (Martins et al., 2005; Lanz & Hubeny, 2007; Davies et al., 2011). We caution however that free-free emission is also produced by shock ionization in thermal radio jets (Curiel et al., 1989) associated with both IM and HM (proto)stars (e.g.,IRAS 21391+5802: Beltrán et al. 2002; G35.200.74N: Gibb et al., 2003; IRAS 16562-3959: Guzmán et al., 2011; W75N(B): Carrasco-González et al., 2015). A distinction can be made between the two phenomena by means of the spectral index . The radio jets are partially optically thick producing , whereas the Hii region has typical index values of 2. Moreover, a jet is generally fainter than an Hii region.
We chose to obtain an estimate of from for the sources in the compiled sample taking into account the presence of stellar clusters. This was motivated by the partial availability of centimeter observations for the HM (proto)stars and because for IM YSOs cannot be estimated from the ionized emission. In brief, we assumed that was consistent with that of a stellar cluster and estimated from the simulations of a large collection () of clusters with sizes ranging from 5 to 500000 stars each (L. Testi, priv. comm.). The distribution of the number of clusters with of a given number of stars is d/d with . Each cluster is populated assuming a randomly sampled Chabrier (2005) initial mass function with masses ranging from 0.1 to 120 . For each simulated cluster, the total mass, maximum stellar mass, bolometric luminosity and Lyman continuum are computed. For each IM protostar of Table 1, we assumed that its corresponds to the maximum stellar mass of the simulated cluster. For the HM (proto)stars, we estimated in two different ways (Table 2): one from the Lyman-continuum photons, when continuum centimeter observations of the associated Hii region are available, and the other from the simulated cluster by assuming that is the maximum stellar mass of the cluster. Taking into account the uncertainties of both methods, the agreement between the estimated values of is quite good for most of the sources (Table 2).
Stellar mass estimates for IM PMS stars present their own set of difficulties. Masses are estimated from comparison with evolutionary tracks or directly from the observed spectral type. The main uncertainties in spectral type determination for young stars lie with the extinction correction and the associated total-to-selective dust extinction law. The superposed emission line spectra of the circumstellar environment hides the crucial photospheric lines. Moreover, for stars in the A and B-type spectral range, the photospheric lines are only few and often compounded by fast stellar rotation. This can lead to uncertainties in spectral type of 5 sub-types and in some cases it can be even more uncertain (Hernandez et al., 2004; Alecian et al., 2013). The spectral types and luminosities of HAeBe stars that are included in the analysis of the present work are taken from Fairlamb et al. (2015).
Finally, the embedded and optically revealed sources share inaccurate distance estimates leading to a systematic uncertainty in the bolometric luminosity. Only for the nearest PMS stars, Hipparcos distances are available (van den Ancker et al., 1998) and spatial co-location with young stellar clusters and star-forming regions would entail reasonable distances. The situation regarding the PMS star distances should strongly improve with the data from the GAIA satellite.
4.6 Estimating rotation velocities
Velocity field information is crucial in the selection process of good Keplerian disk candidates, especially when searching for the youngest disks in complex embedded environments. Particular emphasis in this process is on the existence of velocity gradients perpendicular to molecular outflows as they are indicative of rotation. The rotation velocity () for the embedded disks is a quantity that is used to refer to the rotation velocity at the outer disk radius. It gives access to parameters like the rotational timescale and the dynamical mass of the system (see Fig. 3). In practice, is often estimated as half the range of the velocity gradient measured over the resolved disk of a high-density molecular tracer (e.g., Beuther et al., 2008; Beltrán et al., 2011a). For well resolved objects, Keplerian rotation can be established by means of the position-velocity (PV) diagram when along the major axis of the rotating structure a “butterfly” pattern appears, characterized by low-velocity “spurs” of emission and high-velocity “spikes” towards the position of the central object. These curves can be fitted with a Keplerian rotation curve (e.g., Beltrán et al., 2014). Finally, a more accurate way to estimate the kinematics is by radiative transfer modeling of the molecular line emission, like e.g. in the case of the HM source AFGL 2591 VLA3, where Wang et al. (2012) find a velocity field consistent with sub-Keplerian rotation with radial expansion.
For the embedded HM sources in Table 2, the values of are those quoted in the literature. However, when is not reported, we have estimated it from the maps of the velocity gradient shown in the papers. This has left us with a quite homogeneous sample to derive overall trends and properties: all HM sources have been observed at high-angular resolution and for all of them kinematical information regarding possible rotating structures is available. For the IM protostars sample (Table 1) we had to limit our research to dust continuum emission only. Unfortunately, only for a few cases high-angular resolution and high sensitivity line observations are available and the kinematics of these disks has been studied in detail (e.g., IRAS 22198+6336: Sánchez-Monge et al., 2010). Finally, for direct comparison between disk properties among embedded and PMS objects, we have estimated from the observed velocity gradient for HAeBe stars for which resolved millimeter observations exist (see Sect. 6.1).
4.7 Estimating accretion rates
The mass accretion rate () is a central quantity in star formation. It provides the timescale for star birth and constrains the physics involved in the process of mass, energy and angular momentum transport from the envelope to the disk and from the disk to the star. According to recent models of HM star formation, non-spherical accretion through a disk and onto the stellar surface is characterized by high accretion rates (, also inferred from observations, e.g., Nakano et al., 2000; Testi et al., 2010) that are needed to overcome the radiation pressure of the newly formed OB-type star (see e.g., McKee & Tan, 2003; Kuiper et al., 2015). The adjective high is in relation to the derived mass accretion rates in the low-mass regime and various studies aim to demonstrate that a correlation between and exists (e.g., Ercolano et al., 2014). This aspect will be explored in detail in § 6.
In the low-mass regime, instantaneous mass accretion rates are derived within the framework of magneto-spheric accretion, in which the accreting material is channeled from the circumstellar disk onto the stellar surface along the stellar magnetic field lines. Accretion luminosities can be derived from the flux released when the material impacts the stellar surface, which appears as excess flux in relation to the photospheric one. The strong shocks create accretion hotspots in the photosphere with temperatures around 10 000 K and optically thin pre-shock material can reach temperatures up to 20 000 K. This potential energy release produces hydrogen continua and emission in various atomic transitions (e.g., Hartmann, 1998; Calvet & Gullbring, 1998). The extra continuum emission is easily distinguishable from the cool atmospheric emission of late-type stars (Herbst et al., 1994) and it can be identified in the weakest magneto-spheric accretors (Herczeg & Hillenbrand, 2008) by means of excess UV and optical light. It becomes however increasingly harder to detect towards earlier spectral types. A correlation between accretion luminosity and line luminosity is however apparent for many transitions (Herczeg & Hillenbrand, 2008; Antoniucci et al., 2014) and these can be made to good use for dust extincted and embedded sources (e.g., Natta et al., 2006) in particular the higher mass young stars. Special attention in this framework receives the Br transition as it is known to be powered by accretion energy along the mass sequence from the T Tauri stars (Muzerolle et al., 1998) up to stars (Calvet et al., 2004). Note however that the latter work investigates IM PMS stars which are still fully or partially convective as their Hertzprung-Russell diagram (HRD) positions place them on top of the Hayashi tracks. A continuity in magneto-spheric accretion related properties between these IM objects and the low-mass ones can be expected based on the fact that the incidence of magnetic fields drops with among the PMS stars, i.e., when the stars lose their convective outer-layer (Hussain & Alecian, 2014). Nonetheless, observed Balmer and sodium line profiles of PMS A-type stars can be reproduced by the magneto-spheric accretion model (Muzerolle et al., 2004).
Systematic studies determining in the disks of HAeBe stars have so far used either the Br line (Garcia Lopez et al., 2006, with a sample restricted to A-type stars) or the Balmer continuum excess (Donehew & Brittain, 2011; Mendigutía et al., 2011; Fairlamb et al., 2015). The latter studies include early Herbig Be stars and an extension of the relation between Br and accretion luminosity is provided albeit with a large scatter in the data (Mendigutía et al., 2011). These surveys demonstrate that, as a group, the Herbig stars are accretors. They also show that the magneto-spheric accretion model may not be applicable to early B-types (), because the required surface area of the magnetic footprint needs to be larger than the entire stellar surface. A large number of OI studies targeted the Br transition in HAeBe stars in order to determine the exact origin of the emission within the accretion environment, probing the presumed transition in accretion physics (see Sect. 5.1.2).
The above methods cannot be applied to estimate for the embedded IM and HM (proto)stars. The very high extinction due to obscuring dust, typically many tens of magnitudes, causes young massive stars to be essentially invisible at optical, near-IR and for some sources even at mid-IR wavelengths. Nonetheless, an indirect method to derive an estimate of global protostellar (i.e., not instantaneous) is given by the position of PMS stars in the HRD. The protostellar mass accretion rate determines the luminosity and of an accreting object and therewith the locus of the stellar birthline in the HRD. The upper limit to the distribution of PMS stars in the HRD was shown to be well matched by a of yr-1 (Palla & Stahler, 1993).
Information on the instantaneous during the main accretion phase and therewith the properties of the accretion disk can be accessed in the mid-IR N-band, under favourable lines of sight. In the mid-infrared, the extinction due to obscuring dust is much lower than at shorter wavelengths, whereas the SED of HM YSOs exhibits a strong increase. Observations at these wavelengths allow us to access the earliest phases, crucial for high-mass star formation. Rigliaco et al. (2015) demonstrate that the mid-IR hydrogen recombination lines are accretion tracers although the exact origin of these lines is not yet established.
At centimeter and (sub)millimeter wavelengths, a very effective method of identifying the presence of infalling material in HM star-forming regions is to observe red-shifted absorbed line profiles. At centimeter wavelengths, the red-shifted absorption has been observed against the bright continuum emission of an embedded hypercompact Hii region, as for G10.620.02 (Keto et al., 1988; Sollins et al., 2005) and G24.78+0.08 A1 (Beltrán et al., 2006b), and at (sub)millimeter wavelengths, against the bright optically thick continuum emission from the core center, as for W51 North (Zapata et al., 2008), G19.610.23 (Wu et al., 2009; Furuya et al., 2011; Beltrán et al., 2011a), and G31.41+0.31 (Girart et al., 2009). Since the continuum source is very bright ( K), especially when observed with an interferometer (because the emission does not suffer severely from beam dilution), it is easy to observe the colder molecular gas ( K) in absorption against it. The absorption is observed at positive velocities relative to the stellar velocity if the material surrounding the (proto)star is infalling onto the central star. Following Beltrán et al. (2006b), the infall rate in a solid angle can be estimated from the expression
| (3) |
where is the gas column density, is the radius of the continuum source, is the infall velocity, and is the radius at which is measured. The main caveat of this method is the uncertainty on . In fact, the radius at which is associated is not known, and usually the size of the infalling core is given as an upper limit. In addition, what red-shifted absorbed profiles are tracing is the infall of material in the inner part of the core or in the disk, but not actual accretion onto the central star.
Infall has also been inferred from the modeling of PV plots of high-density tracers with models including both rotation and infall (e.g., Nakamura et al., 1991; Bernard et al., 1999), and from the SED modeling (e.g., Osorio et al., 1999).
For HM YSOs for which rotation has been detected, assuming that the infall velocity is equal to the rotation velocity (Allen et al., 2003), the infall rate can be estimated from the expression
| (4) |
where is the surface density.
Finally, a rough method to estimate the infall rate is to assume that all the material in the rotating structure will collapse in a free-fall time and use the expression
| (5) |
However, like for the red-shifted absorption method, what one is measuring here is the infall in the core or in the disk and not the accretion onto the central star.
A method to estimate the mass accretion rate onto the central star is to use the mass loss rate of the associated outflow (e.g., Beuther et al., 2002b). Assuming conservation of the momentum rate of the outflow and of the internal jet entraining the outflow, then is related to the mass loss rate of the internal jet jet as . Assuming furthermore a ratio between the jet velocity and the molecular outflow velocity of 20 (Beuther et al., 2002b) and a ratio between and the mass accretion rate onto a low-mass protostar of approximately 0.3 (Tomisaka, 1998; Shu et al., 1999), one finds that
| (6) |
Properties of accreting stars by parametrizing the following the above argumentation were calculated by Behrend & Maeder (2001). The growing rates with stellar mass have a significant effect on the stellar structure where a (proto)star starts to bloat being able to reach radii of under influence of the high . This results in low stellar effective temperatures and consequently little UV luminosity. For the quoted values of , the accreting (proto)star settles on the ZAMS only once it has accreted a mass of (Hosokawa et al., 2010).
5 Observed properties of circumstellar disks
In this section we gather and analyze the observed properties of the circumstellar structures. For the IM YSOs, we describe the disks in the early embedded phase and in the later pre-main sequence phase separately. For the HM YSOs, we discuss the disk properties during the embedded phase only as optically revealed accreting HM YSOs are not known. We discuss separately the early-B/late-O type (proto)stars and the early-O type (proto)stars as the properties of the circumstellar structures found for these two groups are different, as touched upon in Sect. 3.3.
5.1 Disks around intermediate-mass stars
5.1.1 Disks in embedded IM protostars
Clear detections of circumstellar disks of embedded IM protostars are provided by (sub)millimeter interferometric observations of the dust continuum. As bona-fide examples can be considered the following sources: OMC1-S 139409 and 134411 (Zapata et al., 2007), IRAS 22198+6336 MM2 (Sánchez-Monge et al., 2010), L1641 S3, NGC 2071 A and B (van Kempen et al., 2012) (see Fig. 6), and MMS 6/OMC3 (Takahashi et al., 2012). The bolometric luminosity of the sources extends up to a few times , covering the whole IM protostar range and suggesting that there is no limit with stellar mass for the occurrence of a disk in this evolutionary phase.
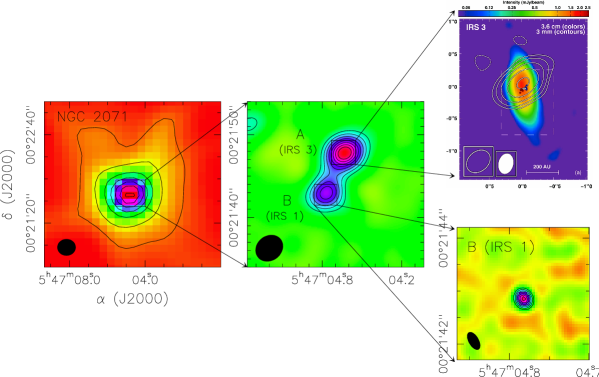
The embedded dusty disks have a typical size of a few hundred au. For a few cases however much larger sizes are measured with radii of up to 1000–2000 au (see Table 1). We consider that disks with outer radii of over 1000 au are the product of insufficient angular resolution. In fact, disks observed at increased angular resolutions of less than are found to have much reduced radii of 100 au. Examples in our compiled sample are Serpens FIRS 1 with a deconvolved size of approximately 65 au and NGC 2071 A (IRS 3) with a deconvolved size of 12050 au. These smaller dusty disks appear as elongated structures oriented perpendicular to molecular outflows and/or radio jets. The source NGC 2071 A (IRS 3) is in this respect a tellingly clear example (Carrasco-González et al., 2012, and see Fig. 6).
A particularly interesting case is presented in Zapata et al., (2007). They observed IM protostars in OMC1-S with the JVLA at 7 mm. At a linear resolution of 20 au, the continuum emission towards two sources (viz. 139–409 and 134–411) resolves in compact binary systems, each system surrounded by a circumbinary ring of radius 100 au. In turn, each of the four individual objects might be surrounded by a compact circumstellar disk of radius 20–25 au with a mass 0.1 . The picture that is suggested from these observations is that IM disks in young binary systems can be physically rather small for they cannot extend beyond the circumbinary ring.
The angular resolution of the (sub)millimeter observations of IM protostars performed to date has not been sufficient to resolve disks in the vertical direction. From such observations it is clearly not possible to assess the geometry of disks directly. However, Eq. 1 (see Sect. 4.2) does offer a handle on the scale height . We applied this estimate for the compiled sample making the assumption that a line width of 2 km s-1 is typical (e.g., Beltrán et al., 2006b, 2008; Fuente et al., 2009). We find that the hydrostatic scale height is in most cases 20–30% of the disk radius but can be as high as 60%. This simple estimate indicates that the disks of embedded IM protostars are probably geometrically thick. For the smaller disks observed at a resolution below the scale height is only 10% of the disk radius. This may indicate that the inner disk geometry is much thinner than the outer disk suggesting an overall flared geometry. More observations are clearly required to confirm this finding.
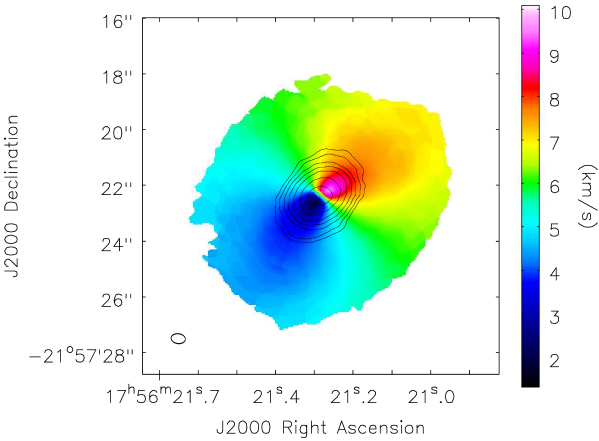
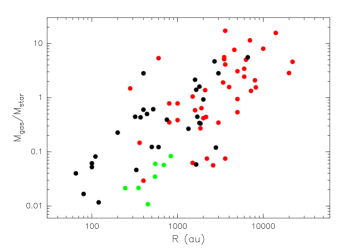
The disk masses of the embedded IM YSOs are typically less than , which is smaller than that of the central star. This finding suggests that IM circumstellar disks are likely to be in Keplerian rotation like those of their low-mass counterparts. Direct evidence for rotation is available for a few cases, where the kinematics are probed with high-density tracers such as CH3CN (e.g., IRAS 22198+6336: Sánchez-Monge et al., 2010; OMC1-S 139–409 and 134–411: Zapata et al., 2007). They reveal velocity gradients perpendicular to the direction of the corresponding molecular outflows, which suggests rotation. Rotation has also been inferred from water maser emission (e.g., NGC 2071 A: Torrelles et al., 1998). However, the nature of the detected velocity field (Keplerian or other) could not be established in any of these case studies. On the other hand, Keplerian rotation has been clearly demonstrated towards the more evolved Herbig Ae/Be PMS stars, like for example towards the Herbig Ae star HD 163296 (Qi et al., 2013; de Gregorio-Monsalvo et al., 2013; see Fig. 7), as unveiled by ALMA Science Verification observations at 850 m and 1.3 mm.
For a few outliers though, the disk mass is found to surpass the star mass as can be seen in Fig. 8. The explanation that we prefer for such high masses would attribute the cause to (again) insufficient angular resolution to separate the contributions by envelope emission from that of the disk. This explanation is also supported by the correlation seen in Fig. 8. The figure displays the gas to stellar mass ratio as a function of the radius . The outlying IM protostars follow the distribution of the more distant HM (proto)stars. The figure shows a clear correlation between the distance-independent ratio and the radius of the circumstellar structure. This correlation holds along the mass range of protostars and also for the more evolved Herbig Ae stars.
5.1.2 Optically revealed disks around Herbig Ae/Be stars
It has become clear from spectroscopy that accretion continues after the protostellar phase into the pre-main sequence phase for the A-type (Muzerolle et al., 2004; Garcia Lopez et al., 2006) and B-type objects (Donehew & Brittain, 2011; Mendigutía et al., 2011; Fairlamb et al., 2015). Early theoretical estimates of detecting young star (geometrically flat) accretion disks by means of OI were sobering. Malbet & Bertout (1995) expressed the minimal need for 100 m telescopic baselines at 2.2 m (or 5 mas) for strong accretors () located a little beyond Taurus (150 pc). The first systematic studies aimed at resolving the inner disk regions of young stars delivered the pleasant surprise of finding much larger typical sizes than predicted. The sizes were found to be in a linear range between 0.1 and 10 au. Monnier & Millan-Gabet (2002) demonstrated that the H-band and K-band equivalent ring sizes (see Sect. 4.2 for the meaning of this term) determined for a sample of Herbig Ae/Be stars show an apparent correlation with the bolometric luminosity of the star with a functional dependency of , a relation insensitive to distance errors. Such a relation suggests physics related to dust sublimation and it inspired revision and adaptations of the idea related to the inner disk structure: the geometric ring was promoted to a physical dust sublimation rim. It became an inflated dust structure at the sublimation radius, puffed up by stellar irradiation and the source for the poorly understood near-IR “bump” apparent in the SED of HAeBe stars. An image using the technique of aperture masking interferometry of the enigmatic Herbig Be star LkH 101 delivered a resolved image at 20 mas resolution in K-band. It demonstrated the evacuated inner zone surrounded by a torus of hot dust at 3.4 au radius (Tuthill et al., 2001) and provided justification for the use of the geometrical ring model in order to estimate the dust sublimation radius. The “puffed-up” inner rim scenario suggests that the dominant fraction of the disk emission is reprocessed stellar irradiation and not the release of accretion energy. This interpretation is valid in case the region interior to the dust rim remains largely optically thin to stellar irradiation such that the rim can be illuminated by the star. Many of the OI studies in the past decade are directed towards understanding the nature of the disk located interior to the dust sublimation radius. This requires an angular resolution of the order 1–10 mas. A comprehensive discussion of the physics and the problems of the disk inner rim of HAeBe stars and an overview of the advances achieved during the first decade of this century can be found in Dullemond & Monnier (2010).
The most recent accretion rates determined for HAeBe stars render the zone interior to the dust sublimation radius however optically thick (Fairlamb et al., 2015). For a fraction of 20-30% of their sample, supersedes , generating accretion luminosities between 50% and 80% of the stellar bolometric luminosity. Such rates would result in optically thick inner disks (Hartmann et al., 1993) and in smaller typical radii than expected from dust sublimation physics (Muzerolle et al., 2004). These findings for the accretion rate strongly indicate that the one-to-one identification of the geometrical ring with the innermost radius where dust exists cannot be the complete solution to the origin of the near-IR emission in the Be nor the Ae types. This finding is also supported by spectroscopic evidence where the strength of the emission lines correlates with near-IR excess. As the emission lines trace accretion activity, it would argue in favour of inner disks that are not entirely passive (Manoj et al., 2006).
The detailed properties of near-IR line and continuum emission require material interior to the dust sublimation region. This advancement is thanks to OI studies using facilities allowing increased data production and more uniform filling of the uv-plane, the employment of longer baselines, and the capacity to do high spectral resolution interferometry up to R=12000. Kraus et al. (2008) find a satisfactory fit to spectral and near/mid IR spatial data only when adopting an optically thick gas disk interior to the dust rim for the 6 Herbig Be star MWC 147. This gaseous inner disk was confirmed and found to be a rotation dominated structure by means of double-peaked [OI] forbidden line emission (Bagnoli et al., 2010). In a number of Herbig Ae cases, the standard inner rim scenario is not able to fit long-baseline ( m) interferometric data. Inner rim models produce power (high visibilities) after the first null, a feature which is not seen in the data. The modeling in Tannirkulam et al. (2008) (see Fig. 9) of two A-type stars favour the presence of a smooth emission component inside the rim producing 50% of the emission. Similar findings are present for other A-type stars, for which e.g. Benisty et al. (2011) argue that a large fraction of the near-IR emission finds its origin interior to the dust sublimation ring. The nature of this material could not be constraint apart from the fact that it needs to withstand temperatures above 2000 K. Based on close to a total of 1500 visibility measurements, Benisty et al. (2010) come to a similar conclusion for the Herbig A1e MWC 275 (HD 163296), where the dominant contribution in H and K-band originates within the dust sublimation rim.
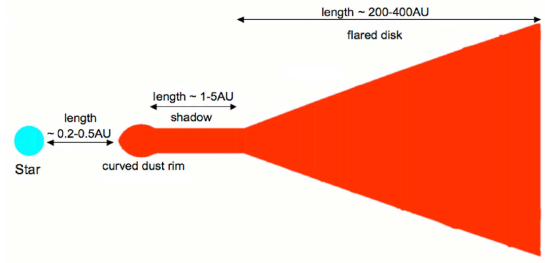
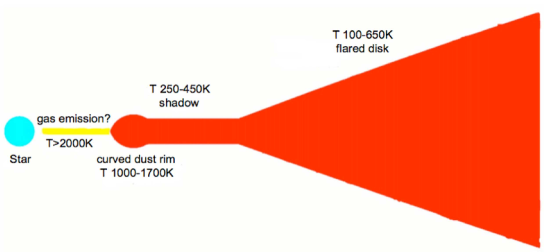
Given these OI results of HAeBe inner disks, the historical question regarding the nature of the near-IR SED bump (Hillenbrand et al., 1992) has therefore returned. The expected temperatures and densities would predict strong molecular emission like the 12CO and H2O (see the discussions in Muzerolle et al., 2004; Benisty et al., 2010). Brittain et al. (2007) detect 12CO ro-vibrational transition in 100% of their sources with optically thick inner disks, as defined as . Also van der Plas et al. (2015) show the ubiquity of 12CO fundamental ro-vibrational line emission in HAeBe stars. On the contrary, a general absence of the first-overtone emission of this molecule is the result of a large spectroscopic survey (Ilee et al. 2014), yet demonstrating that the few examples with 12CO first overtone are all of mid to early B-type. High spectral resolution 12CO first-overtone data can be fitted with Keplerian rotation with corresponding velocities that place the molecular emission interior to the dust sublimation region, but outside the corotation radius. Spectro-interferometric observations with extended uv-coverage corroborate this result in the case of a Herbig B5e star HD 85567 where the 12CO emission is spatially resolved to be from within the rim (Wheelwright et al., 2013). The reasons behind the 12CO detection differences can be related to temperature (accretion heating) or column density, where fundamental transition is excited at the disk surface covering radii up to 10 au in case the disk is flared (van der Plas et al., 2015). This could imply that the B-type stars demonstrate much denser disks interior to the continuum emission consistent with the rates derived from the Balmer excess.
Spatially and (simultaneously) spectrally resolved observation of the inner parts of the disk provide important information on the nature of the inner disk. The first description of spatially resolved Br emission can be found in Malbet et al. (2007) studying the enigmatic young Herbig B0.5e MWC 297 at linear scales of 1 au. The recombination emission in this star is found to be exceptional to that seen in other HAeBes, as it is found at larger spatial scales than the continuum emission. The near-IR continuum can be interpreted with a standard accretion disk (a geometrically thin but optically thick, viscous disk). The Br emission is found to be larger than the continuum emission and is modelled to arise in a disk wind (see also Weigelt et al., 2011). In the majority of the HAeBe cases however, the Br emission is found to be at similar or at smaller spatial scales than the dust continuum, where sizes could be so small as to be consistent with magneto-spheric accretion (Kraus et al., 2008; Ragland et al., 2009). Garcia-Lopez et al. (2015) and (Mendigutía et al., 2015) spatially resolve the Br emission at high spectral resolution (). The velocity resolved Br emission emanates from a region smaller than the near-IR ontinuum and provides a view of the inner gas disk dynamics. The inner gas disk is rotating and can be modelled by Keplerian rotation (Mendigutía et al., 2015) or a rotating disk wind (Garcia Lopez et al., 2015), whereas an even smaller component of the Br traces possibly the magneto-sphere itself.
Thanks to high resolution near-IR spectrographs, it has also become apparent that HAeBes are active accretors and capable of generating jets (Reiter & Smith, 2013; Ellerbroek et al., 2011). Although the exact nature of the accretion onto the star remains unknown, spectroscopic and spectro-polarimetric evidence has been presented that the process by which the Ae stars form is analogous to that by which solar-type stars form. This includes the idea of magneto-spheric accretion onto the stellar surface (Costigan et al., 2014) albeit with smaller magnetospheres than the T Tauri stars (Cauley & Johns-Krull, 2014). On the other hand, the accretion process among the B-types is shown to be different and these stars may accrete matter making use of a boundary layers (Vink et al., 2002; Mottram et al., 2007; Cauley & Johns-Krull, 2014). This division in the nature of accretion between Ae and Be is supported by OI data, where Vinković & Jurkić (2007) show a systematic difference in the nature of the inner au of the disk with a break at a luminosity of 1000 , corresponding to spectral type B3V or 6 . The ultraviolet flux falls precipitously in early B-stars and stars of later spectral type do not emit significant Lyman continuum photons.
The differences in accretion between Ae and Be type PMS stars, and the shared properties of HAe and T Tauri stars may reveal the transition in star formation from low-mass to high-mass. Regarding the overall disk structure, Alonso-Albi et al. (2009) demonstrated that the masses of circumstellar disks around HBe stars are a factor 5–10 lower than those of disks around HAe stars and that crystalline dust is found to be more prominent in HAe disks (Acke & van den Ancker, 2004). This difference is attributable to the shorter life-time ( yr) of the disk caused by the increasingly stronger stellar radiation field with mass. The geometry of the HAeBe disk, as captured in the Meeus group I and II (see Sect. 3.2 for a description of the groups), changes too with mass. There are fractionally more Herbig Be stars in group I (flared) than in group II (flat) (Acke et al., 2005). Consistency is found between disk geometry inferred from the SED shape and spatially resolved OI data in the mid-IR (Leinert et al., 2004; Fedele et al., 2008; Di Folco et al., 2009; Ragland et al., 2012).
Estimates of the outer radius of HAeBe disks by resolving the outer parts has been achieved for some notable cases by means of (sub)millimeter interferometry. Mostly, in the pre-ALMA epoch the disks remain unresolved. The resolved disks are found to have outer radii which are a couple of 100s of au in radius (Guilloteau et al., 2013) and they are often found to be in Keplerian rotation, allowing dynamical estimates of the central star mass (e.g. for MWC 480 and HD 163296: Simon et al., 2001; Isella et al., 2007; Qi et al., 2013; de Gregorio-Monsalvo et al., 2013; see Fig. 7). The sub-Keplerian velocity field in the outer-disk of the typical Herbig A0e AB Aur poses an interesting exception to this (Mannings et al., 1997; Tang et al., 2012). The outer-disk measurements using molecular lines give rise to a complication because of the physical conditions in early-type star disks. The UV photons penetrate deeper into these disks and photo-dissociate the molecules. Additionally, in the disk midplane freeze-out onto dust grains occurs lowering the molecular abundances. Spatially resolved line emission and chemical analysis have therefore been achieved mostly by making use of simple molecules (e.g., Pietu et al., 2007; Dutrey et al., 2014). In Sect. 6.1 we will use the disk parameters determined from resolved observations in order to make a direct comparison between the embedded and optically revealed disks. So far, the resolved outer disks are found surrounding the later type Herbig Ae stars, viz. MWC 758 (Mannings et al., 2000), HD 142527 (Öberg et al. 2011), HD 34282 (Piétu et al., 2003), an exception the late B star HD 100546 (Pineda et al., 2014). We also refer to the compilation of HAeBe disk masses in the study of the cold dust emission by Alonso-Albi et al. (2009). Like we do for the of the compiled sample of IM and HM (proto)stars (see Sect. 4.4), the Herbig Ae disk gas masses have been estimated using the dust opacities of Ossenkopf & Henning (1994).
In summary, the early-type PMS objects constitute good examples of young IM stars surrounded by disks. The inner parts and the overall geometry of these disks change character with mass. This is reflected by the information obtained by high resolution techniques discussed in the previous paragraphs. The group also provides direct confirmation of disks surrounding PMS stars up to a mass of 10 , namely: (1) R Mon - for which Fuente et al. (2006) found a Keplerian gaseous disk with outer radius au from millimeter line observation; (2) HD200775 - Okamoto et al. (2009) reported a disk from direct mid-IR imaging; (3) MWC 1080; and (4) MWC 297 have both been shown to possess inner structures corresponding to hot dust emission (Malbet et al., 2007; Eisner et al., 2010) and with mm detections of cold dust (Alonso-Albi et al., 2009). These disks can be considered as descendants of the type of accretion disks expected among the embedded early-B and late O-type stars. The accretion environment of the early-type Herbig Be stars shows similarities with the embedded ones, for example in near-IR line emission of the CO bandhead (Wheelwright et al., 2012a; Ilee et al., 2014) and the mid-IR dominance by disk and outflow cavities (De Buizer, 2006; Okamoto et al., 2009; de Wit et al., 2010). To what extent these similarities hold, we will discuss in the next section.
5.2 Disks around high-mass stars
5.2.1 Disks around early B-type and late O-type (proto)stars
The current evidence for young stars with circumstellar disks is limited to objects with masses up to 25–30 or 105 . The group of stars discussed in this section contains the most massive objects for which unambiguous detections of circumstellar disks exist. The bolometric luminosities correspond to ZAMS stars with temperatures of early B to late O spectral type (see Davies et al., 2011 and Mottram et al., 2011, and references therein), a regime at the onset of strong photospheric UV emission. Young, disk-bearing stars in this group are deeply embedded in their birth environment; for very few sources, if any, the envelope component of the parent cloud disperses before the disk does. A situation which would allow an unobscured view of the disk. The disks have been traced in dust and molecular line emission from centimeter to (sub)millimeter wavelengths. Line emission observations, in particular, have been crucial in identifying these disks because in most cases they reveal velocity gradients perpendicular to the molecular outflows powered by the embedded HM (proto)star (e.g., IRAS 20126+4104: Cesaroni et al., 2005, 2013, 2014).
Among the sources in this group, we find typical disk radii of a few thousands of au, although radii as small as 300–400 au have been reported (see Table 2). The largest disks of the HM (proto)stars could therefore be larger than those of the IM protostars as is depicted in panel d of Fig. 5. At a maximum angular resolution of a few , the smallest spatial scales traced to date are of the order of 100 au for a distance of 1 kpc (as seen in Table 2, HM (proto)stars are typically located at distances 1 kpc). Such spatial scales belong to the outer regions of the disk, where effects of material infall from the envelope to the disk may be apparent. Aiming for the inner regions of the disk using the JVLA in the extended configuration, observations of dust emission at 7 mm can reach an angular resolution of or 100 au. However, 7 mm emission may be significantly ’contaminated’ by free-free emission from thermal radio jets as demonstrated for the prototypical B-type disk candidate IRAS 20126+4104 (Hofner et al., 2007). Also UC Hii regions may affect the emission at this particular wavelength. Therefore, multi-wavelength observations are mandatory to study the inner disk of these sources, in order to separate the cold dust from the ionized gas.
Alternatively, the inner disk can be investigated by VLBI observations of maser emission. In particular those of CH3OH at a frequency of 6.7 GHz are suitable. In this way, an angular resolution of 10 mas can be reached which might probe the inner disk gas dynamics on linear scales of 20 au (e.g. Moscadelli et al., 2011). The information that instantaneous maser observations provide on the shape and morphology of the inner disk is however limited. Observing the masers at multiple epochs allows to derive the 3-D velocity of the maser spots. The velocity field derived from such observations has been successfully modelled with a disk in Keplerian rotation at spatial scales of a few 100 au (e.g., Sanna et al., 2010; Moscadelli et al., 2011). The methanol maser spots themselves are not distributed randomly over the circumstellar disk but in a narrow ring of radius a few 100 to 1000 au (e.g. Bartkiewicz et al., 2005, 2009; Torstensson et al., 2011; Sanna et al., 2010; Moscadelli et al., 2011). The ring-like distribution of the methanol maser spots reflects the sensitive excitation conditions. The masers are not seen in the inner disk because the local temperature or density probably exceed the upper excitation limits of 250 K and cm-3, values predicted by the model calculations of Cragg et al. (2005). This is demonstrated in Fig. 10 that shows the VLBI observations and a corresponding cartoon of the velocity resolved methanol masers in the embedded late O-type source NGC7538 IRS1 (Moscadelli & Goddi, 2014). The masers in the left two panels of this figure are clearly restricted to a linear distribution on the sky. They are associated with two high-mass YSOs, named IRS1a, IRS1b, which are separated by (or 500 au). According to the authors, the masers trace two quasi-Keplerian accretion disks on linear scales of 400–500 au. This young binary system is embedded in a larger (1000 au) rotating circumbinary envelope as depicted in the cartoon of Fig. 10 (see also Goddi et al., 2015).
The angular resolution and sensitivity achieved by (sub)millimeter interferometers prior to the advent of ALMA were insufficient to detect clear disk structure around most HM (proto)stars. For the few cases that could be observed with angular resolutions of , the disk appears as a slightly elongated structure oriented perpendicularly to molecular outflows or bipolar nebulae. To list a few, good examples are AFGL 2591 VLA3 (Wang et al., 2012a), G35.200.74 N core B (Sánchez-Monge et al., 2013), IRAS 20126+4104 (Cesaroni et al., 2014), and G35.03+0.35 core A (Beltrán et al., 2014). Evaluating the hydrostatic scale height of these structures by means of Eq. 1 we find that the majority of the disks has a scale height of approximately 30–40% the disk radius. The only disk candidate that appears to be geometrically thinner is AFGL 2591 VLA3, for which is about 10% the disk radius.
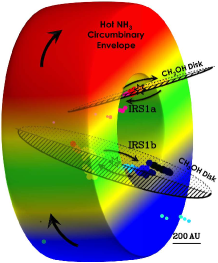
The embedded circumstellar disks of the stars in this spectral type interval have typical gas masses that range from 4 to a few 10s of . Disk masses as low as 1 have been estimated for sources observed at high () angular resolution (see Table 2). The most likely explanation for such small disk masses is that the interferometer has resolved out the outer part of the disk. In a few cases, circumstellar structures with masses as high as 70–200 have been reported for stars with (see Table 2). Such high masses correspond to sources located at 4 kpc. This strongly suggests that the angular resolution of the observations is not enough to properly separate the contribution by the envelope from that of the disk. An illustrative example is the rotating structure in G24.78+0.08 A1, studied in Beltrán et al. (2004, 2005). The authors estimated a mass of 130 and a radius of 4600 au for this structure using PdBI observations at an angular resolution of . When increasing the resolution to , the emission of source A1 fragments into three separate sources (Beltrán et al., 2011b). Consequently, the mass of the rotating structure is reduced by a factor ten, while the radius of the rotating structure reduces by almost a factor 3 to 1800 au. In this way, the new values are brought into consistency with the ones regularly found for the protostellar disk of early B-type objects. Moreover, the decrease of the mass with size is what is expected from the correlation between the ratio and (see Fig. 8 and Sect. 5.1.1).
The fact that is mostly , like in the IM protostar case (Fig. 8), allows us to argue that the disks of early B-type and late O-type are in Keplerian rotation. The actual kinematics of the embedded disks can be delineated from high-density tracers. They reveal systematically linear velocity gradients along well-defined directions, usually perpendicular to the direction of molecular outflows. When the velocity field is probed at high-angular resolution (), a clear signature of Keplerian rotation may be determined. The prime examples for which this has been achieved are: IRAS 20126+4104 (Cesaroni et al., 2005), Cepheus A HW2 (Patel et al., 2005), G35.200.74 N (Sánchez-Monge et al., 2013, see also Fig. 4), and G35.03+0.35 (Beltrán et al., 2014). However, material in Keplerian rotation around the central source is not systematically seen. For some sources, the observations reveal non-Keplerian rotation in both varieties: either sub-Keplerian (e.g., AFGL 2591 VLA3: Wang et al., 2012) or super-Keplerian (IRAS 181511208: Beuther & Walsh 2008). Sub-Keplerian motions suggest a role for magnetic fields that could slow down the rotation below pure Keplerian (i.e., magnetic braking, e.g., Galli 2006). On the other hand, super-Keplerian velocities could be produced if the inner disk contributes significantly to the gravitational potential of the protostar-disk system (Beuther & Walsh 2008). In such a case, the outer part of the disk needs to rotate faster in order for it to be centrifugally supported. Another feature of protostellar disks of early B-type and late O-type has been revealed by position-velocity diagrams along the major axis of the rotating structure. In a few cases, these diagrams have exposed the presence of asymmetries and inhomogeneities (e.g., Cesaroni et al., 2014; Beltrán et al., 2014). These disk asymmetries could be produced by the presence of spiral arms or infalling filaments accreting material onto the disk, or by the interaction with nearby companions (Cesaroni et al., 2014).
In order to study the inner parts of the disks around young massive stars, the increase in resolution could be obtained at shorter wavelengths. In a small fraction of cases the orientation of the sources provides a line of sight with relatively low extinction. Such objects can be studied in the near-IR in the same way as is done for the PMS sources. The only source that has been studied in exquisite detail is IRAS 134816124 (). Using data from the near-IR AMBER beam combiner of the VLT-I supplied with NTT speckle images, Kraus et al. (2010) obtained a synthesized image at a spatial resolution of 2.4 milli-arcseconds (8.4 au) (see Fig. 3). This is the highest resolution image of an embedded late O-type star created to date. The image shows a structure with a smooth spatial profile that is centrally peaked. The morphology strongly suggests a disk geometry for the continuum emitting material. This interpretation is re-enforced by the fact that the disk orientation is perpendicular to that of a large-scale, bipolar, CO outflow. In addition, this outflow may be driven by an accretion induced jet, which is the most plausible interpretation of a parsec-scale collimated H2 flow (Stecklum, 2010). However, confrontation with a m, spatially resolved, single-dish image makes clear the limitations of the RT disk model used to interpret the synthesis image (see Wheelwright et al., 2012b), while observations on milli-arcsecond spatial resolution at 10 m also show that a fraction of the emission could be due to warmed up cavity walls rather than solely originating in a disk (see Boley et al. 2013). This is consistent with the results of the sources W33 A and AFGL 2136 studied with optical interferometry (de Wit et al., 2010, 2011), and from single-dish mid-IR resolved imaging (De Buizer, 2007).
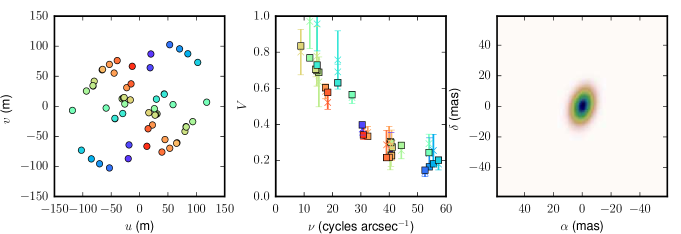
At near-IR wavelengths, scattering and envelope extinction hamper the direct detection of disk emission. At longer, mid-IR wavelengths, the contribution by the warm envelope dust ramps up, slowly drowning the number of disk photons. There is a ’sweet spot’ in terms of wavelength between K and N-band where the circumstellar disk is prominent and may even dominate the total light. Interferometry of embedded early B and late O-type (proto)stars using the MIDI beam-combiner in the -band probing 100 au clearly demonstrates the absence of circular symmetry (see Fig. 11), which could be interpreted as due to a disk or due to outflow cavity wall emission (Boley et al., 2013). Subsequent RT modeling in a few studies suggests that the geometry of the -band emission is consistent with that of an equatorially flattened structure (Follert et al., 2010; Grellmann et al., 2011). The power of interferometry is that the various contributions to the correlated fluxes is the flux weighted by the size; at milli-arcsecond resolution the envelope emission is almost resolved out, and any contribution by an unresolved structure (e.g., a disk) will become evident. Such an interpretation of MIDI observations of the well-known embedded late O-type star AFGL 2136 is presented by de Wit et al. (2011). An increase in visibilities at the blue edge of the N-band (see their Fig. 1) suggests the presence of a geometrically thin, optically thick viscous accretion disk located within ( au) the dusty envelope. The disk would be accreting at a rate of in order to provide sufficient photons from a compact object. A remarkable detail in relation to the HAeBe star luminosity-size relation revealed by -band, short-spacing Keck data (Monnier et al., 2009), is that the rim of the dust envelope is found at about 7 times the dust sublimation radius. The central dust-free zone could have been evacuated by the ionized stellar wind as reported in Menten & van der Tak (2004).
5.2.2 Disks around early O-type (proto)stars
Observational evidence of circumstellar structures in the most massive (proto)stars, i.e., those with , is growing thanks to the increase in sensitivity and angular resolution of radio/mm interferometers. Young stellar objects with derived masses of over 30 are surrounded by large structures for which a rotational velocity field could be established. These structures are characterized by a much higher mass and larger size than the rotationally supported disks encountered in the lower mass YSOs, i.e., the objects discussed in the previous subsections. In order to make a clear distinction, these large, dense, and massive structures are referred to as “toroids” (e.g., Beltrán et al., 2005). Taken together, the high masses and relatively large sizes suggest that the toroids are hosting not just a single massive star but rather a (proto)cluster of stars (e.g., G29.960.02: Beuther et al., 2007).
The toroids have radii of a few 1000 au to up 104 au for the most luminous sources (e.g.,W51 North: Zapata et al., 2008) and are found at typical distances of 3–4 kpc. Because of that, spatial scales of 1000 au can only be traced through VLBI observations of maser emission at milli-arcsecond resolution. However, only for the O-type (proto)star W51e2–E the methanol maser features appear located at 1000 au from the central star (Surcis et al., 2012). What is more, in most cases the proper motions of the methanol maser spots do not indicate rotation but expansion (e.g., Li et al., 2012; Moscadelli et al., 2013).
The hydrostatic scale height of these toroids, estimated following Eq. 1 in Sect. 4.2, is 50% of the radius, suggesting that these structures are geometrically thick. Indeed, they are much thicker than any of the objects discussed so far. The masses of the toroids are a few 100 (see Table 2), and because is much higher than the mass of the central star, the toroids are not expected to be in Keplerian rotation. In fact, they are probably self-gravitating structures in solid-body rotation or, in case the toroids are infalling, pseudo-disks (see e.g., Allen et al., 2003). Like for the disks around IM and B-type (proto)stars, the velocity field of the toroids are detected through observations of high-density tracers at centimeter and (sub)millimeter wavelengths and the velocity gradients are found to be perpendicular to molecular outflows (e.g, G29.960.02: Beltrán et al., 2011a; W51 North: Zapata et al., 2009; G20.080.14N: Yu & Wang 2013). Attempts to characterize the velocity field has proven to be impossible hitherto. For G31.41+0.31, Beltrán et al. (2005) attempted to fit the velocity field with a constant rotation velocity, =constant, (self-gravitating in the absence of magnetic field) and a constant angular velocity, =constant, which implies , (solid-body rotation). These authors were not able to discriminate between them at the available spatial resolution of the observations.
Some insight into what the toroids constitute can be obtained from evaluating the dynamical mass. The dynamical mass, estimated as (where is the inclination angle, which is 90∘ for an edge-on toroid), are smaller than . This suggests that toroids might be dynamically unstable to fragmentation and gravitational collapse. The toroids could therefore be transient structures with lifetimes of the order of the free-fall time, which, taking into account that typical densities of toroids are 107 cm-3, would be 104 yr.
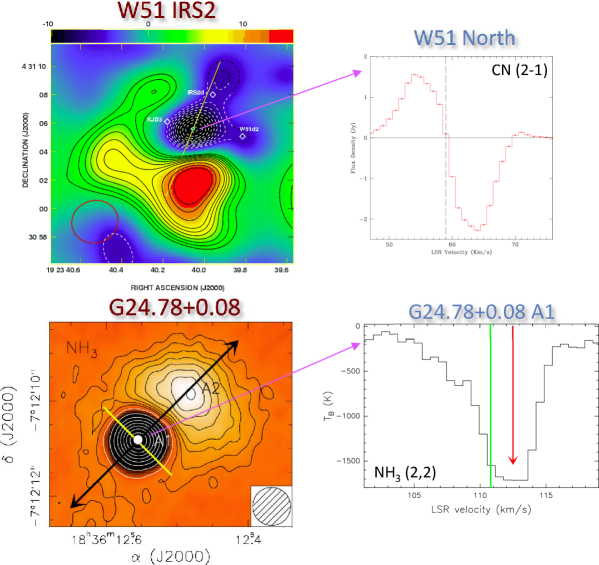
This inference is supported by evidence for infall detected towards some of these toroids. Infall was identified by means of inverse P-Cygni profiles due to red-shifted absorption against embedded HC Hii and UC Hii regions (e.g., G10.620.02: Keto et al., 1988; Sollins et al., 2005; W51e2 E: Zhang & Ho 1997) or against bright dust continuum emission (e.g., W51 North: Zapata et al., 2008; see Fig. 12; G31.41+0.31: Girart et al., 2009). Red-shifted absorption has also been observed towards late O-type (proto)stars, like for example in G24.78+0.08 A1 (Beltrán et al., 2006a) (see Fig. 12) or NGC7538 IRS1 (Beuther et al., 2012). The infall rates estimated are comparatively high, of the order of 10-3–10-2 yr-1, and they could be high enough to quench the formation of an Hii region (Yorke, 1986; Walmsley, 1995) or to slow down its expansion. What is more, according to the models of Keto (2002), accretion could proceed through trapped UC Hii regions in the form of ionized accretion flows.
6 Evolution
In this section we discuss disk evolution and mass accretion rate as a function of stellar mass and of time. To do this we compare the properties of disks and toroids around IM and HM (proto)stars with those of disks around the more evolved Herbig Ae/Be stars. To study the similarities and differences of the accretion process, we evaluate the mass accretion rates estimated for IM and HM (proto)stars alongside those estimated for low-mass Class 0/I YSOs and for more evolved T Tauri and Herbig Ae/Be stars.
6.1 Disk evolution
A graphical overview of the gas mass as a function of stellar mass is provided in Fig. 13. The stellar mass spans the range from one to 100 . The graph contains the re-derived values for of the previously discussed embedded objects and also those of the pre-main sequence Ae star disks, viz. HD 163296, AB Aur, MWC 758, HD142527, MWC 480, HD 100546 (data from Alonso-Albi et al., 2009), and HD 34282 (Piétu et al., 2003). For a discussion on the uncertainties in see Sect. 4.4. The figure shows clearly that the mass of the circumstellar structure (disk or toroid) is proportional to the mass of the central object (upper panel of Fig. 13). Although this trend may be expected a priori, it is in apparent contrast with what is observed among the Herbig Ae/Be stars. Albeit for a smaller stellar mass range, the disk mass of the B-type PMS stars are approximately ten times less than that of A-type stars (e.g. Fuente et al., 2003; Alonso-Albi et al., 2009), with some noticeable exceptions like the FU Ori star Z CMa.
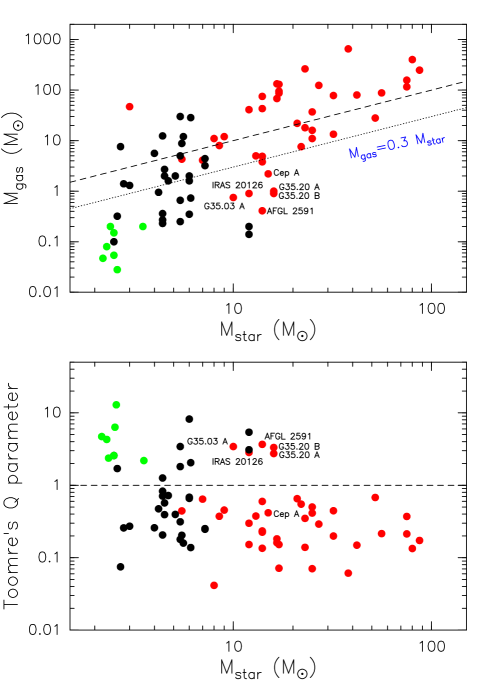
The results on the HAeBe star disks may reflect the increasingly shorter disk dispersal timescale for more massive stars (Alonso-Albi et al., 2009). Indeed, the ionizing stellar radiation of the Herbig Be stars could photoevaporate the disk rapidly (Hollenbach et al., 2000). An alternative explanation involves tidal interactions in a crowded birth environment leading to disk truncation (Muñoz et al., 2015). The fact that the disks of embedded YSOs display an opposite trend to that seen among the HAeBe stars could therefore mean that photo-evaporation is not strong enough to significantly affect the disk (or toroids) on a timescale of a few 105 yr, the typical formation timescale for high-mass stars (McKee & Tan, 2002). In fact, as pointed out by Cesaroni et al. (2006), the mass loss rate due to photo-evaporation would be 100–1000 times lower than the accretion rate onto the star based on models by Richling & Yorke (1997) and Hollenbach et al. (2000).
6.1.1 Stability of the disk as a function of mass
The distribution of points in the upper panel of Fig. 13 demonstrates that about 50% of the circumstellar structures around IM and HM (proto)stars have higher than the mass of the central star. As a result, these objects are likely to be self-gravitating. These structures cannot be in Keplerian rotation because the gravitational potential of the system is dominated by the circumstellar structure itself and not by the stellar mass. Based on an analytical study of gravitational instabilities in gaseous disks, Shu et al. (1990) conclude that accretion disks can be stable only if their masses are less than 0.3 . For , theory predicts that gravitational instabilities that induce spiral density waves appear, leading to a rapid fragmentation of the disk (Laughlin & Bodenheimer, 1994; Yorke, 1995). The upper panel of Fig. 13 shows that all the circumstellar structures around the more evolved Herbig Ae stars have , and therefore should be gravitationally stable following this argument.
On the other hand, only half of the IM protostars and a handful of HM (proto)stars have . Although this could be a real effect, the most plausible explanation is that the angular resolution of the observations is not high enough to properly separate the disk emission from that of the inner part of the envelope. In such cases, has to be taken as an upper limit. It is expected that higher angular resolution () observations may reveal stable circumstellar disks around most of these sources, given the confirmed presence of outflows powered by them.
All the HM circumstellar structures with are around B-type (proto)stars and correspond to the best accretion disk candidates for which molecular line observations have revealed (quasi-)Keplerian motions (see Sect. 5.2.1). For the most massive early O-type (proto)stars, the fact that all circumstellar structures are gravitationally unstable indicates that the toroids could be indeed susceptible to gravitational instabilities and fragment in different cores as observations at increasingly higher angular resolution suggest (e.g., G29.960.02: Beuther et al., 2007).
An additional way to assess the local stability of a circumstellar disk is by evaluating Toomre’s parameter (Toomre, 1964). It is defined as
| (7) |
where is the sound speed, the surface density, and is the epicyclic frequency of the disk. The epicyclic frequency is directly proportional to the angular velocity and can be expressed as , where the proportional factor depends on the rotation curve. In case of Keplerian rotation, =1 and therefore, . According to this stability criterion, a thin disk becomes unstable against axisymmetric gravitational instabilities if . Following Cesaroni et al. (2007), we estimated as , where is the total (star plus disk) mass of the system and is the radius of the structure (Tables 1 and 2). The surface density was estimated as . For the dust temperature of the Herbig Ae stars, needed to estimate , we used the average disk temperature per stellar spectral type as reported by Natta et al. (2000). For the IM and HM (proto)stars, the dust temperature is reported in the references given in Tables 1 and 2. Structures with should be locally stable.
The lower panel of Fig. 13 shows Toomre’s parameter as a function of . The distribution of points demonstrate that the disks around the Herbig Ae stars are stable against collapse. In contrast, only about one third of the circumstellar structures around the embedded IM protostars appear Toomre stable. For the sources that are unstable we cannot discard the possibility that has been underestimated as and might be overestimated at insufficient angular resolution if the inner envelope emission is not properly resolved from that of the disk. At higher stellar masses, except for Cepheus A HW2, the only circumstellar structures showing stability are the same for which we find that . They correspond to the bona-fide protostellar disk candidates around B-type (proto)stars, discussed previously. According to Laughlin & Bodenheimer (1994), these disks are gravitationally stable (see however Cesaroni et al., 2007 about the role of heating and cooling on the stability of these disks). Nonetheless, Fig. 13 shows that the majority of the disks and toroids detected around embedded HM (proto)stars would be unstable against axisymmetric instabilities.
6.1.2 Dynamical status as a function of mass
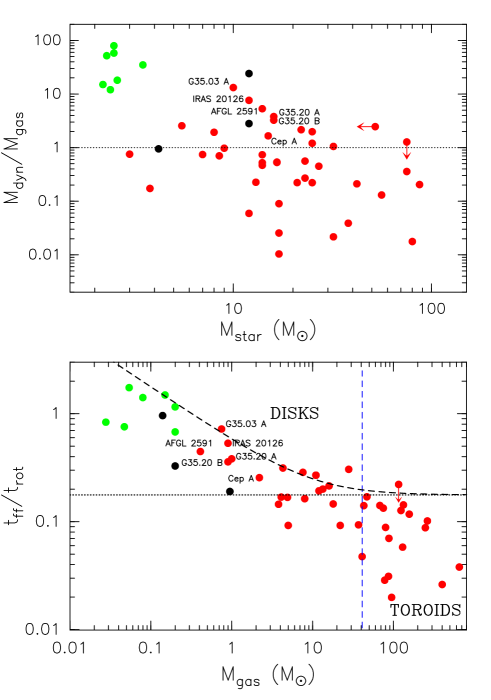
One way of assessing the dynamics of the massive circumstellar structures surrounding young stars is by evaluating the dynamical mass needed for equilibrium (see Sect 5.2.2). is estimated assuming equilibrium between centrifugal and gravitational forces. In the upper panel of Fig. 14 we plot the ratio of to the gas mass as a function of for the same sample of (proto)stars as in Fig. 13. To evaluate , the rotation velocity is required. This parameter is available only for three sources of the sample of IM protostars in Table 1, but for all forty-one HM (proto)stars of the compiled sample (see Table 2).
One can differentiate between two regions in the upper panel of Fig. 14. One for YSOs with that have mostly 1. Such objects are expected to be centrifugally supported. The other region corresponds to the sources with and 1. The Herbig Ae disks are characterized by 1, as expected. In fact, the velocity field of the disk of HD 163296 traced in -C3H2 and in CO (3–2) with ALMA Science Verification observations was successfully modelled with Keplerian rotation by Qi et al. (2013) and de Gregorio-Monsalvo et al. (2013) (see Fig. 7). The three IM protostars that populate this graph have a ratio 1, and therefore, could be centrifugally supported. The two IM sources with the highest masses are OMCS-1 139–409 and 134–411, which were discussed in detail in Sect. 5.1.1. Their bolometric luminosities, and therefore the estimated , should be taken as an upper limit because they correspond to the luminosity of the whole OMC1-S region (Zapata et al., 2007). Unfortunately, the line observations towards these three sources do not have enough angular resolution and sensitivity to properly constrain the nature of the velocity field.
Moving to the high-mass regime, one finds that for early-B and late-O type (proto)stars ( 25–30 ), the rotating structures could be centrifugally supported. In fact, the structures with a higher ratio correspond to the best accretion disk candidates around B-type (proto)stars for which molecular line observations have revealed (quasi-)Keplerian motions (see Sect. 5.2.1; Fig. 4). For the early-B and late-O type sources that have 1, the most plausible explanation is that the observations do not have enough angular resolution to properly resolve the disk emission. Finally, for the highest stellar mass regime, the early-O type (proto)stars ( 30 ), most rotating structures have 1. This confirms that the massive toroids cannot be centrifugally supported. These structures are possibly undergoing gravitational collapse (see Sect. 5.2.2). Some of the sources in the figure warrant remarks, for instance the sources with 30 that have 1, namely W51e8 and G20.080.14N. For W51e8, should be taken as an upper limit because the rotation velocity of 4 km s-1 estimated from the OCS velocity gradient could be contaminated by outflow emission (Klaassen et al., 2009). For G20.080.14N, the spectral type estimated from the Lyman-continuum photons of the Hii region is O7.5 (Galván-Madrid et al., 2009) that corresponds to a stellar mass of 25 (Davies et al., 2011; Mottram et al., 2011) instead of 52 estimated from cluster simulations (see Table 2). Therefore, 1 would be consistent with what is found for similar late-O type sources.
Following Beltrán et al. (2011a), who made a comparative study of the stability of the rotating structures around B-type and O-type stars, in the lower panel of Fig. 14 we plotted the ratio of the free-fall timescale () to the rotational period () versus for the same YSOs as in the upper panel plot. is proportional to the dynamical timescale needed to refresh the material of the rotating structure and is the rotational period at the outer radius, which is basically the timescale needed by the rotating structure to stabilize after incorporating new accreted material. Unlike Beltrán et al. (2011a), who use the radius measured from the dust continuum emission to estimate and , we used the radius estimated from line emission when possible. As Beltrán et al. (2014) point out, because has been estimated assuming spherical symmetry, the ratio for both disks and toroids could be overestimated. However, because disks and toroids around embedded (proto)stars are geometrically thick (see § 5), the correction factor, which depends on the scale height of the structures, should be small. The correction factor would be 2 if the height of the disk is 30% the disk radius and 1.6 if it is 50%. The curves in Fig. 14 (lower panel) are the theoretical curves for spherical clouds of mass containing a star of mass at the center, in which the gas is rotationally supported against the gravity of the gas plus the star. These curves can be expressed as . The curves plotted correspond to =0 and 10 .
The lower panel of Fig. 14 confirms the results of Beltrán et al. (2011a), namely, that disks and toroids are kinematically and dynamically different structures, with a twice as large sample of embedded HM (proto)stars and including IM protostars and Herbig Ae stars. In fact, this plot confirms that disks around B-type (proto)stars and toroids around O-type (proto)stars occupy two distinct regions of the plot, with disks having a higher ratio and lower . What is more, disks around B-type (proto)stars are dynamically similar to those found around IM protostars and more evolved Herbig Ae stars. Therefore, the faster the rotation of the structure the more similar to a true accretion disk is, because due to the shorter rotation timescales, the infalling material has enough time to settle into a centrifugally supported disk. In fact, as shown in Fig. 14, the disks around B-type (proto)stars that have are the Keplerian disk candidates. On the other hand, the rotation timescale for the more massive toroids is so large that the infalling material does not have enough time to reach centrifugal equilibrium. In this case, the rotating structure is a transient toroid for which rotation plays a little role in supporting it. As already mentioned, these massive toroids could be self-gravitating structures probably supported by thermal pressure, turbulence and/or magnetic fields or pseudo-disks if these toroids are infalling.
6.2 Mass accretion rate evolution
6.2.1 Infall rates vs accretion rates
In Sect. 4.7 we have described different ways to estimate the mass accretion rate onto IM and HM (proto)stars. We noted that most of these parameters actually measure the mass infall rate . This quantity corresponds to motion of material belonging to the larger scale toroid or envelope and not to the disk. The disk material will be accreted onto the central star at rate . To avoid confusion, we use when discussing infall rates estimated with one of these methods. Comparing with can provide an idea on how the material infalling onto the disk or toroid is incorporated into the central accreting (proto)star.
The four panels of Fig. 15 show the mass infall rate estimated by three different methods and the mass accretion rate estimated from the outflow mass-loss rate (see Sect. 4.7). These quantities are presented as function of the stellar mass (Tables 1 and 2). Panel a depicts the infall rate derived from observations of red-shifted absorption features in spectrally resolved molecular line profiles (see Eq. 3). To generate such absorption components a background source surrounded by a much colder envelope is required. The background source can either be a bright (hyper)compact Hii region or a dust continuum emission source. This requirement renders this method limited in its application and for only a few HM (proto)stars a red-shifted absorption component has been observed. Panel b presents the mass infall rate estimated by assuming that the infall velocity is equal to the rotation velocity (Allen et al., 2003; see Eq. 4). This quantity could be estimated for all the HM (proto)stars and for the three IM protostars with rotation velocity information available. The quantity presented in panel c is which assumes that all the material in the circumstellar structure will undergo infall in a free-fall time (see Eq. 5). Finally, in panel d the mass accretion rate is estimated from the outflow mass-loss rate assuming momentum rate conservation and a relation between the jet mass-loss rate and the accretion rate (Tomisaka, 1998; Shu et al., 1999; see Eq. 6). This quantity was derived only for those YSOs for which interferometric observations of molecular outflows are available. For a few cases, the direction and number of molecular outflows associated with a YSO is not evident, even with interferometric observations (e.g., G31.41+0.31: Cesaroni et al., 2011). In such cases, not being sure which were the powering sources of the molecular outflows, we refrained from estimating .
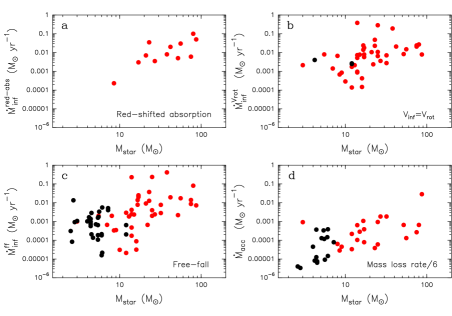
The conclusion that one can draw from Fig. 15 is that the infall rate increases with the mass of the central star. Moreover, the infall rate has relatively high values no matter the method used to estimate it. For those sources for which the infall rate has been estimated with more than one method, the values of are consistent within a factor of 10 (see Fig. 16). The values of are of the order of – yr-1, being as high as 0.1 yr-1 for the most massive O-type (proto)stars. On the other hand, the values of derived from are of the order of – yr-1. The infall rates appear therefore to be much larger that the accretion rate. This observation is further illustrated in Fig. 16. Here we show the ratio for all the IM and HM (proto)stars, obtained using the three different methods to estimate . Because is available only for three IM protostars, we decided to use only for this mass range sources. No red-shifted absorption has been detected towards IM protostars, so there are no estimates of . As seen in this figure, except for a couple of YSOs, is always higher than , independently of the method used to estimate . The ratio can be as high as 200 for .
As already mentioned in Sect. 4.7, the main uncertainty in estimating the infall rate from red-shifted absorbed profiles is the radius at which is measured. Most authors use the radius of the core, and therefore should be taken as an upper limit. However, this uncertainty in the radius at which absorption occurs would possibly account only for a factor up to 10 (e.g., G24.78+0.08 A: Beltrán et al., 2006c; W51 North: Zapata et al., 2008; G31.41+0.31: Girart et al., 2009). The ratio is as high as 1000 for both and . For the IM protostars, the ratio ranges from about 1 to 450. As seen in Fig. 16, there is no correlation with the mass of the central (proto)star and the result does not seem to depend on the method used to estimate . This suggests that is indeed higher than .
A possible explanation for this systematic result is related to the nature of interferometric observations. As has been mentioned before interferometers could filter out extended emission. If this extended emission is part of the molecular outflow then the measured is underestimated as well as . However, this observational explanation is unlikely, as López-Sepulcre et al. (2010) obtained a similar result for a sample of high-mass clumps which were observed with a single-dish telescope. In particular, these authors found infall rates 2 to 4 orders of magnitude higher than the accretion rates estimated from outflow mass loss rates. Another possible explanation could be that the ratio is not 3 as theoretically proposed by Tomisaka (1998) and Shu et al. (1999) but higher. This implies that the efficiency of the jet/outflow in removing material from the disk would be lower than expected.
What we consider as the most likely explanation for the observed fact that is stellar multiplicity: the infalling material is not accreted onto the single star that is responsible for the molecular outflow, but onto a cluster of stars. This explanation seems plausible for the most massive O-type (proto)stars, because as already explained, the sizes and masses of the rotating toroids suggest that they are enshrouding stellar (proto)clusters (see Cesaroni et al., 2007). The fact that the result found by López-Sepulcre et al. (2010) at parsec scales, that is, , still holds at much smaller scales suggests that the embedded clusters would be very concentrated towards the center of the clump. However, this explanation cannot solve the problem for the IM protostars and probably neither for the B-type (proto)stars. As shown in Fig. 16, for IM protostars with 2–3 , the ratio is still 20–300, with of the order of 0.3–1.4 . Therefore, although these disks could be circumbinary disks, it seems unlikely that they are circumcluster structures surrounding several members. What is more, if one takes into account for typical low-mass Class 0/I protostars like B335 (Zhou et al., 1993), L483 (Tafalla et al., 2000), L1228 (Arce & Sargent, 2004), L1157, BHR 71, L1527 IRS (Mottram et al., 2013), L1551 IRS 5 (Chou et al., 2014), L1485 IRS (Yen et al., 2014) and compares it to estimated from the outflow mass loss rate (Hogerheijde et al., 1998; Arce & Sargent, 2006; Dunham et al., 2014), the ratio is still . Actually, the ratio is as high as 12 for L1228.
The apparent implication of Fig. 16 is that infalling material needs to pile up in the disk and results in disk masses which are tens to hundreds of solar masses given the observed rates. This is massive and suggests a gravitationally unstable disk inducing variable, “FUOri-like” accretion events onto the central object. Comparing this reasoning to observations in low-mass stars, Terebey et al. (1993) demonstrate from millimeter observations that the disk mass during the embedded phase is hardly different from the one of T Tauri disks. This implies that while the infalling envelope is feeding the disk with material, there is no significant change in mass. The combined mass sinks in the system (the jet/outflow and the accretion onto the star) are in balance with the envelope mass infall rate. It seems therefore critical in IM and HM (proto)stars that more reliable measurements of mass accretion rates onto the star are obtained. One such potential tracer apt for young embedded objects is the emission of mid-IR hydrogen recombination lines (see e.g. Rigliaco et al., 2015).
6.2.2 Disk accretion rates as a function of stellar mass and time
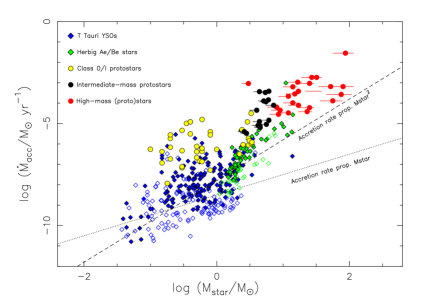
The dependence of the accretion rate on the stellar mass for low-mass stars has been widely studied through observational and theoretical works (see Ercolano et al., 2014 and references therein). These studies indicate that for low-mass PMS stars , with 1.5–2.0. The physical origin of such a steep – correlation is a matter of debate and while some authors propose that it is the consequence of the initial conditions during disk formation followed by viscous disk accretion evolution (Alexander, 2008), others, on the contrary, suggest that this relationship is the natural outcome of disk evolution, and in particular, of disk dispersal by X-ray photoevaporation (Ercolano et al., 2014).
With the data collected in this review, we are in the position to extend the mass range and to compare the embedded objects to the optically revealed ones. This is the purpose of Fig. 17. It shows the trend of as a function of for different samples of YSOs in different evolutionary phases: low mass Class 0/I YSOs and T Tauri stars, IM protostars and Herbig Ae/Be stars, and HM (proto)stars. The mass accretion rate has been estimated from the outflow mass-loss rate (Eq. 6) for the most embedded objects: Class 0/I, IM and HM (proto)stars. The Class 0/I protostars have been observed by Yun & Clemens (1994), Hogerheijde et al. (1998), Arce & Sargent (2006), Dunham et al. (2014), and Dunham et al. (in preparation). Like for the IM and HM (proto)stars of our compiled sample, the mass loss rate has been corrected for opacity and assuming a mean source inclination of 32.7∘ with respect to the plane of the sky. Following Hogerheijde et al. (1998), has been estimated assuming that all the bolometric luminosity is stellar and that the object is on the birthline. The pre-main-sequence evolutionary tracks used to estimate the location of the birthline and are from Stahler & Palla (2005).
The sample of T Tauri stars used in Fig. 17 has been observed by Gullbring et al. (1998), Calvet et al. (2004), Natta et al. (2006), and Antoniucci et al. (2014). Gullbring et al. (1998) estimate for a sample of T Tauri stars in the Taurus molecular cloud from the excess continuum emission in the 3200–5200 Å wavelength range. Calvet et al. (2004) estimate for a sample of IM T Tauri stars, which are a subset of the T Tauri class with masses . The sources are located in the Taurus-Auriga clouds, the Ori OB1c association in the Orion Nebula cluster and the ring around Ori. The mass accretion rates are estimated from the accretion luminosity , which was obtained from the optical-UV excess, and the stellar parameters. Natta et al. (2006) estimate for a sample of T Tauri stars in the -Ophiuchi star-forming region from Br line emission. The accretion and stellar parameters have been re-calculated by Manara et al. (2013) for a corrected distance to the region of 125 pc. Antoniucci et al. (2014) estimate for a sample of T Tauri stars in the Chamaleon, L1641, Serpens, and Lupus star-forming region from Br line emission and from the Pa line for those few sources for which Br emission was not detected. Finally, the sample of Herbig Ae/Be stars has been observed by Fairlamb et al. (2015) and estimated from the UV Balmer excess.
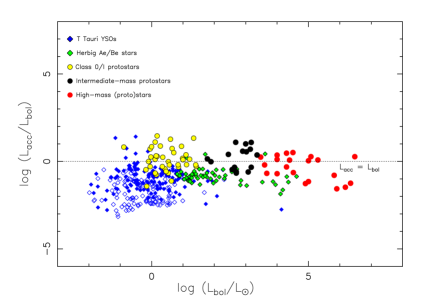
Figure 17 shows a general trend of increased with larger stellar masses. To facilitate comparison with previous work we have added a line showing the relation of . Overall, the objects follow this relation over the full mass range, but with orders of magnitude scatter per mass-bin. Figure 17 shows that of PMS objects is 1-2 orders of magnitude lower than that of embedded YSOs, which suggests a decrease of with time. It complies with the expectation that the embedded objects are in their main accretion phase and accrete material onto the receiving star at a much higher rate. The average is time dependent and decreases with age, as already established by studies of disk evolution for T Tauri (e.g., Hartmann, 1998) and HAeBe (e.g., Mendigutía et al., 2012) stars. Figure 17 also suggests that both embedded and PMS objects display a similar dependence of on with the relation for the embedded objects offset to higher values. This inference cannot be tested over the full mass range as, clearly, no optically revealed high-mass stars with primordial disks are known to exist and the area for masses is therefore void in Fig. 17.
The fact that a relation between and is apparent for such a broad range of stellar masses (and luminosities) could indicate that there is continuity in the accretion process from low-mass to high-mass and that the accreting mechanism is driven by similar processes for all luminosities.
By converting to , we can obtain insight into the fraction of bolometric luminosity contributed by the accretion process as function of mass and evolutionary phase. This is presented in Fig. 18, showing the accretion luminosity as a function of the bolometric luminosity for the same sample of objects as in Fig. 17. was estimated as follows. For the embedded Class 0/I, IM, and HM (proto)stars, we applied the relation , where is the stellar radius and is estimated from the outflow mass loss rate. We adopt stellar radii for the HM (proto)stars under the assumption that the sources are already on the ZAMS (values taken from the tabulation in Davies et al., 2011). We ignore therefore the possibility that the objects are swollen up because of high accretion rates (Hosokawa et al., 2010). The stellar radii of the IM protostars are adopted from Palla & Stahler (1992) for a protostellar mass accretion rate of yr-1, based on the values estimated from the mass loss rate (see Fig. 17). For the Class 0/I protostars, was estimated assuming that the sources are on the birthline and following Table 16.1 of Stahler & Palla (2005), where the estimated values have been computed for a constant accretion rate of yr-1. Finally, the bolometric luminosity of the T Tauri and HAeBes stars was assumed to be equal to the stellar luminosity tabulated by the different authors. The result in Fig. 18 demonstrates that for very few PMS stars accretion is the dominant source of luminosity. Among the HAeBe stars there are only a few notable exceptions like FU Ori. On the other hand, the embedded sources, although scattered around the one-to-one relation, have bolometric luminosities comparable to the estimated accretion luminosities.
7 Summary and outlook
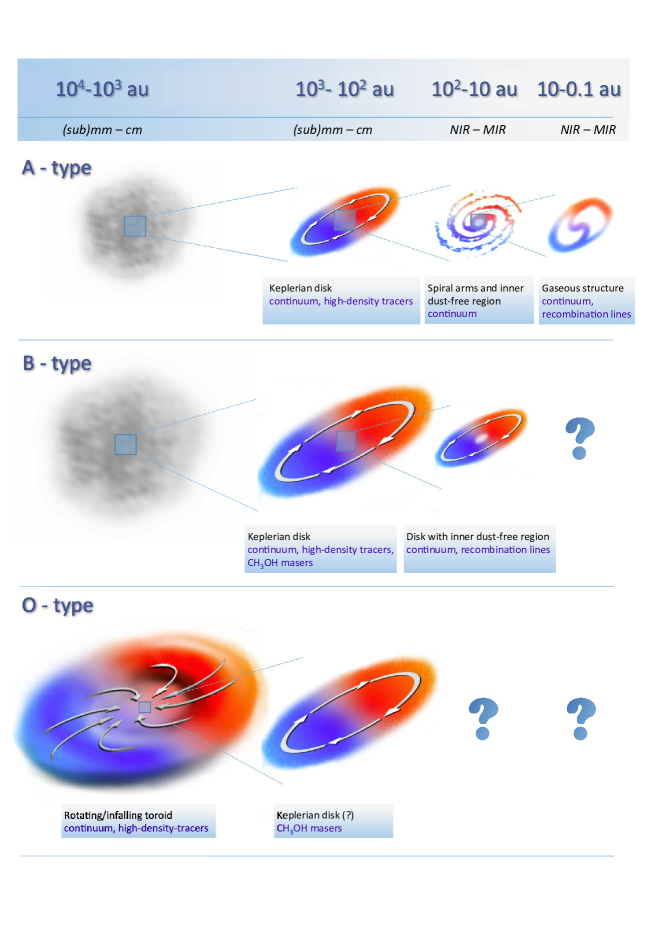
7.1 Summary
We have presented an overview of advancements in the field of accretion in young high-mass stars based on spatially resolved observations. Our efforts were aimed at putting into context the structures found around these stars by also reviewing the intermediate-mass objects, both in the embedded as well as in the pre-main sequence phase. The focus of the review was to summarize the basic physical properties of the disks and the toroids alongside the various methods used in the literature. In Fig. 19 we present a schematical version of our summary showing our knowledge of accretion disks around intermediate- (A-type) and high-mass (B- and O-type) young stars as acquired with radio/mm and optical/IR interferometry.
As seen in this schematic, the sizes of the observed circumstellar structures vary depending on the spectral type of the young star. This is in part an effect of the different spatial scales traced by the instruments due to the different distances of the YSOs. While intermediate-mass A-type young stars are on average located at distances of 1 kpc, high-mass O-type stars are usually located at 5 kpc. The different sizes are also in part a real effect, in the sense that higher-mass objects have larger circumstellar structures.
Radio/mm interferometric observations of embedded IM protostars (A to late-B spectral type) have revealed circumstellar disks with typical radii of a few hundreds of au. Radii of 100 au have been reported for a few IM protostars observed at an angular resolution better than . These disks are geometrically thick with a hydrostatic scale height that is more than 20–30% their radius. The disk masses turn out to be a few 1 which is less than that of the associated central star. These circumstellar disks could therefore be in Keplerian rotation. Detailed molecular line observations of a few embedded IM protostars have revealed velocity gradients suggestive of rotation. However, up to now, the nature of this rotation is unknown. The fact that Keplerian rotation has been clearly detected towards the more evolved HAeBe stars, thanks to radio/mm molecular line interferometric observations, leads us to expect that the disks around the younger IM protostars are also centrifugally supported. Overall, the circumstellar disks of IM protostars are similar to those of their lower mass counterparts, at least down to spatial scales of 100 au.
OI observations of the optically revealed IM YSOs, that is the Herbig AeBe stars, reveal the complexity of the innermost (100 au) regions of circumstellar disks around IM stars. Importantly, OI can probe the structure and nature of the disk interior to the dust sublimation region. Evidence is building that a large fraction of the emission is not coming from the region in the disk where a transition takes place between gas dominated to dust dominated opacity, i.e. the inner rim of the dust disk. Spectroscopic observations are suggesting that the IM PMS stars are actively accreting objects, possibly through the process of magneto-spheric accretion. In this sense the IM PMS stars can be quite similar to the lower mass T Tauri stars. Nonetheless, and what is well known and anticipated, OI has demonstrated the transition in accretion dynamics that takes place in this mass regime. The total disk mass may become much less massive in the B-type stars as a sign of rapid dispersal, the inner disk ( au), nonetheless, may still be very dense and indeed actively accreting. At least it is clearly measured that disk erosion takes place at the inner disk. Based on direct imaging and OI, it is becoming clear that the disk structure of the IM PMS is varied and there is need to understand better how these structural differences relate to the disk processes we know.
Evidence for circumstellar disks has been found for HM (proto)stars of early-B to late-O spectral type, with luminosities up to 10 that correspond to ZAMS stars of about 25–30 . Typical radii of these disks are a few thousands of au, although radii as small as a few hundreds of au have been estimated thanks to angularly resolved observations from centimeter to sub-millimeter wavelengths and to VLBI CH3OH maser emission observations. These geometrically thick structures have scale heights of 30–40% of their radii. Disk masses range from a few to a few tens of and in general are consistent with or smaller than the mass of the central star. Detailed high-density tracer observations at radio/mm wavelengths have revealed velocity gradients in these disks consistent with (quasi-)Keplerian rotation, which has also been suggested by methanol maser emission. These Keplerian disk candidates are gravitationally stable as suggested by the fact that and that Toomre’s stability parameter is . Summarizing, the basic properties of the disks around early-B to late-O spectral type (proto)stars appear as a scaled-up versions of those found for disks around low- and intermediate-mass protostars.
Optical/IR interferometry observations of early-B and late-O type (proto)stars have provided access to the inner regions of their circumstellar disks by allowing to resolve spatial scales of 10 to 100 au. Although this technique applied to embedded sources is still scratching the surface, we do know now that the disk can persist to a scale of a couple au. Indeed, an important fraction of NIR and MIR dust continuum emission comes from the circumstellar disk and not only from scattered light and/or envelope emission. Therefore, the near-future NIR and MIR instruments will be able to provide much better constraints on the disk.
Early-O type (proto)stars, with luminosities 105 , appear to be surrounded by huge and massive structures called toroids. Their radii of 103–104 au and masses of a few 100 and the fact that their scale height is 50% of their radius clearly differentiate them from the circumstellar disks around lower-mass YSOs. Velocity gradients suggestive of rotation have been observed in these toroids through observations of high-density tracers from centimeter to (sub)millimeter wavelengths. However, the fact that usually (in a few cases higher by more than one order of magnitude) precludes the rotation from being Keplerian. Toroids are unstable against axisymmetric instabilities as indicated by the fact that and is , and could be susceptible to gravitational collapse and fragmentation. Instability against gravitational collapse is also suggested by the fact that their dynamical mass is and therefore, toroids cannot be centrifugally supported. Indeed, evidence of infall has been detected in some of them. Summarizing, toroids around early-O type (proto)stars are probably pseudo-disks that will never reach equilibrium and with lifetimes of the order of the free-fall time. Single-epoch VLBI maser emission observations of early-O type (proto)stars have revealed CH3OH maser features in elongated structures of 1000 au in size that could be tracing circumstellar disks. Only multi-epoch VLBI observations that permit to measure the proper motions will confirm whether the masers are tracing indeed the rotation of a disk.
Typical mass infall rate values for IM and HM YSOs are of the order of 10-3–10-2 yr-1 and can be as high as 0.1 yr-1 for the most massive O-type (proto)stars, while those of mass accretion rate onto the central (proto)star are of the order of 10-4–10-3 yr-1. Both and increase with stellar mass, with usually (in a few cases up to 3 orders of magnitude) for both IM and HM (proto)stars. The most likely explanation for the discrepancy between infall and accretion rates for the most massive O-type (proto)stars is that the material infalling onto the disk or toroid is not accreted onto a single YSO but a cluster. On the other hand, for IM and B-type (proto)stars the infalling material could be piling up in the disk and not being incorporated onto the central star at the same infalling rate.
The mass accretion rate scales with the stellar mass according to a power-law with an exponent close to 2. This dependence of on the square of holds for a broad range of luminosities (from low- to high-mass) and evolutionary stages (from embedded to optically revealed YSOs). This suggests that there is a continuity in the accretion process from the low- to the high-mass regime and that the accreting mechanism could be the same for all luminosities. decreases by 1-2 orders of magnitude from the embedded phase to the PMS phase, in agreement with star-formation and disk evolution theory.
7.2 Outlook
New opportunities for revealing the structure and nature of the accretion disks around IM and HM young stars will present themselves in the near future. Indeed, the data obtained in the first cycles of the ALMA observatory will significantly advance our understanding of the initial conditions of star and planet formation and the young star accretion process. The systematic use of the longest baselines of up to 15 km s-1, that will provide maximum angular resolutions of 5–10 milli-arcseconds at the highest frequency bands, and the higher sensitivity achieved by ALMA will allow us to glimpse into the massive toroids around O-type young stars and to study the kinematics of the inner regions (10 au) of circumstellar disks around B-type (proto)stars. As illustration of the ALMA capabilities, we can mention here the results on the disk around the low-mass protostar HL Tau (see Fig. 2). Future projects will be aimed specifically to achieve an improved view on the exact geometry of the circumstellar material, the evolution of this geometry and the rates of infall from the envelope and accretion onto the star. These aims will lead to a substantially better understanding of IM and HM star formation and the phenomena related to it.
As far as OI is concerned, important steps forward in the star-formation arena will be delivered by the second generation of VLT-I instruments. The two new four telescope beam-combiners will be installed and put in operation in the coming years. MATISSE constitutes an important step forward in OI as it opens the important mid-IR L- and M-bands. The amount of young star disks accessible with OI will therefore increase as the objects are brighter at these wavelengths than at K-band. Importantly, disks at earlier, embedded evolutionary phases will now be within reach of OI and image reconstruction techniques. Some results suggest that the disk emission is strong and possibly dominating the continuum at 5 m. Spectrally resolved OI with MATISSE will also allow to trace disk kinematics using the line emission of 12CO. The mid-IR OI data will be supplemented with studies of the accretion rate. In particular, Humphreys in the atmospheric N-band was recently discovered to be an effective accretion tracer in low-mass Class 0 objects (Rigliaco et al., 2015) and holds promise to become a key accretion tracer for high-mass YSOs. The other second generation VLTI instrument is Gravity. It operates in K-band and promises to reach faint () objects routinely. The instrument is equipped with near-IR wavefront sensors, which is of crucial importance for studies in star-forming regions. The Gravity imaging mode is most relevant for continuum and line studies of the disks around young stars.
The 2nd generation VLTI instruments provide synergy between OI and radio/mm interferometry. This is especially relevant for the disks of high-mass stars in their main accretion phase. As the structure of the disk is directly related to the radial temperature profile, knowledge of the disk properties necessarily involves observations covering the full wavelength range. These allow the first characterizations of the accretion environment around high-mass YSOs from 10 to 1000 au.
Synergetic studies is what current/near-future facilities allow us to perform, nonetheless the angular resolution may not always be adequate. It is clear that among the young stars, the most massive object with a centrifugally supported disk is so far. Stepping up in mass, the finest (sub)millimeter observations reveal only rotating structures at 10,000 au scales which are not in Keplerian rotation. ALMA will probe scales au and thus not resolve the crucial star/disk interface. For OI, the current baselines are not adequate for e.g. resolving stellar surfaces (except for a few supergiants), and in the context of high-mass star formation this is something desirable for the optically revealed early-type pre-main sequence stars. Continuing demands for increased spatial resolution drive e.g. the Planet Formation Imager concept, and intensity interferometry at the Cerenkov Telescope Array and set new challenges beyond 2020. Ideas for innovation are bountiful and are partially driven by the need to understand the accretion disks around young stars.
Acknowledgments
We would like to thank the following people for their input in discussion on accretion in young stars: J. Fairlamb, C. Manara, M. Dunham, H. Arce, T. Alonso-Albi, K. Shiro. We thank L. Carbonaro for his help on the graphics. We thank T. van Kempen for providing us the NGC 2071 maps and P. Boley for preparing the figure of V 921 Sco. We would like to thank especially D. Galli, R. Cesaroni, and I. Mendigutía for reading a preliminary version of the manuscript. M. T. Beltrán thanks the ESO Chile Scientific Visitor Programme. This research has made extensive use of NASA’s Astrophysics Data System.
References
- Acke et al. (2005) Acke, B., Ancker, M. E. V. D., & Dullemond, C. P. 2005, A&A, 436, 209
- Acke & van den Ancker (2004) Acke, B., & van den Ancker, M. 2004, A&A, 426, 151
- Adams & Shu (1986) Adams, F., & Shu, F. 1986, ApJ, 308, 836
- Alecian et al. (2013) Alecian, E., Wade, G. a., Catala, C., Grunhut, J. H., Landstreet, J. D., Bagnulo, S., Folsom, C. P., Marsden, S., & Waite, I. 2013, MNRAS, 429, 1001
- Alexander (2008) Alexander, R. 2008, New Astron. Rev., 52, 60
- Allen et al. (2003) Allen, A., Li, Z.-Y., & Shu, F. 2003, ApJ, 599, 363
- Alonso-Albi et al. (2009) Alonso-Albi, T., Fuente, A., Bachiller, R., Neri, R., Planesas, P., Testi, L., Berné, O., & Joblin, C. 2009, A&A, 497, 117
- André et al. (2014) André, P., Di Francesco, J., Ward-Thompson, D., Inutsuka, S.-I., Pudritz, R., & Pineda, J. 2014, Protostars Planets VI, 27
- Andrews & Williams (2007) Andrews, S., & Williams, J. 2007, ApJ, 659, 705
- Antoniucci et al. (2014) Antoniucci, S., R, G. L., Nisini, B., A, C. G., Giannini, T., & Lorenzetti, D. 2014, A&A, 572, 62
- Arce & Sargent (2004) Arce, H., & Sargent, A. 2004, ApJ, 612, 342
- Arce & Sargent (2006) — 2006, ApJ, 646, 1070
- Armitage (2011) Armitage, P. J. 2011, ARA&A, 49, 195
- Aumann et al. (1984) Aumann, H., Beichman, C., Gillett, F., de Jong, T., Houck, J., Low, F., Neugebauer, G., Walker, R., & Wesselius, P. 1984, ApJ, 278, L23
- Bagnoli et al. (2010) Bagnoli, T., van Lieshout, R., Waters, L., van der Plas, G., Acke, B., van Winckel, H., Raskin, G., & Meerburg, P. 2010, ApJ, 724, L5
- Baldwin et al. (1996) Baldwin, J., Beckett, M., Boysen, R., Burns, D., Buscher, D., Cox, G., Haniff, C., Mackay, C., Nightingale, N., Rogers, J., Scheuer, P., Scott, T., Tuthill, P., Warner, P., Wilson, D., & Wilson, R. 1996, A&A, 306, L13
- Bartkiewicz et al. (2005) Bartkiewicz, A., Szymczak, M., & van Langevelde, H. 2005, A&A, 442, L61
- Bartkiewicz et al. (2009) Bartkiewicz, A., Szymczak, M., van Langevelde, H., Richards, A., & Pihlström, Y. 2009, A&A, 502, 155
- Beckwith et al. (1990) Beckwith, S., Sargent, A., Chini, R., & Guesten, R. 1990, AJ, 99, 924
- Behrend & Maeder (2001) Behrend, R., & Maeder, A. 2001, A&A, 373, 190
- Beltrán (2015) Beltrán, M. 2015, Ap&SS, 355, 283
- Beltrán et al. (2006a) Beltrán, M., Brand, J., Cesaroni, R., Fontani, F., Pezzuto, S., Testi, L., & Molinari, S. 2006a, A&A, 447, 221
- Beltrán et al. (2006b) Beltrán, M., Cesaroni, R., Codella, C., Testi, L., Furuya, R., & Olmi, L. 2006b, Nature, 443, 427
- Beltrán et al. (2011a) Beltrán, M., Cesaroni, R., Neri, R., & Codella, C. 2011a, A&A, 525, A151
- Beltrán et al. (2004) Beltrán, M., Cesaroni, R., Neri, R., Codella, C., Furuya, R., Testi, L., & Olmi, L. 2004, ApJ, 601, L187
- Beltrán et al. (2005) — 2005, A&A, 435, 901
- Beltrán et al. (2011b) Beltrán, M., Cesaroni, R., Zhang, Q., Galván-Madrid, R., Beuther, H., Fallscheer, C., Neri, R., & Codella, C. 2011b, A&A, 532, A91
- Beltrán et al. (2008) Beltrán, M., Estalella, R., Girart, J., Ho, P., & Anglada, G. 2008, A&A, 481, 93
- Beltrán et al. (2006c) Beltrán, M., Girart, J., & Estalella, R. 2006c, A&A, 457, 865
- Beltrán et al. (2002) Beltrán, M., Girart, J., Estalella, R., Ho, P., & Palau, A. 2002, ApJ, 573, 246
- Beltrán et al. (2013) Beltrán, M., Olmi, L., Cesaroni, R., Schisano, E., Elia, D., Molinari, S., Di Giorgio, A., Kirk, J., Mottram, J., Pestalozzi, M., Testi, L., & Thompson, M. 2013, A&A, 552, A123
- Beltrán et al. (2014) Beltrán, M., Sánchez-Monge, A., Cesaroni, R., Kumar, M., Galli, D., Walmsley, C., Etoka, S., Furuya, R., Moscadelli, L., Stanke, T., van der Tak, F., Vig, S., Wang, K.-S., Zinnecker, H., Elia, D., & Schisano, E. 2014, A&A, 571, A52
- Benisty et al. (2011) Benisty, M., Renard, S., Natta, A., Berger, J. P., Massi, F., Malbet, F., Garcia, P. J. V., Isella, A., Mérand, A., Monin, J. L., Testi, L., Thiébaut, E., Vannier, M., & Weigelt, G. 2011, A&A, 531, 84
- Benisty et al. (2010) Benisty, M., Tatulli, E., Ménard, F., & Swain, M. R. 2010, A&A, 511, A75
- Berger et al. (2012) Berger, J., Malbet, F., Baron, F., & Others 2012, A&ARv, 20, 53
- Bergin & Tafalla (2007) Bergin, E., & Tafalla, M. 2007, ARA&A, 45, 339
- Bernard et al. (1999) Bernard, J., Dobashi, K., & Momose, M. 1999, A&A, 350, 197
- Beuther et al. (2012) Beuther, H., Linz, H., & Henning, T. 2012, A&A, 543, A88
- Beuther et al. (2004) Beuther, H., Schilke, P., & Gueth, F. 2004, ApJ, 608, 330
- Beuther et al. (2002a) Beuther, H., Schilke, P., Menten, K., Motte, F., Sridharan, T., & Wyrowski, F. 2002a, ApJ, 566, 945
- Beuther et al. (2002b) Beuther, H., Schilke, P., Sridharan, T., & Others 2002b, A&A, 383, 892
- Beuther & Walsh (2008) Beuther, H., & Walsh, A. 2008, ApJ, 673, L55
- Beuther et al. (2008) Beuther, H., Walsh, A., Thorwirth, S., Zhang, Q., Hunter, T., Megeath, S., & Menten, K. 2008, A&A, 481, 169
- Beuther et al. (2007) Beuther, H., Zhang, Q., Hunter, T., Sridharan, T., & Bergin, E. 2007, A&A, 473, 493
- Beuther et al. (2005) Beuther, H., Zhang, Q., Sridharan, T., & Chen, Y. 2005, ApJ, 628, 800
- Bik & Thi (2004) Bik, A., & Thi, W. 2004, A&A, 427, L13
- Blum et al. (2004) Blum, R., Barbosa, C., Damineli, A., Conti, P., & Ridgway, S. 2004, ApJ, 617, 1167
- Boley et al. (2013) Boley, P., Linz, H., van Boekel, R., Henning, T., Feldt, M., Kaper, L., Leinert, C., Müller, A., Pascucci, I., Robberto, M., Stecklum, B., Waters, L., & Zinnecker, H. 2013, A&A, 558, A24
- Bonnell & Bate (2006) Bonnell, I., & Bate, M. 2006, MNRAS, 370, 488
- Bonnell et al. (1998) Bonnell, I., Bate, M., & Zinnecker, H. 1998, MNRAS, 298, 93
- Bontemps et al. (1996) Bontemps, S., Andre, P., Terebey, S., & Cabrit, S. 1996, A&A, 311, 858
- Bouvier et al. (2007) Bouvier, J., Alencar, S., Harries, T., Johns-Krull, C., & Romanova, M. 2007, Protostars and Planets, V, 479
- Brittain et al. (2007) Brittain, S., Simon, T., Najita, J., & Rettig, T. 2007, ApJ, 659, 685
- Burrows et al. (1996) Burrows, C., Stapelfeldt, K., Watson, A., Krist, J., Ballester, G., Clarke, J., Crisp, D., Gallagher III, J., Griffiths, R., Hester, J., Hoessel, J., Holtzman, J., Mould, J., Scowen, P., Trauger, J., & Westphal, J. 1996, ApJ, 473, 437
- Cabrit & Bertout (1992) Cabrit, S., & Bertout, C. 1992, A&A, 261, 274
- Calvet & Gullbring (1998) Calvet, N., & Gullbring, E. 1998, ApJ, 509, 802
- Calvet et al. (2004) Calvet, N., Muzerolle, J., Briceño, C., Hernández, J., Hartmann, L., Saucedo, J. L., & Gordon, K. D. 2004, AJ, 128, 1294
- Campbell & Thompson (1984) Campbell, B., & Thompson, R. 1984, ApJ, 279, 650
- Carral et al. (1999) Carral, P., Kurtz, S., Rodríguez, L., Martí, J., Lizano, S., & Osorio, M. 1999, Rev. Mexicana Astron. Astrofis., 35, 97
- Carrasco-González et al. (2012) Carrasco-González, C., Osorio, M., Anglada, G., D’Alessio, P., Rodríguez, L., Gómez, J., & Torrelles, J. 2012, ApJ, 746, 71
- Carrasco-González et al. (2015) Carrasco-González, C., Torrelles, J., Cantó, J., Curiel, S., Surcis, G., Vlemmings, W., van Langevelde, H., Goddi, C., Anglada, G., Kim, S.-W., Kim, J.-S., & Gómez, J. 2015, Science (80-. )., 348, 114
- Cauley & Johns-Krull (2014) Cauley, P. W., & Johns-Krull, C. M. 2014, ApJ, 797, 112
- Cesaroni et al. (2011) Cesaroni, R., Beltrán, M., Zhang, Q., Beuther, H., & Fallscheer, C. 2011, A&A, 533, A73
- Cesaroni et al. (2007) Cesaroni, R., Galli, D., Lodato, G., Walmsley, C., & Zhang, Q. 2007, Protostars and Planets, V, 197
- Cesaroni et al. (2006) Cesaroni, R., Galli, D., Lodato, G., Walmsley, M., & Zhang, Q. 2006, Nature, 444, 703
- Cesaroni et al. (2014) Cesaroni, R., Galli, D., Neri, R., & Walmsley, C. 2014, A&A, 566, A73
- Cesaroni et al. (2013) Cesaroni, R., Massi, F., Arcidiacono, C., Beltrán, M., McCarthy, D., Kulesa, C., Boutsia, K., Paris, D., Quirós-Pacheco, F., & Xompero, M. 2013, A&A, 549, A146
- Cesaroni et al. (2005) Cesaroni, R., Neri, R., Olmi, L., Testi, L., Walmsley, C., & Hofner, P. 2005, A&A, 434, 1039
- Chabrier (2005) Chabrier, G. 2005, in Initial Mass Funct. 50 Years Later, edited by E. Corbelli, F. Palla, & H. Zinnecker, vol. 327 of Astrophysics and Space Science Library, 41
- Chen et al. (2007) Chen, H.-R., Su, Y.-N., Liu, S.-Y., Hunter, T., Wilner, D., Zhang, Q., Lim, J., Ho, P., Ohashi, N., & Hirano, N. 2007, ApJ, 654, L87
- Chou et al. (2014) Chou, T.-L., Takakuwa, S., Yen, H.-W., Ohashi, N., & Ho, P. 2014, ApJ, 796, 70
- Codella et al. (2014) Codella, C., Cabrit, S., Gueth, F., Podio, L., Leurini, S., Bachiller, R., Gusdorf, A., Lefloch, B., Nisini, B., Tafalla, M., & Yvart, W. 2014, A&A, 568, L5
- Cohen et al. (1989) Cohen, M., Emerson, J., & Beichman, C. 1989, ApJ, 339, 455
- Comito et al. (2007) Comito, C., Schilke, P., Endesfelder, U., Jiménez-Serra, I., & Martín-Pintado, J. 2007, A&A, 469, 207
- Costigan et al. (2014) Costigan, G., Vink, J., Scholz, A., Ray, T., & Testi, L. 2014, MNRAS, 440, 3444
- Cragg et al. (2005) Cragg, D., Sobolev, A., & Godfrey, P. 2005, MNRAS, 360, 533
- Crimier et al. (2009) Crimier, N., Ceccarelli, C., Lefloch, B., & Faure, A. 2009, A&A, 506, 1229
- Curiel et al. (1989) Curiel, S., Rodriguez, L., Bohigas, J., Roth, M., Canto, J., & Torrelles, J. 1989, Astrophys. Lett. Commun., 27, 299
- Davies et al. (2011) Davies, B., Hoare, M., Lumsden, S., Hosokawa, T., Oudmaijer, R., Urquhart, J., Mottram, J., & Stead, J. 2011, MNRAS, 416, 972
- Davies et al. (2010) Davies, B., Lumsden, S., Hoare, M., & Others 2010, MNRAS, 402, 1504
- De Buizer (2003) De Buizer, J. 2003, MNRAS, 341, 277
- De Buizer (2006) — 2006, ApJ, 642, L57
- De Buizer (2007) — 2007, ApJ, 654, L147
- de Gregorio-Monsalvo et al. (2013) de Gregorio-Monsalvo, I., Ménard, F., Dent, W., Pinte, C., López, C., Klaassen, P., Hales, A., Cortés, P., Rawlings, M. G., Tachihara, K., Testi, L., Takahashi, S., Chapillon, E., Mathews, G., Juhasz, A., Akiyama, E., Higuchi, a. E., Saito, M., Nyman, L.-A., Phillips, N., Rodón, J., Corder, S., & Van Kempen, T. 2013, A&A, 557, A133
- de Wit et al. (2011) de Wit, W., Hoare, M., Oudmaijer, R., Nürnberger, D., Wheelwright, H., & Lumsden, S. 2011, A&A, 526, L5
- de Wit et al. (2010) de Wit, W., Hoare, M., Oudmaijer, R., & Others 2010, A&A, 515, A45
- de Wit et al. (2005) de Wit, W., Testi, L., Palla, F., & Zinnecker, H. 2005, A&A, 437, 247
- Di Folco et al. (2009) Di Folco, E., Dutrey, A., Chesneau, O., Wolf, S., Schegerer, A., Leinert, C., & Lopez, B. 2009, A&A, 500, 1065
- Donehew & Brittain (2011) Donehew, B., & Brittain, S. 2011, AJ, 141, 46
- Draine & Lee (1984) Draine, B., & Lee, H. 1984, ApJ, 285, 89
- Dullemond (2011) Dullemond, C. 2011, RADMC: A 2-D Continuum Radiative Transfer Tool, Astrophysics Source Code Library
- Dullemond & Monnier (2010) Dullemond, C. P., & Monnier, J. D. 2010, ARA&A, 48, 45
- Dunham et al. (2014) Dunham, M., Arce, H., Mardones, D., Lee, J.-E., Matthews, B., Stutz, A., & Williams, J. 2014, ApJ, 783, 29
- Dutrey et al. (2014) Dutrey, A., Semenov, D., Chapillon, E., Gorti, U., Guilloteau, S., Hersant, F., Hogerheijde, M., Hughes, M., Meeus, G., Nomura, H., Piétu, V., Qi, C., & Wakelam, V. 2014, Protostars and Planets, VI
- Eisner et al. (2007) Eisner, J. a., Chiang, E. I., Lane, B. F., & Akeson, R. L. 2007, ApJ, 657, 347
- Eisner et al. (2010) Eisner, J. a., Monnier, J. D., Woillez, J., Akeson, R. L., Millan-Gabet, R., Graham, J. R., Hillenbrand, L. a., Pott, J. U., Ragland, S., & Wizinowich, P. 2010, ApJ, 718, 774
- Ellerbroek et al. (2011) Ellerbroek, L., Kaper, L., Bik, A., de Koter, A., Horrobin, M., Puga, E., Sana, H., & Waters, L. 2011, ApJ, 732, L9
- Ercolano et al. (2014) Ercolano, B., Mayr, D., Owen, J., Rosotti, G., & Manara, C. 2014, MNRAS, 439, 256
- Fairlamb et al. (2015) Fairlamb, J., Oudmaijer, R. D., Mendigutía, I., Ilee, J. D., & van den Ancker, M. 2015, MNRAS, 453, 976
- Fallscheer et al. (2011) Fallscheer, C., Beuther, H., Sauter, J., Wolf, S., & Zhang, Q. 2011, ApJ, 729, 66
- Fallscheer et al. (2009) Fallscheer, C., Beuther, H., Zhang, Q., Keto, E., & Sridharan, T. 2009, A&A, 504, 127
- Fedele et al. (2008) Fedele, D., Ancker, M. E. V. D., Acke, B., G., der Plas, V., van Boekel, R., Wittkowski, M., Henning, T., Bouwman, J., Meeus, G., & Rafanelli, P. 2008, A&A, 491, 809
- Felli et al. (2004) Felli, M., Massi, F., Navarrini, A., Neri, R., Cesaroni, R., & Jenness, T. 2004, A&A, 420, 553
- Fernández-López et al. (2011) Fernández-López, M., Curiel, S., Girart, J., Ho, P., Patel, N., & Gómez, Y. 2011, AJ, 141, 72
- Fizeau (1868) Fizeau, H. 1868, C. R. Acad. Sci., 66, 932
- Follert et al. (2010) Follert, R., Linz, H., Stecklum, B., & Others 2010, A&A, 522, A17
- Fontani et al. (2004a) Fontani, F., Cesaroni, R., Testi, L., Molinari, S., Zhang, Q., Brand, J., & Walmsley, C. 2004a, A&A, 424, 179
- Fontani et al. (2004b) Fontani, F., Cesaroni, R., Testi, L., Walmsley, C., Molinari, S., Neri, R., Shepherd, D., Brand, J., Palla, F., & Zhang, Q. 2004b, A&A, 414, 299
- Fontani et al. (2009) Fontani, F., Zhang, Q., Caselli, P., & Bourke, T. 2009, A&A, 499, 233
- Franco-Hernández et al. (2009) Franco-Hernández, R., Moran, J., Rodríguez, L., & Garay, G. 2009, ApJ, 701, 974
- Froebrich (2005) Froebrich, D. 2005, ApJS, 156, 169
- Froebrich et al. (2003) Froebrich, D., Smith, M., Hodapp, K.-W., & Eislöffel, J. 2003, MNRAS, 346, 163
- Fuente et al. (2006) Fuente, a., Alonso-Albi, T., Bachiller, R., Natta, A., Testi, L., Neri, R., & Planesas, P. 2006, ApJ, 649, L119
- Fuente et al. (2009) Fuente, A., Castro-Carrizo, A., Alonso-Albi, T., Beltrán, M., Neri, R., Ceccarelli, C., Lefloch, B., Codella, C., & Caselli, P. 2009, A&A, 507, 1475
- Fuente et al. (2007) Fuente, A., Ceccarelli, C., Neri, R., Alonso-Albi, T., Caselli, P., Johnstone, D., van Dishoeck, E., & Wyrowski, F. 2007, A&A, 468, L37
- Fuente et al. (2005) Fuente, A., Neri, R., & Caselli, P. 2005, A&A, 444, 481
- Fuente et al. (2001) Fuente, A., Neri, R., Martín-Pintado, J., Bachiller, R., Rodríguez-Franco, A., & Palla, F. 2001, A&A, 366, 873
- Fuente et al. (2003) Fuente, A., Rodríguez-Franco, A., Testi, L., Natta, A., Bachiller, R., & Neri, R. 2003, ApJ, 598, L39
- Furuya et al. (2011) Furuya, R., Cesaroni, R., & Shinnaga, H. 2011, A&A, 525, A72
- Furuya et al. (2008) Furuya, R., Cesaroni, R., Takahashi, S., Codella, C., Momose, M., & Beltrán, M. 2008, ApJ, 673, 363
- Galli et al. (2006) Galli, D., Lizano, S., Shu, F., & Allen, A. 2006, ApJ, 647, 374
- Galván-Madrid et al. (2009) Galván-Madrid, R., Keto, E., Zhang, Q., Kurtz, S., Rodríguez, L., & Ho, P. 2009, ApJ, 706, 1036
- Galván-Madrid et al. (2010) Galván-Madrid, R., Zhang, Q., Keto, E., Ho, P., Zapata, L., Rodríguez, L., Pineda, J., & Vázquez-Semadeni, E. 2010, ApJ, 725, 17
- Garcia Lopez et al. (2006) Garcia Lopez, R., Natta, A., Testi, L., & Habart, E. 2006, A&A, 459, 837
- Garcia Lopez et al. (2015) Garcia Lopez, R., Tambovtseva, L. V., Schertl, D., Grinin, V. P., & Weigelt, G. 2015, A&A, 576, 84
- Gaume et al. (1993) Gaume, R., Johnston, K., & Wilson, T. 1993, ApJ, 417, 645
- Gibb et al. (2003) Gibb, A., Hoare, M., Little, L., & Wright, M. 2003, MNRAS, 339, 1011
- Girart et al. (2009) Girart, J., Beltrán, M., Zhang, Q., Rao, R., & Estalella, R. 2009, Science (80-. )., 324, 1408
- Goddi et al. (2015) Goddi, C., Zhang, Q., & Moscadelli, L. 2015, A&A, 573, A108
- Goldsmith (2001) Goldsmith, P. 2001, ApJ, 557, 736
- Gómez et al. (1999) Gómez, J., Sargent, A., Torrelles, J., Ho, P., Rodríguez, L., Cantó, J., & Garay, G. 1999, ApJ, 514, 287
- Grady et al. (2015) Grady, C., Fukagawa, M., Maruta, Y., Ohta, Y., Wisniewski, J., Hashimoto, J., Okamoto, Y., Momose, M., Currie, T., McElwain, M., Muto, T., Kotani, T., Kusakabe, N., Feldt, M., Sitko, M., Follette, K., Bonnefoy, M., Henning, T., Takami, M., Karr, J., Kwon, J., Kudo, T., Abe, L., Brandner, W., Brandt, T., Carson, J., Egner, S., Goto, M., Guyon, O., Hayano, Y., Hayashi, M., Hayashi, S., Hodapp, K., Ishii, M., Iye, M., Janson, M., Kandori, R., Knapp, G., Kuzuhara, M., Matsuo, T., Miyama, S., Morino, J.-I., Moro-Martín, A., Nishimura, T., Pyo, T.-S., Serabyn, E., Suenaga, T., Suto, H., Suzuki, R., Takahashi, Y. H., Takato, N., Terada, H., Thalmann, C., Tomono, D., Turner, E. L., Watanabe, M., Yamada, T., Takami, H., Usuda, T., & Tamura, M. 2015, Astrophys. Space Sci., 355, 253
- Grellmann et al. (2011) Grellmann, R., Ratzka, T., Kraus, S., & Others 2011, A&A, 532, A109
- Gueth et al. (2001) Gueth, F., Schilke, P., & McCaughrean, M. 2001, A&A, 375, 1018
- Guilloteau et al. (2013) Guilloteau, S., Di Folco, E., Dutrey, A., Simon, M., Grosso, N., & Piétu, V. 2013, A&A, 549, A92
- Gullbring et al. (1998) Gullbring, E., Hartmann, L., Briceño, C., & Calvet, N. 1998, ApJ, 492, 323
- Guzmán et al. (2011) Guzmán, A., Garay, G., Brooks, K., Rathborne, J., & Güsten, R. 2011, ApJ, 736, 150
- Guzmán et al. (2014) Guzmán, A. E., Garay, G., Rodríguez, L. F., Moran, J., Brooks, K. J., Bronfman, L., Nyman, L.-A. k., Sanhueza, P., & Mardones, D. 2014, ApJ, 796, 117
- Hartmann (1998) Hartmann, L. 1998, Accretion Processes in Star Formation
- Hartmann et al. (1994) Hartmann, L., Hewett, R., & Calvet, N. 1994, ApJ, 426, 669
- Hartmann et al. (1993) Hartmann, L., Kenyon, S., & Calvet, N. 1993, ApJ, 407, 219
- Herbig (1960) Herbig, G. 1960, ApJS, 4, 337
- Herbst et al. (1994) Herbst, W., Herbst, D., Grossman, E., & Weinstein, D. 1994, AJ, 108, 1906
- Herczeg & Hillenbrand (2008) Herczeg, G., & Hillenbrand, L. 2008, ApJ, 681, 594
- Hernandez et al. (2004) Hernandez, J., Calvet, N., Briceo, C., Hartmann, L., & Berlind, P. 2004, AJ, 127, 1682
- Hernández et al. (2007) Hernández, J., Hartmann, L., Megeath, T., Gutermuth, R., Muzerolle, J., Calvet, N., Vivas, A., Briceño, C., Allen, L., Stauffer, J., Young, E., & Fazio, G. 2007, ApJ, 662, 1067
- Hernández-Hernández et al. (2014) Hernández-Hernández, V., Zapata, L., Kurtz, S., & Garay, G. 2014, ApJ, 786, 38
- Hildebrand (1983) Hildebrand, R. 1983, QJRAS, 24, 267
- Hillenbrand et al. (1992) Hillenbrand, L., Strom, S., Vrba, F., & Keene, J. 1992, ApJ, 397, 613
- Hoare (2006) Hoare, M. 2006, ApJ, 649, 856
- Hoare et al. (1994) Hoare, M., Drew, J., Muxlow, T., & Davis, R. 1994, ApJ, 421, L51
- Hofner et al. (2007) Hofner, P., Cesaroni, R., Olmi, L., Rodríguez, L., Martí, J., & Araya, E. 2007, A&A, 465, 197
- Hogerheijde et al. (1998) Hogerheijde, M., van Dishoeck, E., Blake, G., & van Langevelde, H. 1998, ApJ, 502, 315
- Hollenbach et al. (2000) Hollenbach, D., Yorke, H., & Johnstone, D. 2000, Protostars and Planets, IV
- Hosokawa et al. (2010) Hosokawa, T., Yorke, H., & Omukai, K. 2010, ApJ, 721, 478
- Hunter et al. (2014) Hunter, T., Brogan, C., Cyganowski, C., & Young, K. 2014, ApJ, 788, 187
- Hunter et al. (2006) Hunter, T., Brogan, C., Megeath, S., Menten, K., Beuther, H., & Thorwirth, S. 2006, ApJ, 649, 888
- Hussain & Alecian (2014) Hussain, G., & Alecian, E. 2014, in IAU Symp., vol. 302 of IAU Symposium, 25
- Ilee et al. (2014) Ilee, J. D., Fairlamb, J., Oudmaijer, R. D., Mendigutia, I., van den Ancker, M., Kraus, S., & Wheelwright, H. E. 2014, MNRAS, 445, 372
- Ilee et al. (2013) Ilee, J. D., Wheelwright, H. E., Oudmaijer, R. D., de Wit, W. J., Maud, L. T., Hoare, M. G., Lumsden, S. L., Moore, T. J. T., Urquhart, J. S., & Mottram, J. C. 2013, MNRAS, 429, 2960
- Isella et al. (2007) Isella, A., Natta, A., Wilner, D., Carpenter, J. M., & Testi, L. 2007, A&A, 469, 213
- Jijina & Adams (1996) Jijina, J., & Adams, F. 1996, ApJ, 462, 874
- Juvela & Ysard (2011) Juvela, M., & Ysard, N. 2011, ApJ, 739, 63
- Kahn (1974) Kahn, F. 1974, A&A, 37, 149
- Kenyon & Hartmann (1987) Kenyon, S., & Hartmann, L. 1987, ApJ, 323
- Keto (2002) Keto, E. 2002, ApJ, 580, 980
- Keto (2007) — 2007, ApJ, 666, 976
- Keto et al. (1988) Keto, E., Ho, P., & Haschick, A. 1988, ApJ, 324, 920
- Kim et al. (2008) Kim, M., Hirota, T., Honma, M., Kobayashi, H., Bushimata, T., Choi, Y., Imai, H., Iwadate, K., Jike, T., Kameno, S., Kameya, O., Kamohara, R., Kan-Ya, Y., Kawaguchi, N., Kuji, S., Kurayama, T., Manabe, S., Matsui, M., Matsumoto, N., Miyaji, T., Nagayama, T., Nakagawa, A., Oh, C., Omodaka, T., Oyama, T., Sakai, S., Sasao, T., Sato, K., Sato, M., Shibata, K., Tamura, Y., & Yamashita, K. 2008, PASJ, 60, 991
- Klaassen et al. (2009) Klaassen, P., Wilson, C., Keto, E., & Zhang, Q. 2009, ApJ, 703, 1308
- Kraus et al. (2010) Kraus, S., Hofmann, K.-H., Menten, K., Schertl, D., Weigelt, G., Wyrowski, F., Meilland, A., Perraut, K., Petrov, R., Robbe-Dubois, S., Schilke, P., & Testi, L. 2010, Nature, 466, 339
- Kraus et al. (2008) Kraus, S., Preibisch, T., & Ohnaka, K. 2008, ApJ, 676, 490
- Kreplin et al. (2012) Kreplin, a., Kraus, S., Hofmann, K.-H., Schertl, D., Weigelt, G., & Driebe, T. 2012, A&A, 537, A103
- Krumholz et al. (2009) Krumholz, M., Klein, R., McKee, C., Offner, S., & Cunningham, A. 2009, Science (80-. )., 323, 754
- Kuiper et al. (2010) Kuiper, R., Klahr, H., Beuther, H., & Henning, T. 2010, ApJ, 722, 1556
- Kuiper et al. (2015) Kuiper, R., Planck, M., Yorke, H. W., & Turner, N. J. 2015, ApJ, 800, 86
- Lanz & Hubeny (2007) Lanz, T., & Hubeny, I. 2007, ApJS, 169, 83
- Laughlin & Bodenheimer (1994) Laughlin, G., & Bodenheimer, P. 1994, ApJ, 436, 335
- Launhardt & Henning (1997) Launhardt, R., & Henning, T. 1997, A&A, 326, 329
- Lee et al. (2014) Lee, C.-F., Hirano, N., Zhang, Q., Shang, H., Ho, P., & Krasnopolsky, R. 2014, ApJ, 786, 114
- Leinert et al. (2004) Leinert, C., van Boekel, R., Waters, L., Chesneau, O., Malbet, F., Köhler, R., Jaffe, W., Ratzka, T., Dutrey, A., Preibisch, T., Graser, U., Bakker, E., Chagnon, G., Cotton, W., Dominik, C., Dullemond, C., Glazenborg-Kluttig, A., Glindemann, A., Henning, T., Hofmann, K.-H., de Jong, J., Lenzen, R., Ligori, S., Lopez, B., Meisner, J., Morel, S., Paresce, F., Pel, J.-W., Percheron, I., Perrin, G., Przygodda, F., Richichi, A., Schöller, M., Schuller, P., Stecklum, B., van den Ancker, M., von der Lühe, O., & Weigelt, G. 2004, A&A, 423, 537
- Li et al. (2012) Li, J., Moscadelli, L., Cesaroni, R., Furuya, R., Xu, Y., Usuda, T., Menten, K., Pestalozzi, M., Elia, D., & Schisano, E. 2012, ApJ, 749, 47
- Liu et al. (2013) Liu, H., Qiu, K., Zhang, Q., Girart, J., & Ho, P. 2013, ApJ, 771, 71
- López-Sepulcre et al. (2010) López-Sepulcre, A., Cesaroni, R., & Walmsley, C. 2010, A&A, 517, A66
- López-Sepulcre et al. (2013) López-Sepulcre, A., Taquet, V., Sánchez-Monge, A., Ceccarelli, C., Dominik, C., Kama, M., Caux, E., Fontani, F., Fuente, A., Ho, P., Neri, R., & Shimajiri, Y. 2013, A&A, 556, A62
- Maaskant et al. (2013) Maaskant, K. M., Honda, M., Waters, L. B. F. M., Tielens, A. G. G. M., Dominik, C., Min, M., Verhoeff, A., Meeus, G., & van den Ancker, M. E. 2013, A&A, 555, A64
- Malbet et al. (2007) Malbet, F., Benisty, M., de Wit, W., Kraus, S., Meilland, A., Millour, F., Tatulli, E., Berger, J.-P., Chesneau, O., Hofmann, K.-H., Isella, A., Natta, A., Petrov, R., Preibisch, T., Stee, P., Testi, L., Weigelt, G., Antonelli, P., Beckmann, U., Bresson, Y., Chelli, A., Dugué, M., Duvert, G., Gennari, S., Glück, L., Kern, P., Lagarde, S., Le Coarer, E., Lisi, F., Perraut, K., Puget, P., Rantakyrö, F., Robbe-Dubois, S., Roussel, A., Zins, G., Accardo, M., Acke, B., Agabi, K., Altariba, E., Arezki, B., Aristidi, E., Baffa, C., Behrend, J., Blöcker, T., Bonhomme, S., Busoni, S., Cassaing, F., Clausse, J.-M., Colin, J., Connot, C., Delboulbé, A., Domiciano de Souza, A., Driebe, T., Feautrier, P., Ferruzzi, D., Forveille, T., Fossat, E., Foy, R., Fraix-Burnet, D., Gallardo, A., Giani, E., Gil, C., Glentzlin, A., Heiden, M., Heininger, M., Hernandez Utrera, O., Kamm, D., Kiekebusch, M., Le Contel, D., Le Contel, J.-M., Lesourd, T., Lopez, B., Lopez, M., Magnard, Y., Marconi, A., Mars, G., Martinot-Lagarde, G., Mathias, P., Mège, P., Monin, J.-L., Mouillet, D., Mourard, D., Nussbaum, E., Ohnaka, K., Pacheco, J., Perrier, C., Rabbia, Y., Rebattu, S., Reynaud, F., Richichi, A., Robini, A., Sacchettini, M., Schertl, D., Schöller, M., Solscheid, W., Spang, A., Stefanini, P., Tallon, M., Tallon-Bosc, I., Tasso, D., Vakili, F., von der Lühe, O., Valtier, J.-C., Vannier, M., & Ventura, N. 2007, A&A, 464, 43
- Malbet & Bertout (1995) Malbet, F., & Bertout, C. 1995, A&AS, 113, 369
- Malbet et al. (2000) Malbet, F., Lachaume, R., Monin, J.-L., & Berger, J.-P. 2000, in Interferom. Opt. Astron., edited by P. Léna, & A. Quirrenbach, vol. 4006 of Society of Photo-Optical Instrumentation Engineers (SPIE) Conference Series, 243
- Mallick et al. (2014) Mallick, K., Ojha, D., Tamura, M., Pandey, A., Dib, S., Ghosh, S., Sunada, K., Zinchenko, I., Pirogov, L., & Tsujimoto, M. 2014, MNRAS, 443, 3218
- Manara et al. (2013) Manara, C., Testi, L., Rigliaco, E., Alcalá, J., Natta, A., Stelzer, B., Biazzo, K., Covino, E., Covino, S., Cupani, G., D’Elia, V., & Randich, S. 2013, A&A, 551, A107
- Mannings (1994) Mannings, V. 1994, MNRAS, 271, 587
- Mannings et al. (1997) Mannings, V., Koerner, D. W., & Sargent, A. I. 1997, Nature, 388, 555
- Mannings & Sargent (2000) Mannings, V., & Sargent, A. I. 2000, Astrophys. J., 529, 391
- Manoj et al. (2006) Manoj, P., Bhatt, H. C., Maheswar, G., & Muneer, S. 2006, ApJ, 653, 657
- Martins et al. (2005) Martins, F., Schaerer, D., & Hillier, D. 2005, A&A, 436, 1049
- Matter et al. (2014) Matter, A., Labadie, L., Kreplin, A., Lopez, B., Wolf, S., Weigelt, G., Ertel, S., Pott, J.-U., & Danchi, W. 2014, A&A, 561, A26
- Matthews et al. (2010) Matthews, L., Greenhill, L., Goddi, C., Chandler, C., Humphreys, E., & Kunz, M. 2010, ApJ, 708, 80
- McKee & Ostriker (2007) McKee, C., & Ostriker, E. 2007, ARA&A, 45, 565
- McKee & Tan (2002) McKee, C., & Tan, J. 2002, Nature, 416, 59
- McKee & Tan (2003) — 2003, ApJ, 585, 850
- Meeus et al. (2001) Meeus, G., Waters, L., Bouwman, J., van den Ancker, M., Waelkens, C., & Malfait, K. 2001, A&A, 365, 476
- Mendigutía et al. (2011) Mendigutía, I., Calvet, N., Montesinos, B., Mora, A., Muzerolle, J., Eiroa, C., Oudmaijer, R. D., & Merín, B. 2011, A&A, 535, A99
- Mendigutía et al. (2015) Mendigutía, I., de Wit, W., Oudmaijer, R., Fairlamb, J., Carciofi, A., Ilee, J., & Vieira, R. 2015, MNRAS, 453, 2126
- Mendigutía et al. (2012) Mendigutía, I., Mora, A., Montesinos, B., Eiroa, C., Meeus, G., Merín, B., & Oudmaijer, R. D. 2012, A&A, 543, A59
- Menten & van der Tak (2004) Menten, K., & van der Tak, F. 2004, A&A, 414, 289
- Mérand et al. (2014) Mérand, A., Abuter, R., Aller-Carpentier, E., Andolfato, L., Alonso, J., Berger, J.-P., Blanchard, G., Boffin, H., Bourget, P., Bristow, P., Cid, C., de Wit, W.-J., del Valle, D., Delplancke-Ströbele, F., Derie, F., Faundez, L., Ertel, S., Grellmann, R., Gitton, P., Glindemann, A., Guajardo, P., Guieu, S., Guisard, S., Guniat, S., Haguenauer, P., Herrera, C., Hummel, C., La Fuente, C., Lopez, M., Mardones, P., Morel, S., Müller, A., Percheron, I., Duc, T., Pino, A., Poupar, S., Pozna, E., Ramirez, A., Rengaswamy, S., Rivas, L., Rivinius, T., Segovia, A., Schmid, C., Schöller, M., Schuhler, N., Woillez, J., & Wittkowski, M. 2014, in Soc. Photo-Optical Instrum. Eng. Conf. Ser., vol. 9146 of Society of Photo-Optical Instrumentation Engineers (SPIE) Conference Series
- Meynet et al. (2015) Meynet, G., Georgy, C., Groh, J., & Stee, P. 2015, New Windows on Massive Stars: Asteroseismology, Interferometry ans spectropolarimetry, vol. 307 of IAU Symposium
- Mezger & Henderson (1967) Mezger, P., & Henderson, A. 1967, ApJ, 147, 471
- Molinari et al. (1996) Molinari, S., Brand, J., Cesaroni, R., & Palla, F. 1996, A&A, 308, 573
- Molinari et al. (1998) Molinari, S., Testi, L., Brand, J., Cesaroni, R., & Palla, F. 1998, ApJ, 505, L39
- Monnier & Allen (2012) Monnier, J. D., & Allen, R. J. 2012, Radio & Optical Interferometry: Basic Observing Techniques and Data Analysis, vol. 2
- Monnier & Millan-Gabet (2002) Monnier, J. D., & Millan-Gabet, R. 2002, ApJ, 579, 694
- Monnier et al. (2009) Monnier, J. D., Tuthill, P. G., Ireland, M., Cohen, R., Tannirkulam, A., & Perrin, M. D. 2009, ApJ, 700, 491
- Moro-Martín et al. (2001) Moro-Martín, A., Noriega-Crespo, A., Molinari, S., Testi, L., Cernicharo, J., & Sargent, A. 2001, ApJ, 555, 146
- Moscadelli et al. (2011) Moscadelli, L., Cesaroni, R., Rioja, M., Dodson, R., & Reid, M. 2011, A&A, 526, A66
- Moscadelli et al. (2013) Moscadelli, L., Cesaroni, R., Sánchez-Monge, A., Goddi, C., Furuya, R., Sanna, A., & Pestalozzi, M. 2013, A&A, 558, A145
- Moscadelli & Goddi (2014) Moscadelli, L., & Goddi, C. 2014, A&A, 566, A150
- Mottram et al. (2007) Mottram, J., Hoare, M., Lumsden, S., & Others 2007, A&A, 476, 1019
- Mottram et al. (2013) Mottram, J., van Dishoeck, E., Schmalzl, M., Kristensen, L., Visser, R., Hogerheijde, M., & Bruderer, S. 2013, A&A, 558, A126
- Mottram et al. (2011) Mottram, J. C., Hoare, M. G., Davies, B., Lumsden, S. L., Oudmaijer, R. D., Urquhart, J. S., Moore, T. J. T., Cooper, H. D. B., & Stead, J. J. 2011, ApJ, 730, 33
- Muñoz et al. (2015) Muñoz, D., Kratter, K., Vogelsberger, M., Hernquist, L., & Springel, V. 2015, MNRAS, 446, 2010
- Murillo et al. (2013) Murillo, N., Lai, S.-P., Bruderer, S., Harsono, D., & van Dishoeck, E. 2013, A&A, 560, A103
- Muzerolle et al. (2004) Muzerolle, J., D’Alessio, P., Calvet, N., & Hartmann, L. 2004, ApJ, 617, 406
- Muzerolle et al. (1998) Muzerolle, J., Hartmann, L., & Calvet, N. 1998, AJ, 116, 2965
- Nakamura et al. (1991) Nakamura, A., Kawabe, R., Ishiguro, M., Murata, Y., Ohashi, N., & Kitamura, Y. 1991, ApJ, 383, L81
- Nakano et al. (2000) Nakano, T., Hasegawa, T., Morino, J.-I., & Yamashita, T. 2000, ApJ, 534, 976
- Nakano et al. (1995) Nakano, T., Hasegawa, T., & Norman, C. 1995, ApJ, 450, 183
- Natta et al. (2000) Natta, A., Grinin, V., & Mannings, V. 2000, Protostars and Planets, IV, 559
- Natta et al. (2006) Natta, A., Testi, L., & Randich, S. 2006, A&A, 452, 245
- Neri et al. (2007) Neri, R., Fuente, A., Ceccarelli, C., Caselli, P., Johnstone, D., van Dishoeck, E., Wyrowski, F., Tafalla, M., Lefloch, B., & Plume, R. 2007, A&A, 468, L33
- Norris et al. (1998) Norris, R., Byleveld, S., Diamond, P., Ellingsen, S., Ferris, R., Gough, R., Kesteven, M., McCulloch, P., Phillips, C., Reynolds, J., Tzioumis, A., Takahashi, Y., Troup, E., & Wellington, K. 1998, ApJ, 508, 275
- Oberg et al. (2011) Oberg, K. I., Qi, C., Fogel, J. K. J., Bergin, E. a., Andrews, S. M., Espaillat, C., Wilner, D. J., Pascucci, I., & Kastner, J. H. 2011, ApJ, 734, 98
- Ohashi et al. (2014) Ohashi, N., Saigo, K., Aso, Y., Aikawa, Y., Koyamatsu, S., Machida, M., Saito, M., Takahashi, S., Takakuwa, S., Tomida, K., Tomisaka, K., & Yen, H.-W. 2014, ApJ, 796, 131
- Okamoto et al. (2009) Okamoto, Y. K., Kataza, H., Honda, M., Fujiwara, H., Momose, M., Ohashi, N., Fujiyoshi, T., Sakon, I., Sako, S., Yamashita, T., Miyata, T., & Onaka, T. 2009, ApJ, 706, 665
- Oliver (1965) Oliver, B. 1965, IEEE Proc., 53, 436
- Osorio et al. (2009) Osorio, M., Anglada, G., Lizano, S., & D’Alessio, P. 2009, ApJ, 694, 29
- Osorio et al. (1999) Osorio, M., Lizano, S., & D’Alessio, P. 1999, ApJ, 525, 808
- Ossenkopf & Henning (1994) Ossenkopf, V., & Henning, T. 1994, A&A, 291, 943
- Padgett et al. (1999) Padgett, D., Brandner, W., Stapelfeldt, K., Strom, S., Terebey, S., & Koerner, D. 1999, AJ, 117, 1490
- Palau et al. (2007a) Palau, A., Estalella, R., Girart, J., Ho, P., Zhang, Q., & Beuther, H. 2007a, A&A, 465, 219
- Palau et al. (2007b) Palau, A., Estalella, R., Ho, P., Beuther, H., & Beltrán, M. 2007b, A&A, 474, 911
- Palau et al. (2013) Palau, A., Fuente, A., Girart, J., Estalella, R., Ho, P., Sánchez-Monge, A., Fontani, F., Busquet, G., Commerçon, B., Hennebelle, P., Boissier, J., Zhang, Q., Cesaroni, R., & Zapata, L. 2013, ApJ, 762, 120
- Palau et al. (2011) Palau, A., Fuente, A., Girart, J., Fontani, F., Boissier, J., Piétu, V., Sánchez-Monge, A., Busquet, G., Estalella, R., Zapata, L., Zhang, Q., Neri, R., Ho, P., Alonso-Albi, T., & Audard, M. 2011, ApJ, 743, L32
- Palau et al. (2010) Palau, A., Sánchez-Monge, A., Busquet, G., Estalella, R., Zhang, Q., Ho, P., Beltrán, M., & Beuther, H. 2010, A&A, 510, A5
- Palla & Stahler (1992) Palla, F., & Stahler, S. 1992, ApJ, 392, 667
- Palla & Stahler (1993) — 1993, ApJ, 418, 414
- Panić et al. (2014) Panić, O., Ratzka, T., Mulders, G. D., Dominik, C., van Boekel, R., Henning, T., Jaffe, W., & Min, M. 2014, A&A, 562, 101
- Partnership et al. (2015) Partnership, A., Brogan, C., Pérez, L., Hunter, T., Dent, W., Hales, A., Hills, R., Corder, S., Fomalont, E., Vlahakis, C., Asaki, Y., Barkats, D., Hirota, A., Hodge, J., Impellizzeri, C., Kneissl, R., Liuzzo, E., Lucas, R., Marcelino, N., Matsushita, S., Nakanishi, K., Phillips, N., Richards, A., Toledo, I., Aladro, R., Broguiere, D., Cortes, J., Cortes, P., Espada, D., Galarza, F., Garcia-Appadoo, D., Guzman-Ramirez, L., Humphreys, E., Jung, T., Kameno, S., Laing, R., Leon, S., Marconi, G., Mignano, A., Nikolic, B., Nyman, L.-A., Radiszcz, M., Remijan, A., Rodón, J., Sawada, T., Takahashi, S., Tilanus, R., Vila Vilaro, B., Watson, L., Wiklind, T., Akiyama, E., Chapillon, E., de Gregorio-Monsalvo, I., Di Francesco, J., Gueth, F., Kawamura, A., Lee, C.-F., Nguyen Luong, Q., Mangum, J., Pietu, V., Sanhueza, P., Saigo, K., Takakuwa, S., Ubach, C., van Kempen, T., Wootten, A., Castro-Carrizo, A., Francke, H., Gallardo, J., Garcia, J., Gonzalez, S., Hill, T., Kaminski, T., Kurono, Y., Liu, H.-Y., Lopez, C., Morales, F., Plarre, K., Schieven, G., Testi, L., Videla, L., Villard, E., Andreani, P., Hibbard, J., & Tatematsu, K. 2015, ApJ, 808, L3
- Patel et al. (2005) Patel, N., Curiel, S., Sridharan, T., Zhang, Q., Hunter, T., Ho, P., Torrelles, J., Moran, J., Gómez, J., & Anglada, G. 2005, Nature, 437, 109
- Perrin & Malbet (2003) Perrin, G., & Malbet, F. 2003, in EAS Publ. Ser., edited by G. Perrin, & F. Malbet, vol. 6 of EAS Publications Series
- Pestalozzi et al. (2004) Pestalozzi, M., Elitzur, M., Conway, J., & Booth, R. 2004, ApJ, 603, L113
- Piétu et al. (2007) Piétu, V., Dutrey, A., & Guilloteau, S. 2007, A&A, 467, 163
- Piétu et al. (2003) Piétu, V., Dutrey, A., & Kahane, C. 2003, A&A, 398, 565
- Pineda et al. (2014) Pineda, J. E., Quanz, S. P., Meru, F., Mulders, G. D., Meyer, M. R., Panic, O., & Avenhaus, H. 2014, ApJ, 788, L2
- Pinte et al. (2006) Pinte, C., Ménard, F., Duchêne, G., & Bastien, P. 2006, A&A, 459, 797
- Pringle (1981) Pringle, J. 1981, ARA&A, 19, 137
- Qi et al. (2013) Qi, C., Öberg, K., Wilner, D., & Rosenfeld, K. 2013, ApJ, 765, L14
- Qiu et al. (2012) Qiu, K., Zhang, Q., Beuther, H., & Fallscheer, C. 2012, ApJ, 756, 170
- Qiu et al. (2007) Qiu, K., Zhang, Q., Beuther, H., & Yang, J. 2007, ApJ, 654, 361
- Qiu et al. (2014) Qiu, K., Zhang, Q., Menten, K., Liu, H., Tang, Y.-W., & Girart, J. 2014, ApJ, 794, L18
- Qiu et al. (2009) Qiu, K., Zhang, Q., Wu, J., & Chen, H.-R. 2009, ApJ, 696, 66
- Ragland et al. (2009) Ragland, S., Akeson, R. L., Armandroff, T., Colavita, M. M., Danchi, W. C., Hillenbrand, L. a., Millan-Gabet, R., Ridgway, S. T., Traub, W. a., & Wizinowich, P. L. 2009, ApJ, 703, 22
- Ragland et al. (2012) Ragland, S., Ohnaka, K., Hillenbrand, L., Ridgway, S. T., Colavita, M. M., Akeson, R. L., Cotton, W., Danchi, W. C., Hrynevich, M., Millan-Gabet, R., & Traub, W. a. 2012, ApJ, 746, 126
- Reiter & Smith (2013) Reiter, M., & Smith, N. 2013, MNRAS, 433, 2226
- Richling & Yorke (1997) Richling, S., & Yorke, H. 1997, A&A, 327, 317
- Rigliaco et al. (2015) Rigliaco, E., Pascucci, I., Duchene, G., & Edwards, S. 2015, ApJ, 801, 31
- Rodón et al. (2008) Rodón, J., Beuther, H., Megeath, S., & van der Tak, F. 2008, A&A, 490, 213
- Rodríguez et al. (2008) Rodríguez, L., Moran, J., Franco-Hernández, R., Garay, G., Brooks, K., & Mardones, D. 2008, AJ, 135, 2370
- Rodríguez-Esnard et al. (2014) Rodríguez-Esnard, T., Migenes, V., & Trinidad, M. 2014, ApJ, 788, 176
- Rosero et al. (2013) Rosero, V., Hofner, P., Kurtz, S., Bieging, J., & Araya, E. 2013, ApJS, 207, 12
- Ryle & Hewish (1960) Ryle, M., & Hewish, A. 1960, MNRAS, 120, 220
- Saito et al. (2008) Saito, H., Saito, M., Yonekura, Y., & Nakamura, F. 2008, ApJS, 178, 302
- Sánchez-Monge et al. (2014) Sánchez-Monge, A., Beltrán, M., Cesaroni, R., Etoka, S., Galli, D., Kumar, M., Moscadelli, L., Stanke, T., van der Tak, F., Vig, S., Walmsley, C., Wang, K.-S., Zinnecker, H., Elia, D., Molinari, S., & Schisano, E. 2014, A&A, 569, A11
- Sánchez-Monge et al. (2013) Sánchez-Monge, A., Cesaroni, R., Beltrán, M., Kumar, M., Stanke, T., Zinnecker, H., Etoka, S., Galli, D., Hummel, C., Moscadelli, L., Preibisch, T., Ratzka, T., van der Tak, F., Vig, S., Walmsley, C., & Wang, K.-S. 2013, A&A, 552, L10
- Sánchez-Monge et al. (2008) Sánchez-Monge, A., Palau, A., Estalella, R., Beltrán, M., & Girart, J. 2008, A&A, 485, 497
- Sánchez-Monge et al. (2010) Sánchez-Monge, A., Palau, A., Estalella, R., Kurtz, S., Zhang, Q., Di Francesco, J., & Shepherd, D. 2010, ApJ, 721, L107
- Sanna et al. (2014) Sanna, A., Cesaroni, R., Moscadelli, L., Zhang, Q., Menten, K., Molinari, S., Caratti o Garatti, A., & De Buizer, J. 2014, A&A, 565, A34
- Sanna et al. (2010) Sanna, A., Moscadelli, L., Cesaroni, R., Tarchi, A., Furuya, R., & Goddi, C. 2010, A&A, 517, A71
- Schreyer et al. (2002) Schreyer, K., Henning, T., van der Tak, F., Boonman, A., & van Dishoeck, E. 2002, A&A, 394, 561
- Schreyer et al. (2006) Schreyer, K., Semenov, D., Henning, T., & Forbrich, J. 2006, ApJ, 637, L129
- Shakura & Sunyaev (1973) Shakura, N., & Sunyaev, R. 1973, A&A, 24, 337
- Shepherd et al. (2004) Shepherd, D., Borders, T., Claussen, M., Shirley, Y., & Kurtz, S. 2004, ApJ, 614, 211
- Shepherd et al. (2001) Shepherd, D., Claussen, M., & Kurtz, S. 2001, Science (80-. )., 292, 1513
- Shepherd et al. (1998) Shepherd, D., Watson, A., Sargent, A., & Churchwell, E. 1998, ApJ, 507, 861
- Shepherd et al. (2000) Shepherd, D., Yu, K., Bally, J., & Testi, L. 2000, ApJ, 535, 833
- Shi et al. (2010) Shi, H., Zhao, J.-H., & Han, J. 2010, ApJ, 710, 843
- Shu et al. (1999) Shu, F., Allen, A., Shang, H., Ostriker, E., & Li, Z.-Y. 1999, in NATO Adv. Sci. Institutes Ser. C, edited by C. Lada, & N. Kylafis, vol. 540 of NATO Advanced Science Institutes (ASI) Series C, 193
- Shu et al. (1990) Shu, F., Tremaine, S., Adams, F., & Ruden, S. 1990, ApJ, 358, 495
- Simon et al. (2000) Simon, M., Dutrey, A., & Guilloteau, S. 2000, ApJ, 545, 1034
- Simon et al. (2001) — 2001, ApJ, 545, 1034
- Sollins et al. (2005) Sollins, P., Zhang, Q., Keto, E., & Ho, P. 2005, ApJ, 624, L49
- Stahler & Palla (2005) Stahler, S., & Palla, F. 2005, The Formation of Stars
- Stahler et al. (2000) Stahler, S., Palla, F., & Ho, P. 2000, Protostars and Planets, IV, 327
- Stecklum (2010) Stecklum, B. 2010, in From Stars to Galaxies Connect. our Underst. Star Galaxy Form., 111
- Strom et al. (1972) Strom, S., Strom, K., Yost, J., Carrasco, L., & Grasdalen, G. 1972, ApJ, 173, 353
- Surcis et al. (2012) Surcis, G., Vlemmings, W., van Langevelde, H., & Hutawarakorn Kramer, B. 2012, A&A, 541, A47
- Tackenberg et al. (2014) Tackenberg, J., Beuther, H., Henning, T., Linz, H., Sakai, T., Ragan, S., Krause, O., Nielbock, M., Hennemann, M., Pitann, J., & Schmiedeke, A. 2014, A&A, 565, A101
- Tafalla et al. (2000) Tafalla, M., Myers, P., Mardones, D., & Bachiller, R. 2000, A&A, 359, 967
- Takahashi et al. (2013) Takahashi, S., Ho, P., Teixeira, P., Zapata, L., & Su, Y.-N. 2013, ApJ, 763, 57
- Takahashi et al. (2012) Takahashi, S., Saigo, K., Ho, P., & Tomida, K. 2012, ApJ, 752, 10
- Takahashi et al. (2008) Takahashi, S., Saito, M., Ohashi, N., Kusakabe, N., Takakuwa, S., Shimajiri, Y., Tamura, M., & Kawabe, R. 2008, ApJ, 688, 344
- Tan et al. (2014) Tan, J., Beltrán, M., Caselli, P., Fontani, F., Fuente, A., Krumholz, M., McKee, C., & Stolte, A. 2014, Protostars and Planets, VI, 149
- Tang et al. (2012) Tang, Y.-W., Guilloteau, S., Piétu, V., Dutrey, A., Ohashi, N., & Ho, P. T. P. 2012, A&A, 547, A84
- Tannirkulam et al. (2008) Tannirkulam, a., Monnier, J. D., Harries, T. J., Millan-Gabet, R., Zhu, Z., Pedretti, E., Ireland, M., Tuthill, P., Brummelaar, T. T., McAlister, H., Farrington, C., Goldfinger, P. J., Sturmann, J., Sturmann, L., & Turner, N. 2008, ApJ, 689, 513
- ten Brummelaar et al. (2005) ten Brummelaar, T., McAlister, H., Ridgway, S., Bagnuolo Jr., W., Turner, N., Sturmann, L., Sturmann, J., Berger, D., Ogden, C., Cadman, R., Hartkopf, W., Hopper, C., & Shure, M. 2005, ApJ, 628, 453
- Terebey et al. (1993) Terebey, S., Chandler, C., & Andre, P. 1993, ApJ, 414, 759
- Terebey et al. (1984) Terebey, S., Shu, F. H., & Cassen, P. 1984, ApJ, 286, 529
- Testi et al. (1999) Testi, L., Palla, F., & Natta, A. 1999, A&A, 342, 515
- Testi et al. (2010) Testi, L., Tan, J., & Palla, F. 2010, A&A, 522, A44
- The et al. (1994) The, P., Winter, D., & Perez, M. 1994, A&AS, 104, 315
- Tobin et al. (2012) Tobin, J., Hartmann, L., Chiang, H.-F., Wilner, D., Looney, L., Loinard, L., Calvet, N., & D’Alessio, P. 2012, Nature, 492, 83
- Tomisaka (1998) Tomisaka, K. 1998, ApJ, 502, L163
- Toomre (1964) Toomre, A. 1964, ApJ, 139, 1217
- Torrelles et al. (1998) Torrelles, J., Gómez, J., Rodríguez, L., Curiel, S., Anglada, G., & Ho, P. 1998, ApJ, 505, 756
- Torrelles et al. (1996) Torrelles, J., Gomez, J., Rodriguez, L., Curiel, S., Ho, P., & Garay, G. 1996, ApJ, 457, L107
- Torstensson et al. (2011) Torstensson, K., van Langevelde, H., Vlemmings, W., & Bourke, S. 2011, A&A, 526, A38
- Turner et al. (2014) Turner, N., Fromang, S., Gammie, C., Klahr, H., Lesur, G., Wardle, M., & Bai, X.-N. 2014, Protostars Planets VI, 411
- Tuthill et al. (2001) Tuthill, P. G., Monnier, J. D., & Danchi, W. C. 2001, Nature, 1
- Tycner et al. (2006) Tycner, C., Gilbreath, G., Zavala, R., Armstrong, J., Benson, J., Hajian, A., Hutter, D., Jones, C., Pauls, T., & White, N. 2006, AJ, 131, 2710
- van den Ancker et al. (1998) van den Ancker, M., de Winter, D., & Tjin A Djie, H. 1998, A&A, 330, 145
- van der Plas et al. (2015) van der Plas, G., van den Ancker, M. E., Water, L., & Dominik, C. 2015, A&A, 574, A75
- van der Tak & Menten (2005) van der Tak, F., & Menten, K. 2005, A&A, 437, 947
- van Kempen et al. (2012) van Kempen, T., Longmore, S., Johnstone, D., Pillai, T., & Fuente, A. 2012, ApJ, 751, 137
- Vink et al. (2002) Vink, J., Drew, J., Harries, T., & Oudmaijer, R. 2002, MNRAS, 337, 356
- Vinković & Jurkić (2007) Vinković, D., & Jurkić, M. 2007, ApJ, 658, 462
- Walmsley (1995) Walmsley, M. 1995, in Rev. Mex. Astron. y Astrofis. Conf. Ser., edited by S. Lizano, & J. Torrelles, vol. 1 of Revista Mexicana de Astronomia y Astrofisica, vol. 27, 137
- Wang et al. (2011) Wang, J., Fabbiano, G., Elvis, M., & Others 2011, ApJ, 736, 62
- Wang et al. (2013) Wang, K.-S., Bourke, T., Hogerheijde, M., van der Tak, F., Benz, A., Megeath, S., & Wilson, T. 2013, A&A, 558, A69
- Wang et al. (2012) Wang, K.-S., van der Tak, F., & Hogerheijde, M. 2012, A&A, 543, A22
- Watt & Mundy (1999) Watt, S., & Mundy, L. 1999, ApJS, 125, 143
- Weigelt et al. (2011) Weigelt, G., Grinin, V. P., Groh, J. H., Hofmann, K. H., Kraus, S., Miroshnichenko, a. S., Schertl, D., Tambovtseva, L. V., Benisty, M., Driebe, T., Lagarde, S., Malbet, F., Meilland, A., Petrov, R., & Tatulli, E. 2011, A&A, 527, 103
- Wheelwright et al. (2012a) Wheelwright, H., Bjorkman, J., Oudmaijer, R., Carciofi, A., Bjorkman, K., & Porter, J. 2012a, MNRAS, 423, L11
- Wheelwright et al. (2012b) Wheelwright, H., de Wit, W.-J., Weigelt, G., Oudmaijer, R., & Ilee, J. 2012b, Astron. & Astrophys., 543, A77
- Wheelwright et al. (2010) Wheelwright, H., Oudmaijer, R., de Wit, W.-J., Hoare, M., Lumsden, S. L., & Urquhart, J. 2010, MNRAS, 408, 1840
- Wheelwright et al. (2013) Wheelwright, H. E., Weigelt, G., o Garatti, a. C., & Lopez, R. G. 2013, A&A, 558, 116
- Whitney et al. (2013) Whitney, B. A., Robitaille, T. P., Bjorkman, J. E., Dong, R., Wolff, M. J., Wood, K., & Honor, J. 2013, ApJS, 207, 30
- Williams & Best (2014) Williams, J., & Best, W. 2014, ApJ, 788, 59
- Williams & Cieza (2011) Williams, J., & Cieza, L. 2011, ARA&A, 49, 67
- Wolf (2003) Wolf, S. 2003, Comput. Phys. Commun., 150, 99
- Wolfire & Cassinelli (1987) Wolfire, M., & Cassinelli, J. 1987, ApJ, 319, 850
- Wu et al. (2009) Wu, Y., Qin, S.-L., Guan, X., Xue, R., Ren, Z., Liu, T., Huang, M., & Chen, S. 2009, ApJ, 697, L116
- Xu et al. (2012) Xu, J.-L., Wang, J.-J., & Qin, S.-L. 2012, A&A, 540, L13
- Yen et al. (2014) Yen, H.-W., Takakuwa, S., Ohashi, N., Aikawa, Y., Aso, Y., Koyamatsu, S., Machida, M., Saigo, K., Saito, M., Tomida, K., & Tomisaka, K. 2014, ApJ, 793, 1
- Yorke (1986) Yorke, H. 1986, ARA&A, 24, 49
- Yorke (1995) — 1995, RevMexAA
- Yu & Wang (2013) Yu, N.-P., & Wang, J.-J. 2013, Res. Astron. Astrophys., 13, 1295
- Yun & Clemens (1994) Yun, J., & Clemens, D. 1994, ApJS, 92, 145
- Zapata et al. (2007) Zapata, L., Ho, P., Rodríguez, L., Schilke, P., & Kurtz, S. 2007, A&A, 471, L59
- Zapata et al. (2009) Zapata, L., Ho, P., Schilke, P., Rodríguez, L., Menten, K., Palau, A., & Garrod, R. 2009, ApJ, 698, 1422
- Zapata et al. (2008) Zapata, L., Palau, A., Ho, P., Schilke, P., Garrod, R., Rodríguez, L., & Menten, K. 2008, A&A, 479, L25
- Zhang & Ho (1997) Zhang, Q., & Ho, P. 1997, ApJ, 488, 241
- Zhang et al. (2007) Zhang, Q., Sridharan, T., Hunter, T., Chen, Y., Beuther, H., & Wyrowski, F. 2007, A&A, 470, 269
- Zhou et al. (1993) Zhou, S., Evans II, N., Koempe, C., & Walmsley, C. 1993, ApJ, 404, 232
- Zinnecker & Yorke (2007) Zinnecker, H., & Yorke, H. 2007, ARA&A, 45, 481