NuSTAR Observations of Magnetar 1E 1048.15937
Abstract
We report on simultaneous NuSTAR and XMM-Newton observations of the magnetar 1E 1048.15937, along with Rossi X-ray Timing Explorer (RXTE) data for the same source. The NuSTAR data provide a clear detection of this magnetar’s persistent emission up to 20 keV. We detect a previously unreported small secondary peak in the average pulse profile in the 7–10 keV band, which grows to an amplitude comparable to that of the main peak in the 10–20 keV band. We show using RXTE data that this secondary peak is likely transient. We find that the pulsed fraction increases with energy from a value of 0.55 at 2 keV to a value of 0.75 near 8 keV but shows evidence for decreasing at higher energies. After filtering out multiple bright X-ray bursts during the observation (An et al., 2014), we find that the phase-averaged spectrum from combined NuSTAR and XMM data is well described by an absorbed double blackbody plus power-law model, with no evidence for the spectral turn-up near 10 keV as has been seen in some other magnetars. Our data allow us to rule out a spectral turn-up similar to those seen in magnetars 4U 0142+61 and 1E 2259+586 of , where is the difference between the soft-band and hard-band photon indexes. The lack of spectral turn-up is consistent with what has been observed from an active subset of magnetars given previously reported trends suggesting the degree of spectral turn-up is correlated with spin-down rate and/or spin-inferred magnetic field.
1 Introduction
Magnetars have hard X-ray spectra that represent an interesting puzzle. Previously considered to be ‘soft’ X-ray sources (e.g. Mereghetti & Stella, 1995; van Paradijs et al., 1995), with energy spectra falling rapidly below 10 keV owing to a steep ( to ) power-law photon index, the discovery of hard X-ray emission from several magnetars (Revnivtsev et al., 2004; Kuiper et al., 2004, 2006), and the realization that their spectra can rise in energy above 10 keV, clearly demonstrated that in some cases, most of the energy in persistent magnetar emission arises in the hard X-ray band.
With now 8 magnetars exhibiting observable high energy emission (see Olausen & Kaspi, 2014, and references therein), some possible trends have been noted. The pulsed fraction of the hard X-ray emission has been suggested to rise with energy to reach 100% by 100 keV (Kuiper et al., 2006) although more recent studies using the Nuclear Spectroscopic Telescope Array (NuSTAR) have suggested otherwise for one source (An et al., 2013). The spectra of many magnetars appear to continue rising above 100 keV (Kuiper et al., 2006; den Hartog et al., 2008) although evidence for a spectral turnover near 300 keV was detected using INTEGRAL in the magnetar 4U 0142+61 (den Hartog et al., 2008). Kaspi & Boydstun (2010) noticed a possible anti-correlation between the degree of the soft–hard spectral turnover and either the frequency derivative or the magnetic field strength (see also Enoto et al., 2010).
The physical origin of magnetar hard X-ray emission is not yet well understood. Several models have been proposed in the literature (Heyl & Hernquist, 2005; Baring & Harding, 2007; Thompson & Beloborodov, 2005; Beloborodov & Thompson, 2007) although each has been argued to be problematic (see, e.g. Kaspi & Boydstun, 2010, for a discussion). Most recently, Beloborodov (2013) proposed a model that explains the hard X-ray emission as being due to escaping radiation from photons scattered by relativistic particles in the outer regions of large active magnetic loops called ‘j-bundles’. This model has been successfully applied to NuSTAR detections of magnetars 1E 1841045 (An et al., 2015), 1E 2259+586 (Vogel et al., 2014) and 4U 0142+61 (Tendulkar et al., 2015), as well as other observations (Hascoët et al., 2014), yielding interesting constraints on source geometries.
1E 1048.15937 is the only persistently bright magnetar (here ‘bright’ is defined as quiescent 2–10 keV unabsorbed flux erg cm-2 s-1) not yet to have shown clear persistent hard X-ray emission. Though monitored for many years with the Rossi X-ray Timing Explorer (RXTE) Proportional Counter Array (PCA) (e.g. Dib et al., 2009; Dib & Kaspi, 2014), and in spite of the PCA’s excellent sensitivity to hard X-rays albeit with no focusing capability, 1E 1048.15937 was not detected in detailed analysis by Kuiper et al. (2006), although Leyder et al. (2008) did report a marginal detection of unpulsed flux (4.5) in INTEGRAL data in the 22–100 keV band.
NuSTAR observed 1E 1048.15937 in 2013 in order to search for persistent hard X-ray emission. In this 320-ks observation, eight bright X-ray bursts were detected fortuitously; these have been reported on by An et al. (2014). Although bursts from this source have been previously detected (e.g. Gavriil et al., 2002; Gavriil & Kaspi, 2004; Dib & Kaspi, 2014), they are rare (five bursts were detected in 2.9 Ms for an average burst rate of one per week, assuming bursts are produced randomly, consistent with the behavior of this source). Hence the detection of eight bursts in 320 ks was somewhat unexpected, although in many magnetars bursts are seen to be clustered (e.g. Kaspi et al., 2003).
It spite of the bursting behavior, the pulsar’s persistent emission during the NuSTAR observation is known from independent Swift X-ray Telescope monitoring observations (Archibald et al., 2015) to have been nominal.
Here we report on these same 2013 NuSTAR observations of 1E 1048.15937, this time focusing on the persistent hard X-ray emission. We detect, for the first time, pulsations above 10 keV, only the 9th such magnetar detection yet. We show that these pulses are detected as high as 20 keV but no higher, precluding the same dramatic spectral turn-up observed in some other magnetars.111Note that well after our submission of this paper, we were made aware of the work of Weng & Göğüş (2015) who also analyzed these same data and found similar results.
2 Instruments and Observations
In order to study the pulsar’s hard X-ray emission, we conducted simultaneous observations using NuSTAR and ESA’s X-ray Multi-Mirror Mission (XMM-Newton).
NuSTAR is a NASA Small Explorer (SMEX) satellite mission operating in the keV range (Harrison et al., 2013). This is the first hard X-ray satellite mission (above 10 keV) with focusing capability. The instrument features two focal plane modules, dubbed FPMA and FPMB. Each module consists of a reflective, multilayer-coated, focusing telescope (Hailey et al., 2010; Craig et al., 2011) with a CdZnTe detector sitting in the focal plane (Harrison et al., 2010). The achievable FWHM energy resolution varies from eV at keV to eV at keV, while the angular resolution of the instrument is characterized by a half-power diameter (HPD) of 58 and a FWHM of 18.
The XMM-Newton observatory (Jansen et al., 2001) focuses on the soft X-ray regime ( keV) using its three on-board X-ray telescopes. Each of these Wolter I grazing-incidence optics consists of coaxially and co-focally nested mirrors. A European Photon Imaging Camera (EPIC) sits at the prime focus of each of the three telescopes. Two of these Charge-Coupled Devices (CCDs) make use of the MOS technology (MOS-1/MOS-2), while the third detector is a pn-CCD (Turner et al., 2001; Strüder et al., 2001). The achievable energy resolution lies between eV and the EPIC point-spread function is FWHM ( HPD).
NuSTAR observed 1E 1048.15937 in July of 2013. A total of four separate observations took place between July 17 and July 27 (NuSTAR observation IDs 30001024002, 30001024003, 30001024005 and 30001024007). As mentioned above, in these observations, which together comprised a total of 320-ks of exposure, eight bright X-ray bursts were detected (An et al., 2014). For the analysis presented in this paper we used the same data set, but excluded times of burst activity (bursts and their tails) to avoid contaminating timing and spectral results with burst emission.
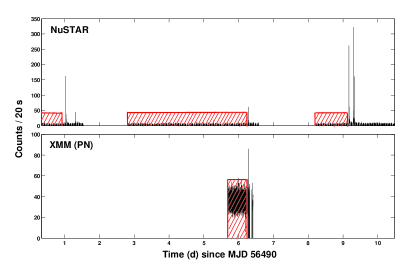
The selected portions of the light curve are shown in red in the top panel of Figure 1. Note that only 3 of the 4 NuSTAR data sets could be used in this analysis as the fourth was too contaminated by bursts and their tails (see An et al., 2014). The corresponding good time intervals (GTI) used in our analysis lie between MJDs , MJDs and MJDs . The total exposure time of all GTIs is ks for the presented analysis. Table 1 provides details on all data sets used in this analysis.
| Observatory | Instrument | Mode | ObsID | Date [MJD]aaAt the start of data acquisition. | Date [yymmdd]aaAt the start of data acquisition. | Exposure [ks] |
|---|---|---|---|---|---|---|
| NuSTAR | 30001024002 | 56490.33 | 130717 | 24.7/24.5bbBefore/after burst data removed, except for the RXTE/PCA data, which contained no bursts. | ||
| NuSTAR | 30001024003 | 56490.97 | 130717 | 24.0/0.0bbBefore/after burst data removed, except for the RXTE/PCA data, which contained no bursts. | ||
| NuSTAR | 30001024005 | 56492.83 | 130719 | 156.7/140.7bbBefore/after burst data removed, except for the RXTE/PCA data, which contained no bursts. | ||
| NuSTAR | 30001024007 | 56498.21 | 130725 | 111.3/47.4 | ||
| XMM | EPIC-pn | Full Frame | 0723330101 | 56495.69 | 130722 | 48 |
| XMM | EPIC-MOS1/2 | Small Window | 0723330101 | 56495.67 | 130722 | 64 |
| RXTE | PCA | Good Xenon | see §3.4 | 52630–54200 | 021222–070410 | 939.5 |
| RXTE | PCA | Good Xenon | see §3.4 | 54500–56000 | 080204–120314 | 1101.0 |
XMM-Newton observed 1E 1048.15937 from July 22-23, 2013 (Observation ID 0723330101), simultaneous with part of the NuSTAR observations, as shown in Figure 1. Our XMM observation made use of the EPIC pn-CCD as well as the MOS-type detectors (Turner et al., 2001; Strüder et al., 2001). The total exposure time for the EPIC pn-CCD observations was ks, while the MOS1/2 data set included ks. All cameras were acquiring in imaging mode with the pn-CCD using Full Frame Mode and MOS1/2 detectors running in Small Window Mode.
We processed the NuSTAR data using the standard NuSTAR Data Analysis Software NuSTARDAS version 1.4.1, including the standard data processing routines nupipeline and nuproducts, with the HEASoft software package222http://heasarc.nasa.gov/lheasoft/ (version 6.16) and CALDB333http://heasarc.gsfc.nasa.gov/docs/heasarc/caldb/caldb_intro.html (version 20140414). To include the GTIs in our data screening we made use of the usrgtifile parameter for the nupipeline and nuproducts commands. In the subsequent analysis, source events were selected from within a circular region of 60 radius at the Chandra position of 1E 1048.15937 (Olausen & Kaspi, 2014), while background events were extracted within a circular region of 100 radius far away from the source. The barycentric correction to the selected events was done using the multi-mission tool command barycorr together with the appropriate orbital and clock correction files.
In addition to the phase-averaged spectral analysis described below in §3.2, we conducted a phase-resolved study (§3.3). For this purpose, we defined MJD 56200.00002243577 as the time of phase zero and calculated the phase of each event in both the source and background region using the command dmtcalc in the CIAO software package444http://cxc.harvard.edu/ciao/ (version 4.6). We then employed the XSELECT tool of the HEASoft package to extract a spectrum in each of the chosen phase ranges. We regrouped the source spectrum to have a minimum of 30 counts per energy bin and conducted all following spectral analyses using XSPEC (version 12.8.2), which is also part of HEASoft. Because there were no significant source counts above 20 keV, we limited our analysis to the energy range of keV in the NuSTAR data. For all our spectral analyses, we assumed interstellar absorption cross sections from Balucinska-Church & McCammon (1992) (with updates from Yan et al., 1998) and abundances from Anders & Grevesse (1989).
To process the XMM-Newton data we made use of the SAS data analysis software package555http://xmm.esac.esa.int/sas/ (version 13.5.0), and employed the most recent calibration files (downloaded July 16, 2014) and standard threads666http://xmm.esac.esa.int/sas/current/documentation/threads/ to process the data. In order to avoid pile-up issues we selected an annular region around the source with an inner and outer radius of and , respectively. The background was selected in a source-free circular region of in radius. The XMM-Newton light-curve (Fig. 1, bottom) shows that there was a burst during the XMM observation, which was also observed in the NuSTAR data as reported by An et al. (2014). For the analysis described in this paper, only the XMM-Newton data before the burst were used.
To obtain the phase-resolved spectrum for XMM-Newton, we used the barycen command to apply the barycenter correction. The phase of each event was then obtained using phasecalc. Both commands are part of the standard SAS package. Following these steps we extracted a spectrum for each phase bin with the evselect command in the energy range keV and regrouped the data to obtain a minimum of counts per spectral bin.
Because of the bursting seen in the NuSTAR data, it is conceivable that tail emission following bursts that may have occured prior to the start of our three data intervals (see Fig. 1) could contaminate the results that follow. Given the short duration of tails seen following 1E 1048.15937 bursts (Gavriil et al., 2006; An et al., 2014), even if there had been a bursts prior to all three data intervals, at most 4% of our data would contain tail emission. Nevertheless, we have verified by examining archival data from Swift/BAT and Fermi/GBM that those instruments detected no bursts from the direction of 1E 1048.15937 during the relevant epochs. Additionally, we have verified that there is no evidence for a decreasing count rate at the start of any of the three observing intervals, as would be expected if tails were present there. Given the absence of a decreasing count rate and the properties of the bursts described by An et al. (2014), notably how the spectrum evolves with time, our simulations of the worst-case contamination and find our fitted spectral parameters for the persistent emission could not have been significant affected.
3 Analysis and Results
3.1 Timing Analysis
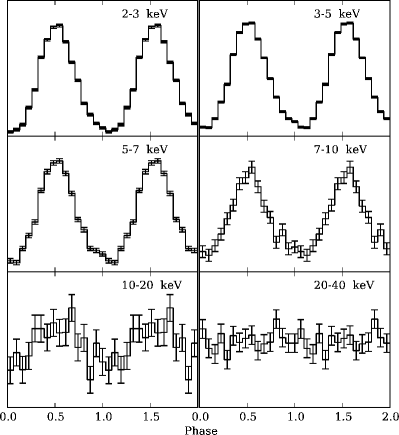
For the timing analysis, we searched for pulsations in the keV barycenter-corrected, event list using the H-test (De Jager et al., 1989) and determined the best period for 1E 1048.15937 in the NuSTAR data to be s. This period is consistent with that found in contemporaenous monitoring observations with the Swift X-ray Telescope (Archibald et al., 2015). We folded the barycenter-corrected events with this best-fit period to obtain the pulse profiles in different energy ranges for NuSTAR and XMM-Newton data separately. The results are shown in Figure 2.
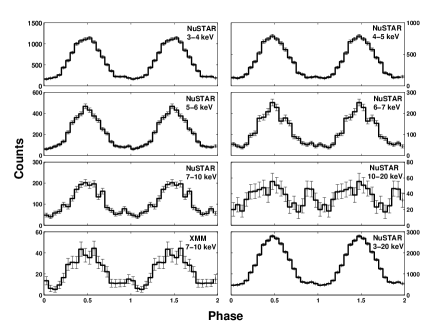
Below keV, the pulse profiles are largely sinusoidal in shape with only one single distinctive peak, in agreement with previous observations (e.g. Tiengo et al., 2005). Interestingly, there is a small secondary peak in the 7–10 keV NuSTAR pulse profile, consistent with a small excess apparent in the pulse profile from the XMM data in the same energy range, as shown in the bottom left panel of Figure 2. For the first time, pulsations above 10 keV are observed in this source. The secondary peak from the 7–10 keV band grows in amplitude such that the pulse profile of 1E 1048.15937 exhibits two peaks in the 10–20 keV energy band.
This secondary peak has a harder spectrum than the first and is roughly out of phase by 180∘, consistent with being from an opposite pole. However, as described below
(§3.4) this secondary peak is not detected in RXTE data from past epochs and so appears
to be transient.
Above about keV, no pulsations were detected, presumably due to a paucity of counts.
We also calculated the pulsed fraction (PF) as a function of energy for our NuSTAR and XMM observations using the folded pulse profiles and following the prescription described in An et al. (2015). Specifically, we calculated the area pulsed fraction PFarea (the difference between pulsed flux and constant flux integrated over a full phase cycle) and the RMS pulsed fraction PFRMS (a measure of the deviation of the pulsed flux from its mean) using 6 harmonics. Note that PFarea and PFRMS are expected to differ as they measure different quantities; see An et al. (2015) for details.
Figure 3 shows the results of our pulsed flux analysis for the NuSTAR and XMM (EPIC-pn) pulse profiles, specfically PFarea and PFRMS as a function of energy. In the Figure, NuSTAR data are shown in blue, while red refers to XMM (EPIC-pn) data. The area pulsed fractions and the RMS pulsed fractions are displayed as triangles and squares, respectively. The energy bands for the NuSTAR data correspond to those shown in Fig. 2, while for the XMM data we used the 0.3–10 keV band.
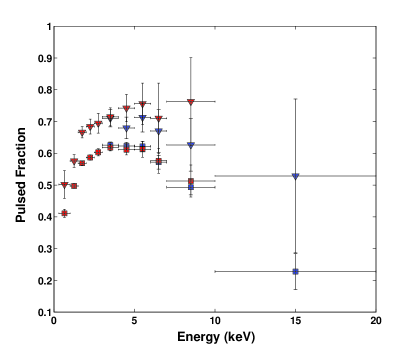
The observed trend for both PFarea and PFRMS is a slight increase with energy up to about keV and then a decrease for increasing energies. The latter is not statistically significant for PFarea considering the large uncertainties especially in the largest two energy bins, however it is for PFRMS. For energies around keV, PFarea is , which rises to about for energies around keV and “drops” to for keV. The results for PFRMS are , , and for energies around , , and keV, respectively.
3.2 Phase-Averaged Spectral Analysis
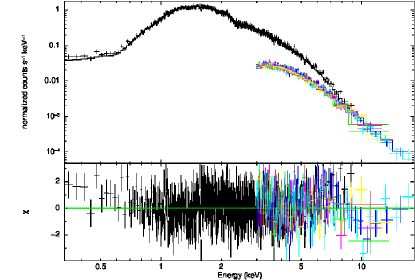
To study the spectrum of 1E 1048.15937, we combined data from NuSTAR and XMM. The XMM data were useful for establishing the low-energy spectrum, particularly the thermal component, since NuSTAR is not sensitive below 3 keV. We used only pn XMM data for the spectral analysis because of the fewer MOS counts and to minimize cross-calibration systematic errors. For pn we chose only data in the energy interval 0.3–10 keV, and for NuSTAR (FPMA+FPMB) only 3–20 keV data were used, because above 20 keV there were insufficient source counts for a meaningful result. We rebinned these data to have a minimum of 30 counts per spectral bin.
We began with a blackbody plus power-law model, often employed for magnetars, and used the model in XSPEC. We held the pn relative normalization at unity, and let the normalization values of the NuSTAR data groups vary. This absorbed blackbody plus power-law model yielded best-fit parameters of absorption cm-2, blackbody temperature 0.6670.005 keV, and photon index 3.640.02. Our best-fit is significantly higher than that reported by Tam et al. (2008) based on joint fits of Chandra, Swift and XMM data in the energy range 0.5–7 keV. The different energy ranges and different instruments used may account for the discrepancy; we note that our best-fit is statistically consistent with that measured by Tiengo et al. (2005) (their Observation C) which was based on XMM data only, and included data up to 10 keV. We tried different abundance and cross-section models (see §2) but these did not make significant differences to the fit, and resulted in values that differed from the above but at most a few percent. For our best-fit model, the 3–10 keV keV flux in the blackbody component is erg s-1 cm-2, and in the power-law component erg s-1 cm-2. The reduced to the fit described above was 1.07 with 1352 degree of freedom which has probability 4% of being due to chance. This low probability is suggestive – though not conclusive – that the model is not optimal. Figure 4 (top) shows the spectrum and residuals after subtraction of this simple model; indeed the residuals have some structure that suggests this model is not optimal.
| /dof | |||||||
|---|---|---|---|---|---|---|---|
| ( cm-2) | (keV) | (keV) | (keV) | ||||
| BB+PL | 1.22(1) | 0.667(5) | 3.64(2) | 1.07/1352 | |||
| BB+BknPL | 1.14(2) | 0.624(8) | 3.36(5) | 6.3(2) | 4.4(1) | 1.03/1350 | |
| 2BB+PL | 1.17(2) | 0.53(3) | 0.85(5) | 3.67(5) | 1.03/1350 | ||
| 2BB+BknPL | 1.22(5) | 0.51(2) | 0.87(5) | 4.1(3) | 5.3(8) | 3.0(5) | 1.03/1348 |
Uncertainties are at the confidence level. NuSTAR energy range is 3–20 keV with combined FPMA and FPMB data. XMM energy range is 0.3–10 keV with pn data only.
BB: blackbody, 2BB: two blackbodies, PL: power law, BknPL: broken power law.
For this reason, we also tried fitting these data with multiple different models. Specifically, we employed an absorbed blackbody plus broken power-law model to search for a spectral break, as is seen in some other magnetars. This model yielded a reduced value of 1.03 (see Table 2). Figure 4 (bottom) shows residuals for the broken power-law model. For completeness, we also tried a double blackbody plus power-law model as has been used in other hard X-ray analyses of magnetars (Hascoët et al., 2014), as well as a double blackbody plus broken power-law model, both with absorption. These yielded similar goodness-of-fits as the blackbody plus broken power law. Best-fit spectral parameters for all the models we tried are provided in Table 2. We verified that the improvement of the fits using these models over the simpler 2-component model was statistically significant using simulations. Using XSPEC, we created fake datasets having simple blackbody plus power-law spectra with parameters equal to those found when fitting such a model (see above). We then fit these fake data sets with the aforementioned multi-component models (blackbody plus broken power law, double blackbody plus power law, double blackbody plus broken power law) and recorded the change in fit statistic. For each trial model, in 1000 trials, in no case did the fit statistic change by an amount even close to that measured for the real data set. We hence conclude with 99.9% confidence that the improvement in fit for the 3-component models is required by the data.
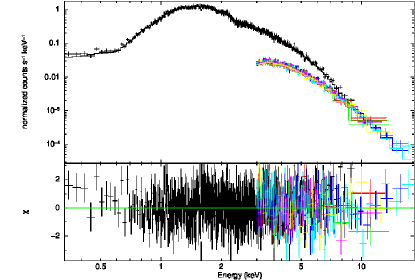
Importantly, for the blackbody plus broken power-law model, the best-fit results in a spectral break at 6.3 keV, and a significant spectral softening, with power-law index changing from 3.36 to 4.4. This is quite different from what has been observed for other magnetars for which hard X-ray emission has been detected (see Olausen & Kaspi, 2014, for a summary).
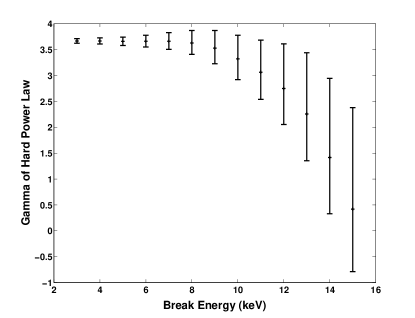
To investigate this possible softening further, and because there exists strong covariance between the break energy and change in photon index, we did the following analysis. Noting that a double blackbody plus power law provides a reasonable parameterization of the data, we used the best-fit absorbed double blackbody plus power-law model parameters (see Table 2) and kept them fixed while fitting an absorbed double blackbody plus broken power-law model. We then held the spectral break fixed at values between 3 and 15 keV, at 1 keV intervals, each time fitting only for the hard-band photon index, . The results are shown in Figure 5. The fit in this way shows marginal evidence for spectral hardening, rather than softening, however it is not statistically significant. We use this analysis instead to estimate an upper limit on any spectral change. Assuming a fiducial break energy of 10 keV, we set a 3 limit on to be 1.8, which limits any change in the power-law index from the soft band to be .
We performed additional simulations to investigate this result and in particular ask the question of whether we can rule out spectral turn-ups as have been seen in other magnetars. We took from the literature summarized by Kaspi & Boydstun (2010) the spectra of magnetars 4U 0142+61, 1E 1841045, 1E 2259+586 and 1RXS J17084009, specifically their respective spectral break energies and degree of spectral turn-up, as parameterized by . On top of our best-fit absorbed double blackbody plus power-law model, we added a spectral break and generated fake spectra in XSPEC using the fakeit command. The fake spectra were grouped to have at least 20 counts per spectral bin. Spectral fits were then performed in the 3–79 keV band with double blackbody plus broken power-law and a double blackbody plus power-law models, and the F-test probability was calculated given the results of every fit. The F-test probabilities (useful since we are comparing nested models) suggested that we can rule out with confidence . This is consistent with our independent analysis above, which gives us confidence we have found a robust limit.
In particular, we rule out spectral turn-ups like those observed in 4U 0142+61 ( keV, ) and 1E 2259+586 ( keV, ) with very high confidence (probability and , respectively), that for 1RXS J17084009 ( keV, ) at the 95% confidence level, but cannot rule out that for 1E 1841045 ( keV, ) with any confidence (probability 0.14). We thus conclude that we can rule out for 1E 1048.15937.
3.2.1 Upper Limit on 20–79 keV Flux
In addition, we calculated the upper limit on the total, phase-averaged flux for 1E 1048.15937 in the keV range using the conservative approach of Pivovaroff et al. (2000) to determine the count rate upper limit. This yielded an upper limit of cts s-1. We then used the NASA HEASARC tool WebPIMMs777https://heasarc.gsfc.nasa.gov/cgi-bin/Tools/w3pimms/w3pimms.pl based on PIMMS version 4.8 to obtain an estimate on the flux upper limit by using the values for hydrogen column density and the photon index of the expected power law888We neglected the blackbody contribution to the energy range from keV (PL). This yielded ergs cm-2 s-1 using the McGill Online Magnetar Catalogue999http://www.physics.mcgill.ca/ pulsar/magnetar/main.html ( cm-2, ) and ergs cm-2 s-1 for the best-fit values determined in our spectral analysis (see Table 2), i.e. cm-2, . To obtain a more robust upper limit on the keV we then used the fakeit command in XSPEC taking into account the NuSTAR response, which yields the flux upper limit of ergs cm-2 s-1 ( keV) for our best-fit values (Table 2).
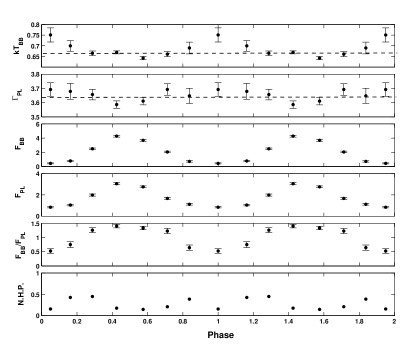
3.3 Phase-Resolved Spectral Analysis
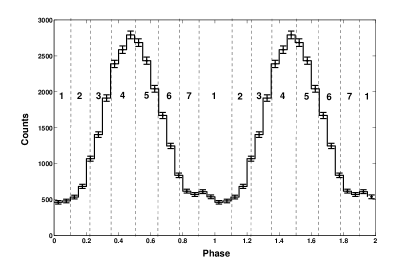
We defined MJD 56200.00002243577 as phase zero and used the period provided by the H-test (see §3.1) to obtain folded light curves for the NuSTAR and XMM data in the 3–20 keV and 0.3–10 keV bands, respectively. We divided the folded light curves into seven parts, as shown in Figure 6, echoing the phases defined by Tiengo et al. (2005). We adopted an absorbed blackbody plus power-law model to fit each phase bin. The best-fit absorption, , cm-2, from the phase-averaged fitting (see §3.2), was used and held fixed in the phase-resolved spectral analysis. The simple absorbed blackbody plus power-law model fit all phase bins well. The results are summarized in Figure 7, where we show the variability of the model parameters with pulse phase. The blackbody temperature in this spectral parameterization is varying significantly; a test yields a 0.2% probability of the observed variation being due to chance. The blackbody temperature is minimal at pulse maximum, suggesting spectral hardening away from the main pulse. On the other hand, in our data, the variation of the power-law index suggests the main pulse is harder than the off-pulse contribution, however a test indicates the variation is not significant, with a 17% chance of the variation being due to chance. Our analysis finds that the ratio of thermal to non-thermal flux is a maximum at the pulse peak. We note that the secondary peak we observe in the 10–20 keV band suggests spectral hardening away from the main peak, however at a level that is small and hence difficult to quantify.
3.4 Long-term RXTE Observations of 1E 1048.15397
In order to confirm the absence of a spectral turn-up in 1E 1048.15937 observed by NuSTAR, as well as to investigate the secondary peak we detected in the 10–20 keV NuSTAR pulse profile, we analyzed observations of 1E 1048.15937 from the Proportional Counting Array (PCA) aboard RXTE. The PCA consists of five collimated xenon/methane multianode proportional Counter Units (PCUs) which are sensitive to photons in the 2–60 keV range (Jahoda et al., 1996, 2006). 1E 1048.15937 was monitored with the PCA regularly for most of the lifetime of RXTE; see Dib & Kaspi (2014) for a summary. For all observations of 1E 1048.15937, the PCA was operated in “Good Xenon” mode, which provides 1-s resolution for photon arrival times. These observations were obtained from the HEASARC archive and reduced to the barycenter using the barycorr tool in HEASoft version 6.16. Observations were filtered to remove non-astrophysical events using xtefilt.
As 1E 1048.15937 has experienced several long-term flux flares (see Dib & Kaspi, 2014; Dib et al., 2009; Gavriil & Kaspi, 2004), we selected only observations from MJDs 52630–54200 and from MJDs 54500–56000, two periods of time where the reported 2–20 keV flux was relatively stable. This resulted in 2.06 Ms of data with an average of 2.07 PCUs on. Observations were folded using local ephemerides from Dib & Kaspi (2014), and then aligned by cross-correlating the profiles in the 2.0–5.5 keV band, where the signal-to-noise ratio is highest in these data.
In this data set, a pulsed signal is detectable at the lower-energy end of the PCA band and into the 10–20 keV band. PCA pulse profiles for various energy bands, including 10–20 keV, are shown in Figure 8. Note the absence of any evidence of a secondary peak in the 10–20 keV PCA profile, in contrast to that seen in the NuSTAR data (see Fig. 2). This is also consistent with what was reported by Kuiper et al. (2006). This demonstrates that this profile feature is likely transient in nature. Also note the apparent absence of any pulsations in the 20–40 keV PCA band. There is a possible hint of a secondary feature in the 7–10 keV band, however it is not statistically significant.
| Band | Pulsed Count Rate | Unabsorbed Pulsed Fluxa |
|---|---|---|
| (Counts PCU-1s-1) | (erg cm-2 s-1) | |
| 2–3 keV | () | |
| 3–5 keV | () | |
| 5–7 keV | () | |
| 7–10 keV | () | |
| 10–20 keV | () | |
| 20–40 keV |
Pulsed flux calculated using WebPIMMs assuming an absorbed power-law
plus blackbody with cm-2, , and .
We present pulsed count rates for the different energy bands in Table 3. To convert the PCA pulsed count rate into unabsorbed pulsed fluxes, we used WebPIMMs, assuming the phase-averaged spectral parameters we found in §3.2. These PCA count rates are consistent within uncertainties with the results from our XMM/NuSTAR analysis.
4 Discussion & Conclusions
Our joint NuSTAR and XMM data have provided a clear detection of pulsed emission from 1E 1048.15937 up to 20 keV. We have discovered a previously unreported small secondary peak in the average pulse profile in the 7–10 keV band, which grows to an amplitude comparable to that of the main peak in the 10–20 keV band. RXTE/PCA data averaged over several years prior to these new observations do not show any evidence of the secondary peak, indicating it is transient. We also have shown that the pulsed fraction of 1E 1048.15937 increases with energy from 2 keV to a value of 0.75 near 8 keV but shows evidence for decreasing at higher energies. In our spectral analysis, after filtering out multiple bright X-ray bursts (An et al., 2014), we have shown that the source’s phase-averaged spectrum is well described (though not uniquely) by an absorbed double blackbody plus power-law model. The data show no evidence for the spectral turn-up near 10 keV seen in some other magnetars. Indeed, for 1E 10481.15937, we can rule out a spectral turn-up similar to those seen in magnetars 4U 0142+61 and 1E 2259+586 of . We have also studied the phase-resolved spectrum and have observed clear spectral changes with rotational phase.
It is important to compare the NuSTAR-constrained hard X-ray flux of 1E 1048.15937 with other estimates, in order to look for variability. The marginal INTEGRAL detection of 1E 1048.15937 (Leyder et al., 2008) in the 22–100 keV band was reported without any spectral information, but with a count rate. By comparing the count rate with that reported for a different source ( Carina) in the same paper, and assuming the two sources have similar spectra in that energy band, we infer a 22–100 keV flux of erg s-1 cm-2. This is nominally just above our 3 upper limit in the 20–79 keV band (see §3.2.1). However given the uncertainties particularly in the INTEGRAL value, the two fluxes cannot be considered inconsistent. Nevertheless we may ask, given the soft X-ray variability seen in the source (Dib & Kaspi, 2014; Archibald et al., 2015), whether the INTEGRAL or NuSTAR/XMM data were taken at substantially different phases in the source’s X-ray flux evolution. If so, the comparison of their hard X-ray fluxes, however crude, may not make sense. The INTEGRAL data were averaged over several years, mostly from May 2003 to June 2005. During that time span, the 2–10 keV flux of 1E 1048.15937 was slowly declining following a bright flare in mid-2002 and the source was undergoing rapid (yet unexplained) torque variations during the first half of the interval (Gavriil & Kaspi, 2004; Dib & Kaspi, 2014). On the other hand, the NuSTAR/XMM data were also taken during the decline of the source flux following a flux flare at the start of 2012, but after the cessations of the strong torque variability following that event (Archibald et al., 2015). Hence the source did exhibit somewhat different rotational behavior during the reported INTEGRAL observing epoch and that of our observations, although this, and the uncertainty in the INTEGRAL flux, are insufficient for concluding the hard X-ray flux varies. The consistency of the pulsed fluxes from RXTE/PCA (Table 3) with those from our NuSTAR/XMM analysis strengthen our conclusion that we find no evidence for flux variation in the hard band for this source, although this is not a strong conclusion.
The absence of an observed spectral turn-up is interesting and not unexpected in the model of Beloborodov (2013). One possible explanation is unfavourable geometry. If the object is viewed close to the rotation axis, e.g. at 10∘–20∘, and the magnetic dipole axis is weakly inclined to the spin axis (as suggested by observations; see Hascoët et al., 2014), then the line-of-sight to the emission remains close to the magnetic axis at all rotation phases. In this case the predicted hard X-ray component is generally weak (see Fig. 7 in Beloborodov, 2013). In other words, the source may actually produce copious hard X-rays, but we do not observe them due to an unfavourable viewing angle. The geometry of an axisymmetric j-bundle viewed near the magnetic axis may also be consistent with the reduction of pulsed fraction at high energies (Fig. 3). On the other hand, for a small angle between the line-of-sight and the rotation axis, a high pulsed fraction at low energies as is observed would not obviously be expected. It could be that the inclination is larger but we do not see the j-bundle because it is not axisymmetric and instead confined to a small range of magnetic azimuth, so that its field lines are never tangent to our line of sight (and therefore do not emit hard X-rays toward our direction). Another possibility is that the object has a weak or non-existing magnetic twist/j-bundle. However, in this case it is unclear why its emission extends to 20 keV.
The absence of an observed spectral turn-up is consistent with a trend noted by Kaspi & Boydstun (2010) between degree of spectral upturn and both spin-inferred magnetic field strength and spin-down rate in magnetars. The spin-inferred surface dipolar magnetic field strength of 1E 1048.15937 is G, but because its spin-down rate can vary by over a factor of 10 (Archibald et al., 2015), inferred from this spin-down should be regarded with caution. The trends noted by Kaspi & Boydstun (2010) suggested that 1E 1048.15937 should have a hard-band of 1–2, and that the difference between soft-band and hard-band photon indexes, , should be 0–1.101010Note, in the text of Kaspi & Boydstun (2010) the authors predicted , which is not consistent with their own trends. We believe this was an oversight. From the current data, we cannot constrain very strongly. However we can rule out sharp spectral upturns as observed in magnetars 4U 0142+61 and 1E 2259+586. In this sense, our results for 1E 1048.15937 are consistent with the reported correlation.
The small secondary peak in the pulse profile seen in the 10–20 keV band appears to be a new feature, as previous RXTE data (see Fig. 8 and Kaspi et al., 2001; Kuiper et al., 2006) show no evidence for it. This may suggest that the source was not in a true quiescent state during the NuSTAR/XMM observations, as other temporary features in the pulse profile have been reported, notably near the epochs of bright flux flares (see Dib & Kaspi, 2014, and references therein). Indeed the bursting behavior we detected during our observation is consistent with the source being in some form of outburst. On the other hand, at the epoch of our NuSTAR and XMM data, as discussed above, the source had largely recovered from its 2012 flux flare and was in a relatively rotationally stable phase (Archibald et al., 2015). In any case, the hard-band pulse profile, in contrast to the source hard-band flux, is clearly variable.
In our phase-resolved analysis, we found that the blackbody temperature, as judged from the absorbed blackbody plus power-law model, was highest off-pulse. This is opposite to the trend reported by Tiengo et al. (2005), who found the main pulse to have a higher blackbody temperature. We note that the behavior in phase of the power-law index in our analysis, namely a harder on-pulse, is consistent with that seen by Tiengo et al. (2005), however not to the same degree: our power-law index varies by 0.1 over a period, while theirs did by 0.4. However, an important caveat in this comparison is that in the Tiengo et al. (2005) analysis, no attempt was made to vary the blackbody and power-law components simultaneously, presumably due to lack of counts. Hence, the comparison of the behaviors of either or is not exact. Regardless, both analyses find that the ratio of thermal to non-thermal flux is a maximum at the pulse peak, with variation by a factor of 3 over the period, although again, Tiengo et al. (2005) do not vary both model components, so the comparison is not ideal.
Our observations have served to continue to flesh out the hard X-ray emission properties of magnetars as a population. For the target in question, 1E 1048.15937, the source’s faintness at hard X-ray energies precludes detailed modelling using the framework of Hascoët et al. (2014) as has been used in other NuSTAR magnetar studies. However, a comparably long second joint NuSTAR/XMM observation could at least test whether the bursting fortuitously detected in the first observation impacted the hard-band properties, particularly the appearance of the secondary pulse peak. An observation much longer than ours would be required to enable detailed physical modelling. Long-term monitoring with the LAXPC instrument aboard the Astrosat mission has the potential to reveal more about the hard X-ray emission of 1E 1048.15397, but this will require several megaseconds of exposure. Of the persistently X-ray bright magnetars, 1E 1048.15937 is the faintest in the soft band; our faint 10–20 keV detection, in spite of the lengthy NuSTAR exposure, demonstrates that NuSTAR hard-band detections of fainter magnetars – unless they are in outburst – will be challenging.
References
- An et al. (2013) An, H., Hascoët, R., Kaspi, V. M., et al. 2013, ApJ, 779, 163
- An et al. (2014) An, H., Kaspi, V. M., Beloborodov, A. M., et al. 2014, ApJ, 790, 60
- An et al. (2015) An, H., Archibald, R. F., Hascoët, R., et al. 2015, ApJ, 807, 93
- Anders & Grevesse (1989) Anders, E., & Grevesse, N. 1989, Geochim. Cosmochim. Acta, 53, 197
- Archibald et al. (2015) Archibald, R. F., Kaspi, V. M., Ng, C.-Y., et al. 2015, ApJ, 800, 33
- Balucinska-Church & McCammon (1992) Balucinska-Church, M., & McCammon, D. 1992, ApJ, 400, 699
- Baring & Harding (2007) Baring, M. G., & Harding, A. K. 2007, Ap&SS, 308, 109
- Beloborodov (2013) Beloborodov, A. M. 2013, ApJ, 762, 13
- Beloborodov & Thompson (2007) Beloborodov, A. M., & Thompson, C. 2007, ApJ, 657, 967
- Craig et al. (2011) Craig, W. W., An, H., Blaedel, K. L., et al. 2011, in Society of Photo-Optical Instrumentation Engineers (SPIE) Conference Series, Vol. 8147, Society of Photo-Optical Instrumentation Engineers (SPIE) Conference Series, 0
- De Jager et al. (1989) De Jager, O. C., Swanepoel, J. W. H., & Raubenheimer, B. C. 1989, A&A, 221, 180
- den Hartog et al. (2008) den Hartog, P. R., Kuiper, L., & Hermsen, W. 2008, A&A, 489, 263
- den Hartog et al. (2008) den Hartog, P. R., Kuiper, L., & Hermsen, W. 2008, A&A, 489, 263
- Dib & Kaspi (2014) Dib, R., & Kaspi, V. M. 2014, ApJ, 784, 37
- Dib et al. (2009) Dib, R., Kaspi, V. M., & Gavriil, F. P. 2009, ApJ, 702, 614
- Enoto et al. (2010) Enoto, T., Nakazawa, K., Makishima, K., et al. 2010, ApJ, 722, L162
- Gavriil & Kaspi (2004) Gavriil, F. P., & Kaspi, V. M. 2004, ApJ, 609, L67
- Gavriil et al. (2002) Gavriil, F. P., Kaspi, V. M., & Woods, P. M. 2002, Nature, 419, 142
- Gavriil et al. (2006) Gavriil, F. P., Kaspi, V. M., & Woods, P. M. 2006, ApJ, 641, 418
- Hailey et al. (2010) Hailey, C. J., An, H., Blaedel, K. L., et al. 2010, in Society of Photo-Optical Instrumentation Engineers (SPIE) Conference Series, Vol. 7732, Society of Photo-Optical Instrumentation Engineers (SPIE) Conference Series
- Harrison et al. (2010) Harrison, F. A., Cook, W. R., Hiyasaka, H., & McLean, R. 2010, in Semiconductor radiation detection systems, ed. K. Iniewski (Boca Raton, FL: CRC Press)
- Harrison et al. (2013) Harrison, F. A., Craig, W. W., Christensen, F. E., et al. 2013, ApJ, 770, 103
- Hascoët et al. (2014) Hascoët, R., Beloborodov, A. M., & den Hartog, P. R. 2014, ApJ, 786, L1
- Heyl & Hernquist (2005) Heyl, J. S., & Hernquist, L. 2005, ApJ, 618, 463
- Jahoda et al. (2006) Jahoda, K., Markwardt, C. B., Radeva, Y., et al. 2006, ApJS, 163, 401
- Jahoda et al. (1996) Jahoda, K., Swank, J. H., Giles, A. B., et al. 1996, Proc. SPIE, 2808, 59
- Jansen et al. (2001) Jansen, F., Lumb, D., Altieri, B., et al. 2001, A&A, 365, L1
- Kaspi & Boydstun (2010) Kaspi, V. M., & Boydstun, K. 2010, ApJ, 710, L115
- Kaspi et al. (2001) Kaspi, V. M., Gavriil, F. P., Chakrabarty, D., Lackey, J. R., & Muno, M. P. 2001, ApJ, 558, 253
- Kaspi et al. (2003) Kaspi, V. M., Gavriil, F. P., Woods, P. M., et al. 2003, ApJ, 588, L93
- Kuiper et al. (2004) Kuiper, L., Hermsen, W., & Mendez, M. 2004, ApJ, 613, 1173
- Kuiper et al. (2006) Kuiper, L., Hermsen, W., den Hartog, P. R., & Collmar, W. 2006, ApJ, 645, 556
- Leyder et al. (2008) Leyder, J.-C., Walter, R., & Rauw, G. 2008, A&A, 477, L29
- Mereghetti & Stella (1995) Mereghetti, S., & Stella, L. 1995, ApJ, 442, L17
- Olausen & Kaspi (2014) Olausen, S. A., & Kaspi, V. M. 2014, ApJS, 212, 6
- Pivovaroff et al. (2000) Pivovaroff, M., Kaspi, V. M., & Camilo, F. 2000, ApJ, 535, 379
- Revnivtsev et al. (2004) Revnivtsev, M. G., Sunyaev, R. A., Varshalovich, D. A., et al. 2004, Astronomy Letters, 30, 382
- Strüder et al. (2001) Strüder, L., Briel, U., Dennerl, K., et al. 2001, A&A, 365, L18
- Tam et al. (2008) Tam, C. R., Gavriil, F. P., Dib, R., et al. 2008, ApJ, 677, 503
- Tendulkar et al. (2015) Tendulkar, S. P., Hascöet, R., Yang, C., et al. 2015, ApJ, 808, 32
- Thompson & Beloborodov (2005) Thompson, C., & Beloborodov, A. M. 2005, ApJ, 634, 565
- Tiengo et al. (2005) Tiengo, A., Mereghetti, S., Turolla, R., et al. 2005, A&A, 437, 997
- Turner et al. (2001) Turner, M. J. L., Abbey, A., Arnaud, M., et al. 2001, A&A, 365, L27
- van Paradijs et al. (1995) van Paradijs, J., Taam, R. E., & van den Heuvel, E. P. J. 1995, A&A, 299, L41
- Vogel et al. (2014) Vogel, J. K., Hascoët, R., Kaspi, V. M., et al. 2014, ApJ, 789, 75
- Weng & Göğüş (2015) Weng, S.-S. & Göğüş, E. 2015, ApJ, 815, 15
- Yan et al. (1998) Yan, M., Sadeghpour, H. R., & Dalgarno, A. 1998, ApJ, 496, 1044