Galactic cold cores VI. Dust opacity spectral index ††thanks: Planck (http://www.esa.int/Planck) is a project of the European Space Agency – ESA – with instruments provided by two scientific consortia funded by ESA member states (in particular the lead countries: France and Italy) with contributions from NASA (USA), and telescope reflectors provided in a collaboration between ESA and a scientific consortium led and funded by Denmark. ††thanks: Herschel is an ESA space observatory with science instruments provided by European-led Principal Investigator consortia and with important participation from NASA. ††thanks: Table 3 is available in electronic form at the CDS via anonymous ftp to cdsarc.u-strasbg.fr (130.79.128.5) or via http://cdsweb.u-strasbg.fr/cgi-bin/qcat?J/A+A/
Abstract
Context. The project has carried out photometric observations of 116 fields where the survey has found signs of cold dust emission. The fields contain sources in different environments and different phases of star formation. Previous studies have revealed variations in their dust submillimetre opacity.
Aims. The aim is to measure the value of dust opacity spectral index and to understand its variations spatially and with respect to other parameters, such as temperature, column density, and Galactic location.
Methods. The dust opacity spectral index and the dust colour temperature are derived using and data. The relation between and is examined for the whole sample and inside individual fields.
Results. Based on and data, the fields are characterised by a median colour temperature of 16.1 K and a median opacity spectral index of = 1.84. The values are not correlated with Galactic longitude. We observe a clear – anti-correlation. In observations, constrained at lower resolution by data, the variations follow the column density structure and can rise to in individual clumps. The highest values are found in starless clumps. The 217 GHz band shows a systematic excess that is not restricted to cold clumps and is thus consistent with a general flattening of the dust emission spectrum at millimetre wavelengths. When fitted separately below and above 700 m, the median spectral index values are and .
Conclusions. The spectral index changes as a function of column density and wavelength. The comparison of different data sets and the examination of possible error sources show that our results are robust. However, variations are partly masked by temperature gradients and the changes in the intrinsic grain properties may be even greater.
Key Words.:
ISM: clouds – Infrared: ISM – Submillimetre: ISM – dust, extinction – Stars: formation – Stars: protostars1 Introduction
The all-sky survey of the Planck satellite (Tauber et al. 2010) enabled the identification of cold interstellar dust clouds on a Galactic scale. The high sensitivity and an angular resolution of better than allowed the detection and classification of a large number of cold and compact sources that, based on the low temperature alone, are likely to be associated with prestellar phases of the star formation process. Analysis of Planck data led to the creation of the Cold Clump Catalogue of Planck Objects (C3PO, see Planck Collaboration XXIII 2011), with more than 10000 sources. The low colour temperatures (mostly K) indicate that the fields have high column density structures that are only partially resolved by the Planck beam. Many of the clumps are likely to contain gravitationally bound cores.
The Herschel Open Time Key Programme Galactic Cold Cores carried out dust continuum emission observations of 116 fields that were selected based on the Planck C3PO catalogue. The fields were mapped with Herschel PACS and SPIRE instruments (Pilbratt et al. 2010; Poglitsch et al. 2010; Griffin et al. 2010) at wavelengths of 100–500 m. Herschel makes it possible to study the Planck clumps and their internal structure in detail (Juvela et al. 2012; Montillaud et al. 2015, in press; Rivera-Ingraham et al. 2015, submitted). The mapped fields are typically in size, enabling investigation of dust properties on larger scales and, in particular, comparison of dust properties between the dense and cold regions and their lower density environment. First results have been presented in Planck Collaboration XXIII (2011); Planck Collaboration XXII (2011), and in Juvela et al. (2010, 2011, 2012) (Papers I, II, and III, respectively). Montillaud et al. (2015, in press) present an analysis of submillimetre clumps and star formation in these Herschel fields. Other studies have been carried out in high latitude fields in Malinen et al. (2014), Rivera-Ingraham et al. (2015, submitted), and Ristorcelli et al. (in preparation).
In this paper we concentrate on the dust opacity spectral index, . Our previous studies indicated significant variations in the dust submillimetre opacity, , and the average opacity was found to be more than twice the typical value found in diffuse clouds (Juvela et al. 2015). In the densest clumps – if nearby and hence well resolved – showed additional increase by more than a factor of two. We therefore might expect to see some related changes in the spectral index for these sources.
The observed spectral index or emission spectral index, , is derived from the spectral energy distribution (SED) of dust emission assuming that dust is optically thin, and its emission can be modelled with a modified blackbody. In such a model describes the asymptotic behaviour of the dust opacity at long wavelengths. According to physical models describing the optical response of matter with light, such as the Lorentz model, at far-infrared (FIR) and submillimetre wavelengths is independent of temperature and may take values in the range 1- 2 depending on dust composition and structure (Bohren & Huffman 1998). However, FIR/submillimetre observations have shown that (i) values depend on the astrophysical environment, (ii) that and the dust temperature are anti-correlated, and (iii) that varies with wavelength such that the dust SED flattens for 500-800 m. The -T anti-correlation was first observed by Dupac et al. (2003) and Désert et al. (2008) from PRONAOS and ARCHEOPS observations of various regions of the interstellar medium (ISM) in the FIR and submillimetre-to-millimetre ranges respectively. Many studies based on Herschel and Planck data find that and Tdust are anti-correlated (Rodón et al. 2010; Veneziani et al. 2010; Paradis et al. 2010; Etxaluze et al. 2011; Planck Collaboration et al. 2011). These studies have derived values as low as in warm regions, while values greater than 2 have been obtained for cold environments.
A flattening of the dust SED at longer wavelengths, first observed by Reach et al. (1995), is also widely detected by Herschel and Planck in various Galactic and extragalactic environments (Gordon et al. 2010; Galliano et al. 2011; Paradis et al. 2012; Planck Collaboration XVII 2011; Planck Collaboration XIX 2011). In the literature, this is sometimes referred to as the sub-mm or FIR excess. Rather than a single value of across the entire FIR-to-millimetre regime, one may thus define two spectral indices, at 353 GHz and at 353 GHz. This approach was adopted by Planck studies of ISM dust at high galactic latitude (Planck Collaboration Int. XVII 2014) and in the Galactic plane (Planck Collaboration Int. XIV 2014), which found that is greater than by and dex, respectively.
The observed anti-correlation could stem from the intrinsic properties of dust grain material, more specifically from its amorphous structure. Laboratory studies of interstellar dust analogues show that the dust opacity increases with temperature, that the spectral index increases when the temperature decreases, and that a single spectral index is generally not sufficient to describe the experimental data (Agladze et al. 1996; Mennella et al. 1998; Boudet et al. 2005; Coupeaud et al. 2011). This temperature-dependent behaviour is related to low energy transitions that are associated with the amorphous structure of the material. It can be modelled with the TLS model (Meny et al. 2007), which has also been shown to successfully reproduce observations of ISM dust emission at FIR/submillimetre wavelengths (Paradis et al. 2011, 2014). Variations in the dust spectral index could also reflect the dust evolution in the various astrophysical environments, e.g. grain growth and coagulation in dense clouds (Steinacker et al. 2010; Pagani et al. 2010; Köhler et al. 2012) or evolution of the carbonaceous dust component (Jones et al. 2013). It is probable that several processes occur in the ISM and the interpretation of the T- anti-correlation is therefore not straightforward. Finally, it is also important to note that and Tdust are partially degenerate. Estimates of are affected by noise in the data, temperature variations along the line-of-sight and by the method used to fit the observations (Shetty et al. 2009b, a; Juvela & Ysard 2012a; Malinen et al. 2011; Juvela & Ysard 2012b; Ysard et al. 2012; Juvela et al. 2013; Pagani et al. 2015). The robustness and interpretation of any observed anti-correlation between and Tdust requires the accurate determination and proper treatment of these biases.
2 Observations and methods
2.1 Herschel data
The target fields for Herschel observations were selected using the information that was available from Planck observations and ancillary data at that time. The goal was to cover a representative set of Planck clumps with respect to Galactic longitude and latitude, estimated dust colour temperature, and clump mass. The selection of the Herschel fields is described in Juvela et al. (2012) and an overview of all the maps is given in Montillaud et al. (2015, in press) and Juvela et al. (2015). The sample does not include sources in the Galactic plane, , which is covered by the Hi-GAL programme (Molinari et al. 2010). Similarly, regions included in other Herschel key programmes like the Gould Belt survey (André et al. 2010) and HOBYS (Motte et al. 2010) were avoided.
Our observations cover 116 fields. The SPIRE maps correspond to wavelengths 250 m, 350 m and 500 m. They have an average size of arcmin2. PACS maps were obtained at 100 m and 160 m. They are smaller, with an average size of arcmin2. The fields are listed in Table LABEL:table:fields. The Herschel observation numbers can be found in Montillaud et al. (2015, in press).
The SPIRE observations were reduced with the Herschel Interactive Processing
Environment HIPE v.12.0, using the official pipeline with the iterative destriper
and the extended emission calibration options. The maps were produced with the
naive map-making routine. The PACS data at 100 m and 160 m were
processed with HIPE v. 12.0 up to Level 1 and the final maps were produced with
Scanamorphos v.23 (Roussel 2013). In order of increasing wavelength, the
resolution is approximately 7, 12, 18, 25, and
37 for the five bands.
The raw and pipeline reduced data are available via the Herschel Science
Archive.
The accuracy of the absolute calibration of the SPIRE observations is expected to
be better than 7% and the relative calibration between the SPIRE bands better than
2%111SPIRE Observer’s manual,
http://herschel.esac.esa.int/Documentation.shtml. For PACS, when combined with
SPIRE data, we adopt an error estimate of 10%. The value is consistent with the
differences between PACS and Spitzer MIPS measurements of extended emission
222http://herschel.esac.esa.int/twiki/bin/view/Public/PacsCalibrationWeb.
Herschel observations were convolved to the resolution of the 500 m
data using the latest information about the beam
shapes333http://herschel.esac.esa.int/twiki/bin/view/Public/
SpirePhotometerBeamProfileAnalysis.
The effective point spread function (PSF) depends on the source spectrum. For
spectra characteristic of our fields (temperatures 10–20 K, spectral index
1.5-2.5) the variation of the PSF shape at a given distance from its
centre is at a level of %. The net effect on the final surface brightness
maps is smaller, because of radial averaging and because the signal is never
produced by a single point source.
The difference with the Gaussian approximation
used in the previous papers (e.g. Juvela et al. 2012; Montillaud et al. 2015, in press) is more significant
(see Griffin et al. 2013).
We use beams calculated for a modified blackbody spectrum with fixed parameters
K and . These correspond to the expected parameter values for
cold and compact sources but the beam shape does not vary significantly for the
range of and values found in our fields. We constructed circular
symmetric convolution kernels that, together with the original PSF, result in an
effective PSF identical (to within a fraction of one per cent) to that of the
500 m band. After convolving data to the common resolution of the 500 m
band, all maps were resampled onto the 14 pixel grid of the original
500 m maps. This provides adequate sampling of the beam. For
part of the analysis in this paper, the data were further convolved to
resolution.
To determine the absolute zero point of the intensity scale of Herschel SPIRE data, we compared the data with Planck (see Sect. 2.2) and IRIS 100 m (Miville-Deschênes & Lagache 2005) observations. This was done at the 4.85 resolution of Planck (IRIS and the 857 GHz Planck data were convolved to this resolution; see below Sect. 2.2). The detailed procedure of the comparison is described in Montillaud et al. (2015, in press). The Planck and IRIS measurements are interpolated to Herschel wavelengths using modified black body curves with . Linear least squares fits between Herschel and these reference data provide estimates of the Herschel surface brightness zero points and their statistical uncertainty. Unlike in Juvela et al. (2012), the results are used to correct not only the zero point but also the gain calibration. At 250 m the estimated zero point errors are 1 MJy sr-1 or less. The formal uncertainties of the slopes (gain correction) are below 1% and typically 0.5%. We continue to assume an uncertainty of 2% for the calibration of the SPIRE channels. Figure 1 shows an example of the quality of the correlations between PACS 160 m and AKARI 140 m and between SPIRE 250 m and interpolated IRIS and Planck data. Note that at the lowest surface brightness the PACS error estimates are already dominated by the multiplicative calibration uncertainty, which is 4 MJy sr-1 for a surface brightness of 40 MJy sr-1 (see below).

For PACS, the linear correlations are often less well defined. In our previous papers (e.g. Juvela et al. 2011, 2012), the zero points were determined from direct comparison of the average surface brightness values of the Herschel and interpolated IRAS and Planck data. Because of the similarity of the wavelength, here we use zero points that are obtained from a comparison with AKARI 140 m all-sky maps (Doi et al. 2015) with a resolution of and with the surface brightness scale tied to DIRBE (resolution ). The comparison includes colour corrections and extrapolation between 140 m and 160 m. Both are calculated from the same modified blackbody spectra as above, using = 1.8 fits to SPIRE channels (see below). The 160 m gain calibration is not changed and we continue to assume a relative uncertainty of 10%. The comparison of Herschel and AKARI intensities (averaged over the Herschel coverage) involves very small statistical errors. The uncertainty of the 160 m zero point is thus dominated by the uncertainty of the AKARI zero point, the relative calibration, and the wavelength extrapolation. We subtracted from AKARI data a cosmic infrared background (CIRB) level of 0.95 MJy sr-1 but the uncertainty of this component is estimated at only 0.2 MJy sr-1 (Matsuura et al. 2011). We assume that the overall zero point accuracy of 160 m is not better than 1 MJy sr-1, the statistical uncertainty of the zero points in the previously used correlations with Planck and IRIS. The reason for using Herschel 160 m data instead of relying directly on AKARI 140 m band is that, in addition to higher spatial resolution, the map quality of Herschel data is better, especially at small scales.
The zero point and gain corrections discussed above were calculated iteratively together with the determination of colour corrections. In the case of SPIRE, the corrections also take the dependence between source spectrum and beam solid angles into account. The colour corrections were calculated for modified blackbody spectra with (the expected average value over the fields), using colour temperatures that were calculated pixel-by-pixel using SPIRE data and the same fixed value of . At K the difference between and colour corrections would be 1.0% for all channels 160 m–500 m (the 100 m band is not used in this paper). Part of that error would further cancel out when a change in is compensated by an opposite change in the fitted temperature. Even in the 160 m band and at a low temperature of 12 K, a difference of in the colour correction translates to a change of less than 1 % in surface brightness. Thus, colour corrections with a fixed value of do not bias the values that we derive in our subsequent analysis.
The SPIRE error estimates mainly consist of the assumed uncertainty of gain calibration that is tied to Planck via least squares fits that are performed separately for each field and band. Thus, these include a significant statistical component, in addition to the uncertainty of absolute calibration of Planck (and IRIS). In the 250 m band, additional uncertainty results from interpolation between 100 m and 350 m. The PACS uncertainties consist of the uncertainty of the original Herschel gain calibration, of zero point uncertainties (resulting from comparison with AKARI), and of mapping artefacts that can be more important than for SPIRE. The correlations between PACS and interpolated IRAS and Planck data (not used in this paper) also suggest that PACS errors are not dominated by systematic errors. In SPIRE bands systematic errors should be a larger fractional component because of the smaller statistical errors.
2.2 Planck and IRIS data
Planck data from the 857 GHz, 545 GHz, 353 GHz, and 217 GHz bands are used to study the dust spectrum at lower resolution, to make use of the longer wavelength coverage of Planck. The 857 GHz and 545 GHz channels were already used above to estimate zero points for the Herschel surface brightness data. The IRIS 100 m data suffer from the problems mentioned earlier (see Sects. 1 and 2.3), the unknown contribution from stochastically heated very small grains and the sensitivity to line-of-sight temperature variations. However, because the combination of Planck and IRIS has already been studied over the whole sky (e.g. Planck Collaboration XII 2014), it is useful to investigate them also in the selected Herschel fields.
The Planck data are described in Planck Collaboration VIII (2014). We use the data from the official release that is available via the Planck Legacy Archive444http://pla.esac.esa.int/pla/aio/planckProducts.html and is described by the Planck Explanatory Supplement555http://www.sciops.esa.int/wikiSI/planckpla. We use zodiacal light subtracted maps where the estimated cosmic infrared background has also already been subtracted. The cosmic microwave background (CMB) anisotropies were subtracted using the CMB maps, which have been calculated with the SMICA algorithm (Planck Collaboration XII 2014) and are available in the Planck Legacy Archive. To set the Galactic zero levels, the surface brightness values listed in Table 5 of Planck Collaboration VIII (2014) were subtracted. These do not contain the cosmic infrared background and, for consistency, an estimated CIRB level of 0.80 MJy sr-1 was also subtracted from 100 m IRIS data (Hauser et al. 1998; Matsuura et al. 2011).
Several transitions of the CO molecule fall within the Planck bands, producing signal above the pure dust emission. The transition = 2–1 is inside the 217 GHz band and the transition = 3–2 inside the 353 GHz band. The higher transitions are likely to be too weak to be a concern because of the steep rise of the dust spectrum towards shorter wavelengths. In cold clouds and regions of low mass star formation, typical peak intensities of = 3–2 CO lines are 10 K km s-1 (e.g. San José-García et al. 2013). This corresponds to 0.5 MJy sr-1 in the 353 GHz band, but dilution by the beam is likely to make the contribution smaller (CO peak values are measured at a resolution of or less). In the most prominent massive star-forming regions, the line intensities can be higher by a factor of ten and CO contributions could be locally significant in the 353 GHz band. At 217 GHz, the line intensities are of similar order but the conversion factors from line intensity to Planck surface brightness is lower by more than a factor of two (Planck Collaboration XIII 2014). However, because the dust signal decreases from 353 GHz to 217 GHz by a factor of 5, CO contamination is more important in the 217 GHz band and, if not taken into account, could bias the estimates downwards.
We do not have direct multitransition CO observations of our fields. One exception is LDN 183 (G6.03+36.73), where the average line ratio (2–1)/(1–0) over the central area is 0.54. A second example is cloud LDN 1642 (G210.90-36.55) which has been observed with the SEST telescope by Russeil et al. (2003). SEST data gives an average ratio of line areas of = 0.61. At a resolution of 4.5, one reaches a value of 0.72 at the location of the column density peak.
Planck data themselves have been used to estimate, with three different methods, the intensity of the first CO transitions. The methods used to derive the CO estimates are described in Planck Collaboration XIII (2014). Planck Type 1 CO maps are calculated based on the differences in the spectral response of bolometer pairs. This makes it possible to estimate the CO emission of the three first rotational transitions separately, although with relatively low signal-to-noise ratios (SN). Type 2 estimates of CO(1-0) and CO(2-1) line intensities result from a multi-channel fitting of the CO emission together with cosmic microwave background (CMB), dust emission, and free-free emission. Because of the use of lower frequency channels, Type 2 maps only have a resolution of 15. Finally, Type 3 maps are calculated assuming fixed CO line ratios over the whole sky, CO(2-1)/CO(1-0)=0.595 an CO(3-2)/CO(1-0)=0.297. This results in maps with the best SN but, of course, no separate information of the line ratios in any given pixel. The reason why we do not make the correction for CO emission directly using Type 1 and Type 2 maps is the low signal-to-noise ratio (SN) of Type 1 maps (at full Planck resolution) and the low spatial resolution of Type 2 maps. The component separations also assume a fixed dust spectrum ( K, ), which may lead to errors in regions that are colder than the average ISM. According to Planck Collaboration XIII (2014), Type 1 maps give at large scales line ratios (2–1)/(1–0)=0.4 and (3–2)/(1–0)=0.2. However, concentrating on CO bright regions, the same paper found average line ratios of 0.595 and 0.297.
Figure 2 shows the line ratios we obtained in our fields for data averaged over the SPIRE coverage. Type 1 data give values 0.51 and 0.25 for the (2–1)/(1–0) and (3–2)/(1–0) ratios. Using Type 2 data (with lower resolution but higher SN) the (2–1)/(1–0) ratio is 0.53. The values are thus in line with the values quoted above for large area averages and, for (2–1)/(1–0), close to the value observed in LDN 183. The values are somewhat lower than in CO bright regions in general (see above Planck Collaboration XIII 2014), which may be related to the fact that our fields are selected based on their low (dust) temperature. In Fig. 2 we have divided each field to two parts according to its median column density (estimated using SPIRE data and a constant value of ). There are no clear differences in the line ratios between the two column density samples. However, Type 1 (3–2)/(1–0) ratio seems to increase in the high column density sample at the highest (1–0) values. A similar but weaker trend might exist in the (2–1)/(1–0) ratios of Type 1 data but is not seen in the Type 2 data.

In this paper we correct the 345 GHz and 217 GHz data for CO contamination using the CO(1–0) emission of the Planck Type 3 CO maps and as a default assuming line ratios (2–1)/(1–0)=0.5 and (3–2)/(1–0)=0.3. The conversion factor between line intensity and its contribution to surface brightness are given in Planck Collaboration XIII (2014). The ratio (3–2)/(1–0)=0.3 is above the average observed ratio (see Fig. 2) but is representative of the ratios at the highest column densities. The correction in the 353 GHz band is typically 0.1 MJy sr-1, at most a few per cent of the total signal. The selected ratio (2–1)/(1–0)=0.5 is consistent with the data in Fig. 2. The CO correction in the 217 GHz band can be more than 10%.
In Planck Collaboration XIII (2014) the Planck Type 3 12CO(1-0) maps were compared with Dame et al. (2001) data of Taurus, Orion, and Polaris. The ratios between the Planck and Dame et al. line intensities were found to be slightly above one, with an average value of 1.085. In case of Type 1 maps, the = 2–1 estimates were compared with ground-based data and with estimates derived from COBE FIRAS, both comparisons showing agreement within 10%. Another comparison of = 2–1 observations is now possible using the large-scale maps of Orion A and B clouds presented in Nishimura et al. (2015). Orion is not representative of our sample (selected based on the low dust temperature of the sources) but this has little effect on the comparison of the CO measurements. Over the area presented in Fig. 1 of Nishimura et al. (2015), the average ratio between the Planck Type 2 CO estimates and the 1.85 m Nobeyama radio telescope data is slightly below one, 0.910.11. The ratio does not show systematic variations as a function of column density or dust temperature, although the value is lower, 0.6, at the location of Ori KL. The mean line value is compatible with the estimated uncertainty of 10% of the intensity calibration of the Nobeyama data. Figure 11 in Nishimura et al. (2015) also shows that, in spite of large column density changes, the spatial variations of the (2-1)/(1-0) line ratio are relatively small. In particular, the ratio remains relatively constant 0.8 over most of Orion B. This suggests that the ratio is affected more by the general radiation field of the region than by the local column density.
The comparison with ground-based data shows that, within an accuracy of 10%, the combination of Planck Type 3 and Type 2 data give adequate predictions of the average contamination by CO = 1–0 and = 2–1 lines (see Planck Collaboration XIII 2014). Type 3 data directly trace the CO emission at 6 resolution. Thus, the main uncertainty in the local CO correction of the 217 GHz band results from possible variations of line ratios. The examples of LDN 183 and LDN 1642 show that even within very dense cold clumps the (2–1)/(1–0) ratio does not necessarily rise much above the mean value of 0.5. This in spite of the fact that for very high column densities the line ratio should tend towards one. Higher line ratios (1) are possible in hot cores where the gas kinetic temperature is affected by local star-formation. In Orion, because of the high-mass stars, the (2–1)/(1–0) ratio is in many places close to one or even above one (see Fig. 11 in Nishimura et al. 2015). Comparison with dust temperature maps (based on Herschel archive SPIRE maps and an assumption of ) shows that the dust temperature of those regions is 20 K or above. At Herschel resolution, only 19 of our fields contain pixels with K. These amount to 3% of the total mapped area. Temperatures K are found mainly in regions of low column densities and some of the high values result from higher uncertainties at low intensities and near map borders. Nevertheless, there can be some denser regions with both strong CO emission and high (2–1)/(1–0) line ratios where our default CO correction would be clearly too small. The intensity and temperature maps (see Appendices) can be consulted to identify regions with potential for such errors.
If CO correction is underestimated, it can affect the derived dust spectral index and, in particular, estimates for variations as a function of wavelength. We examine later the effect of applying CO corrections that are twice the default correction (see Sect. 4.4). This corresponds to an assumption of line ratios (2–1)/(1–0)=1.0 and (3–2)/(1–0)=0.6. These represent a firm upper limit for the average CO contamination. This also is an upper limit for cold clumps where the CO excitation temperature is below 15 K. Larger line ratios are still possible in regions of very intense radiation field. The shaded regions in Fig. 2 illustrate the difference between the two assumptions of line ratios.
The 217 GHz band could also contain a non-negligible amount of free-free emission. To estimate and to subtract this contribution, we used the low frequency foreground component model (available in the Planck Legacy Archive666http://pla.esac.esa.int/pla/aio/planckProducts.html) and its predictions at 217 GHz. The model consists of an estimate for the low frequency spectral index (Healpix maps with NSIDE=256 and angular resolution of 40) and higher resolution estimates of intensity (Healpix maps with NSIDE=2048 and full Planck resolution). These result from component separation where the other components are cosmic microwave background, CO emission, and thermal dust emission (Planck Collaboration XII 2014). The component separation cannot take the local variations of the dust spectral index, dust temperature, relative intensity of synchrotron and free-free components, and the contribution of anomalous microwave emission fully into account. However, it is a useful indication of the level of non-dust contributions and its subtraction should reduce whatever small bias this emission might cause. For our fields, this component ranges from 0.02% to 2.3% of the total signal of the 217 GHz channel. The median value is 0.1% (for averages over the maps).
For the instrumental noise, we use the error estimates included in Planck frequency maps. The accuracy of absolute calibration is estimated to be 10% for the 857 GHz and 545 GHz channels and 2% or better at low frequencies. The error estimates associated with the CO and low frequency corrections were set conservatively to 50% of the correction. For the noise caused by cosmic infrared background (CIB), we use the estimates given by Planck Collaboration XI (2014). All error components were added together in quadrature. At 857 GHz and 545 GHz the error budget is dominated by calibration uncertainties while at 217 GHz the uncertainty of the CO correction is often the largest term. The instrumental noise and CIB fluctuations have significant contribution only at low column densities, in the most diffuse parts of the fields.
The data between 100m and 353 GHz were fitted pixel-by-pixel using modified black body spectra with a fixed spectra index of and the data were colour corrected for this spectrum. For the range of colour temperatures derived from SPIRE observations and for spectral index changes of 0.2, a change in the Planck colour corrections could change the surface brightness values by 1%. Thus, the subsequent analysis is only very weakly dependent on the value of assumed in the colour correction.
The Planck beams are characterised in Planck Collaboration VII (2014). The FWHM of the effective beam is 4.63, 4.84, 4.86, and 5.01 for the 857 GHz, 545 GHz, 353 GHz, and 217 GHz bands, respectively. The beams have some ellipticity that varies across the sky. The ellipticity is particularly large in the 857 GHz band, on average . Our calculations are based on the assumption of symmetric beams. In the zero point determination of Herschel data, Planck 857 GHz maps were convolved to 4.85 assuming Gaussian beams. This convolution does little to mask the effects of beam ellipticity, which thus causes additional noise in the determination of Herschel zero points and becomes part of the estimated statistical error. When Planck data are used in modified blackbody fits, all data are convolved to a resolution of 5.0. We made some calculations at 8.0 resolution, where the effects of beam asymmetries should be small, but did not observe any significant discrepancy with the 5.0 calculations.
The IRIS versions of the IRAS 100 m maps (Miville-Deschênes & Lagache 2005) were convolved from the original resolution of 4.3 to 4.85 (zero point calculations) or 5.0 (other analysis), assuming circular symmetric Gaussian beams. The IRIS data are corrected for the expected contribution of very small grains (VSGs) which raises the 100 m intensity above that of the pure big grain (BG) emission. The corrections were derived with the DustEM dust model (Compiègne et al. 2011) as a function of the BG temperature (see Juvela et al. 2012). It accounts for 10% at the highest temperatures and rises up to 20% for the coldest fields. The uncertainty of this correction is large but mostly within the 15% uncertainty adopted for the 100 m band. The VSG correction mainly decreases the colour temperature estimates and the effect on the spectral index is small.
2.3 Calculation of dust opacity spectral index
The spectral index is determined by fitting observed surface brightness values with a modified blackbody law
| (1) |
The fit involves three free parameters: the spectral index , the colour temperature , the intensity at a reference frequency and is the Planck function. The fit is possible when observations consist of at least three wavelengths. Observations at long wavelengths (beyond m) are needed to constrain the spectral index, while shorter wavelengths (m) are better for determining colour temperature. The equation includes the assumption of optically thin emission.
The interpretation of the estimated dependence requires special care, because errors can produce artificial correlations (Shetty et al. 2009a; Juvela & Ysard 2012a). Even small errors in surface brightness data may lead to significantly higher and lower or vice versa. One must also note that and only characterise the shape of the observed spectrum and will differ from the corresponding intrinsic dust parameters. The colour temperature overestimates the mass-averaged physical dust temperature and the observed spectral index is smaller than the average opacity spectral index of the grains (Shetty et al. 2009b; Malinen et al. 2011; Juvela & Ysard 2012b). These differences are related to a mixture of grain temperatures along the line-of-sight or generally within the beam. These can be caused by temperature gradients inside the clouds (for example, cold clumps with warmer envelopes or embedded hot sources) or to the presence of different grain populations that have different temperatures. Because wavelengths near and shortward of the peak of the emission spectrum are more sensitive to temperature, the recovered parameters will depend on the set of wavelengths used. At 100 m and below, the contribution of stochastically heated VSGs increases and the spectrum cannot be approximated as a modified blackbody due to the broader temperature distribution of VSGs. The PACS 100 m data are therefore not used in this paper.
The least squares fits of Eq. 1 employ the error estimates given in Sections 2.1 and 2.2. The uncertainties were calculated with direct Monte Carlo simulations or with Markov chain Monte Carlo (MCMC) methods. With MCMC one can calculate the full posterior probability distributions of , , and , only using the relative probabilities of the fits performed with different combinations of the parameter values (e.g., Veneziani et al. 2010; Juvela et al. 2013). The calculation results in a chain of parameter values and we use their median as the final parameter estimates. In selected fits, the zero point uncertainties were included as part of the error estimates (combined as additional statistical error) or their influence was examined separately as a systematic error affecting each field individually.
3 Results
We use different combinations of observational data to seek evidence for spectral index variations between the fields and between regions characterised by different temperature and column density. We utilise some internally consistent data sets (e.g., a single instrument) and compare the qualitative and quantitative results obtained with different and even independent data sets (e.g., Herschel data vs. Planck and IRAS data). We start by using Eq. 1 to fit Planck data in combination with IRAS 100 m band. Next we fit Herschel observations of the three SPIRE bands, 250 m, 350 m, and 500 m. We continue with four bands, adding the PACS 160 m band to SPIRE data. We finish by using a combination of Herschel and Planck data. In these fits, dust temperature is determined mainly by Herschel observations, Planck providing further constraints on the spectral index, albeit at a lower spatial resolution. The different cases are listed in Table 1. The table lists the adopted relative errors to which other sources of uncertainty (CO, CIB, and low frequency model subtraction) are added.
| Section | Data | Resolution | Error estimates |
|---|---|---|---|
| 3.1 | IRIS 100 m, Planck 857-217 GHz | 5.0 | 15%, 10%, 10%, 2%, 2% |
| 3.2 | Herschel 250, 350, 500 m | 37 or 1 | 2% + zero point uncertainties, which have mean values of |
| 0.39, 0.17, and 0.07 MJy sr-1 for the three bands | |||
| 3.3 | Herschel 160, 250, 350, 500 m | 37 or 1 | 10%, 2%, 2%, 2% + a zero point uncertainty, which |
| for the 160 m band is assumed to be 1 MJy sr-1 | |||
| 3.5 | Herschel 250-500 m and | Herschel 3.5%, | |
| Planck 857-353 GHz | Planck 10% (857-545 GHz) and 2% (353-217 GHz) |

3.1 Results from Planck and IRIS data
We use IRIS 100m and Planck data in the 857 GHz, 545 GHz, 353 GHz, and 217 GHz bands to estimate colour temperatures and spectral indices at scales of 5.0 and larger. Unlike in the case of Herschel data, we need to include the short wavelength IRIS band to constrain dust temperature. This is expected to be more sensitive to warm dust and may include contribution from stochastically heated small dust grains. These effects have been discussed extensively in the literature (e.g. Shetty et al. 2009b; Malinen et al. 2011; Juvela & Ysard 2012b). Radiative transfer models of Appendix A suggest that the inclusion of the 100 m band does not make the determination much more sensitive to line-of-sight temperature mixing. For a cloud with mag, the combination of IRIS and the three Planck channels led to values that were up to 0.07 units lower than for the combination of SPIRE and the same Planck bands, the total bias being 0.10 units.
We start by calculating one SED per field. In each field, we average surface brightness with a Gaussian beam with FWHM=10.0, located at the centre of the Herschel SPIRE coverage. Because the Herschel maps are typically 30–40 in diameter, the values are representative of most of the field and especially of the higher column density regions usually found at its centre. SEDs were fitted with modified blackbody functions and the results are shown in Fig. 3. This figure includes estimates calculated with and without the 217 GHz band. The error bars have been estimated with Monte Carlo simulations, using the surface brightness uncertainties listed in Sect. 2.2.
When the lowest frequency is extended from 353 GHz to 217 GHz, the mean spectral index is lower. The average change is = -0.10 and the mean temperature is higher by = 0.52 K. The IRIS 100 m data have been corrected for the expected VSG emission (see Sect. 2.2). The inclusion of the VSG correction decreases temperatures by -0.5 K and increases spectral index values by . With the 217 GHz band included, the reduced values (normalised by the number of degrees of freedom) are many times higher. Although the number depends on the relative error estimates of the bands, this already strongly suggests that a single modified black body curve does not provide a good fit over the full wavelength range.
The horizontal black bars show values derived with IRIS and Planck bands down to 353 GHz band, using surface brightness measurements averaged over a beam with FWHM=30. Compared to the 10 values (blue points), the temperatures are higher and spectral index values lower when estimated from the lower resolution data. This difference is expected because our fields are selected for the presence of cold dust and, therefore, typically have larger than average column densities. The emission properties are thus clearly different already between the scales of 10 and 30. In Planck Collaboration XXIII (2011), the temperatures observed towards individual Planck cold clumps were even lower (the distribution peaking below 14 K) and the spectral index values were higher, . However, that analysis concerned individual clumps (sizes below 10) and only the cold emission component that was obtained by subtracting an estimate of the extended warm background emission.
Figure 4 shows the correlations between colour temperature and spectral index for the 10 beams, for values calculated without the 217 GHz band. The median values over all fields are = 15.88 K and = 1.85.
The distribution of (, ) points in Fig. 4 shows some negative correlation between and that cannot be entirely explained by measurement errors. The errors scatter (, ) points along a direction that has a steeper negative slope than the overall parameter distribution. In the surface brightness errors, with the possible exception of the 353 GHz and 217 GHz bands, the main component is the uncertainty of the absolute calibration. The band-to-band errors should be smaller, because calibration errors are likely to be correlated between the fields. To illustrate the potential importance of this point, we recalculated the error regions using 50% smaller uncertainties for the surface brightness measurements (thick contours in Fig. 4).
In the figure, we overplot the relation derived from PRONAOS observations of cold submillimetre clumps (Dupac et al. 2003) and the corresponding relation from Désert et al. (2008). Both relations cross the distribution of our data points.

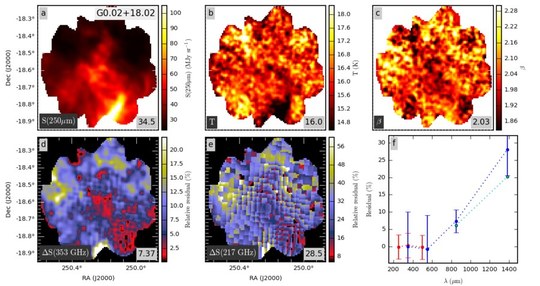
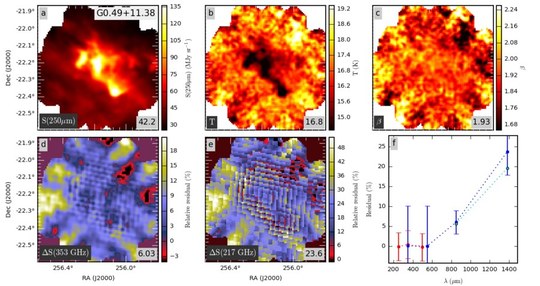
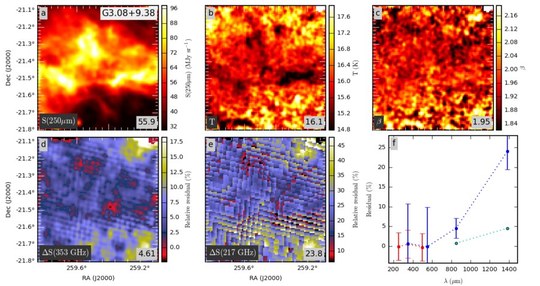
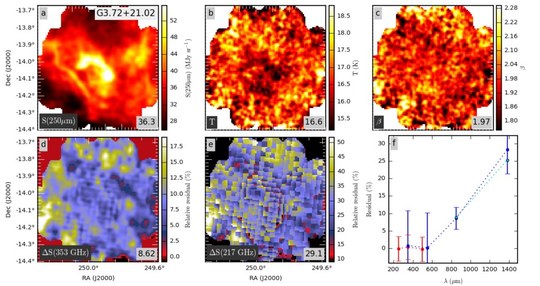
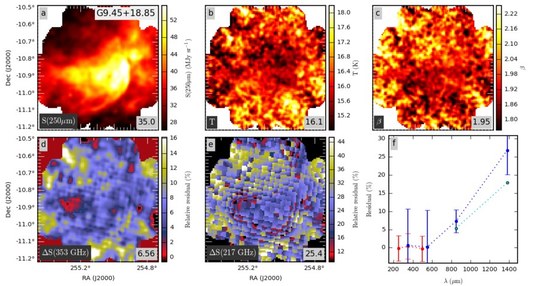
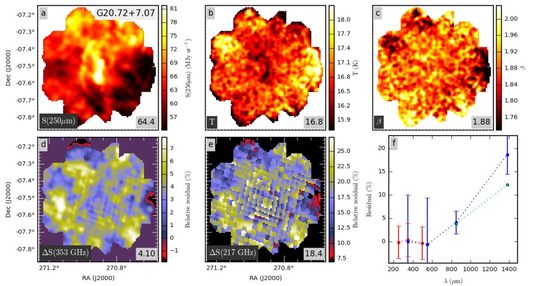
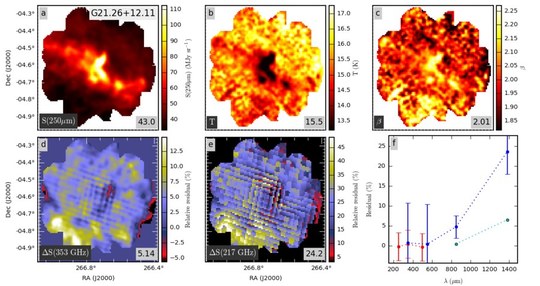
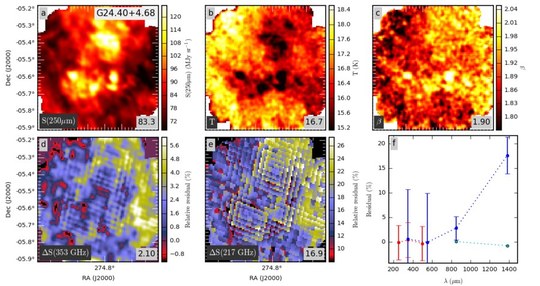
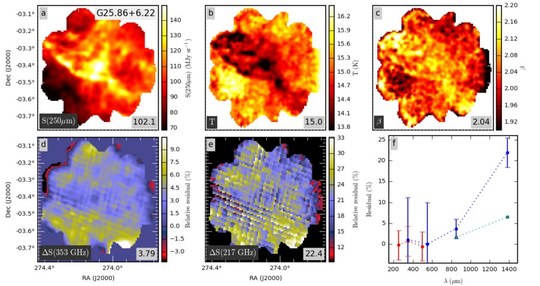
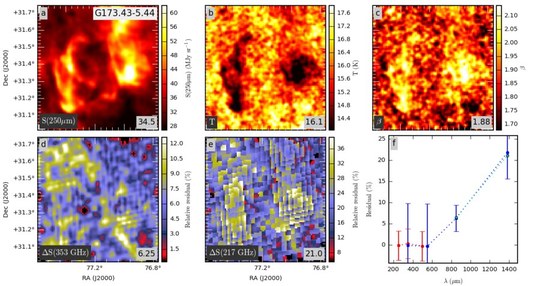
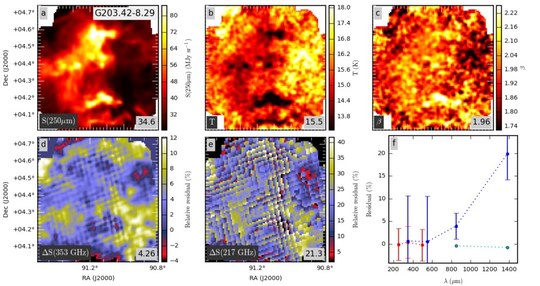
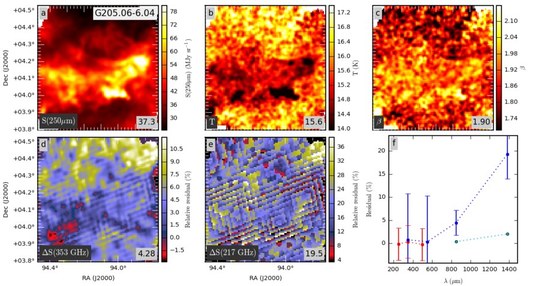
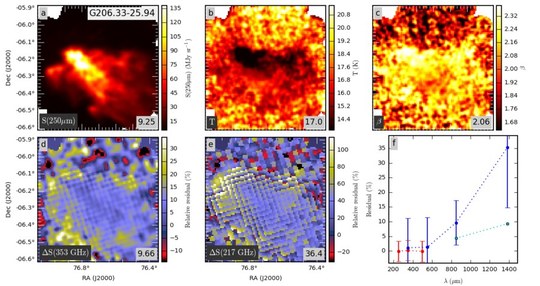
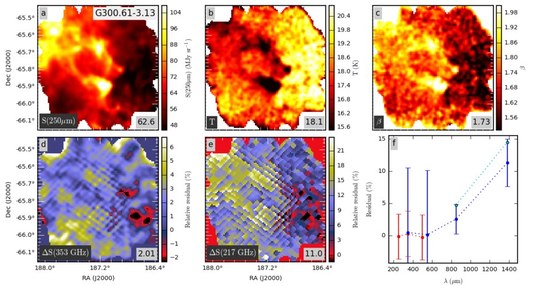
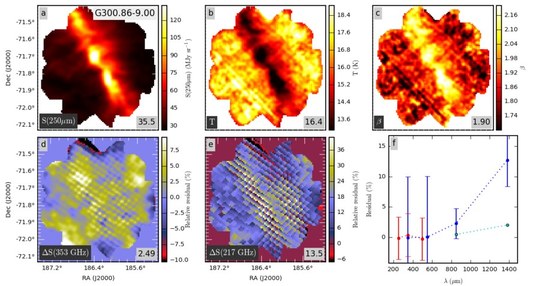
Figure 5 shows an example of the fits performed pixel-by-pixel using the IRAS 100 m and Planck 857 GHz, 545 GHz, and 353 GHz data. The field is G300.86-9.00, part of the Musca filament. In frame , the spectral index is seen to increase towards the filament and especially towards the two dense clumps. The change is from 1.75 in the background to a peak value of = 2.03 in both clumps. In Fig. 5, frame shows the residuals between Planck 217 GHz data and the fit, and frame shows the difference between the spectral indices estimated in frequency intervals 3000 GHz–353 GHz and 3000 GHz–217 GHz. These show that the spectrum is flatter at the longest wavelengths. In relative terms (frame ), the change of spectral index as a function of wavelength appears to be larger in the diffuse medium. However, line-of-sight temperature variations tend to decrease the fitted value of , thus reducing the 217 GHz excess. This may partly explain the spatial pattern in frame .
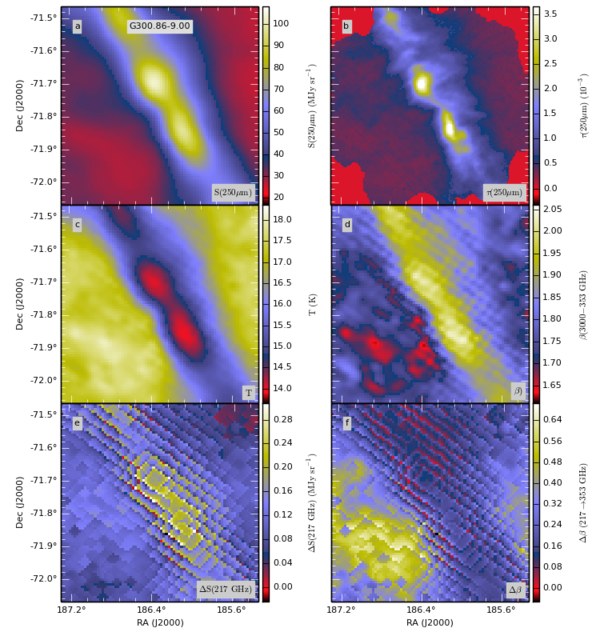
Figure 6 shows correlations between and . These are calculated pixel-by-pixel, using IRIS and Planck maps ( GHz) at 5 resolution. The figure shows a distribution similar to that of Fig. 4. This suggests that spatial averaging from 5 to 10 scales has not significantly affected the appearance of Fig. 4. In the second frame of Fig. 6 we use only pixels with estimated column densities in the fourth quartile (25% of pixels with the highest column densities). To select the pixels, we use column densities that are calculated with the same four frequencies but employing a fixed value of the spectral index, = 1.8. Figure 6 shows that the distribution is similarly elongated at high column densities but has shifted towards lower temperatures and higher values of spectral index. The median values are K and for all pixels and K and for pixels with column density in the fourth quartile.

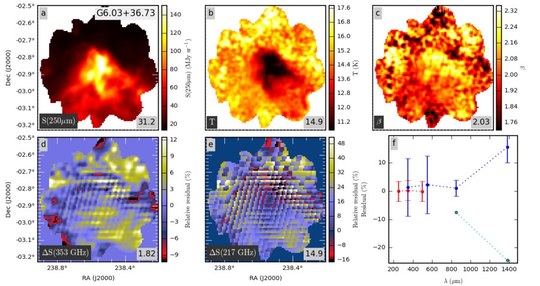
Appendix B shows the (, ) fits for all 116 fields. A 217 GHz excess (i.e. a flattening of the dust SED at long wavelengths) is present in most fields. In some fields (e.g. G202.23-3.38 and G253.71+1.93 the situation is less clear and the residuals are at least partly negative. There are an additional two fields where, like in G300.86-9.00, the 217 GHz excess is positive but anti-correlated with column density. Field G82.65-2.00 contains a long filament that is visible as a region of lower and smaller 217 GHz excess. In the densest parts of the filament the excess is approximately zero. In G6.03+36.73 (LDN 183), the high column density clump is also associated with a low 217 GHz excess and slightly lower . In these fields, the temperature variations in the densest clumps may lower the apparent value of the spectral index so much that the long-wavelength excess disappears. We return to the question of the long wavelength excess in Sect. 4.4, in particular regarding the uncertainty of the CO correction.
In a few fields, the 217 GHz residuals show a local excess that may be caused by free-free emission from HII regions (e.g., G92.63-10.43, G107.20+5.52). These are relatively easy to separate from the extended emission where the absolute 217 GHz excess follows the column density structure. The extended free-free emission should already be accounted for by the subtraction of the low frequency model (see Sect. 2.2).
3.2 General results based on SPIRE data
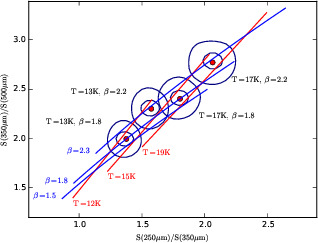
To gain access to smaller spatial scales, we must turn to Herschel data. The observations extend only to 500 m, making them less efficient in constraining the spectral index. We start by examining the colour temperature and spectral index values determined with SPIRE data only. As shown in Fig. 7, the parameters and are strongly degenerate, i.e., the colour variations caused by temperature and spectral index changes follow almost parallel lines. To measure variations with these bands, the surface brightness data must have an accuracy of almost 1%. Nevertheless, we analyse these data in an attempt to obtain results that are mostly independent from the previous IRAS and Planck fits. This is particularly relevant because IRAS 100 m data have been used by most studies where a negative correlation between colour temperature and spectral index has been reported (for example Dupac et al. 2003; Désert et al. 2008; Planck Collaboration XI 2014). Our only dependence on IRAS is in the 250 m band where the zero point and gain correction depend on interpolation between IRAS 100 m and Planck 857 GHz bands. Even there the weight of IRAS data is relatively small, thanks to the large distance in wavelength.
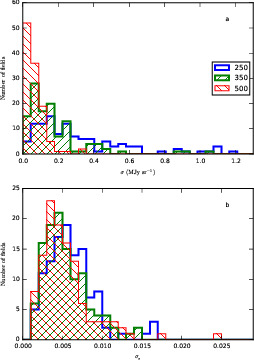
The relative calibration of SPIRE channels is estimated to be better than
2%777SPIRE Observer’s manual,
http://herschel.esac.esa.int/Documentation.shtml. However, when the gain calibration
was adjusted using Planck and IRIS data, the formal uncertainties were smaller.
The main concern is the accuracy of the zero point correction (see
Sect. 2.1), which has a large impact at low column densities. The
distributions of the estimated statistical errors of the intensity zero points are shown
in Fig. 8. The median values are 0.24, 0.13, and
0.05 MJy sr-1 at 250 m, 350 m, and 500 m, respectively. For a
surface brightness of 10 MJy sr-1 the statistical errors are thus only at the
level of 1%.
Frame b shows the distribution of relative errors calculated using the median
surface brightness of each field. For the lowest column densities, the relative errors
can be larger by a factor of a few.
If the zero point errors are correlated between the SPIRE bands, the dispersion of
the derived and values would be smaller.
In other words, SPIRE data should be accurate enough to see definite trends, although
the absolute values may be affected by systematic errors.
Because the offset and slope of the linear fits (Herschel vs reference data)
are anticorrelated and the zero point and calibration errors are added in squares, the
total estimated uncertainty of SPIRE measurements may be overestimated. The effect becomes
negligible outside the faintest regions ( above
20 MJy sr-1) where the errors are dominated by the multiplicative
component.
To study the general behaviour of colour temperature and spectral index values and to examine the effect of gain and zero point uncertainties, we examined pixel samples that were selected in each field using a uniform criterion on surface brightness. It was already known that the highest column densities are associated with the lowest colour temperatures (estimates based on a fixed value of ). We selected pixels where the 350 m surface brightness was within 10% of a selected surface brightness level . The use of 250 m surface brightness would result in a very similar selection because the ratio between 250 m and 350 m surface brightness changes only by 13% in the temperature range 152 K (assuming a fixed spectral index). For a temperature of 15 K and , the ratio is 1.6. In each field, we then calculated the average surface brightness values of the selected pixels in the three SPIRE bands, and used this restricted set of measurements to estimate and . The motivation for this approach is that when surface brightness is averaged over a large number of pixels, the statistical uncertainty becomes very small. The errors are then dominated by calibration and zero point errors, and potentially by other systematic errors that affect entire maps (or parts of them).


Figure 9 shows the results as a function of potential errors in the 250 m data. The diffuse medium with 10 MJy sr-1 (red band) shows higher temperatures and lower spectral index values than the denser regions with 100 MJy sr-1 (blue band). The temperature difference of K corresponds to of about . The temperature difference of K corresponds to of about . The left panels of Figure 9 show that errors in the gain calibration would affect the absolute values of and , but would leave the difference between the two pixel samples almost unchanged. The right panels, by contrast, show that zero point errors at a level of 0.2 MJy sr-1 would have little effect on the 100 MJy sr-1 sample, but a much larger impact on the 10 MJy sr-1 sample. Nevertheless, the difference between the two pixel samples disappears only if we assume that most fields are affected by a systematic error of 0.6 MJy sr-1. This would be larger than the typical estimated statistical uncertainties.
The situation changes somewhat if we consider similar uncertainties in the 350 m band (Fig. 10). The multiplicative errors (left panel) again have little importance but the results are sensitive to zero point errors. A shift of MJy sr-1 is enough to make values equal in the two samples. A larger offset would result in the low surface brightness pixels having larger values than the high surface brightness pixels. If statistical errors of the zero points were +0.2 MJy sr-1, the scatter of values should be twice as large as what is actually observed. For example, for the 100 MJy sr-1 sample alone, the apparent values would be expected to range between 1.7 and 2.3 (1 range; see Fig. 10). If the errors are statistical and without significant bias, Fig. 10 still suggests that is positively correlated with column density. However, to be confident of this general conclusion, systematic zero point errors would need to be constrained to a level of 0.1 MJy sr-1.
We can derive alternative and estimates where the zero point errors are completely independent of those in Fig. 10. This is possible by subtracting the local background. We use the reference regions defined in Table 1 of Juvela et al. (2012). The results are shown in Fig. 11. The selected 350 m surface brightness levels are the same as above, 10 MJy sr-1 and 100 MJy sr-1. Because these are now background subtracted values, they correspond to somewhat higher values of absolute surface brightness, the actual difference depending on the field. Nevertheless, the results are remarkably similar to Fig. 10. The difference between the 100 MJy sr-1 and 10 MJy sr-1 samples is K and . As before, if the 350 m data contained a systematic error of -0.2 MJy sr-1, the data would be consistent with no spectral index variations correlated with surface brightness (or temperature). However, this would require the same systematic error in most fields. While the zero point correction with Planck and IRIS data could contain some bias, a similar systematic error is more difficult to understand in the case of local background subtraction that is carried out independently in each field.

In summary, the SPIRE data gives some indication of spectral index variations, with higher values being found towards regions of higher column density and lower temperature. The results are made more plausible by the consistency between the independent analyses conducted using absolute and relative zero points. Because SPIRE bands cover a relatively narrow range of wavelength, data must have very high precision for the absolute values of and to be measured. SPIRE channels may not be enough for accurate determination of the absolute values of and . Nevertheless, the above experiments show that these data have very low systematic errors and, therefore, should provide reliable results when combined with data at other wavelengths.
3.3 General results from Herschel 160 m–500 m data
The inclusion of PACS 160 m data helps to constrain the colour temperature and should therefore also yield more accurate estimates of spectral index variations. This advantage is diminished by (1) the smaller size of the PACS maps, (2) the uncertainty of the relative calibration between PACS and SPIRE, (3) a possible bias resulting from the greater sensitivity to the warmest dust along the line-of-sight (Shetty et al. 2009b; Malinen et al. 2011; Juvela & Ysard 2012b; Pagani et al. 2015), and (4) a larger uncertainty in the determination of the zero point. The last point results from the smaller size of the maps, and from the lower signal-to-noise ratio at shorter wavelengths for cold dust emission. Points (3) and (4), together with the contribution of VSGs, are the reason why we refrain from using the 100 m PACS data in our analysis.
We continue to use a 2% uncertainty for the gain calibration in the SPIRE bands
(band-to-band accuracy) and a 10% uncertainty for the 160 m
measurements888https://nhscsci.ipac.caltech.edu
/sc/index.php/Pacs/AbsoluteCalibration, the latter number also covering the uncertainty
in the relative calibration of instruments.
In spite of its problems, the inclusion of 160 m data results in smaller formal uncertainties of dust temperature, especially when estimated using a constant value of . Thus, in the following we compare data sets that are selected based on dust temperature or dust column density instead of using surface brightness thresholds (as in Sect. 3.2). We start by looking for global trends in in relation to dust temperature. We selected in each field all pixels where the colour temperature was within 20% of K or 18 K, based on the fits made with a fixed value of . Fields that did not contain at least 20 pixels in both categories were excluded.
Figure 12 shows the median values of and and their sensitivity to surface brightness errors. As seen for the SPIRE data alone, the values are higher for the cold pixel sample, although the field-to-field scatter is comparable to this difference. Before the 160 m zero points were adjusted using the AKARI comparison, the mean value of the warm pixels was actually the average of the cold pixels. This illustrates the sensitivity of our analysis to zero point errors, at least for pixels with low brightness (i.e. at the 10 MJy sr-1 level). If we use local background subtraction, the situation remains essentially the same, with the cold pixels now showing values that have typically increased by . Because of the smaller size of the 160 m maps, we cannot use the previous reference areas. Therefore, the background was determined by selecting pixels with surface brightness between the 1% and 20% percentiles, and calculating the average over the subset of those pixels that is common to all four bands.

Systematically higher values are seen also in regions of higher optical depth. In Fig. 13, we compare pixels within 20% of the values and . The optical depths were derived with a fixed value of and are thus not affected by the noise-induced anti-correlation between and that could lead to some artificial correlations. Pixels in the higher optical depth interval have units higher values. The figure shows the results obtained with local background subtraction. Using the estimated absolute zero points of surface brightness, the results are similar, the difference of values being 0.08 instead of 0.10.
Thus, systematic changes in are seen for pixels selected based on either temperature or optical depth. Part of the systematic effects may be masked by the field-by-field variations of the local radiation field. Also, the strongest changes may be limited in small regions within each field. Therefore, we need to investigate the variations also directly on maps.

3.4 Herschel and maps
The temperature and spectral index maps of all 116 fields are shown in Appendix C. These were calculated with a basic MCMC method (Juvela et al. 2013) using either 160–500 m data (four bands) or only data with 250–500 m (three bands). The error estimates are based on the assumption of 2 % and 10 % relative uncertainty for the SPIRE and PACS channels, respectively. These estimates (converted pixel-by-pixel to absolute uncertainties of the surface brightness) and the estimated absolute uncertainties of the surface brightness zero points were added together in quadrature. The PACS error estimate covers the uncertainty of the relative calibration of the two instruments.
The appearance of the and maps and the dispersion between neighbouring pixels gives some impression of the purely statistical noise but they are not useful for estimating systematic effects that zero point errors may cause. In the worst case, a zero point error can even change the sign of the – correlation. We calculated 100 realisations, varying the surface brightness zero points within their estimated uncertainties, each calculation resulting in different and maps. The realisations were sorted according to the average values of . The maps correspond to the 16% and 84% percentiles of the distribution ( and ) were plotted and can be used to indicate how sensitive the morphology of the and maps is to zero point errors. The and maps are estimated through minimisation. Because of the a priori constraint on and , the level of the corresponding MCMC maps can be slightly different.
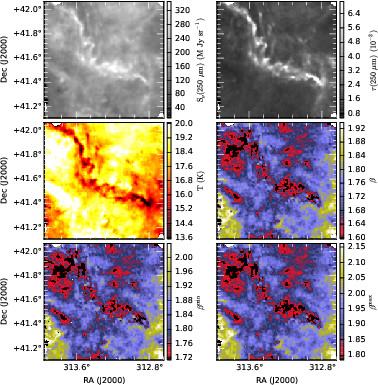
The maps derived from SPIRE data are shown in Appendix C and two examples are included below (Figs. 14 and 15). An anti-correlation between and is seen in most fields. There are some twenty fields for which the variation is not clearly visible above random fluctuations or map artefacts. In a few cases (e.g. G110.89-2.78 and G163.82-8.44), the observed large-scale anti-correlation is no longer significant when the zero point uncertainties are taken into account. Nevertheless, an anti-correlation is detected in nearly 90% of the fields, showing the ubiquity of this behaviour. However, in a given field, the effect can be restricted to a small area or even a single core.
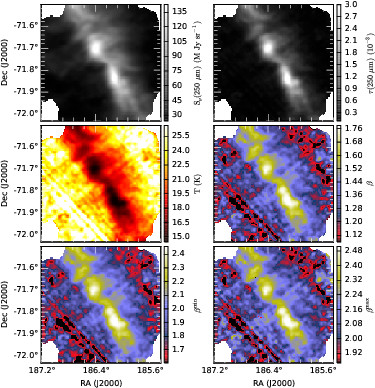
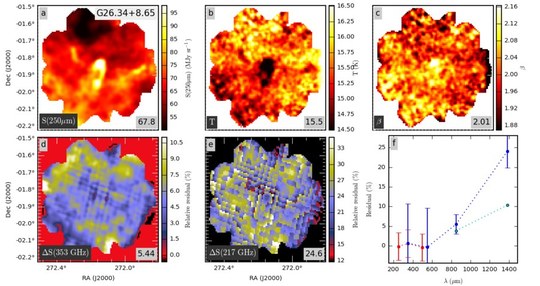
There are a few fields where the data show some positive correlations between and , mainly in small regions near strong point sources (e.g. in fields G343.64-2.31 and G345.39-3.97). In G82.65-2.00, which is shown in Fig. 15, the correlation between and is also partly positive, this being associated with a cold filament that runs diagonally across the field. At smaller scales, at the level of individual clumps, the parameters are still preferentially anti-correlated. In Sect. 4.5, we argue that a positive correlation could in some cases be explained by radiative transfer effects that occur when the clouds have high optical depth for the radiation heating the dust.
When PACS 160 m data are included, the results on the – correlations are qualitatively similar although the values often differ. The four-wavelength fits have lower formal error estimates but are affected by the larger uncertainty of the relative calibration of the two instruments and the different methods used in the zero point correction of PACS and SPIRE data. The median values over all fields, calculated over PACS coverage, are K and for the 250–500 m fits and K and for the 160–500 m fits. In the latter case, part of the higher temperature may be attributed to the fact that shorter wavelengths are more sensitive to line-of-sight temperature variations and especially to the warmest regions. However, considering the other sources of uncertainty, this cannot be concluded to be necessarily the main source of the differences. Based on the models shown in Appendix A, the inclusion of the 160 m band could be expected to lead to changes 0.2 K and -0.04 (in case of the mag model and compared to 250–500 m data).
3.5 Combined analysis of Herschel and Planck data
A final set of and maps was calculated using Herschel 250–500 m data and the four Planck bands between 857 GHz to 217 GHz. The goal is to derive the most reliable estimates of , using the high resolution Herschel observations while at the same time making use of Planck data to constrain at large scales. The Herschel data are kept at the resolution (see Sect. 2.1). The 160 m maps are not used, mainly because of their smaller size. The resulting maps of and are shown in Appendix D.
In these calculations the observed data could be used at their original resolution but we continued to use Planck maps convolved to a resolution. The 217 GHz data are used at the original 5.01 resolution, the pixel sampling being visible in the result maps. The Planck and IRIS data were colour corrected (see Sect. 3.1) but the colour corrections were not updated during the fitting because their effect on surface brightness values is very small. Furthermore, if the spectral index is not constant over the full wavelength range, it is not clear that the joint fit would result in a better description of the SED shape over a given band.
The model is defined on 28 pixels and it consists of one intensity, colour temperature, and spectral index value per pixel. The values that are minimised consist of two components. For Herschel bands, the model is compared to the 250–500 m data directly, treating each pixel as an independent measurement. The second component of the value results from the comparison with Planck data, requiring the convolution of the model predictions to the 5.0 resolution. This makes the calculations computationally demanding, partly because of the convolution operation itself but mainly because of the correlations that the convolution operation introduces between model pixels. Nevertheless, the procedure enables us to seek a solution at Herschel resolution that is still constrained by the Planck data on larger scales.
The total probability of a model is a combination of the probabilities of fits to three Herschel and four Planck bands. Considering that each Herschel map has been rescaled using the same Planck and IRIS data, we adopt for SPIRE channels an error estimate of 3.5%. This is a compromise between the original 2% band-to-band uncertainty and the 7% uncertainty of the absolute calibration. The zero point uncertainties are added to these numbers in quadrature (see Sect. 3.4). For the Planck data, we keep the 10% error estimates for the 857 GHz and 545 GHz channels and 2% at lower frequencies. The 353 GHz and 217 GHz error estimates were further increased with an amount corresponding to 50% of the CO correction. Because of this, the relative error estimates are often largest in the 217 GHz band.
Because Herschel has many independent measurements over the area covered by a single Planck beam, weighting according to the above listed error estimates gives Herschel a large weight compared to Planck. However, at large scales the systematic errors should be smaller for Planck because the data are taken from continuous all-sky maps. Herschel maps can suffer from minor gradients (e.g. due to map-making) that cannot be recognised because of the small size of the maps. Therefore, we increased the relative weight of Planck data in the calculation by an ad hoc factor of three. This is not a critical issue because the actual fit only provides a convenient point of reference, the detailed information being contained in the fit residuals.
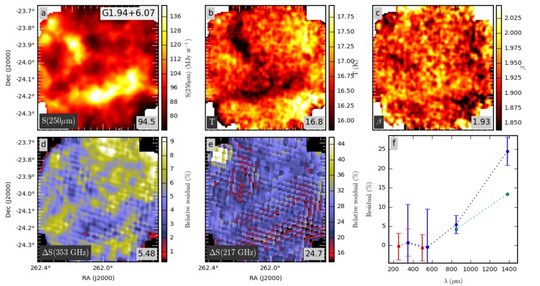
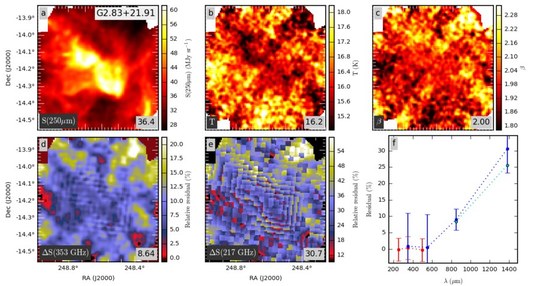
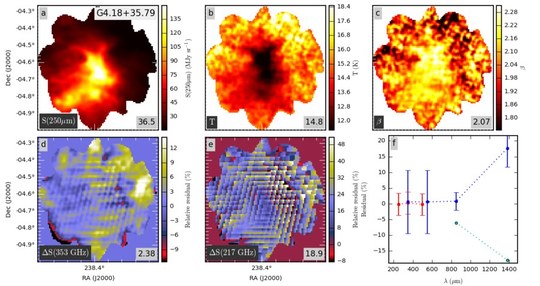
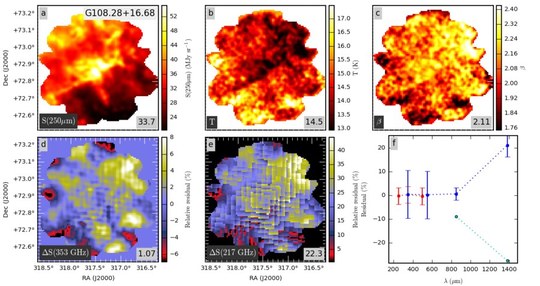
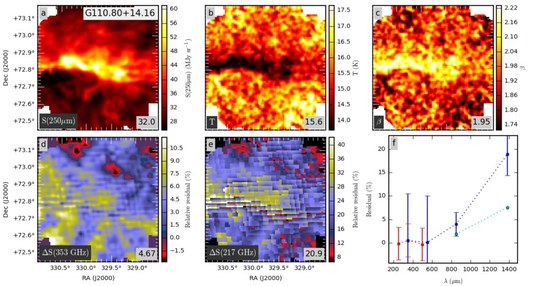
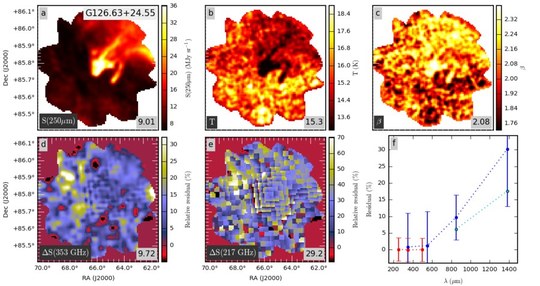
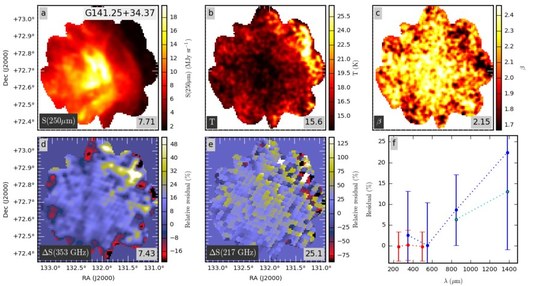
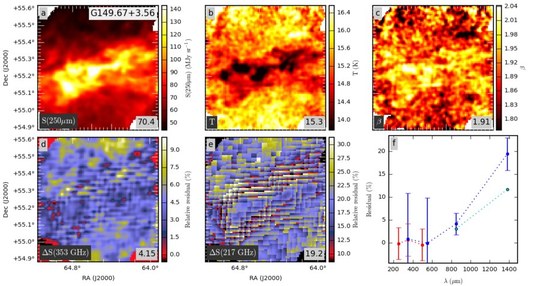
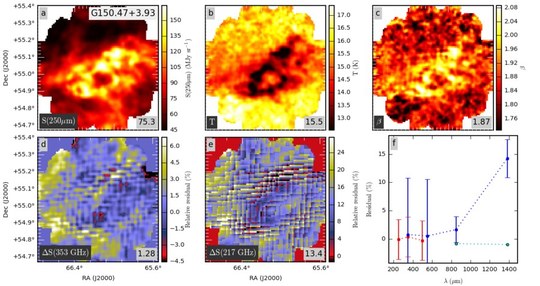
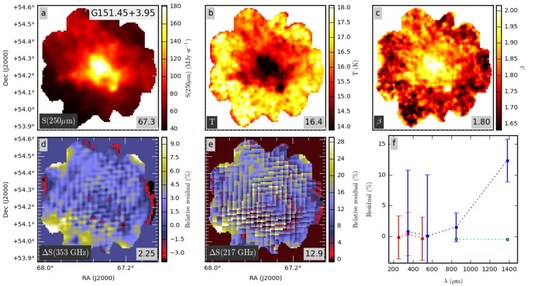
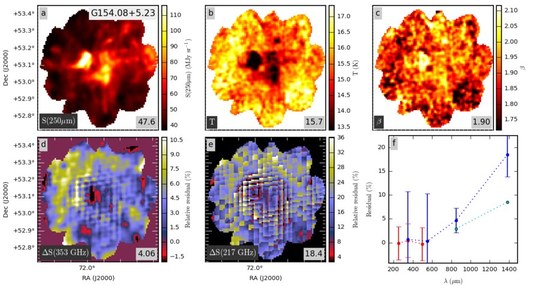
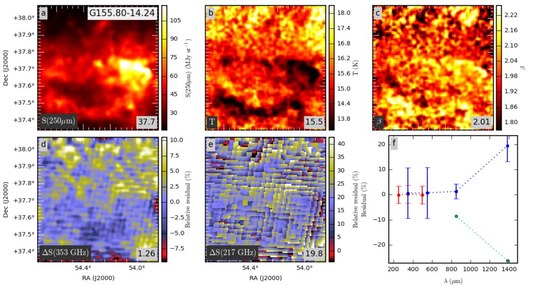
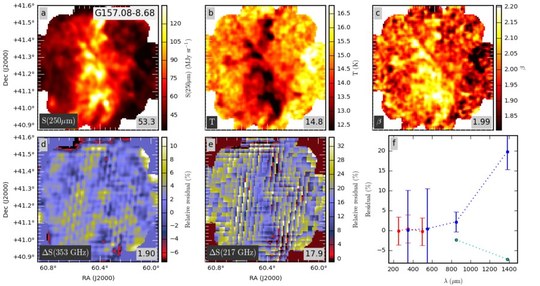
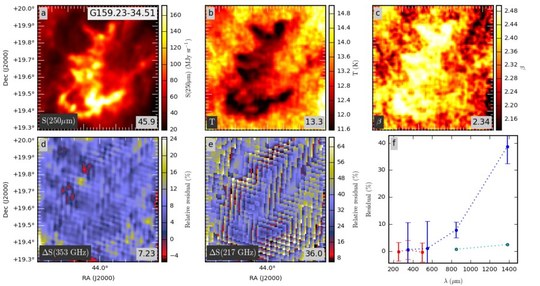
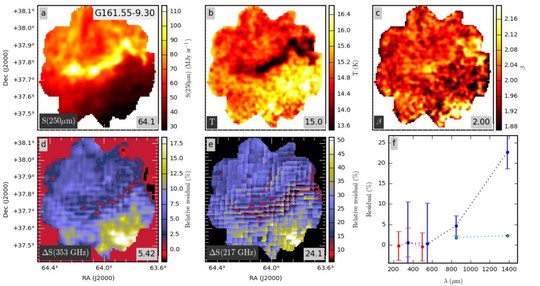
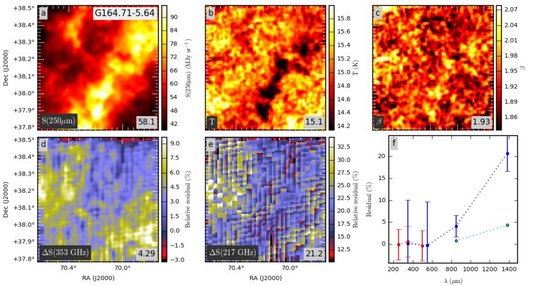
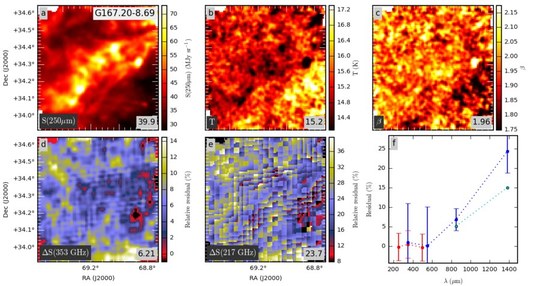
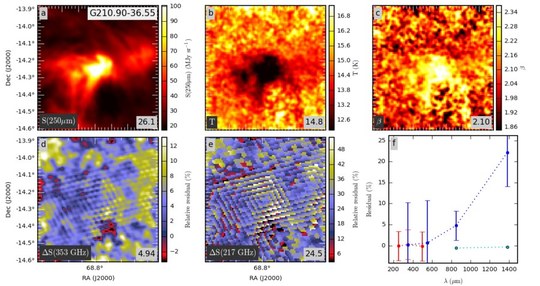
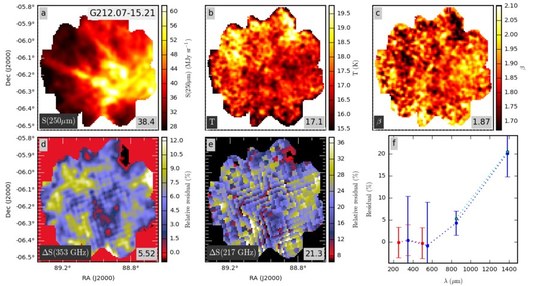
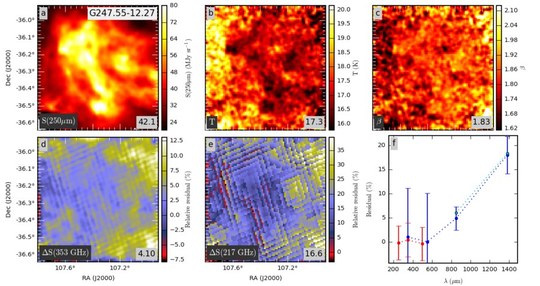
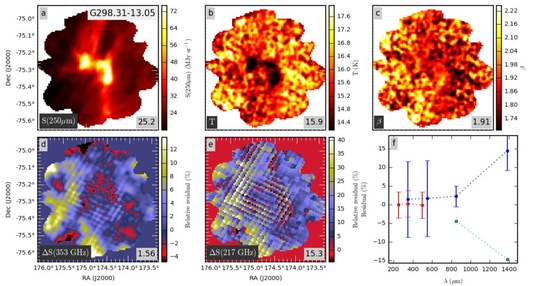
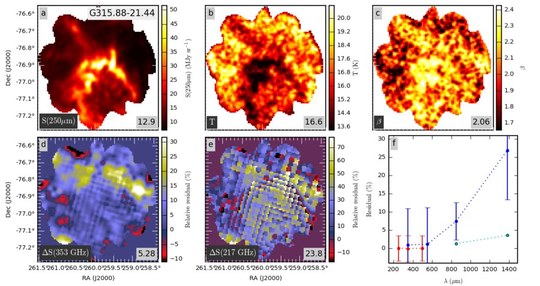
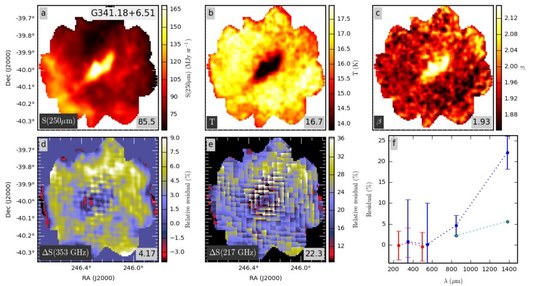
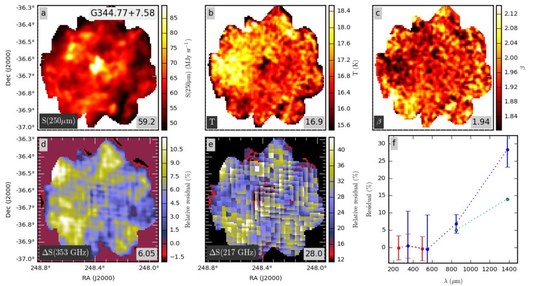
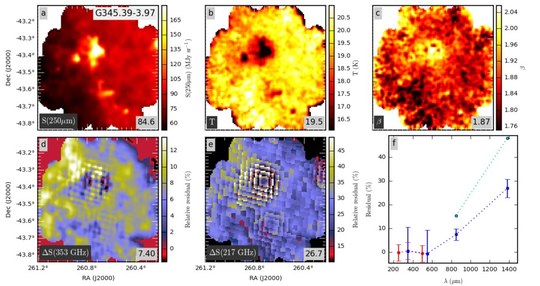
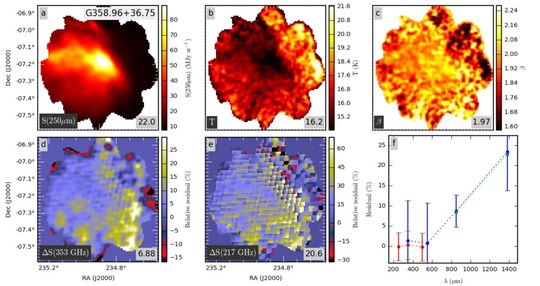
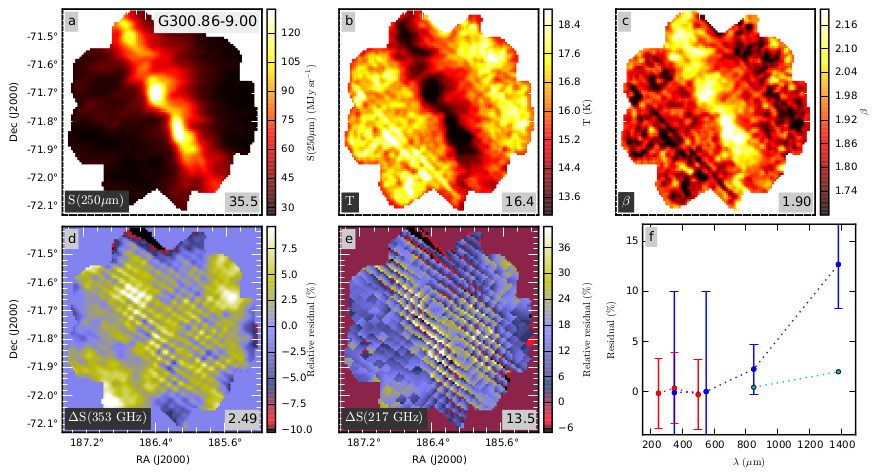
The calculated and maps are shown in Appendix D. One example is shown in Fig. 16. The and maps (frames and ) are relatively similar to the earlier Herschel fits, again showing clear anti-correlation between the parameters. The area in Fig. 16 is 80 times the solid angle of a 5 Gaussian. Thus, considering the potential effects of noise, the maps still contain a large number of independent samples. Frame shows the median residuals for the seven bands used in the fits. The residuals are small in all Herschel bands, indicating that these still carry most weight in the overall fit. The fit is also relatively good in the Planck 857 GHz–545 GHz bands, the wavelength range that is common with SPIRE. Although Planck shows systematically slightly higher surface brightness values, the residuals are at a level of one per cent and do not show a strong pattern that would be directly related to the column density structure. However, in the 353 GHz band (850 m) and especially in the 217 GHz band (1380 m) the residuals are clearly positive (see frames and ). In this case, a single modified blackbody that fits 250 m-550 m data is not a good description of millimetre emission. The lower curve corresponds to the larger CO correction that is twice the default correction (i.e., assumes line ratios (2-1)/(1-0)=1.0 and (3-2)/(1-0)=0.6, in units of K km/s). In the field G300.86-9.00, this would be sufficient to make residuals consistent with zero. However, over the area covered by SPIRE maps, Planck Type 2 CO maps indicate a line ratio of 0.4 (a least squares fit gives a slope of 0.39 and the direct ratio of the two maps gives 0.44 for the average of all pixels and 0.41 for the brightest pixels in the fourth quartile of ). The ratio is thus lower than the assumed default ratio of 0.5. This suggests that the true residuals might be even slightly larger than indicated by the upper curve of Fig. 16f.
| Data | (K) | |
|---|---|---|
| IRIS + Planck, FWHM=30 | 16.92(1.36) | 1.71(0.10) |
| IRIS + Planck, no 217 GHz | 16.03(1.31) | 1.84(0.11) |
| IRIS + Planck, with 217GHz | 16.43(1.59) | 1.75(0.13) |
| SPIRE | 14.89(1.25) | 2.04(0.16) |
| SPIRE + 160m | 17.46(2.09) | 1.68(0.15) |
| SPIRE + Planck, with 217 GHz | 14.93(1.16) | 2.03(0.12) |
4 Discussion
4.1 The main results and their robustness
Table 2 summarises some of the main conclusions of our analysis: (i) values within the fields are larger than the average value at larger scales (see Fig. 3), (ii) the values are smaller when the fits are extended to 217 GHz, and (iii) the inclusion of PACS 160 m data results in higher values than an analysis using the SPIRE bands only. The first two facts are likely to reflect real physical changes, such that high density regions exhibit with steeper emission spectra. On the other hand, the difference between the SPIRE and SPIRE+160 m results may indicate the presence of small systematic errors.
Figure 3 showed that there is a clear difference between the 10 and 30 scales. Because the larger beam also covers diffuse regions around our target clouds, this already suggests that is correlated with column density. More direct evidence of dependence between dust temperature, column density, and spectral index is provided by the maps presented in Appendices B-D. In Fig. 3, values were units lower when the 217 GHz band was included in the fits, the exact value depending on the relative weight given to the different bands. In Sect. 3.5 and Appendix D, the 217 GHz residuals are seen to be clearly positive with only a few exceptions. The wavelength dependence of is examined further in Sect. 4.4.
The and maps were estimated with Planck data (Appendix B), with Herschel data (Appendix C) data, and with joint fits of both Planck and Herschel data (Appendix D). The anti-correlation between and cannot be the result of pure statistical noise because that would not result in spatially correlated variations in the maps. The only possible explanation would be some kind of a systematic error that affects both Planck and Herschel data in a similar fashion. This is technically possible because the SPIRE data were scaled and zero-point corrected using IRIS and Planck data. However, in Sect. 3, we showed that zero point errors are important only at low column densities. Furthermore, the SPIRE-only results remained essentially the same when we used local background subtraction instead of absolute zero points. We also demonstrated that gain calibration errors are not able to significantly affect the relation, not even when the data consists of SPIRE bands only (Sect. 3.2). The Herschel results were relatively similar to our previous analysis where the SPIRE gain calibration was not tied to Planck. The final possible error source are mapping errors that could produce artificial anti-correlation (e.g. Juvela et al. 2013). Mapping artefacts are difficult to detect in surface brightness data even when their effect on and estimates should be easily recognisable. The maps in Appendix C are thus a good indicator of this kind of errors. Artefacts would appear as spatial features that are different between the 160-500 m and 250-500 m fits (especially regarding artefacts in PACS data) and/or uncorrelated with surface brightness. As an example, one can look at the data on the field LDN 134 (G4.18+35.79) in Appendix C. There are clear features that are following changes in column density and are similar in the two band combinations. However, the map also exhibits a north-south gradient that is correlated with neither the column density nor the morphology of the map. This suggests that the PACS map suffers from a surface brightness gradient (possibly caused by the strong emission that extends over the southern map boundary and thus complicates map-making). Smaller scale artefacts are clear, for example, in the south corner of the and maps of the field G126.63+23.55. However, in most cases the two band combinations give comparable results, especially for compact structures, and the observed changes are well correlated with column density variations. This remains true even in the case of both G4.18+35.79 and G126.63+23.55. We therefore conclude that anti-correlation is a common physical phenomenon, which we robustly detect in most of our fields.
Regarding the change of at wavelengths longer than 500 m, the result could be affected mainly by errors in the correction for CO emission. However, even in the joint fits of Herschel and Planck data, the 217 GHz excess is, after the removal of the expected CO contamination, typically more than 20% of the total signal. This is large compared to the expected CO contamination and is thus very unlikely to be caused by inaccuracy of the CO correction. Furthermore, the excess is detected clearly also in diffuse regions where the relative importance of the CO correction should be smaller.

4.2 and correlations between fields
In Fig. 17-19 we examine the colour temperature and spectral index values calculated using the average surface brightness of each field. Fig. 17 shows the (, ) relations derived with (1) IRIS and Planck, (2) SPIRE, and (3) SPIRE and Planck. The 217 GHz Planck band was omitted from these fits. The error bars include statistical and calibration errors, including at 353 GHz the error associated with the CO correction. For the SPIRE channels we used an error estimate of 7%. All three frames show some degree of - anti-correlation but there are also differences. For example, the joint fit of Planck and Herschel data results in a wider temperature distribution. When Herschel data are used, the error bars strongly overestimate the scatter. This is particularly clear in the middle frame. Thus, Fig. 17 shows that the procedure for the re-scaling of Herschel data (including the zero points) has been fairly accurate. This also partly justifies the lower 3.5% relative uncertainty used for SPIRE channels in Sect. 3.5.
Figure 18 shows similar plots using pixels in given temperature intervals. The pixel selection is based on and values calculated with SPIRE data and a constant value of . Therefore, the selection is not directly affected by the - anti-correlation (whether physical or noise-produced). In Fig. 18, the three temperature intervals are clearly separated but each forming a narrow distribution that extends over a wide range of values. The overall dispersion might be caused by noise but also by the fact that for a given colour temperature interval actually contains different values. When was allowed to vary freely, some points have moved to higher temperature, especially from the lowest K bin. The fact that the orientation of these elongated clouds of points is not the same as that of the general - anti-correlation does not directly indicate which of the two effects is stronger, i.e., to what extent the anti-correlation is caused by noise. However, the comparison of the median values of the three temperature samples shows the anti-correlation, even when the samples were selected based on temperatures calculated with a fixed value .
Figure 19 compares values calculated for three column density intervals. The (, ) distributions of the three optical depth intervals overlap but the median increases with column density. The vs. slope also becomes flatter with increasing for all three combinations of surface brightness data. Because the x-axis values have been calculated with a fixed value of , the noise-induced anti-correlation should be reduced. However, higher values usually correspond to higher signal-to-noise ratios and the flattening could be partly a noise effect. In the case of SPIRE data (middle frame), all relations are steeper, this also being possibly a noise effect. The values are not quite systematically higher for the higher column densities, although the lowest column density sample does correspond to the highest temperatures and the lowest values of . While Fig. 13 used the average surface brightness of all pixels within a given optical depth range, Fig. 19 examines each field separately. This increases the risk that result become affected by local artefacts (e.g, near map boundaries). Depending on the range of column densities within a map, each plotted symbol may correspond to a very different number of individual map pixels.


Spatial averaging of surface brightness data should increase the bias caused by the mixing of spectra with different colour temperatures. Figure 20 compares and estimates derived from IRIS and Planck surface brightness maps at a resolution of 5 and 10. The data were further divided to low and high column density parts using column densities calculated using a fixed value . As a third alternative, we averaged the surface brightness of all pixels above and below the median column density, thus calculating two and values per field. This last alternative is expected to maximise the bias and should lead to smaller values of the spectral index. The two column density samples are displaced relative to each other, the high column density pixels extending towards lower temperatures and higher values of the spectral index. However, the differences between the 5 and 10 resolution data are very small. In particular, there is no systematic shift in values. This suggests that the effects of temperature mixing are not very pronounced at scales above 5, up to scales approaching the size of individual fields.

4.3 Correlation with Galactic location
Figure 21 shows (, ) values for fields in different distance intervals. The fields with low and high values are more likely to be located within 500 pc. For individual clumps a dependence on distance could be explained by beam dilution but Fig. 21 is concerned with the average surface brightness of entire fields. Nevertheless, in our sample the nearby fields are more likely to contain a single cold clump that dominates the field-averaged parameters. Thus, the dependence between and distance is likely to be mainly a selection effect.
Figure 22 shows the correlation with Galactic latitude. The scatter is again large but high latitude clouds are preferentially associated with higher values. The origin of this correlation is partly the same as in Fig. 21, high latitude clouds also being nearby. However, compared to the case of different optical depth intervals (Fig. 19), the median temperature is less latitude-dependent.


In Fig. 23, the dust parameters are plotted against Galactic longitude and latitude, the figure showing a general drop of towards low latitudes. In addition to values averaged over each field, and are indicated for pixels . Above the lowest latitudes, these are above the average column density and have higher values of . The median values are 1.81 and 1.88 for all the pixels and for the pixels, respectively. The difference disappears below , because the average optical depth rises to and above . The latitude dependence can indicate a change in dust properties. However, at low latitudes local star-formation and the long lines-of-sight may increase temperature variations within the beam, thus decreasing the apparent values of .
There is no clear dependence on Galactic longitude, although the values for are marginally above the average. We do not see the strong systematic increase of towards the inner Galaxy that was found in Planck Collaboration XI (2014). Partly this is because that effect is strongest in the Galactic plane, whereas all our fields are at latitudes and, furthermore, within all are above . Secondly, most of our fields are dominated by emission from within one kiloparsec, too near to probe physical variations related to, e.g., the Galactic molecular ring.


4.4 Wavelength dependence of
In the fits performed with the combination of Herschel and Planck data, the 353 GHz and 217 GHz data consistently show an excess relative to the modified blackbody that describes the emission at wavelengths below 500 m. In Fig. 5 the relative excess was larger in diffuse than in the dense medium. This remains true for the joint fit shown in Fig. 16. As mentioned in Sect. 3.1, this could be related to line-of-sight temperature variations that decrease the apparent FIR spectral index of dense regions. However, the quantification of these effects would require detailed modelling of the individual sources.
We examined the wavelength dependence of using average surface brightness values towards the centre of each field. As in Fig. 3, the mean surface brightness is calculated with a Gaussian beam with FWHM equal to 10. Figure 24 shows the single component fits for two data combinations. These consist of Planck data with GHz and with either IRIS 100 m band or the three SPIRE bands. For the latter combination, the scatter is larger but the median value of is in both cases 1.8–1.9. Alternative fits were performed using two values, one below and one above = 700 m. This model thus consists of one intensity parameter, one colour temperature value, and two spectral index values that are here named and . The model is required to be continuous at 700 m. The Planck 217 GHz band is included in these fits. In Fig. 24, the two component fits show a clear difference between the FIR part (m) and the millimetre part (217 GHz–353 GHz, 850–1400 m). In the millimetre part the values are = 1.6–1.7 for both data combinations. At shorter wavelengths, the median values are significantly higher, = 1.96 for IRIS+Planck and = 2.11 for SPIRE+Planck.

Figure 25 shows the SEDs that are estimated from surface brightness values averaged over a 10 beam towards each of the fields. The values are further averaged either over all fields, over fields with column density below or above the median column density, or over fields with colour temperature below or above the median colour temperature. The selection of the fields is based on values ( and ) derived from the analysis of IRIS and Planck data ( GHz) but all bands are included in the fits shown in Fig. 25. As above, the fits employ a single dust temperature but two spectral index values. The derived parameter values are given in the figure. For signal averaged over all fields, the spectral index values are = 1.91 and = 1.66. Compared to a fit with a single value (17.0 K and ), the reduced value is smaller by a factor of three. When fields are divided according to column density, higher column density fields are associated with slightly lower dust temperature, = K. The values of are practically identical for the two column density intervals but is 0.07 units lower for the lower column density sample.
When the fields are divided based on their colour temperature, differences in the spectral index are more noticeable. The average signal of cold fields has that is higher by 0.1. The data are averaged over beams and, for both samples, over almost 60 fields. Thus the noise should be very small although the results can be affected by systematic errors if these cause scatter between the and estimates of individual fields. The zero point errors are one such possible error source although, by concentrating on high column density central areas, their effect should be limited. Compared to , the parameter should be more insensitive to errors but it also shows a clear difference, being 0.12 unit higher for the cold field sample. This is not necessarily very significant, considering the limited wavelength range. On the other hand, the 217 GHz point is in every case several above the spectrum extrapolated with .
The CO correction is one of the main uncertainties regarding the magnitude of the 217 GHz excess. Our default correction assumed a line ratio (2–1)/(1–0) = 0.5, which is consistent with the average line ratio obtained from Planck Type 1 CO maps (see Fig. 2). In reality the line ratio is not spatially constant and could be higher in individual clumps. To examine the possible consequences, we repeated part of the analysis using CO corrections that were twice as large as the default one. This corresponds to line ratios (2–1)/(1–0) = 1.0 and (3–2)/(1–0) = 0.6. According to Fig. 2, this is a very conservative estimate of the average (2–1)/(1–0) ratio and also exceeds the largest observed values of the (3–2)/(2–1) ratio.
If the CO correction is doubled, the 217 GHz residuals of Fig. 25 remain positive relative to the extrapolated FIR component with . The excess is 1 sigma for the whole sample, more for the low column density sample and close to zero for the high column density sample. In Fig. 25 the comparison also is affected by spatial averaging that (via temperature mixing) tends to decrease the value of . We therefore also repeated the analysis of Sect. 3.5 (spatial resolution at 217 GHz) using the larger CO correction. Figure 26 shows the resulting and estimates and the 217 GHz excess (observed surface brightness in relation to the fitted modified blackbody with a single- value). The values of again are higher in regions of higher column density. The difference is larger in case of the larger CO correction. There also is a clear effect on and values. The larger correction leads to almost 0.1 units higher median value of . The CO correction directly reduces the 217 GHz surface brightness attributed to dust emission and thus leads to smaller relative 217 GHz excess. The excess is smaller within the high column sample, in spite of the higher values in these regions. The observed surface brightness exceeds the fitted modified blackbody curve in 75% of the fields. Taking into account that the larger CO correction very likely overestimates the average CO contamination, Fig. 26 strongly suggests that the 217 GHz excess is real and ¿

Although the apparent values of are higher, they are expected to be decreased by line-of-sight variations, which are significant in such high column density regions (see Sect. 4.5). This suggests that the intrinsic dust properties may have an even stronger wavelength dependence. Also, in the two component fit the exact values of depend on the pivot wavelength. If this is decreased, the results remain qualitatively similar but values of decrease and values of increase. For the = 700 m490 m the difference between and decreases by more than half. Detailed characterisation of the wavelength dependence, including the behaviour at smaller spatial scales, is left for future papers.

4.5 Effects of temperature variations
The observed depends on the range of dust temperatures within the beam. The observed value will be below the intrinsic opacity spectral index of the dust grains, the difference increasing with increasing temperature dispersion (Malinen et al. 2011; Ysard et al. 2012). In our sample, we have objects with two types of temperature gradients: externally heated clumps and cores heated internally by young stellar objects (YSOs). We examined the effect of YSOs using the catalogue of submillimetre clumps in Montillaud et al. (2015, in press). The clumps are classified based on WISE photometric data and submillimetre dust temperature either as protostellar (with YSO candidates) or starless. For a large fraction of the clumps the classification remains undetermined (see Montillaud et al. 2015, in press, for details). In the area covered by both PACS and SPIRE instruments, there are 204 protostar candidates, 1156 starless clumps, and 1968 unclassified sources. The distributions of the corresponding (, ) values of the clumps are shown in Fig. 27 where the spectral indices are those derived from 160–500 m data at a spatial resolution of 60.
There is significant overlap between the three clump categories and the modes of the distributions do actually coincide. However, starless clumps are found preferentially at lower and higher values while the distribution of protostellar clumps extends to higher temperatures. The median values of are 1.82 and 1.71 for the starless and the protostellar clumps, respectively. If the YSOs heat a volume large enough to be significant at long wavelengths (and at the 60 resolution) the difference could be an indication either of dust processing (e.g., evaporation of ice mantles or dynamical processing caused by outflows) or of a direct temperature effect on the grain material (Meny et al. 2007). However, the observed differences may partly reflect the increased temperature variations that are caused by the YSOs, without any difference in the intrinsic of the dust grains (see Shetty et al. 2009b; Malinen et al. 2011; Juvela et al. 2011; Juvela & Ysard 2012b).
If the temperature dispersion was caused mainly by varying degrees of internal heating, it could result in the kind of anti-correlation as seen in Fig. 27. However this is unlikely because the effect of the (mostly weak) protostellar sources is highly localised and, furthermore, the anti-correlation is more pronounced for the starless clumps. A complementary question is whether depends on the grain size distribution. Grains are known to grow inside dark clouds and their growth is revealed via various phenomena, most notably the coreshine effect (Steinacker et al. 2010; Pagani et al. 2010; Steinacker et al. 2014; Lefèvre et al. 2014). A variation of due to the grain growth would result in a segregation of the coreshine cases in the plot (such as Figs. 4 and 27). Paladini et al. (in prep.) show that this is not the case and no preferential region appears in their relation. This gives a clue that the value might not be related to the size of the grains, or more probably that variations in the dust composition and size, as well as temperature changes along the line-of-sight do not allow us to see clear trends. Moreover, for starless cores with the highest values of , coreshine should trace grain growth deep inside the cores while the relationship is not representative of the coldest region (Pagani et al. 2015). For embedded sources, only a full multiwavelength 3D modelling, including grain property and temperature variations, can help to remove the degeneracy.
In the case of externally heated clumps, the temperature variations again result in the observed spectral index values being lower than the intrinsic opacity spectral index of the dust grains. However, unlike in the case of internal sources, the temperature variations are likely to favour a positive correlation between and (Malinen et al. 2011). The precise effect depends on the strength of the temperature gradients (Juvela & Ysard 2012b).
We show in Appendix A results from radiative transfer modelling of optically thick filaments. These suggest that once the visual extinction exceeds mag, the observed can be more than = below the intrinsic value of the dust grains. The effect is well correlated with the drop of temperature. When the opacity is increased close to mag, the difference between the observed and intrinsic values could be . However, such large decreases in values are not seen in our sample of fields. For example, the main clump of G206.33-25.94 has an estimated optical depth of = 0.0047 (derived with = 1.8 and 160–500 m data at 1 resolution). Assuming the average NIR-submillimetre opacity ratio of derived in Juvela et al. (2015), this corresponds to and roughly 10 mag of visual extinction. The clump is not associated with any dip in the map and the absolute values of are high, at least (depending on the data set used). In field G150.47+3.93 the peak optical depth is , which corresponds to mag. Values of are still increasing towards the column density peak.
Some drop in is observed only towards the centre of G6.03+36.73 (LDN 183) where the estimated optical depth is (for and a resolution of 37) suggesting mag. In this source, the estimated submm dust emissivity is higher than average (see Juvela et al. 2015), but for such high opacities the column density derived from dust emission is still likely to be underestimated. Based partly on MIR absorption, the estimated maximum extinction exceeds mag, although only in an area with less than 1 in size (Pagani et al. 2003, 2015). At the resolution of 60, the observed values drop from in the surrounding regions down to = 1.60 in the central core, the values being measured using 160–500 m data at a resolution of 1. The drop is much less than would be expected based on the simple models of Appendix A.
In Appendix A, we also tested cases where the dust in the central part of the filament is associated with higher submillimetre opacity. This leads to lower central temperature and thus to larger temperature gradients. As a result, the observed value of is further decreased towards the centre of the model cloud. This can happen even when the intrinsic is actually higher in the centre.
Compared to the models, the observations do not show such a strong drop of . This could be understood if the clouds had a very clumpy structure (smaller temperature gradients), the highest column density peaks remained unresolved, or the increase of the intrinsic values is very large and/or extends clearly outside the coldest part of the cores. Finally, the filament model may not be a particularly good description of isolated clumps (such as LDN 183) and this may lead overestimation of the line-of-sight temperature gradients. Further analysis of variations would require detailed modelling of all the individual clumps.
5 Conclusions
We have used Herschel and Planck observations of dust emission to examine the dust opacity spectral index in a number of fields containing dense clumps. The fields, typically in size, were originally selected based on the signature of cold dust emission but they also cover some more diffuse areas with higher dust temperatures. Our goal was to measure the variations of the spectral index and to look for correlations with environmental factors. We have presented maps of and derived with different combinations of Herschel, IRAS, and Planck data. The study led to the following conclusions:
-
•
The observed dust opacity spectral index shows clear spatial variations that are anti-correlated with temperature and correlated with column density. Based on IRAS and Planck observations the median values of field averages are K and . Using Herschel data, we find in many individual cold clumps values up to ().
-
•
The millimetre emission exhibits a clear excess relative to the modified blackbody fits that describe the submillimetre data. Two component fits to the surface brightness data averaged over all fields yield values = 1.91 and = 1.66. As expected for a sample of high column density fields, is much higher than values reported for diffuse medium. On the other hand, is close to the values found in Planck studies of diffuse regions at high Galactic latitudes.
-
•
The amount of CO emission in the Planck bands is one of the main sources of uncertainty for the values. The issue could be resolved by directly mapping the CO(2-1) emission with ground-based radio telescopes.
-
•
The spectral index values are lower close to the Galactic plane, possibly because of the increased mixing of dust at different temperatures. We do not observe any significant dependence on Galactic longitude.
-
•
We have examined how estimates are affected by various error sources and the data sets used. We conclude that our results on variations are robust concerning the detected local spatial variations (vs. dust temperature and column density) and the variations as a function of wavelength.
-
•
Because temperature gradients in optically thick sources lead us to underestimate the intrinsic , the true variations of the spectral index and hence of the dust properties may be even more pronounced. Quantitative estimates of intrinsic will require detailed radiative transfer modelling of the observations.
Acknowledgements.
This research made use of Montage, funded by the National Aeronautics and Space Administration’s Earth Science Technology Office, Computational Technologies Project, under Cooperative Agreement Number NCC5-626 between NASA and the California Institute of Technology. The code is maintained by the NASA/IPAC Infrared Science Archive. MJ, VMP, and JMa acknowledge the support of the Academy of Finland Grant No. 250741. MJ acknowledges the Observatoire Midi-Pyrenees (OMP) in Toulouse for its support for a 2 months stay at IRAP in the frame of the ‘OMP visitor programme 2014’. AH acknowledges support from the Centre National d’Etudes Spatiales (CNES) and funding from the Deutsche Forschungsgemeinschaft (DFG) via grants SCHI 536/5-1 and SCHI 536/7-1 as part of the priority program SPP 1573 ‘ISM-SPP: Physics of the Interstellar Medium’. AR-I acknowledges support from the ESA Research Fellowship Programme.References
- Agladze et al. (1996) Agladze, N. I., Sievers, A. J., Jones, S. A., Burlitch, J. M., & Beckwith, S. V. W. 1996, ApJ, 462, 1026
- André et al. (2010) André, P., Men’shchikov, A., Bontemps, S., et al. 2010, A&A, 518, L102
- Barnard (1919) Barnard, E. E. 1919, ApJ, 49, 1
- Barnard et al. (1927) Barnard, E. E., Frost, E. B., & Calvert, M. R. 1927, A photographic atlas of selected regions of the Milky way, Carnegie institution of Washington
- Bernes (1977) Bernes, C. 1977, A&AS, 29, 65
- Bohren & Huffman (1998) Bohren, C. F. & Huffman, D. R. 1998, Absorption and Scattering of Light by Small Particles, Wiley
- Boudet et al. (2005) Boudet, N., Mutschke, H., Nayral, C., et al. 2005, ApJ, 633, 272
- Clemens & Barvainis (1988) Clemens, D. P. & Barvainis, R. 1988, ApJS, 68, 257
- Compiègne et al. (2011) Compiègne, M., Verstraete, L., Jones, A., et al. 2011, A&A, 525, A103+
- Coupeaud et al. (2011) Coupeaud, A., Demyk, K., Meny, C., et al. 2011, A&A, 535, A124
- Dame et al. (2001) Dame, T. M., Hartmann, D., & Thaddeus, P. 2001, ApJ, 547, 792
- Désert et al. (2008) Désert, F., Macías-Pérez, J. F., Mayet, F., et al. 2008, A&A, 481, 411
- Doi et al. (2015) Doi, Y., Takita, S., Ootsubo, T., et al. 2015, PASJ, 67, 50
- Dupac et al. (2003) Dupac, X., Bernard, J., Boudet, N., et al. 2003, A&A, 404, L11
- Dutra & Bica (2002) Dutra, C. M. & Bica, E. 2002, A&A, 383, 631
- Etxaluze et al. (2011) Etxaluze, M., Smith, H. A., Tolls, V., Stark, A. A., & González-Alfonso, E. 2011, AJ, 142, 134
- Feitzinger & Stuewe (1984) Feitzinger, J. V. & Stuewe, J. A. 1984, A&AS, 58, 365
- Galliano et al. (2011) Galliano, F., Hony, S., Bernard, J.-P., et al. 2011, A&A, 536, A88
- Gordon et al. (2010) Gordon, K. D., Galliano, F., Hony, S., et al. 2010, A&A, 518, L89
- Griffin et al. (2010) Griffin, M. J., Abergel, A., Abreu, A., et al. 2010, A&A, 518, L3
- Griffin et al. (2013) Griffin, M. J., North, C. E., Schulz, B., et al. 2013, MNRAS, 434, 992
- Hartley et al. (1986) Hartley, M., Tritton, S. B., Manchester, R. N., Smith, R. M., & Goss, W. M. 1986, A&AS, 63, 27
- Hauser et al. (1998) Hauser, M. G., Arendt, R. G., Kelsall, T., et al. 1998, ApJ, 508, 25
- Jones et al. (2013) Jones, A. P., Fanciullo, L., Köhler, M., et al. 2013, A&A, 558, A62
- Juvela et al. (2013) Juvela, M., Montillaud, J., Ysard, N., & Lunttila, T. 2013, A&A, 556, A63
- Juvela et al. (2015) Juvela, M., Ristorcelli, I., Marshall, D. J., et al. 2015, in press, ArXiv-1501.07092
- Juvela et al. (2010) Juvela, M., Ristorcelli, I., Montier, L. A., et al. 2010, A&A, 518, L93
- Juvela et al. (2012) Juvela, M., Ristorcelli, I., Pagani, L., et al. 2012, A&A, 541, A12
- Juvela et al. (2011) Juvela, M., Ristorcelli, I., Pelkonen, V.-M., et al. 2011, A&A, 527, A111+
- Juvela & Ysard (2012a) Juvela, M. & Ysard, N. 2012a, A&A, 541, A33
- Juvela & Ysard (2012b) Juvela, M. & Ysard, N. 2012b, A&A, 539, A71
- Köhler et al. (2012) Köhler, M., Stepnik, B., Jones, A. P., et al. 2012, A&A, 548, A61
- Lefèvre et al. (2014) Lefèvre, C., Pagani, L., Juvela, M., et al. 2014, A&A, 572, A20
- Lynds (1962) Lynds, B. T. 1962, ApJS, 7, 1
- Magnani et al. (1985) Magnani, L., Blitz, L., & Mundy, L. 1985, ApJ, 295, 402
- Malinen et al. (2011) Malinen, J., Juvela, M., Collins, D. C., Lunttila, T., & Padoan, P. 2011, A&A, 530, A101+
- Malinen et al. (2014) Malinen, J., Juvela, M., Zahorecz, S., et al. 2014, A&A, 563, A125
- Mathis et al. (1983) Mathis, J. S., Mezger, P. G., & Panagia, N. 1983, A&A, 128, 212
- Matsuura et al. (2011) Matsuura, S., Shirahata, M., Kawada, M., et al. 2011, ApJ, 737, 2
- Mennella et al. (1998) Mennella, V., Brucato, J. R., Colangeli, L., et al. 1998, ApJ, 496, 1058
- Meny et al. (2007) Meny, C., Gromov, V., Boudet, N., et al. 2007, A&A, 468, 171
- Miville-Deschênes & Lagache (2005) Miville-Deschênes, M.-A. & Lagache, G. 2005, ApJS, 157, 302
- Molinari et al. (2010) Molinari, S., Swinyard, B., Bally, J., et al. 2010, A&A, 518, L100
- Montillaud et al. (2015, in press) Montillaud, J., Juvela, M., Ristorcelli, I., & et al. 2015, in press
- Motte et al. (2010) Motte, F., Zavagno, A., Bontemps, S., et al. 2010, A&A, 518, L77
- Myers et al. (1983) Myers, P. C., Linke, R. A., & Benson, P. J. 1983, ApJ, 264, 517
- Nishimura et al. (2015) Nishimura, A., Tokuda, K., Kimura, K., et al. 2015, ApJS, 216, 18
- Ossenkopf & Henning (1994) Ossenkopf, V. & Henning, T. 1994, A&A, 291, 943
- Pagani et al. (2003) Pagani, L., Lagache, G., Bacmann, A., et al. 2003, A&A, 406, L59
- Pagani et al. (2015) Pagani, L., Lefèvre, C., Juvela, M., Pelkonen, V.-M., & Schuller, F. 2015, A&A, 574, L5
- Pagani et al. (2010) Pagani, L., Steinacker, J., Bacmann, A., Stutz, A., & Henning, T. 2010, Science, 329, 1622
- Paradis et al. (2011) Paradis, D., Bernard, J.-P., Mény, C., & Gromov, V. 2011, A&A, 534, A118
- Paradis et al. (2014) Paradis, D., Mény, C., Noriega-Crespo, A., et al. 2014, A&A, 572, A37
- Paradis et al. (2012) Paradis, D., Paladini, R., Noriega-Crespo, A., et al. 2012, A&A, 537, A113
- Paradis et al. (2010) Paradis, D., Veneziani, M., Noriega-Crespo, A., et al. 2010, A&A, 520, L8
- Pilbratt et al. (2010) Pilbratt, G. L., Riedinger, J. R., Passvogel, T., et al. 2010, A&A, 518, L1
- Planck Collaboration et al. (2011) Planck Collaboration, Ade, P. A. R., Aghanim, N., et al. 2011, A&A, 536, A22
- Planck Collaboration XVII (2011) Planck Collaboration XVII. 2011, A&A, 536, A17
- Planck Collaboration XIX (2011) Planck Collaboration XIX. 2011, A&A, 536, A19
- Planck Collaboration XXII (2011) Planck Collaboration XXII. 2011, A&A, 536, A22
- Planck Collaboration XXIII (2011) Planck Collaboration XXIII. 2011, A&A, 536, A23
- Planck Collaboration VII (2014) Planck Collaboration VII. 2014, A&A, in press
- Planck Collaboration VIII (2014) Planck Collaboration VIII. 2014, A&A, in press
- Planck Collaboration XI (2014) Planck Collaboration XI. 2014, A&A, in press
- Planck Collaboration XII (2014) Planck Collaboration XII. 2014, A&A, in press
- Planck Collaboration XIII (2014) Planck Collaboration XIII. 2014, A&A, in press
- Planck Collaboration Int. XIV (2014) Planck Collaboration Int. XIV. 2014, A&A, in press
- Planck Collaboration Int. XVII (2014) Planck Collaboration Int. XVII. 2014, A&A, in press
- Poglitsch et al. (2010) Poglitsch, A., Waelkens, C., Geis, N., et al. 2010, A&A, 518, L2
- Reach et al. (1995) Reach, W. T., Dwek, E., Fixsen, D. J., et al. 1995, ApJ, 451, 188
- Rivera-Ingraham et al. (2015, submitted) Rivera-Ingraham, A., Ristorcelli, I., Juvela, M., & et al. 2015, submitted
- Rodón et al. (2010) Rodón, J. A., Zavagno, A., Baluteau, J., et al. 2010, A&A, 518, L80+
- Roussel (2013) Roussel, H. 2013, PASP, 125, 1126
- Russeil et al. (2003) Russeil, D., Juvela, M., Lehtinen, K., Mattila, K., & Paatero, P. 2003, A&A, 409, 135
- San José-García et al. (2013) San José-García, I., Mottram, J. C., Kristensen, L. E., et al. 2013, A&A, 553, A125
- Sandqvist & Lindroos (1976) Sandqvist, A. & Lindroos, K. P. 1976, A&A, 53, 179
- Shetty et al. (2009a) Shetty, R., Kauffmann, J., Schnee, S., & Goodman, A. A. 2009a, ApJ, 696, 676
- Shetty et al. (2009b) Shetty, R., Kauffmann, J., Schnee, S., Goodman, A. A., & Ercolano, B. 2009b, ApJ, 696, 2234
- Steinacker et al. (2014) Steinacker, J., Andersen, M., Thi, W.-F., & Bacmann, A. 2014, A&A, 563, A106
- Steinacker et al. (2010) Steinacker, J., Pagani, L., Bacmann, A., & Guieu, S. 2010, A&A, 511, A9+
- Tauber et al. (2010) Tauber, J. A., Mandolesi, N., Puget, J., et al. 2010, A&A, 520, A1
- Veneziani et al. (2010) Veneziani, M., Ade, P. A. R., Bock, J. J., et al. 2010, ApJ, 713, 959
- Ysard et al. (2012) Ysard, N., Juvela, M., Demyk, K., et al. 2012, A&A, 542, A21
| Field | Centre coordinates | Area | Distance | Reference region | Aliases | |||
|---|---|---|---|---|---|---|---|---|
| RA(2000.0) | DEC(2000.0) | (kpc) | RA(2000) | DEC(2000) | () | |||
| G0.02+18.02 | 16 40 56.7 | -18 34 59.9 | 1332 | 0.16(0.05) | 16 40 27.6 | -18 32 16.8 | 2.5 | - |
| G0.49+11.38 | 17 04 41.9 | -22 13 51.1 | 1775 | 0.16(+0.20/-0.16) | 17 04 21.8 | -22 02 20.4 | 2.8 | LDN15 |
| G1.94+6.07 | 17 28 08.2 | -24 01 53.9 | 2276 | 0.14(0.05) | 17 28 18.0 | -23 44 56.4 | 3.9 | LDN69, B77 |
| G2.83+21.91 | 16 34 28.8 | -14 11 27.8 | 2279 | 0.30(0.30) | 16 34 27.1 | -13 58 58.8 | 4.7 | LDN83, MBM135 |
| G3.08+9.38 | 17 17 51.1 | -21 26 16.4 | 3424 | 0.16(0.05) | 17 17 59.3 | -21 44 13.2 | 4.2 | |
| G3.72+21.02 | 16 39 45.9 | -14 02 09.3 | 1776 | 0.16(0.05) | 16 39 45.4 | -13 51 28.8 | 3.5 | LDN121 |
| G4.18+35.79 | 15 53 31.4 | -04 37 55.5 | 1331 | 0.11(0.01) | 15 52 57.4 | -04 32 27.6 | 2.7 | LDN134, MBM36, MLB40 |
| G6.03+36.73 | 15 54 13.9 | -02 51 40.1 | 1332 | 0.11(0.01) | 15 54 04.6 | -02 42 28.8 | 2.5 | LDN183, MBM37 |
| G9.45+18.85 | 17 00 22.2 | -10 51 07.0 | 1777 | 0.28(0.10) | 17 00 49.7 | -10 44 31.2 | 2.9 | - |
| G10.20+2.39 | 17 59 20.6 | -18 56 22.5 | 1331 | 0.83(0.40) | 17 59 07.9 | -18 49 37.2 | 2.3 | - |
| G20.72+7.07 | 18 03 38.9 | -07 30 24.5 | 1331 | 0.26(0.26) | 18 03 01.2 | -07 33 21.6 | 2.8 | - |
| G21.26+12.11 | 17 46 55.7 | -04 36 50.6 | 1331 | 0.12(0.12) | 17 46 48.2 | -04 26 34.8 | 2.9 | LDN425, LDN428, LM240 |
| G24.40+4.68 | 18 19 21.5 | -05 32 44.7 | 2284 | 0.26(0.05) | 18 18 17.3 | -05 36 25.2 | 3.6 | LDN475, LDN477, LDN470 |
| G25.86+6.22 | 18 16 20.7 | -03 24 48.9 | 1331 | 0.26(0.05) | 18 15 39.4 | -03 26 27.6 | 2.5 | LDN500 |
| G26.34+8.65 | 18 08 37.9 | -01 51 26.2 | 1331 | 0.40(0.40) | 18 08 40.3 | -01 42 32.4 | 2.6 | LDN502, CB112, P61 |
| G37.49+3.03 | 18 48 57.0 | +05 26 08.7 | 1333 | 0.80(0.60) | 18 48 31.2 | +05 29 13.2 | 2.4 | BDN31.48+3.02 |
| G37.91+2.18 | 18 52 45.4 | +05 26 01.0 | 1331 | 1.06(0.79) | 18 52 26.4 | +05 31 51.6 | 2.3 | - |
| G39.65+1.75 | 18 57 00.1 | +06 47 00.2 | 1774 | 0.99(0.48) | 18 56 50.6 | +06 41 13.2 | 3.5 | - |
| G62.16-2.92 | 19 59 47.3 | +24 16 15.0 | 1329 | 1.02(0.35) | 19 59 29.3 | +24 22 40.8 | 2.7 | - |
| G69.57-1.74 | 20 13 24.7 | +31 16 01.4 | 1772 | 1.78(0.81) | 20 13 46.1 | +31 08 09.6 | 2.6 | - |
| G70.10-1.69 | 20 13 58.5 | +31 49 25.7 | 3420 | 2.09(0.83) | 20 13 39.1 | +32 09 18.0 | 4.3 | - |
| G71.27-11.32 | 20 53 14.0 | +26 50 56.4 | 1332 | - | 20 53 17.0 | +26 58 04.8 | 3.0 | - |
| G82.65-2.00 | 20 53 11.3 | +41 35 16.7 | 4744 | 1.00(+1.00/-0.60) | 20 52 35.0 | +41 14 27.6 | 5.5 | LDN914 |
| G86.97-4.06 | 21 17 20.9 | +43 24 21.6 | 1325 | 0.70(0.10) | 21 16 53.8 | +43 32 13.2 | 2.3 | LDN943, LDN944 |
| G89.65-7.02 | 21 38 23.7 | +43 16 23.6 | 3422 | 0.70(+1.00/-0.70) | 21 37 30.2 | +43 02 24.0 | 4.5 | B159, LDN977 |
| G91.09-39.46 | 23 10 32.6 | +17 06 32.7 | 1330 | 0.52(0.20) | 23 10 15.1 | +17 12 28.8 | 2.7 | - |
| G92.04+3.93 | 21 03 00.6 | +52 31 46.3 | 2278 | 0.80(0.80) | 21 01 09.8 | +52 33 50.4 | 3.5 | LDN1003, ArchG092.03+03.93 |
| G92.63-10.43 | 22 03 05.7 | +42 14 34.9 | 1330 | 0.90(0.90) | 22 02 48.7 | +42 07 58.8 | 2.3 | - |
| G93.21+9.55 | 20 37 00.2 | +56 54 46.7 | 1332 | 0.44(+0.46/-0.14) | 20 37 35.3 | +56 46 12.0 | 2.8 | LDN1033 |
| G94.15+6.50 | 20 59 22.8 | +55 35 54.0 | 2279 | 0.80(0.80) | 20 57 55.4 | +55 37 22.8 | 3.9 | B357 |
| G95.76+8.17 | 20 57 24.1 | +58 10 19.9 | 2829 | 0.80(0.80) | 20 55 23.8 | +58 17 06.0 | 3.5 | LDN1071, B354 |
| G98.00+8.75 | 21 03 55.9 | +59 59 36.1 | 1777 | 1.10(0.20) | 21 03 31.7 | +60 10 22.8 | 4.1 | ArchG097.82+08.67 |
| G105.57+10.39 | 21 41 35.6 | +66 33 11.6 | 2829 | 0.90(0.30) | 21 43 16.8 | +66 25 12.0 | 3.0 | ArchG105.55+10.45 |
| G107.20+5.52 | 22 21 14.4 | +63 41 46.0 | 3733 | 0.90(0.30) | 22 24 24.7 | +63 44 09.6 | 6.3 | PCC249, LDN1204, S140, S9 |
| G108.28+16.68 | 21 09 45.7 | +72 52 58.3 | 1332 | 0.30(+0.20/-0.15) | 21 08 25.7 | +72 47 13.2 | 2.5 | - |
| G109.18-37.59 | 00 03 50.3 | +24 00 10.8 | 1320 | - | 00 04 25.9 | +24 06 32.4 | 4.1 | - |
| G109.80+2.70 | 22 53 30.7 | +62 30 57.7 | 1331 | 0.70(0.10) | 22 53 20.6 | +62 38 24.0 | 2.8 | PCC288, S8 |
| G110.62-12.49 | 23 37 27.7 | +48 29 40.8 | 2280 | 0.44(0.10) | 23 37 26.2 | +48 43 19.2 | 5.0 | - |
| G110.89-2.78 | 23 18 15.5 | +58 04 01.7 | 2265 | 3.00(1.00) | 23 17 28.6 | +57 53 52.8 | 4.0 | - |
| G110.80+14.16 | 21 59 02.6 | +72 48 56.3 | 2281 | 0.40(0.10) | 22 02 28.3 | +72 42 39.6 | 3.8 | - |
| G111.41-2.95 | 23 22 15.4 | +57 50 00.0 | 2264 | 3.00(1.00) | 23 20 43.4 | +57 55 15.6 | 3.6 | ArchG111.11-03.01 |
| G115.93+9.47 | 23 24 05.5 | +71 09 29.0 | 1331 | 1.00(0.50) | 23 25 43.4 | +71 07 58.8 | 2.8 | - |
| G116.08-2.40 | 23 57 06.7 | +59 42 27.3 | 1332 | 0.50(0.50) | 23 58 29.0 | +59 41 02.4 | 2.9 | LDN1257, LDN1257B |
| G126.24-5.52 | 01 15 46.6 | +57 12 37.5 | 1327 | 1.00(0.10) | 01 16 59.3 | +57 08 52.8 | 2.9 | - |
| G126.63+24.55 | 04 23 46.3 | +85 47 06.5 | 1350 | 0.12(0.02) | 04 28 02.9 | +85 41 20.4 | 3.0 | S1, LDN1320 |
| G127.79+2.66 | 01 37 49.1 | +65 05 26.6 | 1344 | 0.80(0.10) | 01 38 32.9 | +65 12 50.4 | 3.2 | ArchG127.69+02.65 |
| G128.78-69.46 | 00 59 22.1 | -06 44 41.2 | 2819 | - | 00 59 50.6 | -06 57 57.6 | 4.7 | - |
| G130.37+11.26 | 02 32 07.2 | +72 39 15.1 | 1325 | 0.60(0.10) | 02 30 49.7 | +72 30 18.0 | 2.4 | LDN1340 |
| G130.42-47.07 | 01 12 33.7 | +15 28 59.0 | 1328 | - | 01 13 10.1 | +15 34 44.4 | 3.2 | - |
| G131.65+9.75 | 02 39 25.4 | +70 47 11.4 | 1328 | 1.07(+0.52/-0.49) | 02 41 39.6 | +70 46 01.2 | 2.3 | S3 |
| G132.12+8.95 | 02 39 50.5 | +69 48 54.9 | 1762 | 0.85(0.10) | 02 37 25.0 | +69 52 51.6 | 3.7 | - |
| G139.60-3.06 | 02 52 31.6 | +55 39 35.5 | 4074 | 0.85(0.10) | 02 50 13.4 | +55 24 10.8 | 5.4 | - |
| G141.25+34.37 | 08 48 17.8 | +72 43 16.1 | 1329 | 0.11(0.01) | 08 46 18.7 | +72 47 38.4 | 3.3 | MBM27 |
| G149.67+3.56 | 04 18 07.7 | +55 15 04.8 | 2275 | 0.17(0.05) | 04 17 25.4 | +55 30 39.6 | 3.6 | LDN1400, LDN1394 |
| B8, B9, MBL71 | ||||||||
| G150.47+3.93 | 04 24 37.9 | +55 02 21.6 | 1776 | 0.17(0.05) | 04 24 30.2 | +55 14 02.4 | 3.5 | LDN1399, MLB72, MLB74, |
| LM17, ArchG150.41+03.91 | ||||||||
| G151.45+3.95 | 04 29 53.9 | +54 14 53.0 | 1331 | 0.17(0.05) | 04 30 15.6 | +54 06 36.0 | 2.6 | B12, LDN1407, LDN1400F, |
| MLB77, LM25 | ||||||||
| G154.08+5.23 | 04 47 34.4 | +53 05 01.9 | 1329 | 0.17(0.05) | 04 48 04.8 | +53 13 26.4 | 2.6 | LDN1426, LM56 |
| G155.80-14.24 | 03 37 09.4 | +37 42 31.8 | 4765 | 0.35(0.10) | 03 37 35.0 | +38 03 36.0 | 6.2 | LDN1434 |
| G157.08-8.68 | 04 01 39.8 | +41 14 20.4 | 1806 | 0.15(0.15) | 04 02 37.7 | +41 17 27.6 | 2.9 | (LDN1443) |
| G157.92-2.28 | 04 28 51.8 | +45 15 06.3 | 2278 | 2.50(1.00) | 04 30 20.2 | +45 22 26.4 | 3.9 | - |
| G159.23-34.51 | 02 56 02.5 | +19 39 10.2 | 6527 | 0.33(0.05) | 02 57 25.2 | +19 11 06.0 | 8.0 | LDN1457, MBM12, ArchG159.17-34.44 |
| G159.12-14.30 | 03 50 36.0 | +35 41 58.0 | 1331 | 0.80(0.80) | 03 50 21.8 | +35 49 44.4 | 3.1 | - |
| G159.34+11.21 | 05 41 17.5 | +52 11 38.8 | 2279 | 0.70(0.70) | 05 41 30.2 | +51 55 55.2 | 3.6 | - |
| G161.55-9.30 | 04 16 11.2 | +37 46 17.5 | 1358 | 0.25(+0.28/-0.25) | 04 15 50.4 | +37 39 39.6 | 2.4 | S7 |
| G163.82-8.44 | 04 27 13.7 | +36 46 47.2 | 8385 | 0.42(0.10) | 04 23 21.8 | +36 27 43.2 | 8.6 | - |
| G164.71-5.64 | 04 40 42.8 | +38 09 06.4 | 5002 | 0.33(0.20) | 04 42 46.1 | +38 20 34.8 | 5.3 | LDN1481 |
| G167.20-8.69 | 04 36 34.9 | +34 16 50.4 | 2829 | 0.16(0.16) | 04 35 08.9 | +34 10 44.4 | 4.2 | - |
| G168.85-10.19 | 04 37 04.3 | +31 49 17.9 | 1330 | 1.30(1.30) | 04 36 12.7 | +31 49 12.0 | 2.7 | - |
| G171.35-38.28 | 03 18 04.2 | +10 27 01.2 | 1330 | - | 03 17 23.3 | +10 25 40.8 | 2.8 | MBM16 |
| G173.43-5.44 | 05 08 42.0 | +31 22 38.5 | 3424 | 0.15(0.15) | 05 08 37.0 | +31 02 13.2 | 4.5 | - |
| G174.22+2.58 | 05 41 42.4 | +35 11 58.2 | 1331 | 1.80(0.20) | 05 42 26.2 | +35 14 24.0 | 2.3 | - |
| G176.27-2.09 | 05 28 14.3 | +30 57 27.0 | 1356 | 1.57(0.26) | 05 28 04.3 | +31 06 18.0 | 3.0 | S6 |
| G181.84-18.46 | 04 43 56.1 | +16 57 22.9 | 1356 | 0.50(0.50) | 04 43 53.8 | +16 50 09.6 | 2.8 | - |
| G188.24-12.97 | 05 17 05.1 | +14 54 32.7 | 3422 | 0.45(0.05) | 05 15 37.4 | +14 55 48.0 | 4.6 | - |
| G189.51-10.41 | 05 29 55.3 | +15 27 03.2 | 2831 | 0.45(0.05) | 05 28 38.6 | +15 25 30.0 | 4.0 | - |
| G195.74-2.29 | 06 10 58.1 | +14 09 56.7 | 1330 | 0.60(0.60) | 06 11 01.2 | +14 02 02.4 | 2.7 | ArchG195.73-02.39 |
| G198.58-9.10 | 05 52 28.8 | +08 19 33.8 | 2279 | 0.45(0.45) | 05 51 54.7 | +08 16 58.8 | 3.5 | LDN1598 |
| G202.23-3.38 | 06 19 33.2 | +08 02 56.7 | 1331 | 3.80(1.00) | 06 18 49.2 | +08 03 00.0 | 2.7 | - |
| G202.02+2.85 | 06 41 07.4 | +10 47 22.8 | 4079 | 0.76(0.10) | 06 42 42.7 | +10 42 39.6 | 4.3 | - |
| G203.42-8.29 | 06 04 35.6 | +04 22 31.0 | 2278 | 0.39(0.10) | 06 03 56.4 | +04 15 57.6 | 3.8 | - |
| G205.06-6.04 | 06 16 27.5 | +04 09 44.0 | 2832 | 0.40(0.10) | 06 16 40.8 | +04 28 15.6 | 4.6 | - |
| G206.33-25.94 | 05 06 49.1 | -06 14 56.6 | 2276 | 0.21(0.03) | 05 06 17.0 | -06 00 00.0 | 5.6 | IC 2118, Witch Head Nebula |
| G210.90-36.55 | 04 35 07.0 | -14 14 35.3 | 4763 | 0.14(+0.020/-0.028) | 04 34 50.2 | -14 26 45.6 | 4.3 | LDN1642, MBM20, IREC305 |
| G212.07-15.21 | 05 55 57.7 | -06 09 26.4 | 1332 | 0.23(0.10) | 05 56 21.8 | -06 02 56.4 | 2.8 | - |
| G215.37-3.04 | 06 45 03.3 | -03 32 35.3 | 1329 | 2.40(0.50) | 06 44 30.5 | -03 30 18.0 | 2.2 | - |
| G215.44-16.38 | 05 57 02.8 | -09 33 26.2 | 1353 | 1.45(1.45) | 05 57 26.4 | -09 31 15.6 | 2.6 | S4 |
| G216.76-2.58 | 06 48 59.8 | -04 36 09.6 | 1330 | 2.40(0.50) | 06 49 06.2 | -04 24 39.6 | 2.6 | - |
| G218.06+2.12 | 07 08 22.0 | -03 34 59.3 | 1329 | - | 07 07 59.3 | -03 38 31.2 | 3.4 | - |
| G219.36-9.71 | 06 28 01.3 | -09 57 53.7 | 2279 | 0.91(0.03) | 06 28 14.6 | -09 42 54.0 | 4.6 | LDN1652 |
| G219.29-9.25 | 06 29 43.0 | -09 48 37.5 | 1331 | 0.91(0.03) | 06 29 17.0 | -09 41 49.2 | 2.8 | IREC317 |
| G227.95-2.98 | 07 07 50.7 | -14 46 23.6 | 2826 | 2.00(0.50) | 07 07 30.0 | -15 03 57.6 | 4.4 | - |
| G247.55-12.27 | 07 09 26.1 | -36 16 39.4 | 2824 | 0.17(0.17) | 07 08 39.1 | -36 35 52.8 | 4.0 | IREC365, DCld 247.5-12.3 |
| G253.71+1.93 | 08 25 04.9 | -34 26 33.1 | 1318 | 2.26(0.10) | 08 25 42.2 | -34 23 09.6 | 3.1 | - |
| G255.33-4.88 | 08 01 23.8 | -39 38 07.5 | 1764 | 0.80(0.40) | 08 00 33.6 | -39 45 36.0 | 2.8 | DCld 255.4-04.9 |
| G258.90-4.10 | 08 14 35.7 | -42 08 01.8 | 1323 | 1.04(0.44) | 08 14 20.9 | -41 59 56.4 | 2.7 | HMSTG259.1-4.0C |
| G265.04+6.08 | 09 17 48.9 | -40 36 11.7 | 1755 | 0.92(0.26) | 09 18 40.8 | -40 43 26.4 | 2.8 | - |
| G265.60-5.82 | 08 27 59.9 | -48 36 50.8 | 1319 | 2.40(+0.71/-0.85) | 08 29 07.9 | -48 38 16.8 | 3.2 | - |
| G268.21+2.02 | 09 13 10.0 | -45 36 45.4 | 1756 | 1.87(+0.86/-1.39) | 09 14 11.3 | -45 33 03.6 | 2.7 | SDN114, HMSTG268.0+1.8 |
| G271.06+4.84 | 09 36 23.9 | -45 39 13.0 | 2260 | 1.32(0.50) | 09 37 00.7 | -45 27 36.0 | 3.9 | SDN118, HMSTG271.4+4.8 |
| G271.51+5.14 | 09 39 27.5 | -45 49 41.0 | 3400 | 1.32(0.50) | 09 41 13.2 | -45 59 20.4 | 4.6 | HMSTGG271.4+4.8 |
| G276.78+1.75 | 09 50 16.3 | -51 39 46.6 | 5064 | 2.00(2.00) | 09 52 58.8 | -51 25 33.6 | 5.3 | S5, FeSt2-72, DCld 276.9+01.7, |
| DCld 276.8+0.1.9 | ||||||||
| G298.31-13.05 | 11 38 50.7 | -75 17 27.2 | 1330 | 0.15(0.10) | 11 40 48.0 | -75 23 24.0 | 3.4 | SDN138, FeSt2-129, |
| HMSTG298.3-13.1, FeSt1-188, | ||||||||
| DCld 298.3-13.1 | ||||||||
| G299.57+5.61 | 12 26 45.9 | -57 05 33.6 | 1331 | - | 12 25 33.6 | -57 04 44.4 | 3.0 | HMSTG299.6+5.6 |
| G300.61-3.13 | 12 28 54.8 | -65 47 40.3 | 1761 | 0.20(0.05) | 12 27 04.6 | -65 50 34.8 | 2.8 | HMSTG300.6-3.0 |
| G300.86-9.00 | 12 25 17.3 | -71 46 05.6 | 1357 | 0.15(0.03) | 12 26 07.4 | -71 50 38.4 | 3.0 | PCC550, S10, SDN143, VMF32, |
| Musca DN Complex | ||||||||
| G315.88-21.44 | 17 19 40.0 | -76 55 16.8 | 1331 | 0.25(0.01) | 17 16 27.8 | -76 49 22.8 | 2.5 | - |
| G320.84+5.09 | 14 55 10.5 | -53 24 46.6 | 1328 | 1.00(1.00) | 14 55 15.4 | -53 18 28.8 | 2.7 | HMSTG320.8+5.1 |
| G325.54+5.82 | 15 18 44.6 | -50 22 09.3 | 2276 | 0.64(0.44) | 15 19 04.1 | -50 06 18.0 | 3.7 | SDN175, HMSTG325.5+5.8, DCld 325.5+05.8 |
| G332.70+6.77 | 15 49 43.7 | -45 28 32.1 | 1775 | 0.65(0.20) | 15 50 11.0 | -45 37 19.2 | 2.8 | - |
| G334.65+2.67 | 16 14 40.4 | -47 11 48.8 | 1778 | 1.50(0.50) | 16 13 45.8 | -47 08 24.0 | 3.7 | - |
| G339.22-6.02 | 17 12 09.7 | -49 34 31.0 | 1334 | 2.09(1.00) | 17 13 08.9 | -49 37 58.8 | 3.2 | - |
| G341.18+6.51 | 16 25 05.1 | -39 59 10.1 | 1332 | 0.14(0.02) | 16 25 14.6 | -39 49 40.8 | 3.3 | SLDN16, HMSTG341.2+6.5, LM170, |
| DCld 341.2+06.5, FeSt1-357 | ||||||||
| G343.64-2.31 | 17 10 29.2 | -43 46 28.7 | 2278 | 1.00(0.50) | 17 10 52.1 | -43 57 43.2 | 3.8 | HMSTG343.7-2.3, (FeSt1-373) |
| G344.77+7.58 | 16 33 30.3 | -36 38 59.7 | 1332 | 0.24(0.24) | 16 33 25.0 | -36 31 48.0 | 2.5 | - |
| G345.39-3.97 | 17 22 50.0 | -43 28 24.7 | 1776 | 0.23(+0.20/-0.10) | 17 23 42.5 | -43 34 01.2 | 3.8 | - |
| G358.96+36.75 | 15 39 37.9 | -07 13 09.2 | 1355 | 0.11(0.01) | 15 38 52.6 | -07 10 58.8 | 3.0 | LDN1780, LDN1778, MBM33 |
Appendix A Radiative transfer models
Modelling was used to assess the possible impact that radiative transfer effects have on the observed spectral index values. The model consists of a cylindrical filament with a Plummer-like radial density profile
| (2) |
where is the distance from the symmetry axis, is the central density, and determines the extent of the inner flatter part of the density profile. The filament is illuminated externally by interstellar radiation field (Mathis et al. 1983). We use the Ossenkopf & Henning (1994) dust model for coagulated grains with thin ice mantles accreted over 105 years in a density of cm-3. To remove any ambiguity from the comparison of the observed and the intrinsic values, the model is modified so that is equal to 1.9 at all wavelengths m. Note that this is the intrinsic value of the dust opacity spectral index. Because of line-of-sight temperature mixing, the apparent value estimated from surface brightness data can be expected to be lower (Shetty et al. 2009b; Juvela & Ysard 2012b).
The filament is observed in a direction perpendicular to its symmetry axis. The radiative transfer calculations are used to solve the three-dimensional temperature structure of the filament and to calculate surface brightness maps at 160, 250, 350, and 500 m. The surface brightness data are used to derive maps of observed colour temperature and spectral index. In the calculation we use 10% and 2% relative uncertainties for the PACS channel and the SPIRE channels, the same as in the case of actual observations. The maps consist of 256256 pixels corresponding to the 2563 cell discretisation of the 3D model cloud. The models are characterised by their total optical depth in V band that, measured through the filament in the perpendicular direction, is either 10.0 or 50.0. To make the model more concrete, we assume for the models a linear size of 10 pc and a distance of 400 pc. With this scaling, the parameter is equal to 0.1 pc and is determined by the selected optical depths. Each pixel corresponds to 20 and the final maps are convolved to a resolution of 40.0 before analysis. Figure 28 shows cross sections of the modelled filament in column density (V band optical depth), dust temperature, and the colour temperature and the spectral index estimated from the surface brightness data.
For the model, the apparent spectral index decreases to 1.75, 0.15 units below the intrinsic value of 1.9. For the model, the minimum observed value is only 1.10. This demonstrates the difficulty of making a direct connection between the apparent spectral indices and the intrinsic dust properties in the case of optically thick clouds. However, because the line-of-sight temperature variations always imply a decrease in the apparent spectral index, this increases the significance of the observed correlation between column density and spectral index. At least in some regions along the line-of-sight, the actual dust opacity spectral index should be much higher than the observed values.
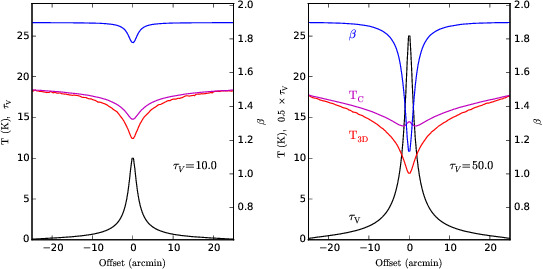
We calculated two additional cases where the dust properties were modified in the central regions with density exceeding 25% of its maximum value. The modification is applied only to wavelengths m and it is determined by two criteria. First, the dust opacity is set to twice its original value at 250m and, secondly, the long wavelength spectral index is set to a value of either 1.7 or 2.2. These are ad hoc models where the dust opacity has discontinuity at 40 m. This has little practical importance because grains absorb energy at wavelengths shorter than this limit and correspondingly emit the energy at much longer wavelengths.
The first result is that the observed (i.e., values derived from surface brightness data) values towards the filament centre are lower in both cases of modified dust. We interpret this as an indication that the increased line-of-sight temperature variations associated with the enhanced submillimetre opacity outweigh the effect of 0.2 changes of the intrinsic spectral index. For the = 10 model, the minimum values were 1.41 and 1.67 for the and cases, respectively. Both are lower than the previous apparent value of 1.75. For the = 50 model, the corresponding minimum values are 0.57 and 0.67, much lower than the 1.10 obtained before modifications to the dust model.
Figure 29 shows selected SEDs from the = 50 models described above. The uppermost three SEDs are observed towards the filament centre for the three different dust models. The two lower SEDs are obtained at different radial offsets, from a region that is unaffected by the changes that were applied to the inner part of the filament. We use arrows to indicate the difference between the fitted modified blackbody curves and the actual data points. Towards the optically thick centre, the data do not follow a single modified blackbody spectrum. The errors are largest at 160 m, because of its smaller weight in the fit (assuming 10% uncertainty instead of the 2% at the longer wavelengths). However, the fits also systematically overestimate the 250 m intensity and underestimate the 350 m intensity, this being related to the low values of the fitted spectral index. The SEDs for both modified dust cases are clearly colder than the original SED because of the higher opacity at wavelengths where the dust grains emit most of their energy.
The spectral index was modified at m. In the 100–500 m range, the difference corresponds to a factor of two difference of relative opacity. Nevertheless, the observed spectra for the and cases are practically on top of each other over the whole wavelength range probed by Herschel observations. After the opacity increase, the central part of the filament is very cold with dust temperatures close to 5 K. As a result, even at 500 m the emission per unit dust mass is more than a factor of ten lower than for the 17 K dust on the cloud surface. This means that the changes at the cloud centre are masked by the warmer, more strongly emitting envelope. In the model the difference of intrinsic values in the filament centre becomes evident only at mm wavelengths. In the Herschel range, the spectral index determination is clearly very sensitive to temperature variations. If the 160 m data point were omitted from the fits, the spectral index values of 1.16, 0.52, and 0.62 would increase to 1.37, 0.75, and 0.93 respectively, the three values corresponding to the three models: one with original dust, one with dust in the centre, and one with dust in the centre. The difference between the observed and intrinsic (for given column density) would also decrease if the column density peak were less steep or if the observations were averaged over a larger beam. At lower column densities, at larger offsets from the symmetry axis of the cylindrical filament, the dust SED is well-described by a single modified blackbody curve, with the observed approaching the intrinsic value.
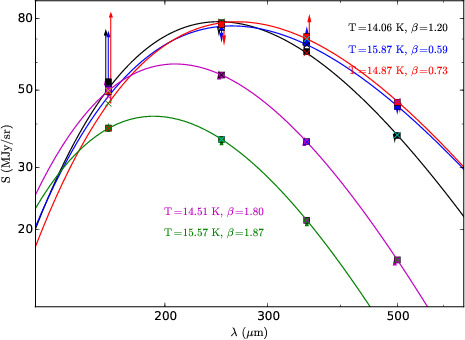
In spite of such a strong effect in the above model, the observations rarely show any decrease of towards the dense regions. A weak anti-correlation between and column density was seen only in a few fields. These include G82.65-2.00 where, based on the observed dust emission, the column density exceeds cm-2 in many places (Juvela et al. 2015). WISE 12 m data show clear absorption along the full filament, also suggesting that the visual extinction is at least mag. The average properties of the filament would therefore be between the two models above but on average closer to the case. The large scale decrease of towards the filament is at the level of = 0.1 and could easily be explained by temperature variations within the beam. However, even in G82.65-2.00 the relation shows an anti-correlation at the smallest scales towards the densest clumps, contrary to the behaviour in the models.
The temperature mixing in regions like G82.65-2.00 is probably very complex compared to the simple models above and the net effect on the observed spectral index can be qualitatively different. The models above showed a maximal effect because we compared emission between the cold centre and the fully illuminated cloud surface. In real clouds the dense regions are shielded by diffuse envelopes whose extinction decreases temperature contrasts at small scales. The drop in the observed would be smaller if the column density profile were less steep or if the data were smoothed by a larger beam. If the emission region is inhomogeneous, elongated, or consists of completely separate clumps along the line-of-sight, the radiative transfer effects would be reduced. Internal heating of some clumps is not able to explain the general anti-correlation between and (Malinen et al. 2011; Juvela & Ysard 2012b). Therefore, it seems that we are observing real changes in the intrinsic dust properties that, remarkably, are strong enough to be seen above the opposite effects caused by temperature variations.
The models can also be used to examine the dependence on the wavelengths used. Figure 30 shows temperature and spectral index profiles of the model that are estimated using five different wavelength combinations. As expected, values are least biased when long wavelengths, 250–850 m, are used. However, in the case of this model, even the combination of PACS and SPIRE bands 160–500 m results in values that are lower by no more than . This suggests that over most of the observed fields the bias resulting from temperature variations is not significantly different for the different combinations of frequency bands.

Appendix B Fits of , with IRAS and Planck data
The figures 31–89 show results of modified blackbody fits of the 100 m IRAS data and the Planck 857 GHz–353 GHz observations. The bottom frames show the 217 GHz residuals (observation minus the prediction of the fitted model) and the difference in spectral index when the lowest included frequency is 353 GHz or 217 GHz. For the field G300.86-9.00 the plot was already shown in Fig. 5.
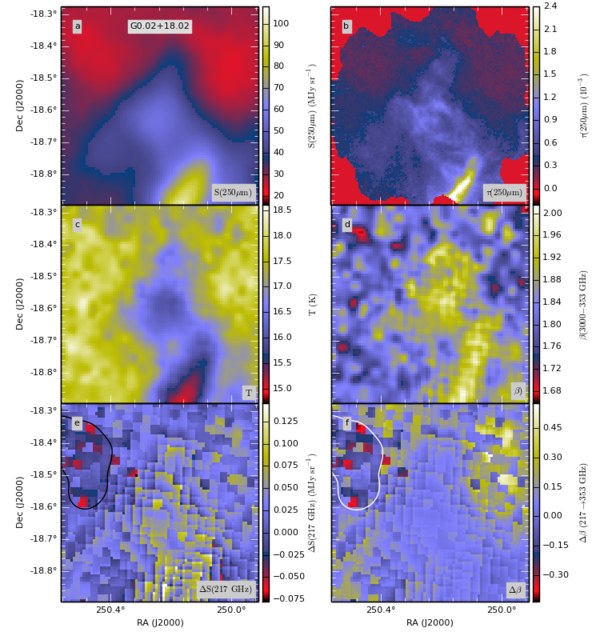
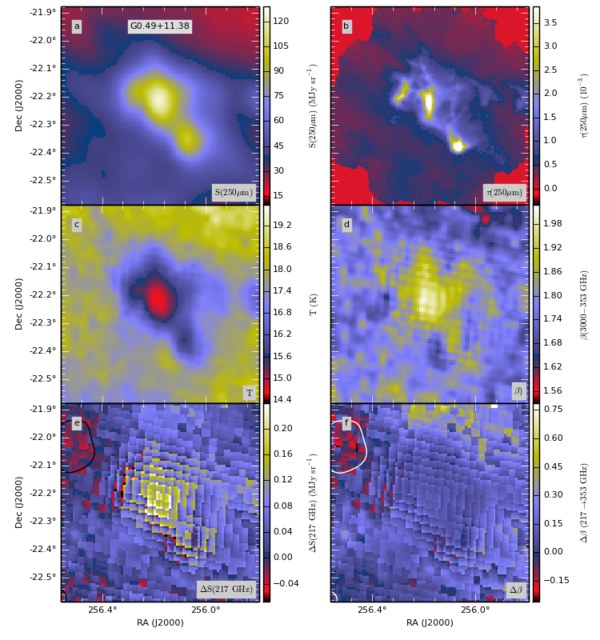


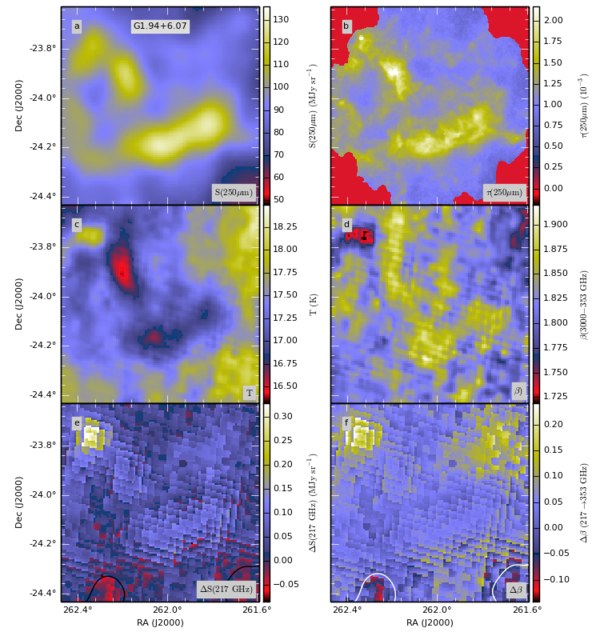
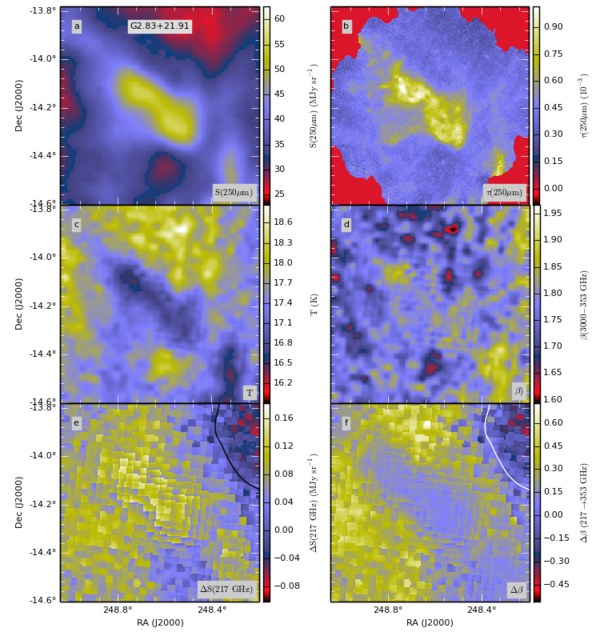
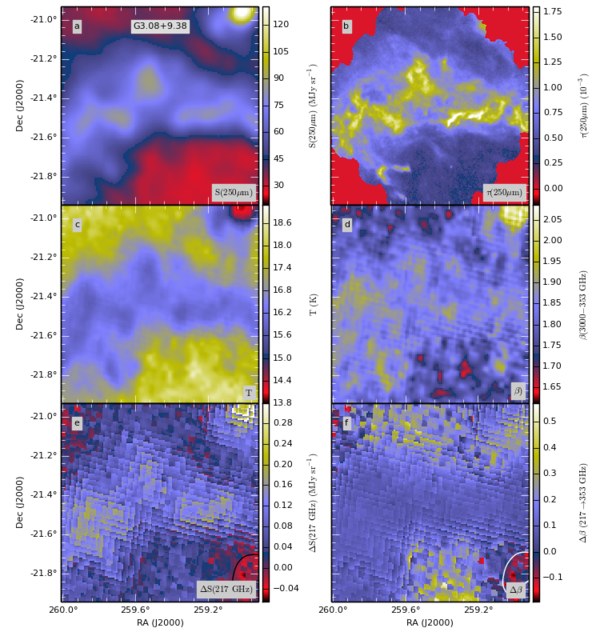
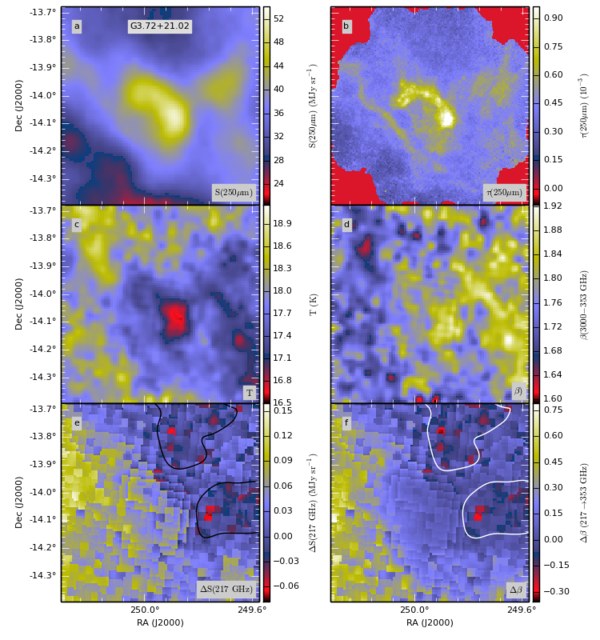
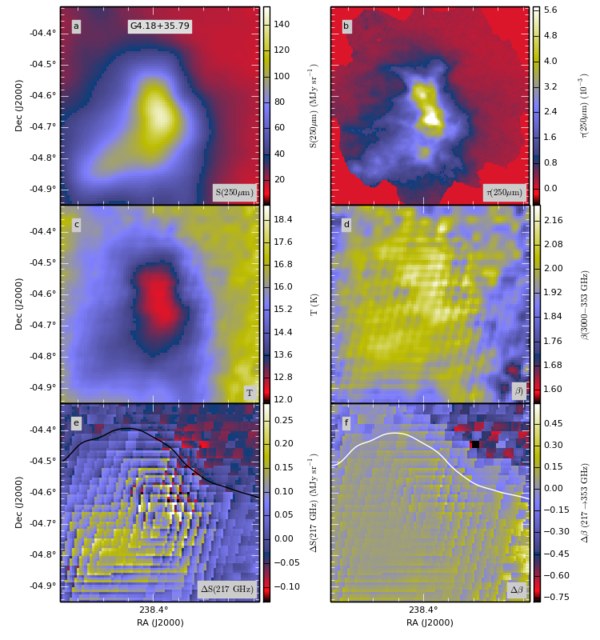
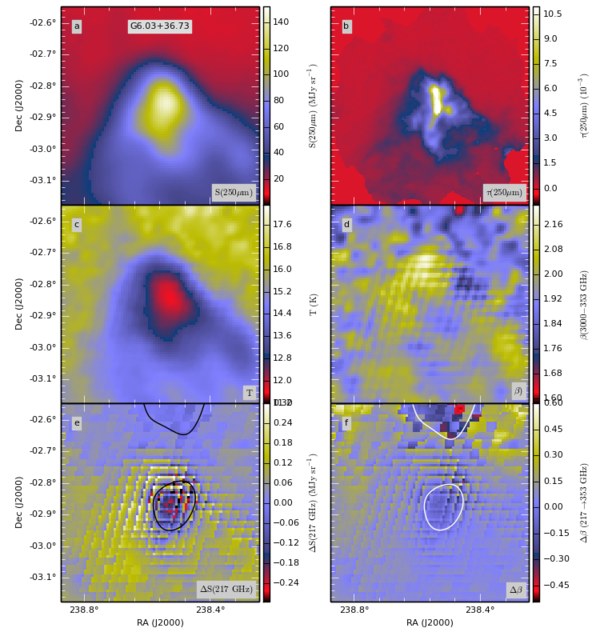
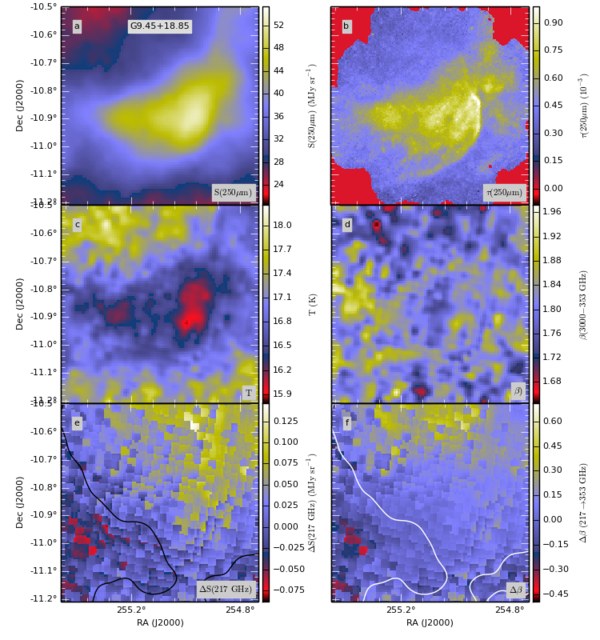
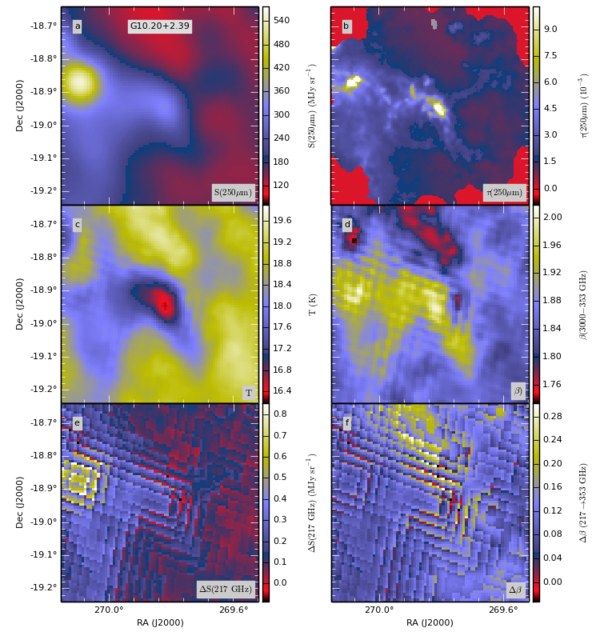
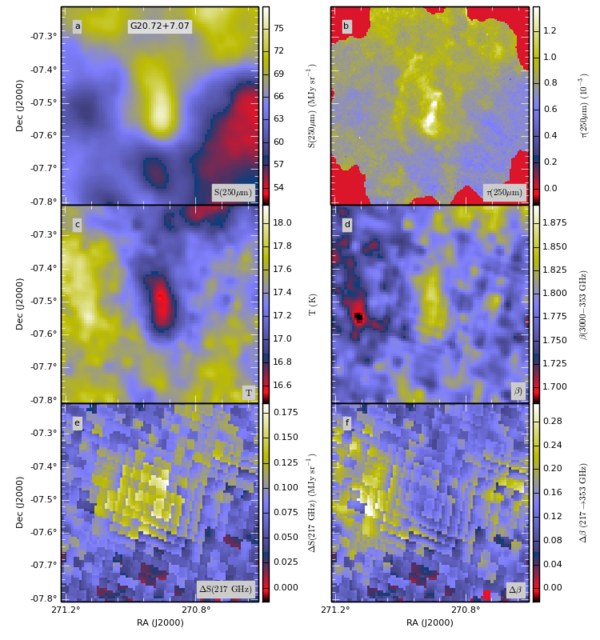
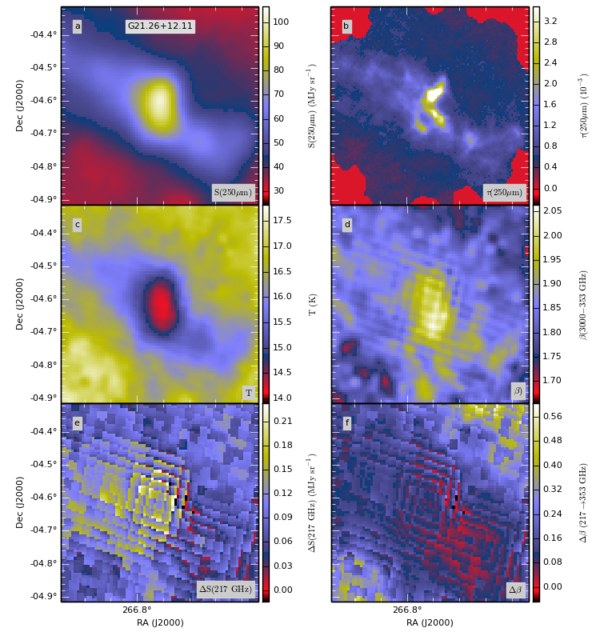
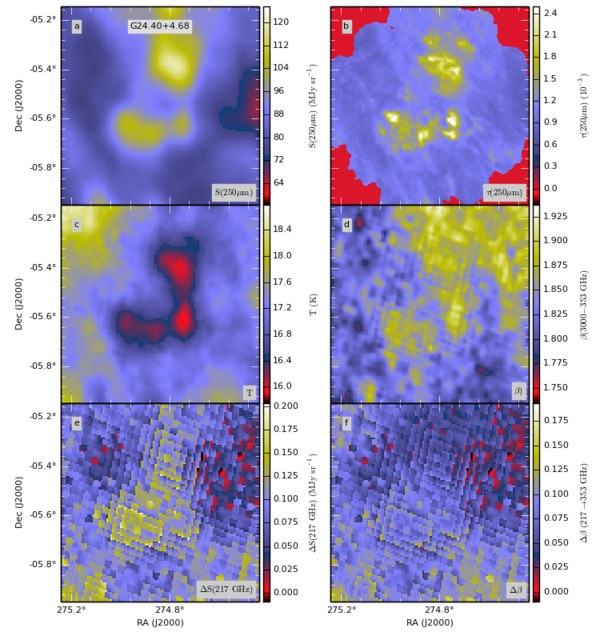
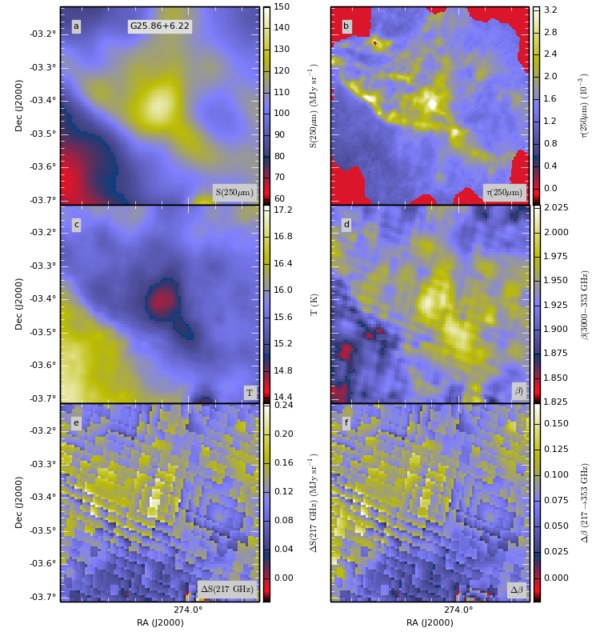
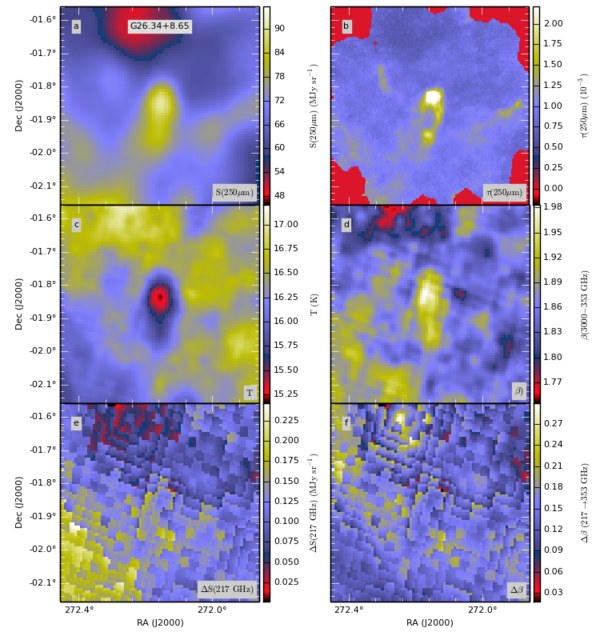
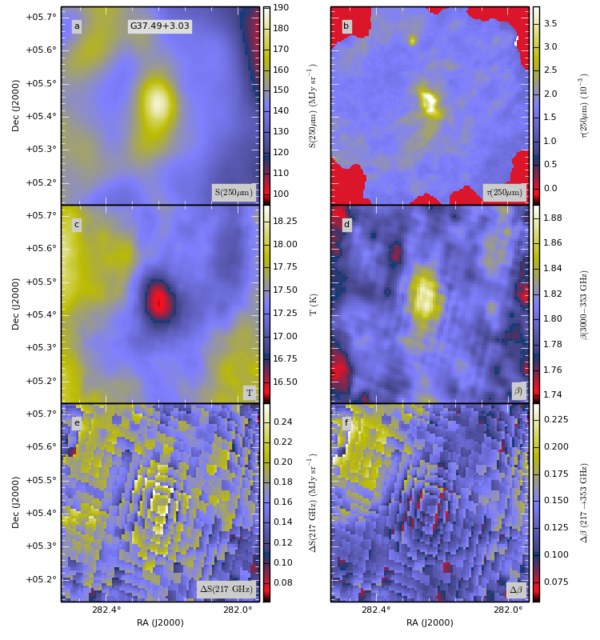
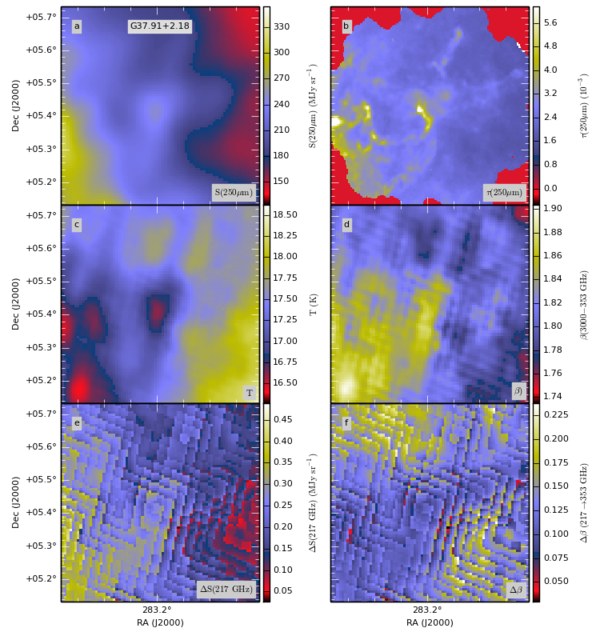
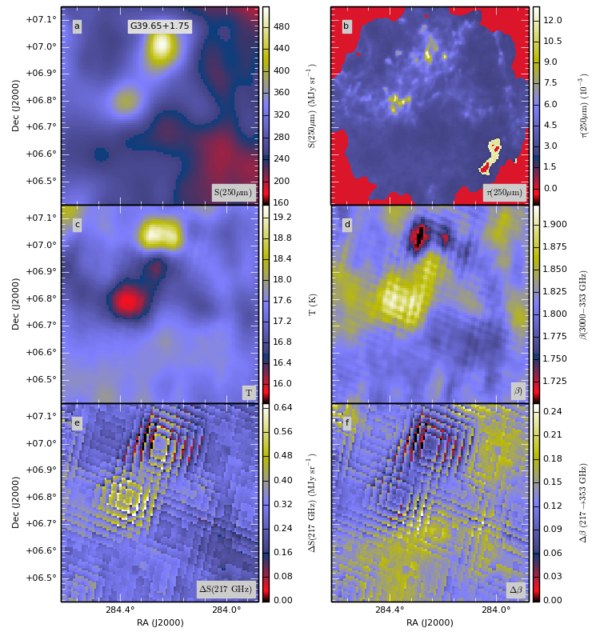
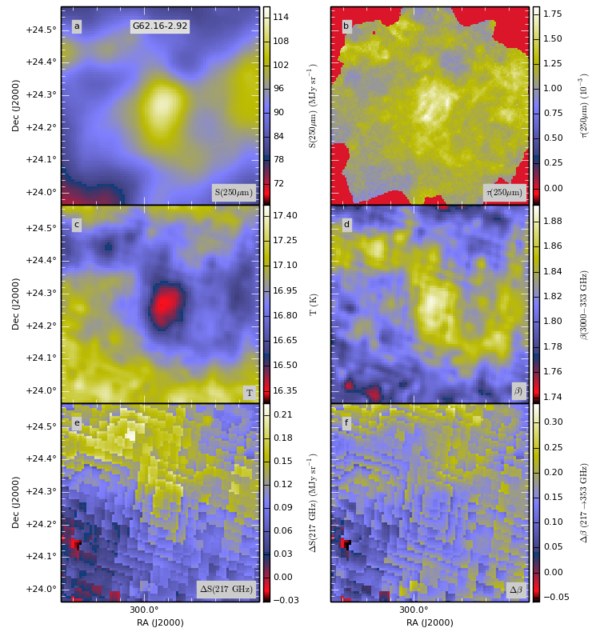
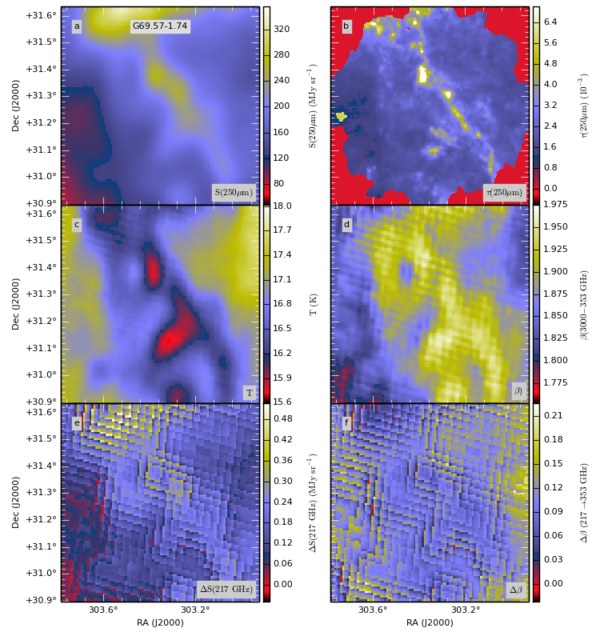
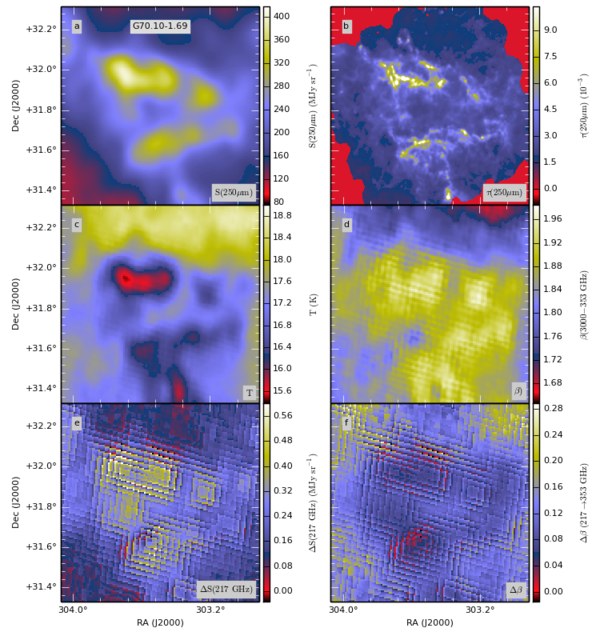
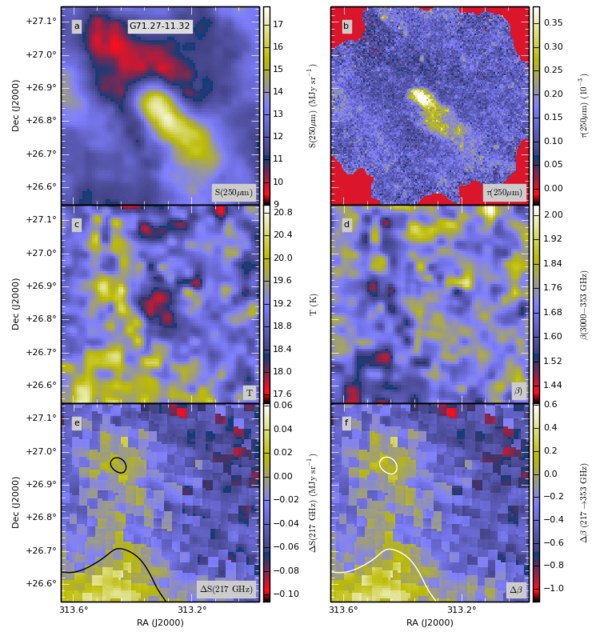
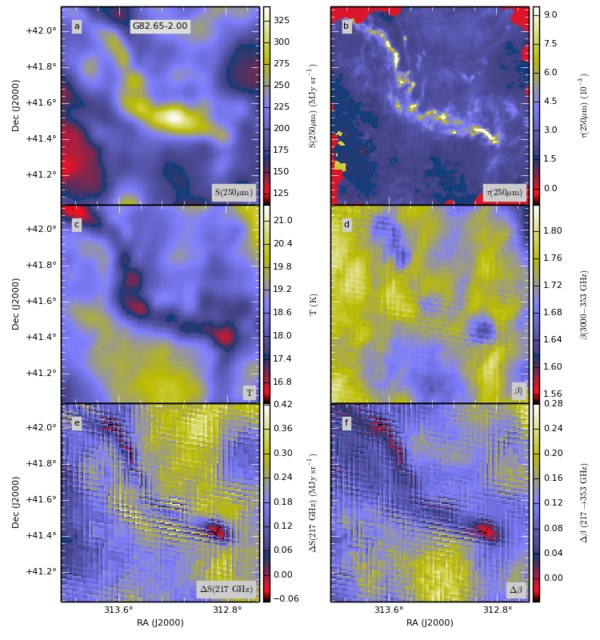
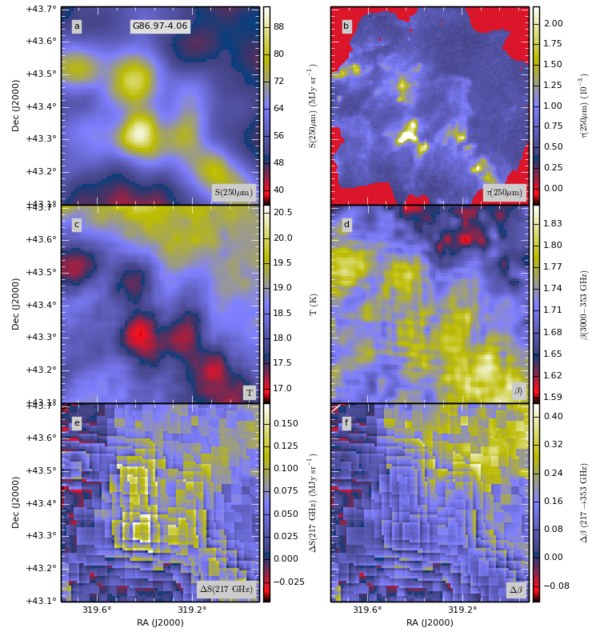
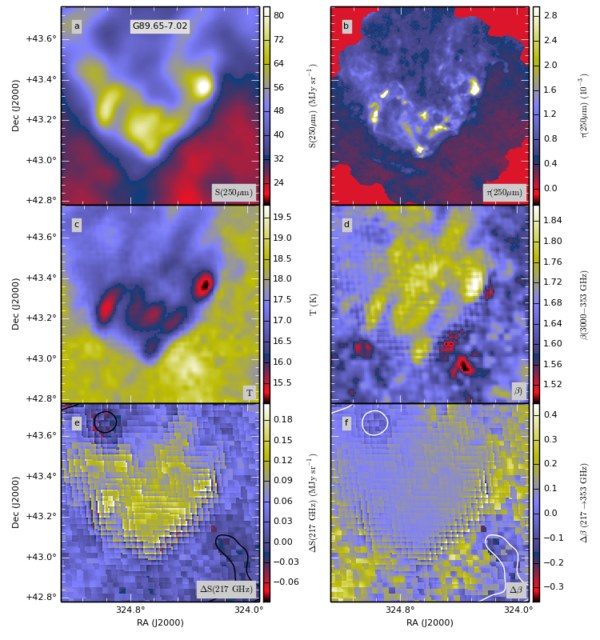
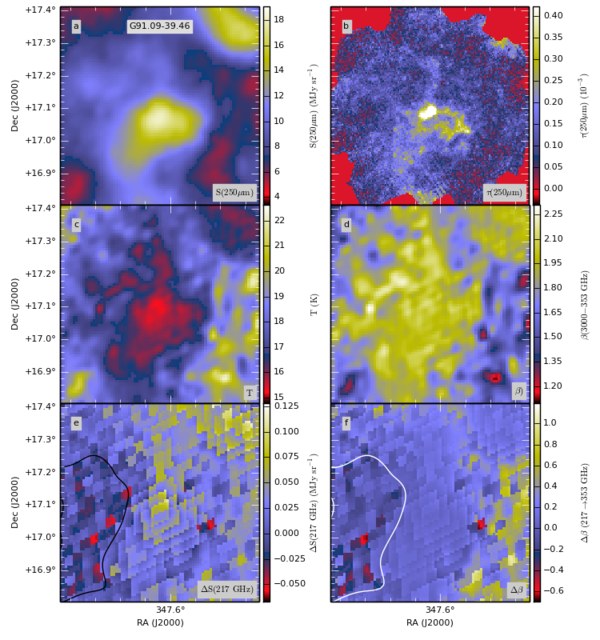
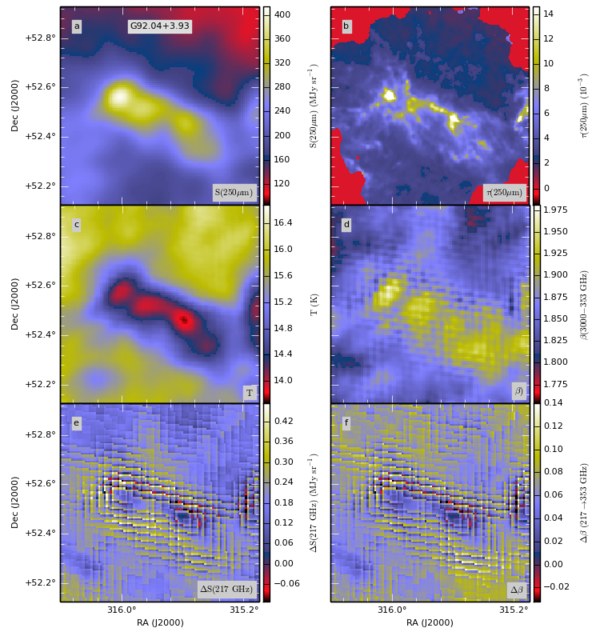
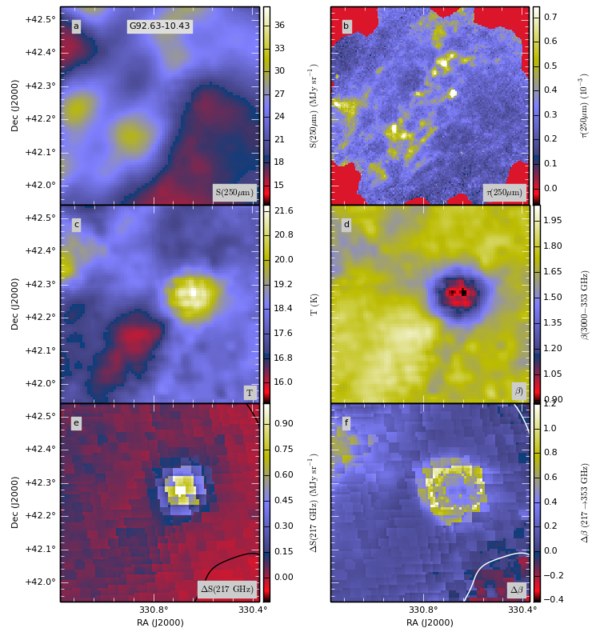
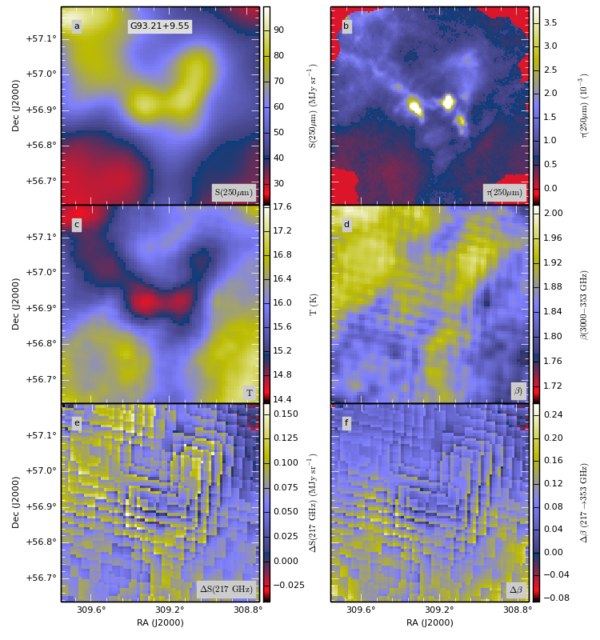
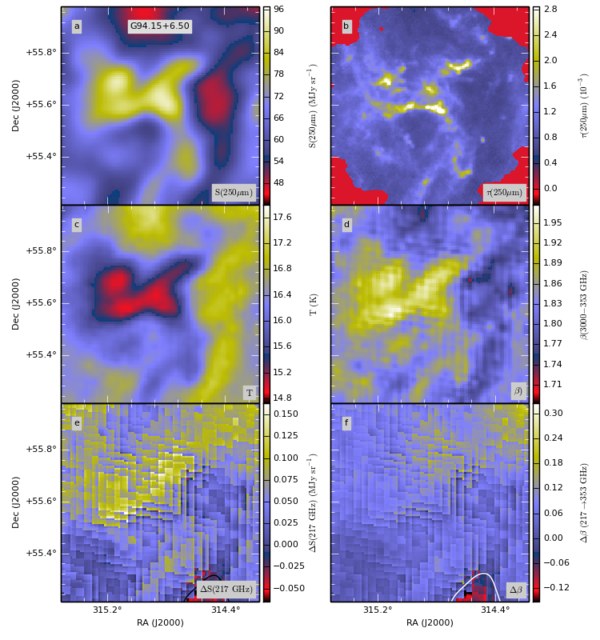
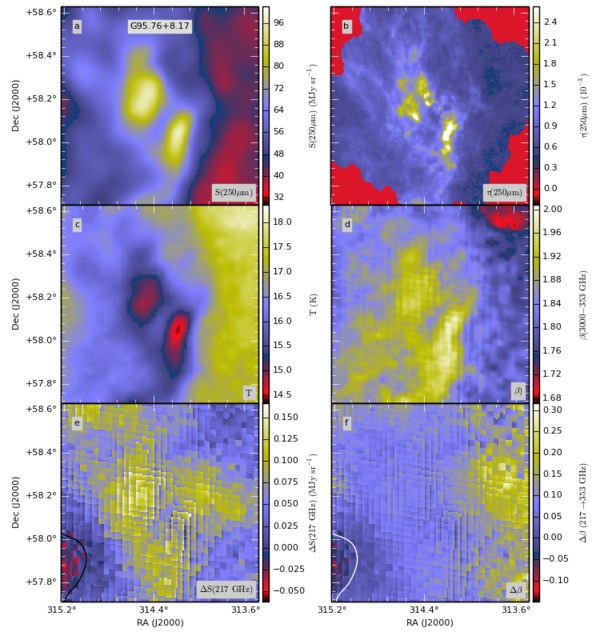
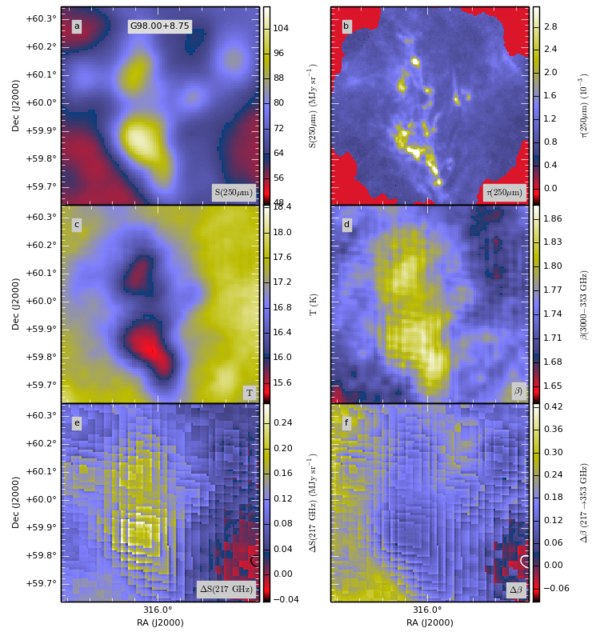
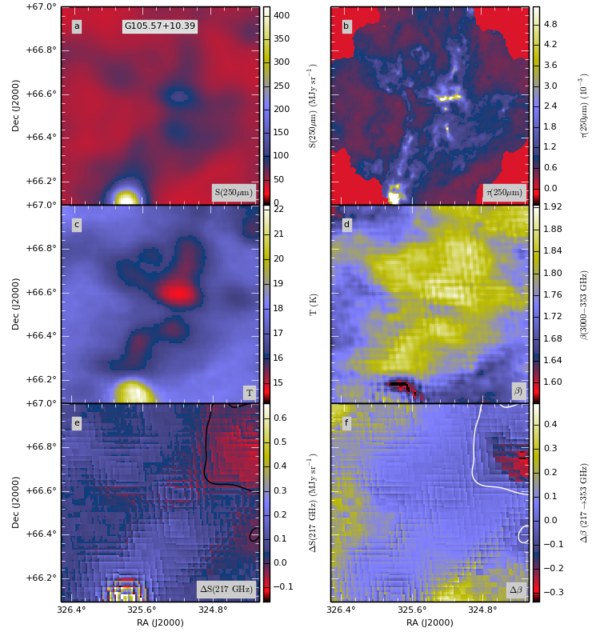
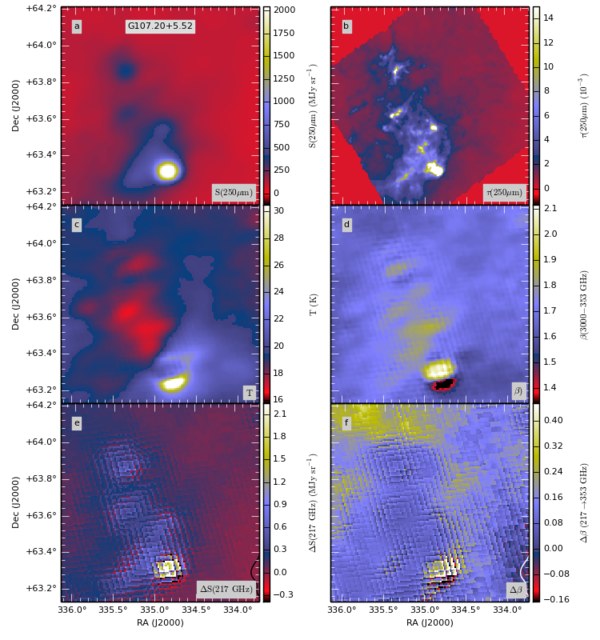
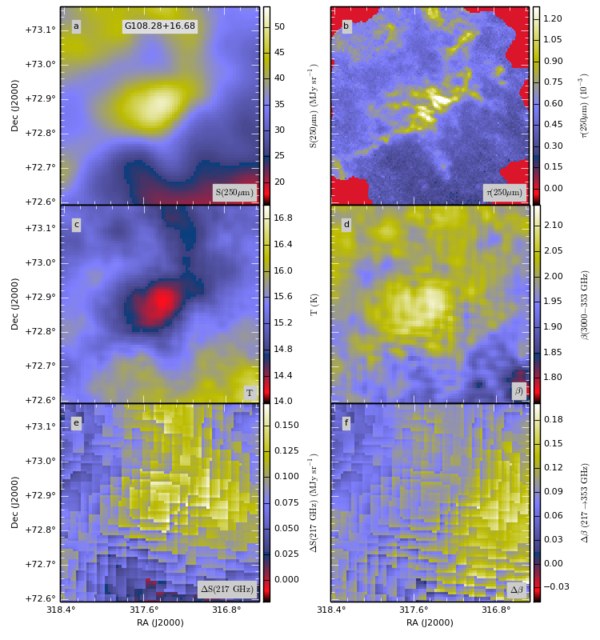
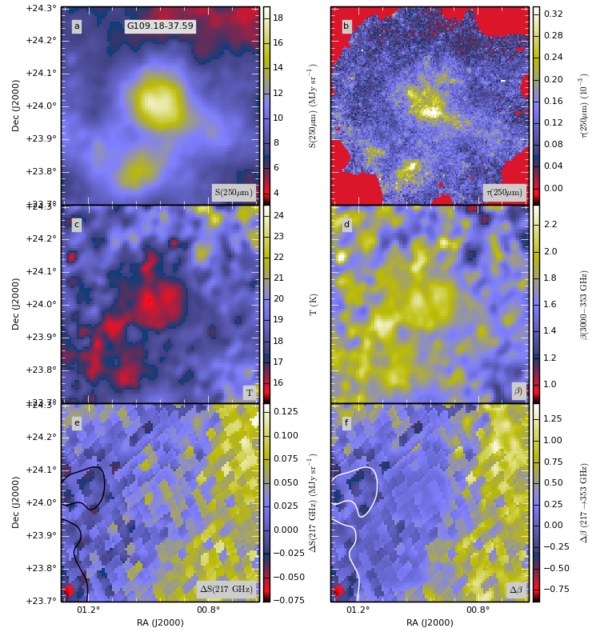
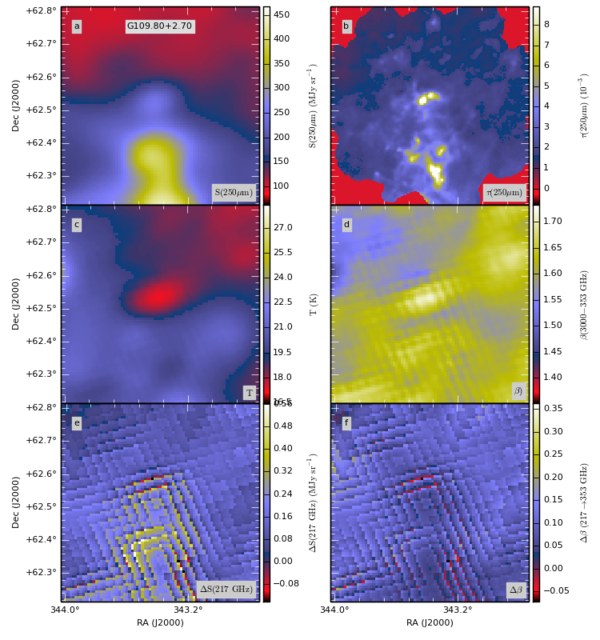
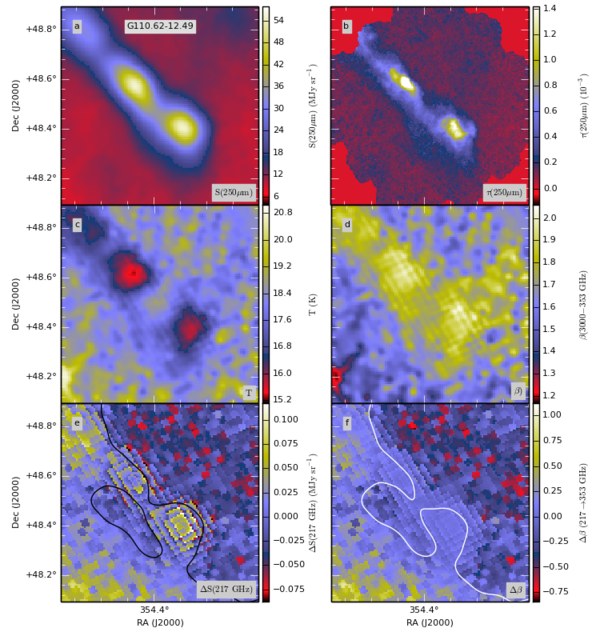
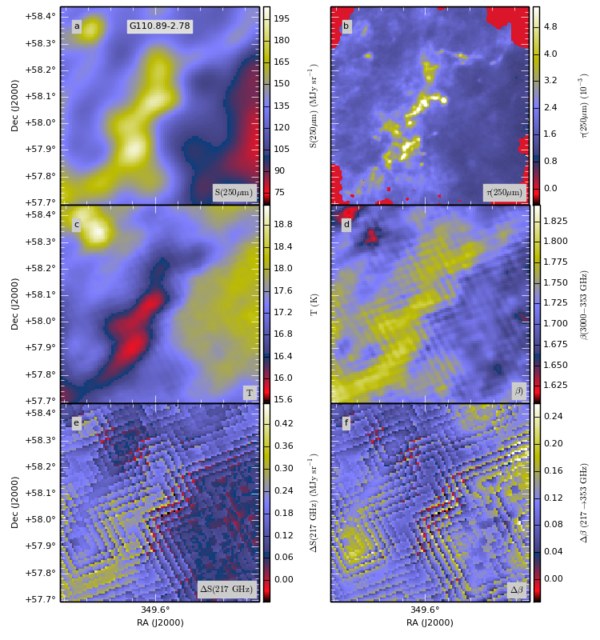
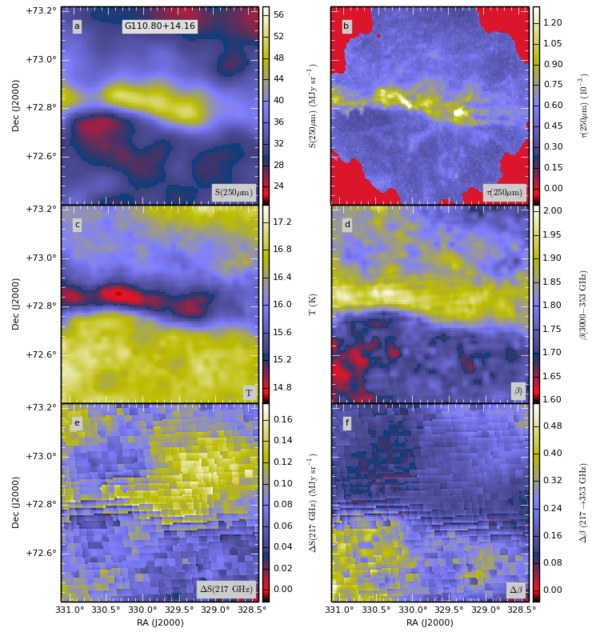
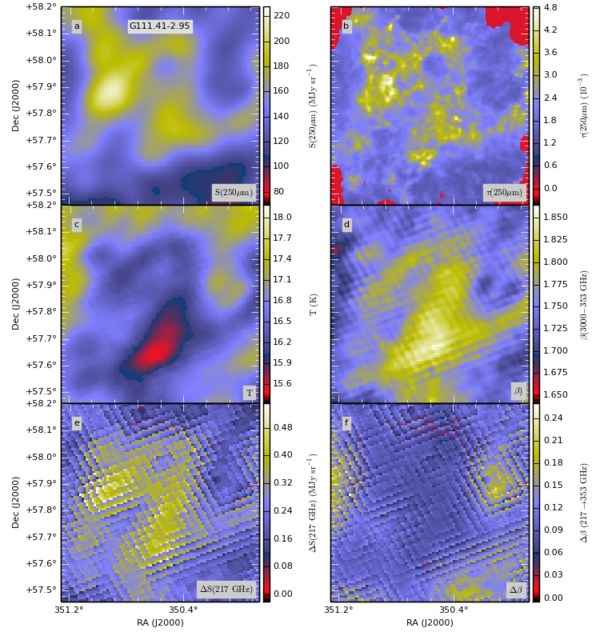
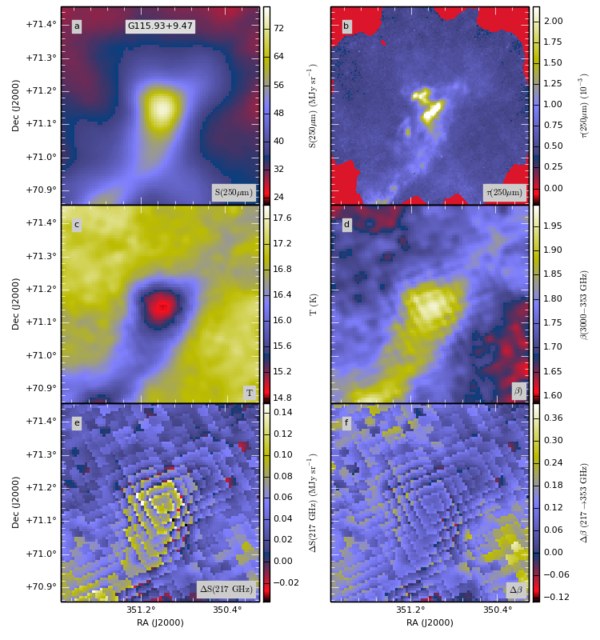
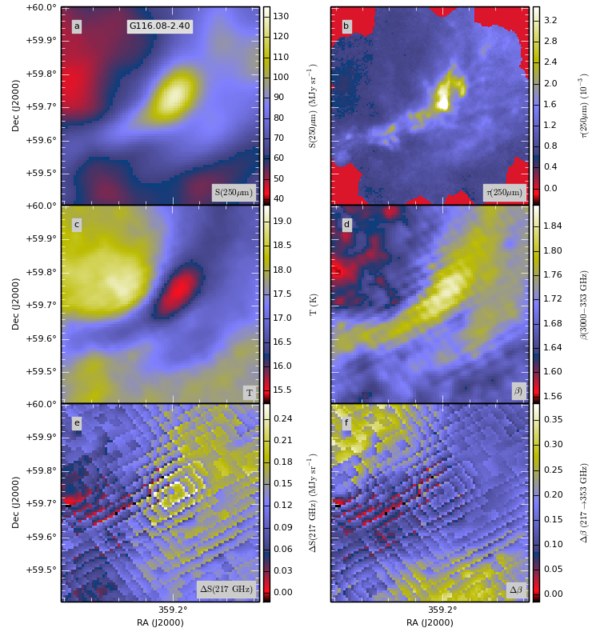
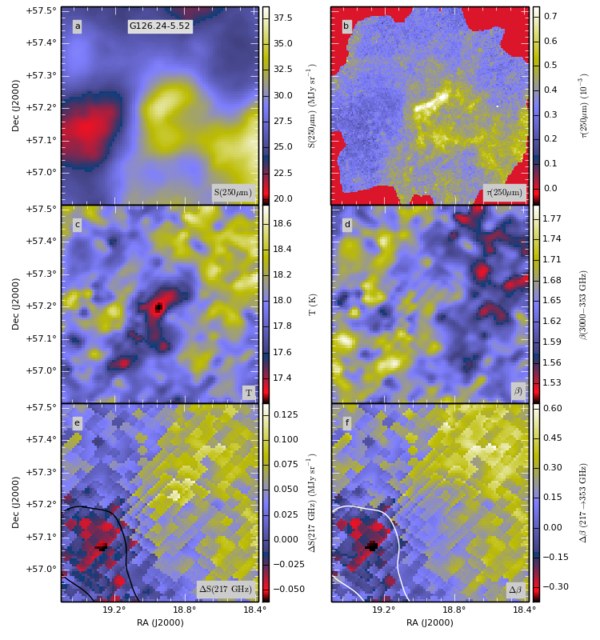
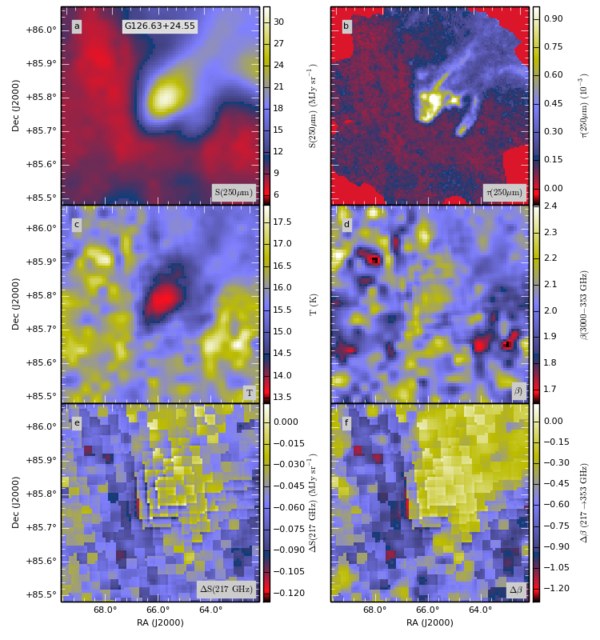
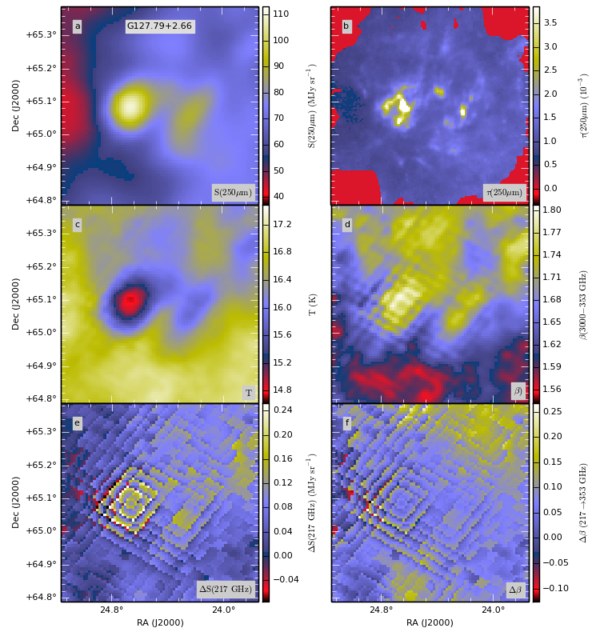
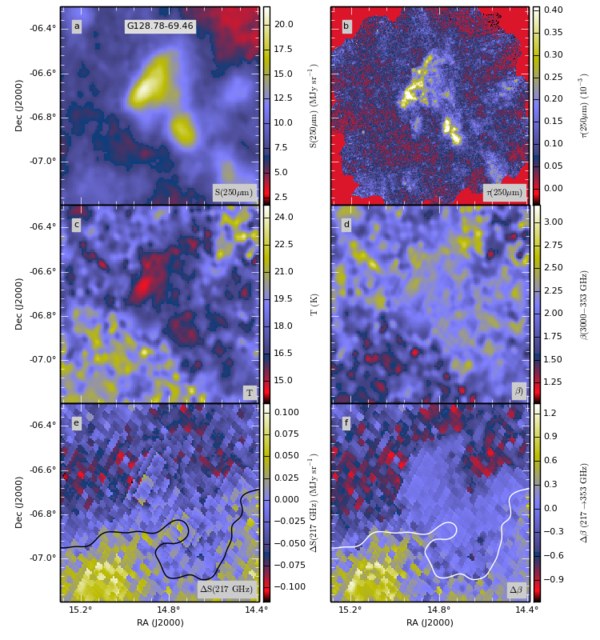
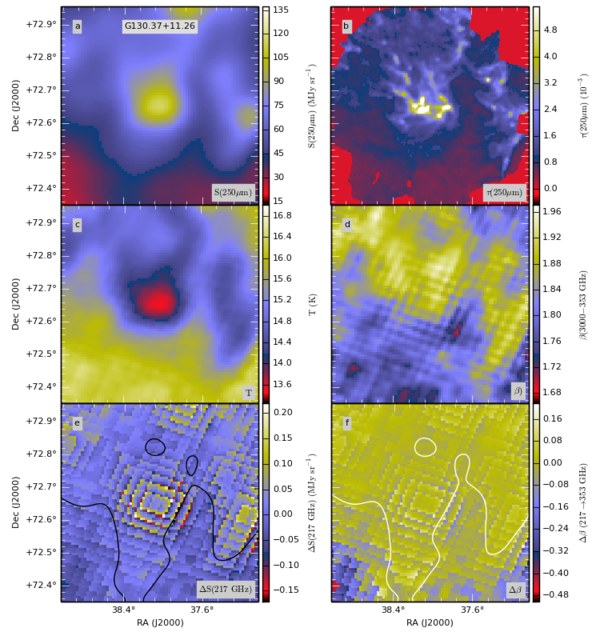
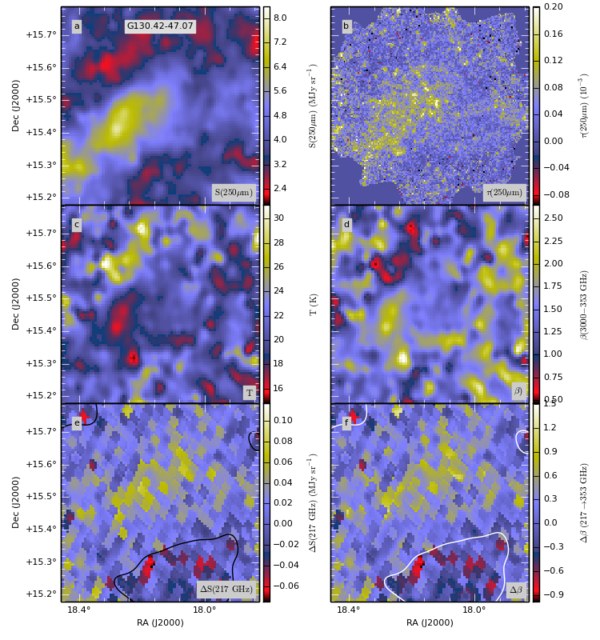
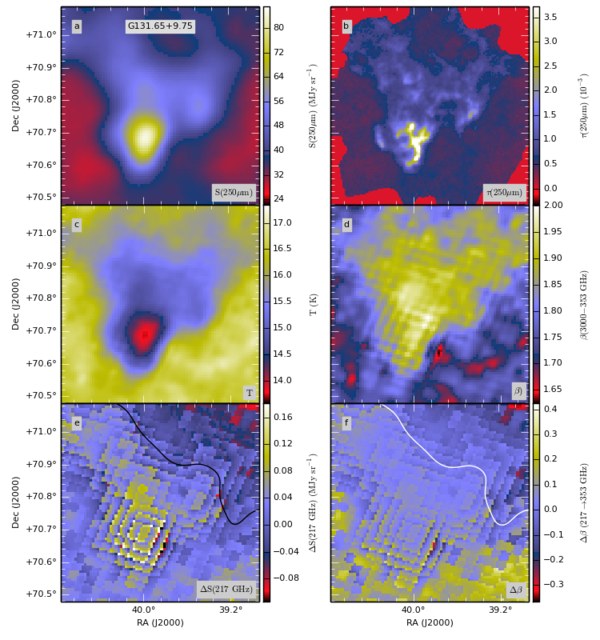
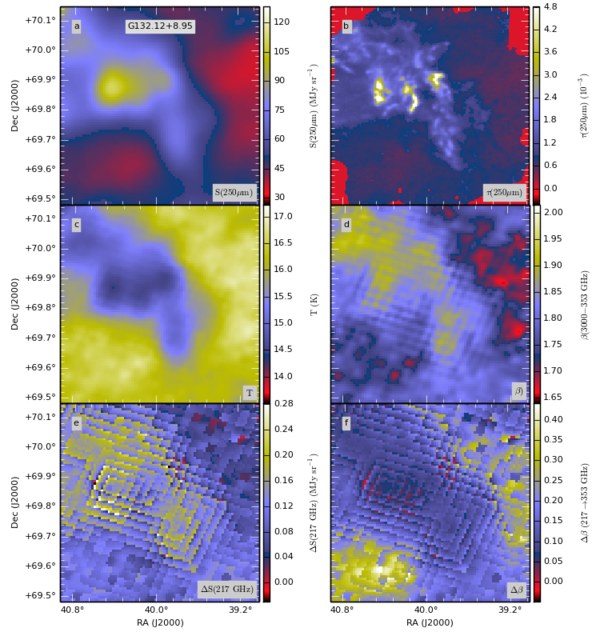
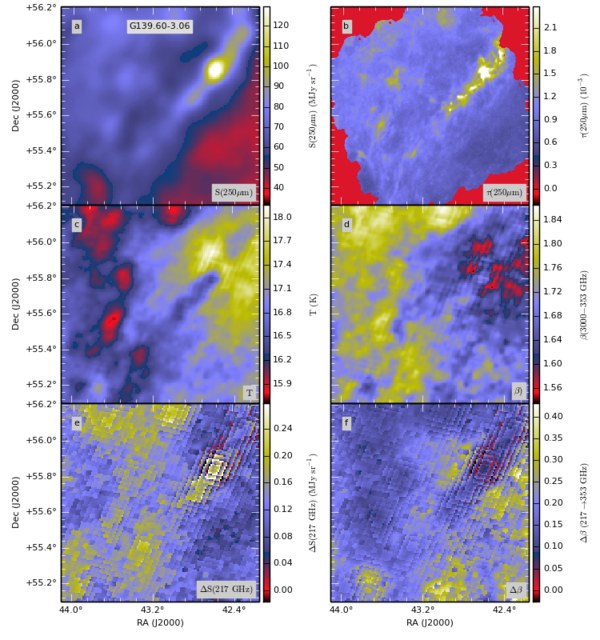
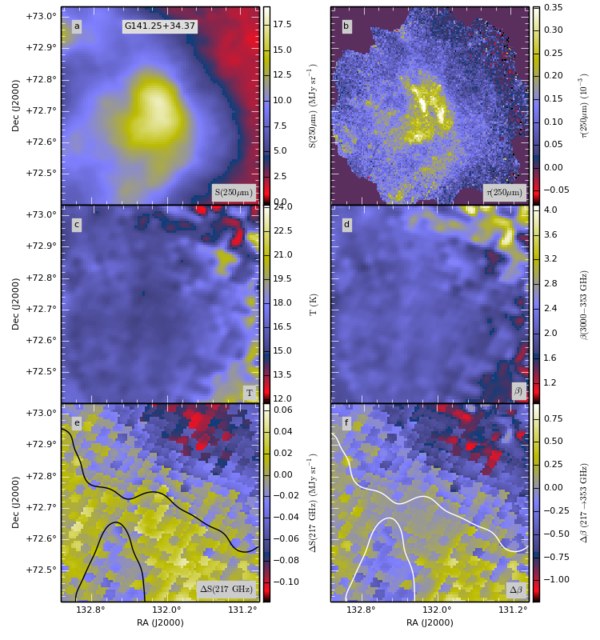
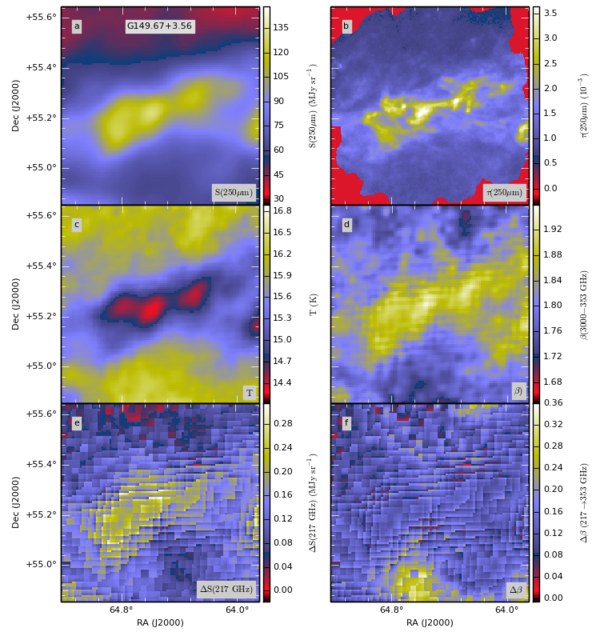
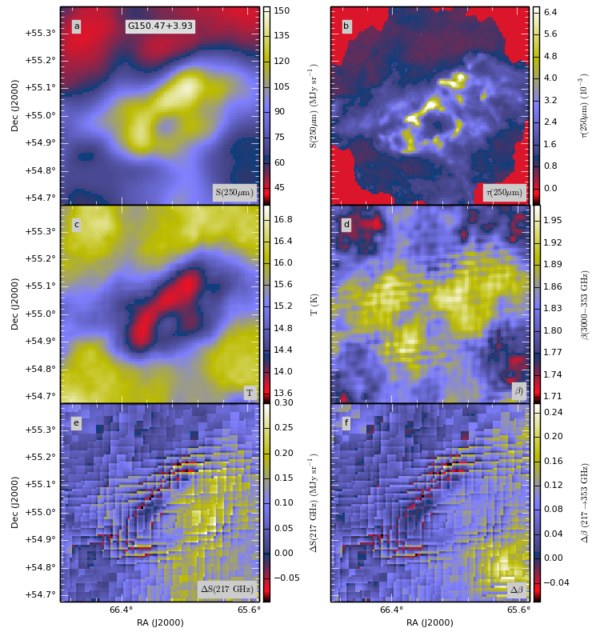
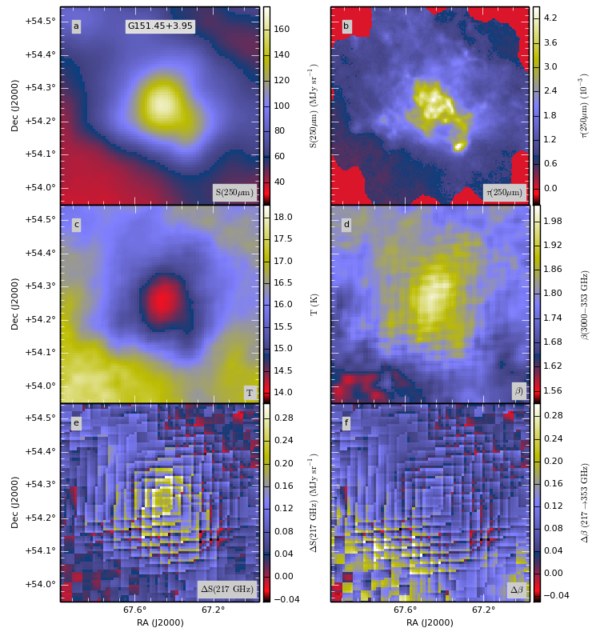
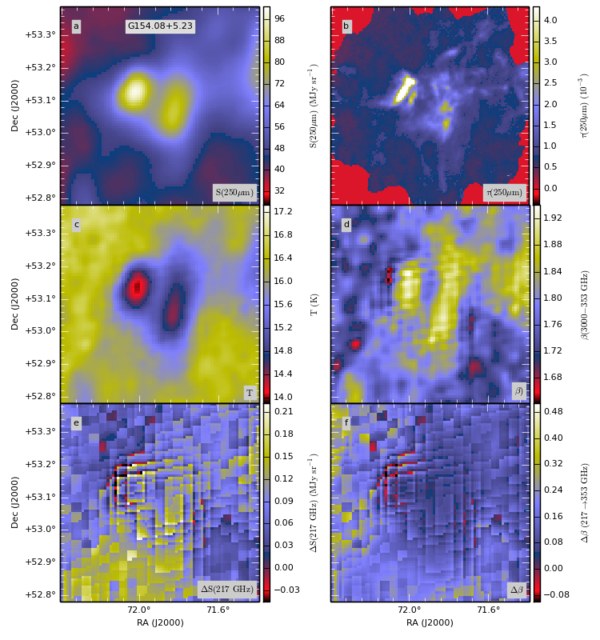
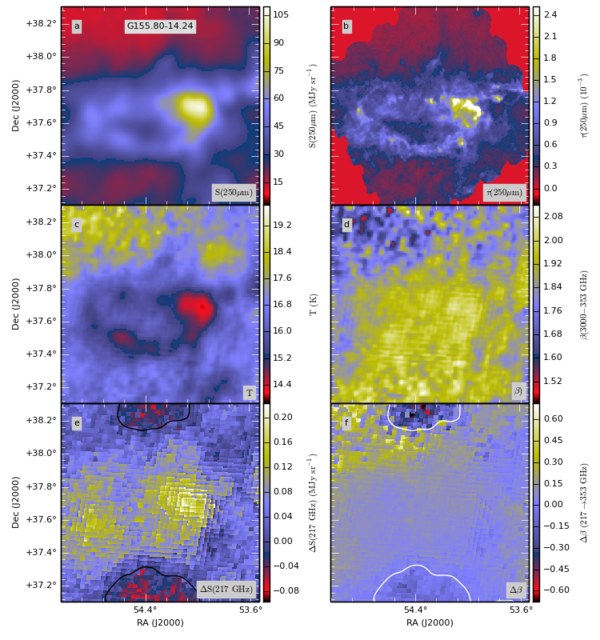
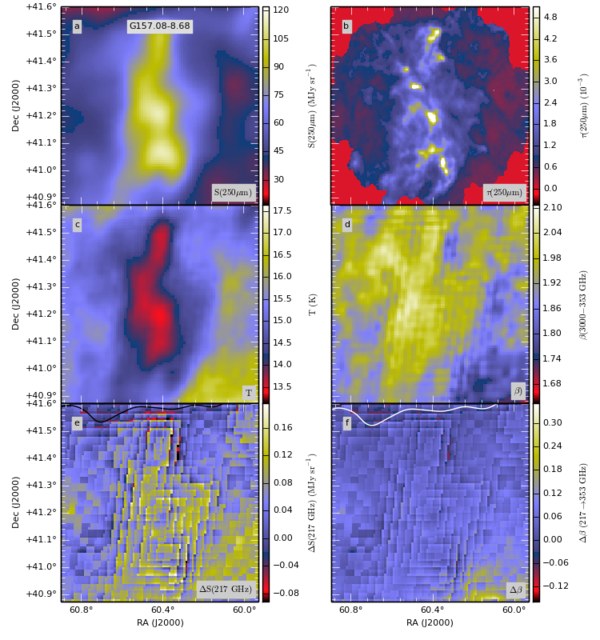
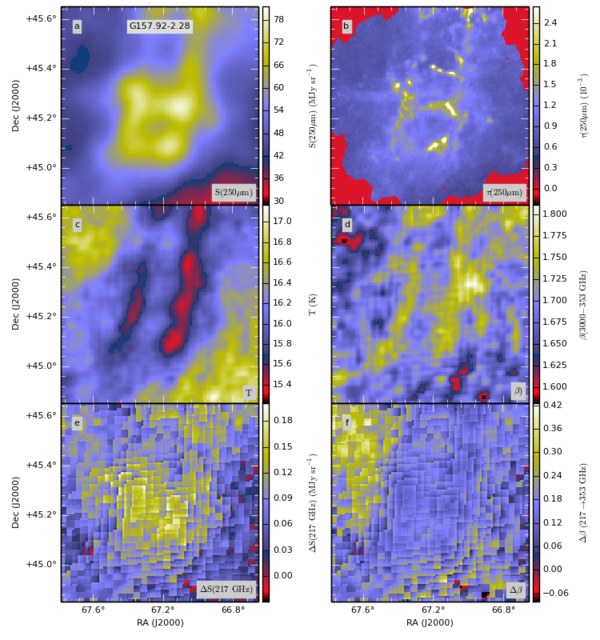
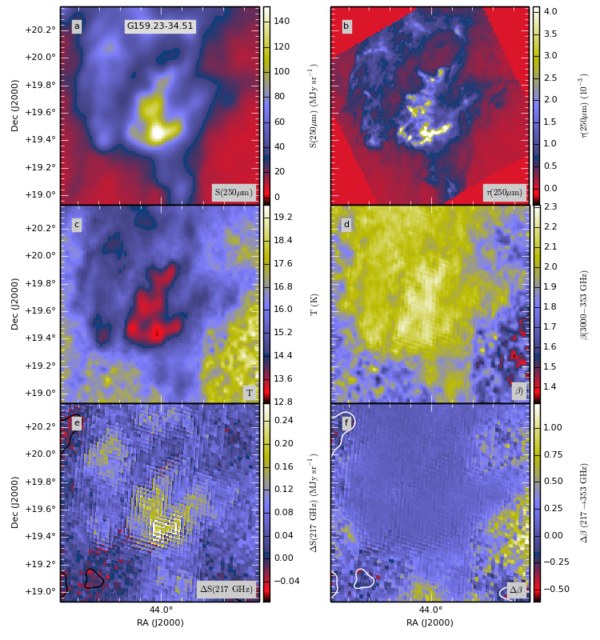
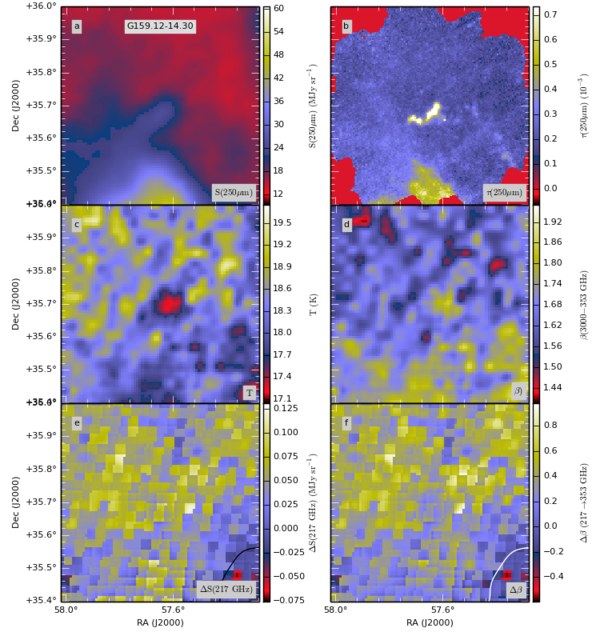
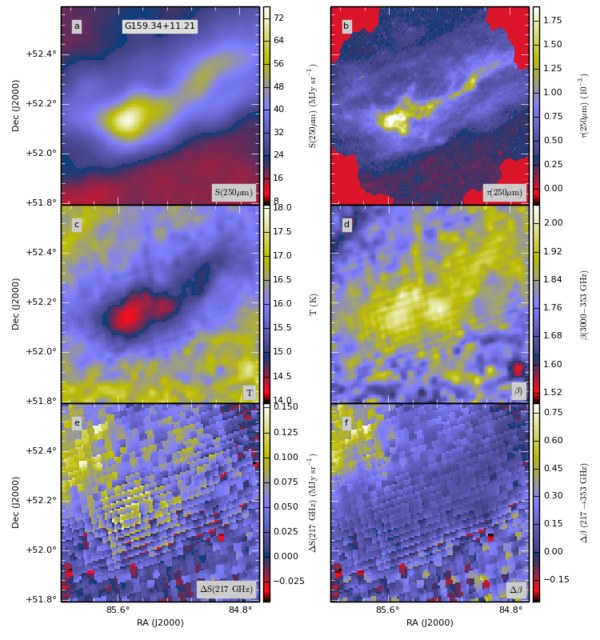
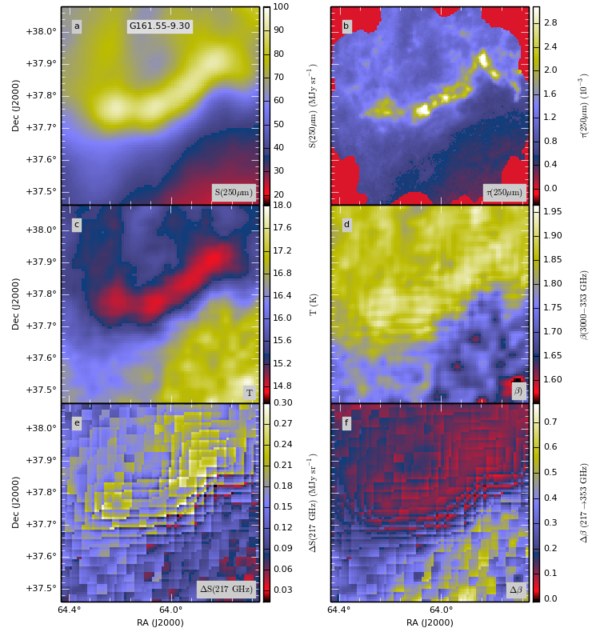
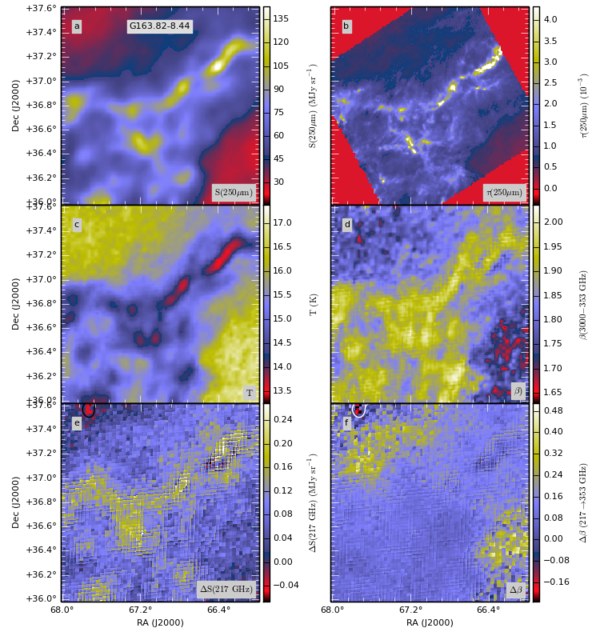
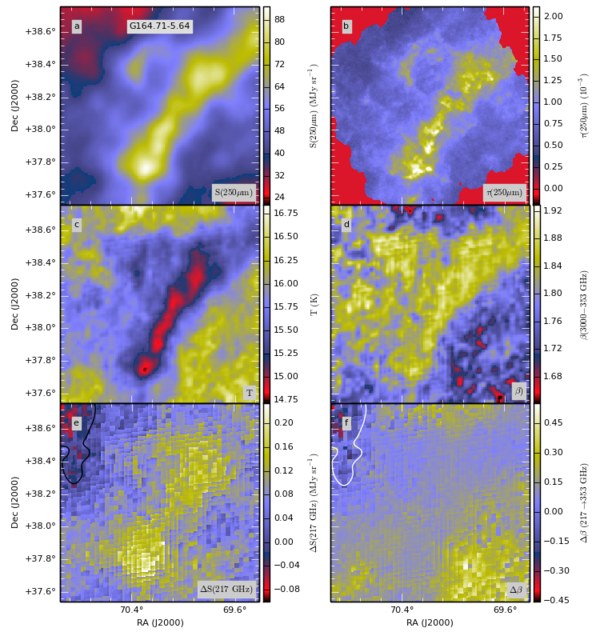
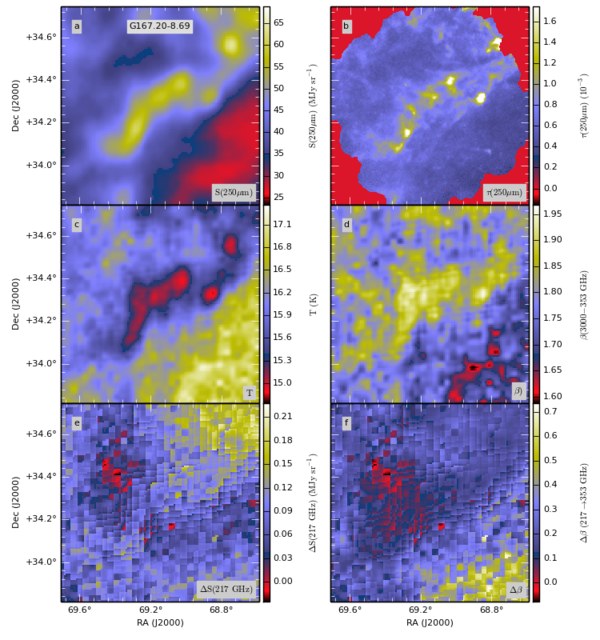
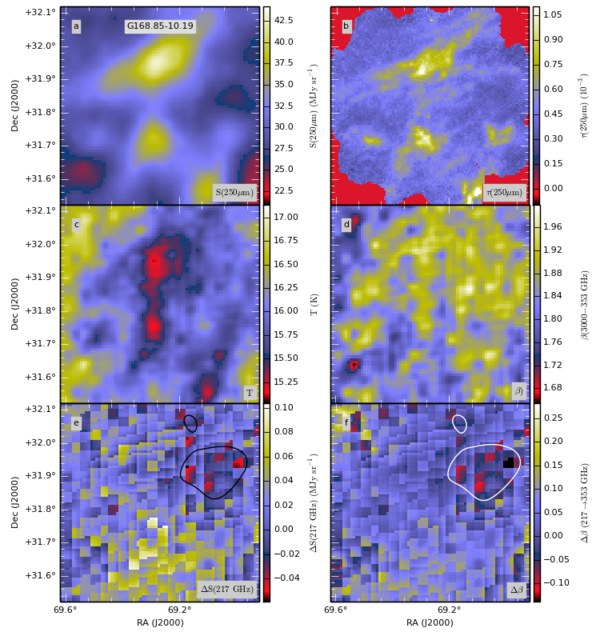
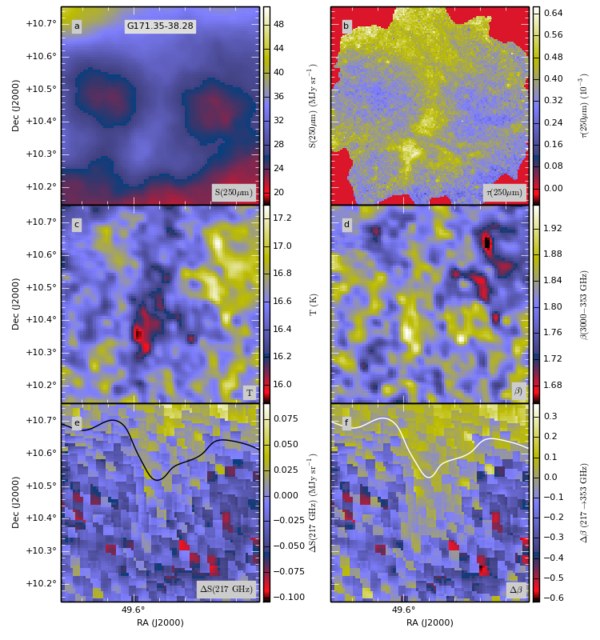
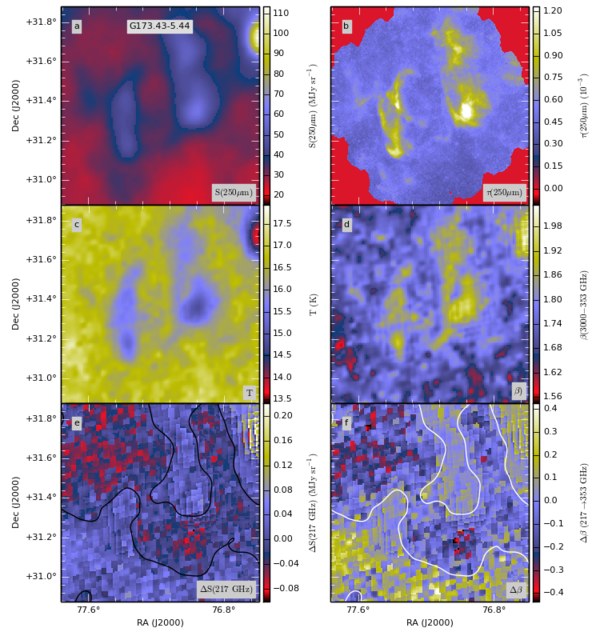
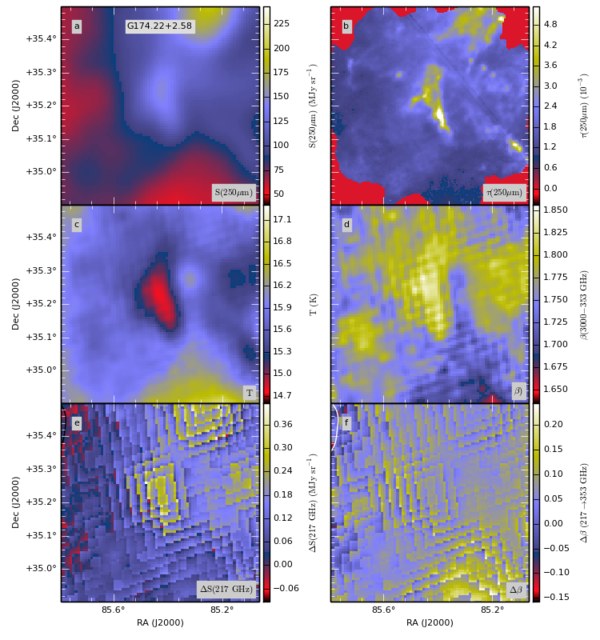
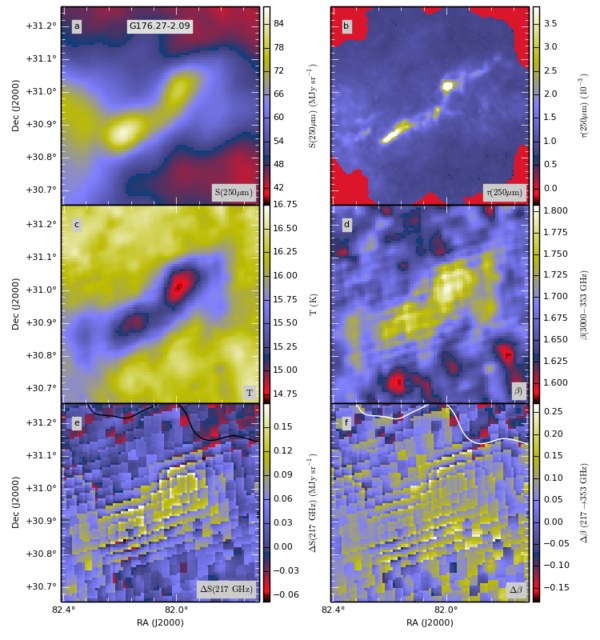
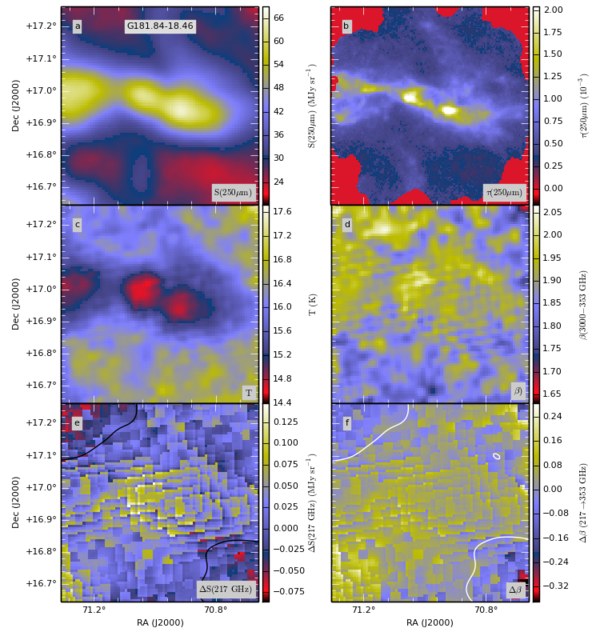
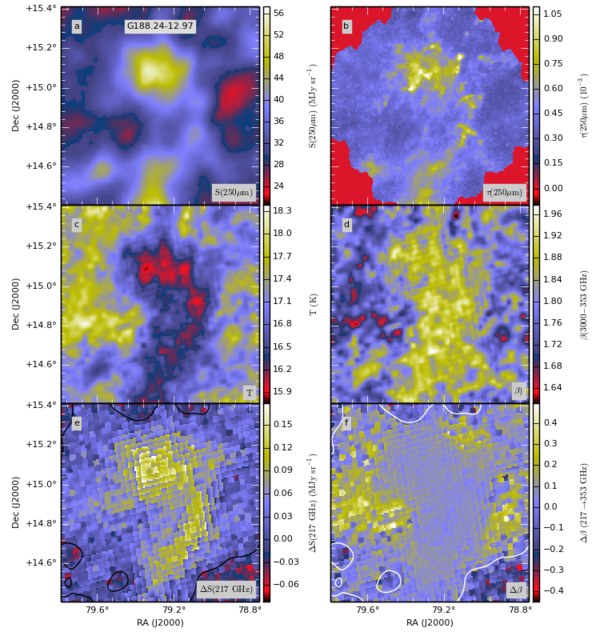
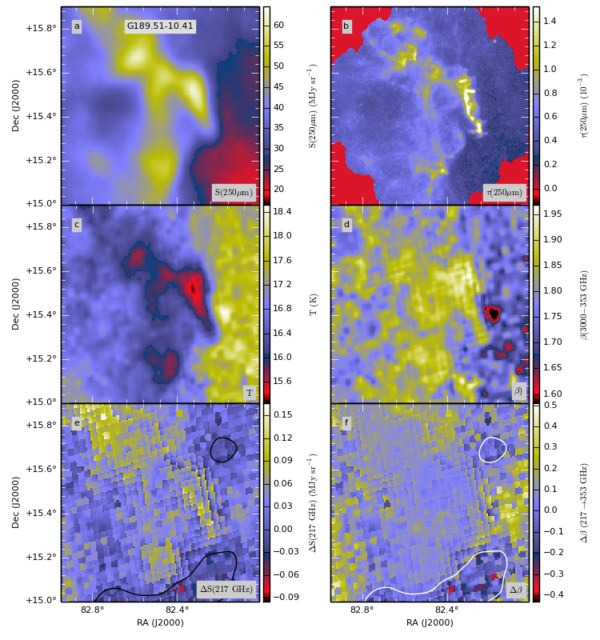
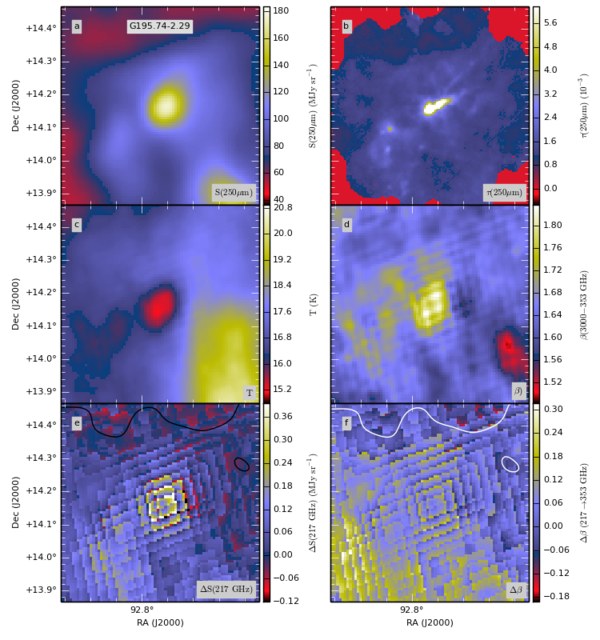
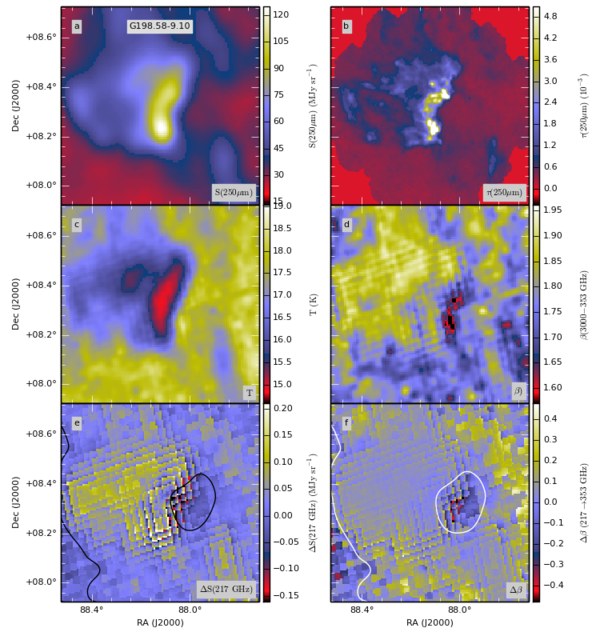
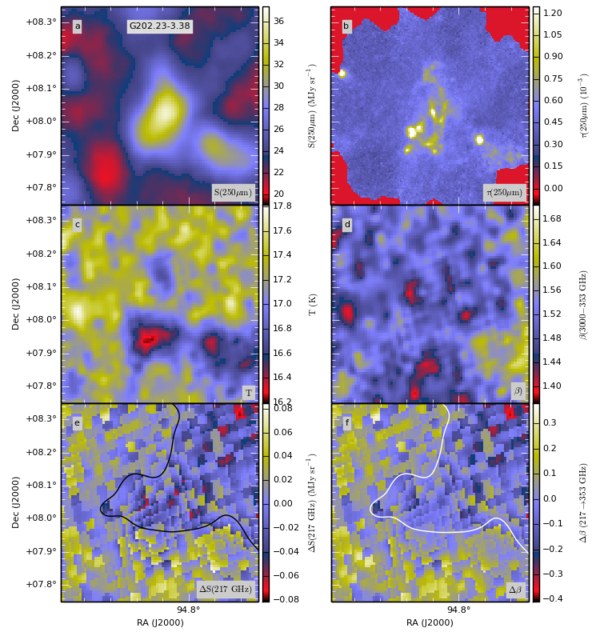
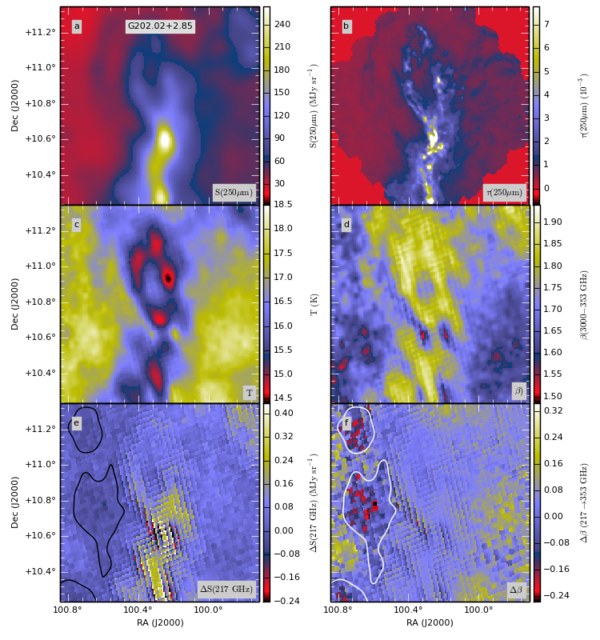
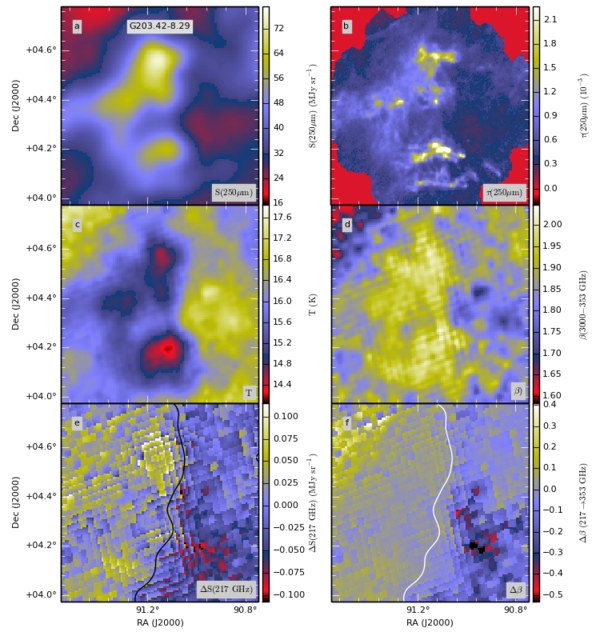
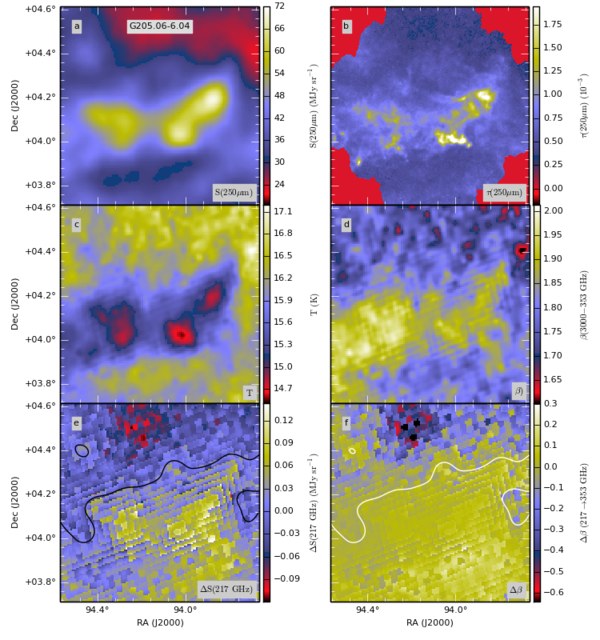
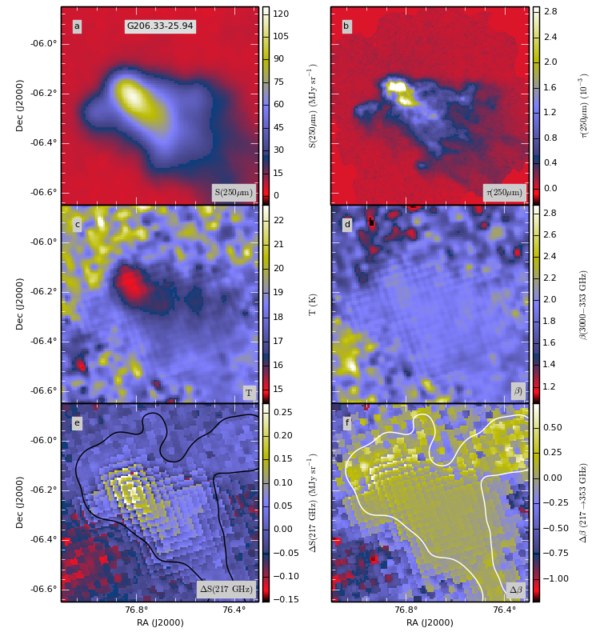
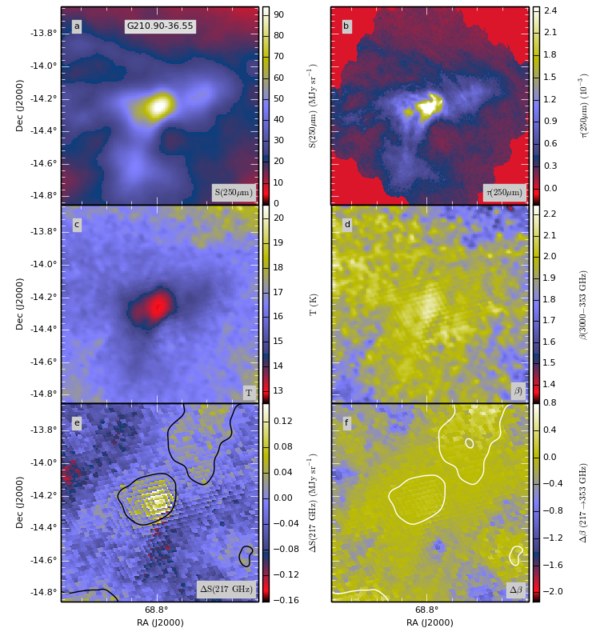
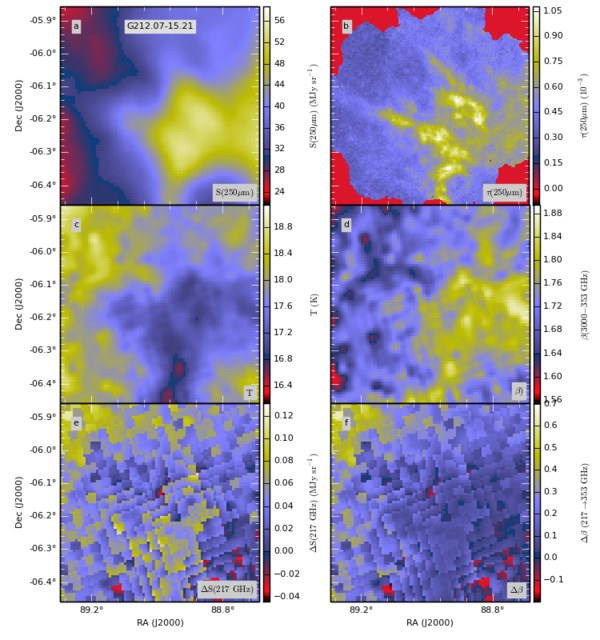
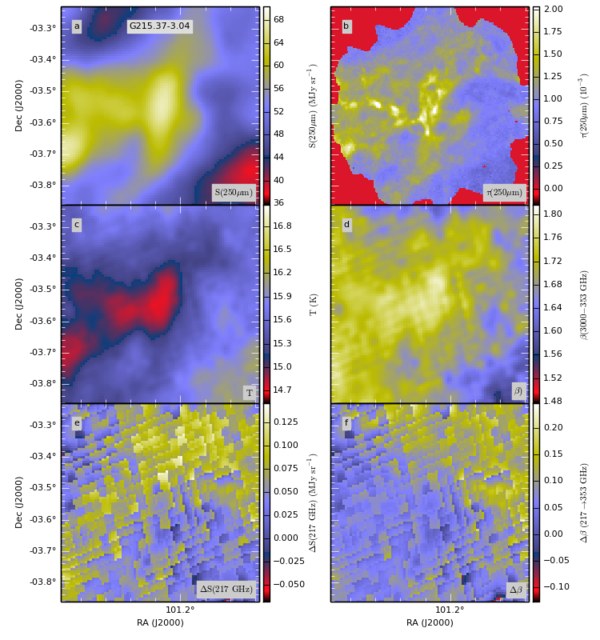
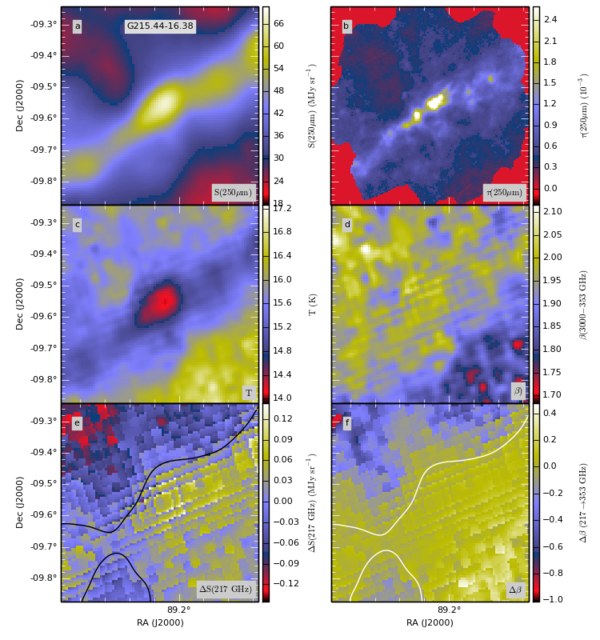
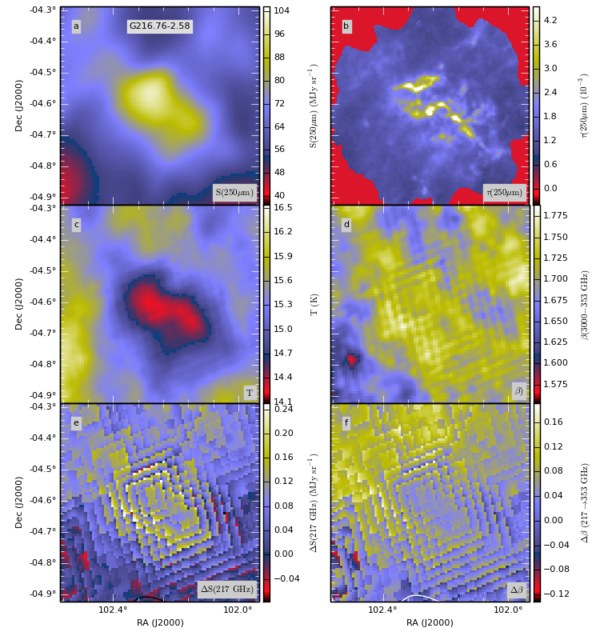
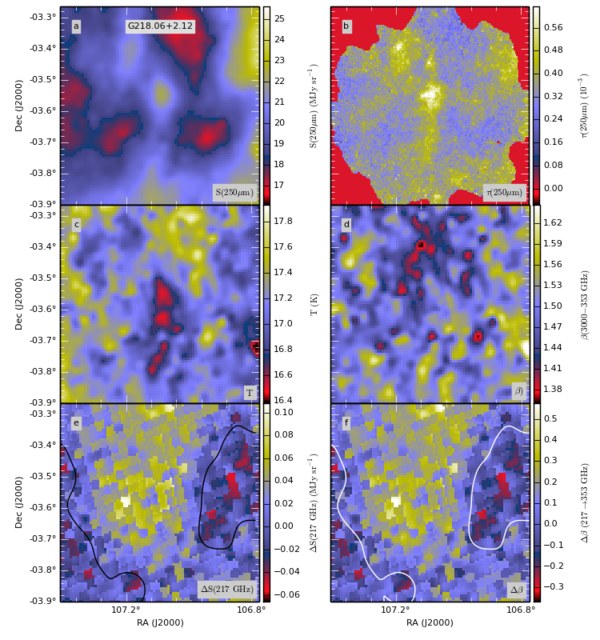
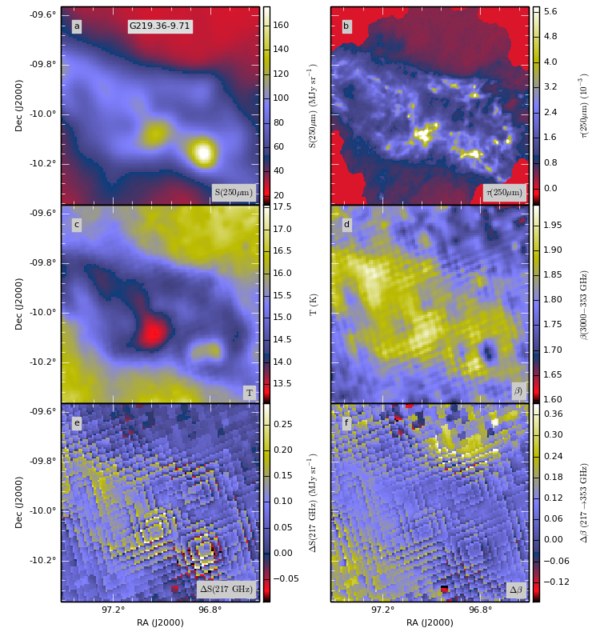
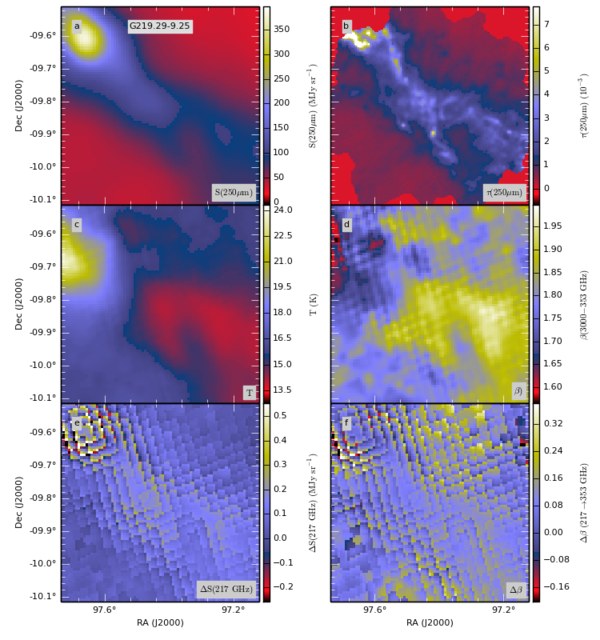
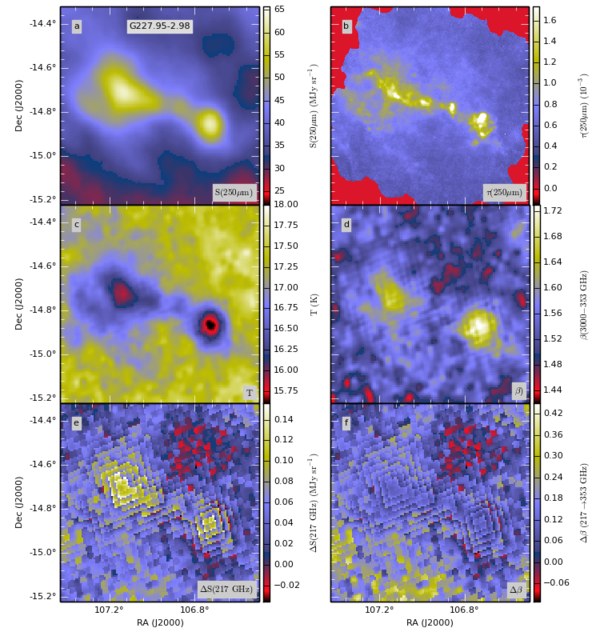
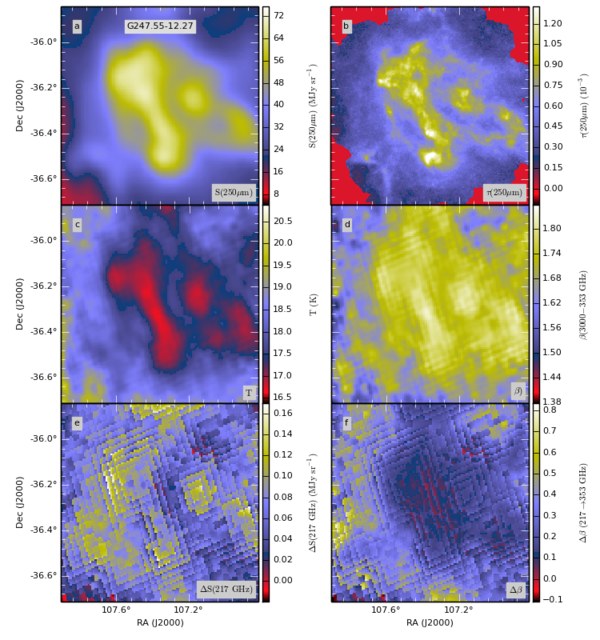
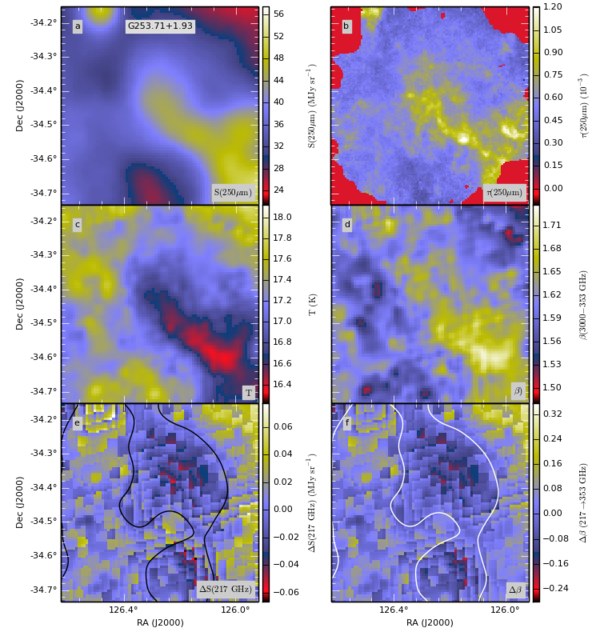
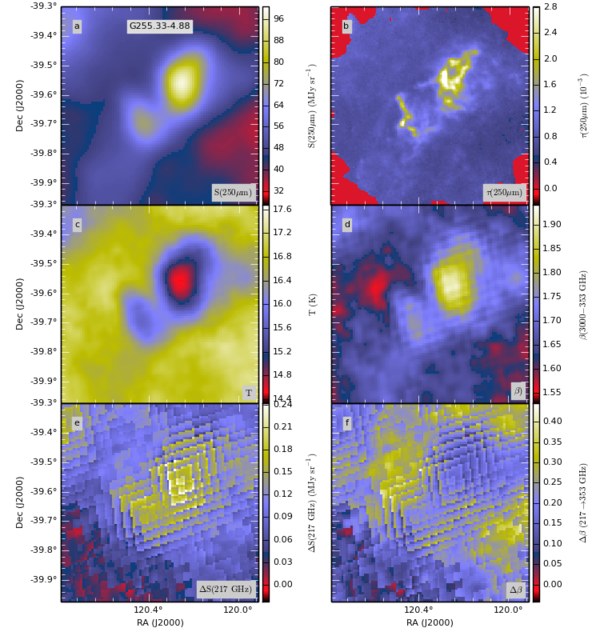
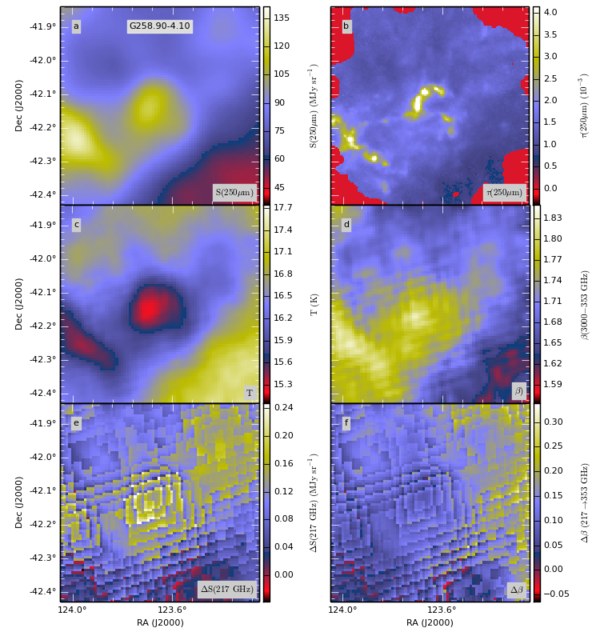
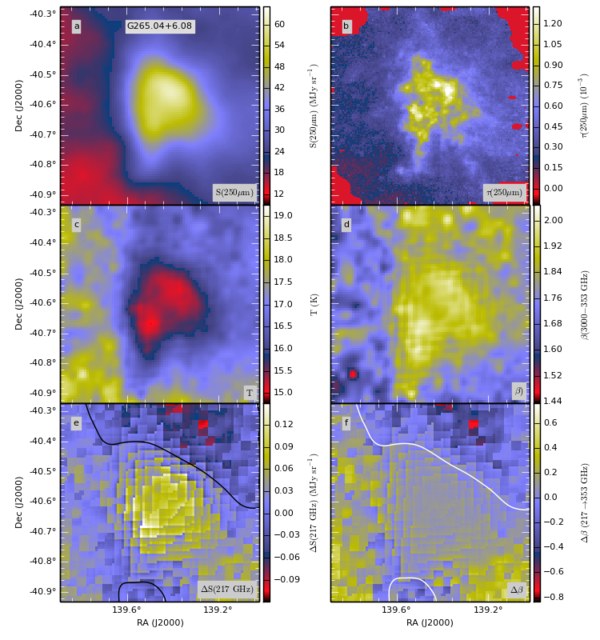
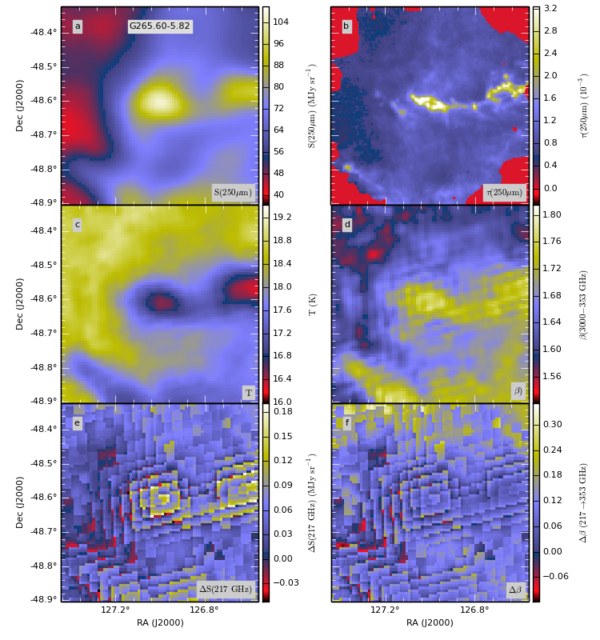
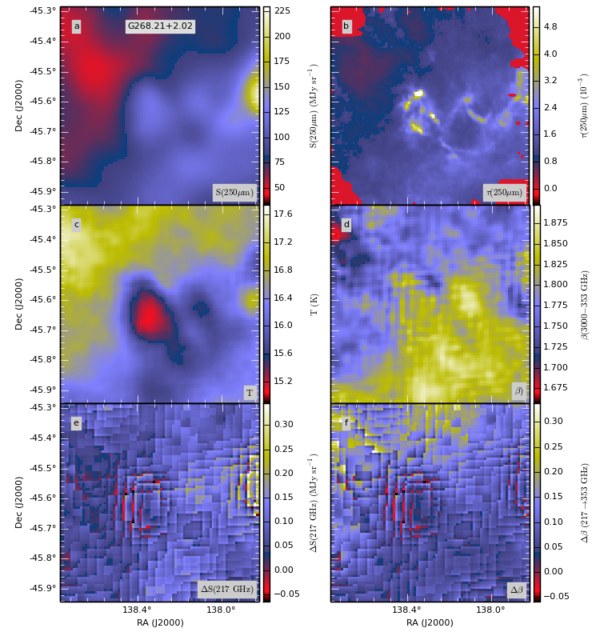
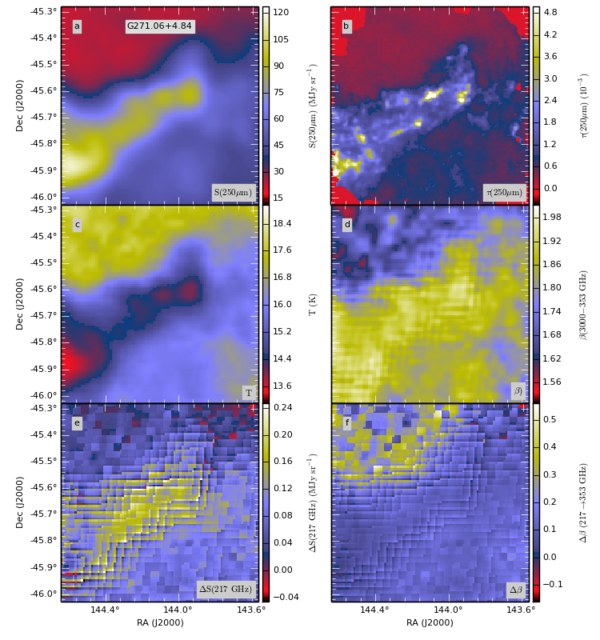
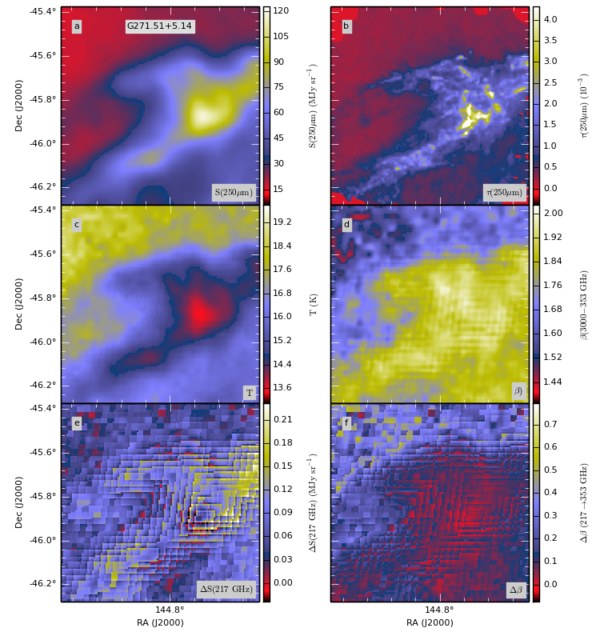
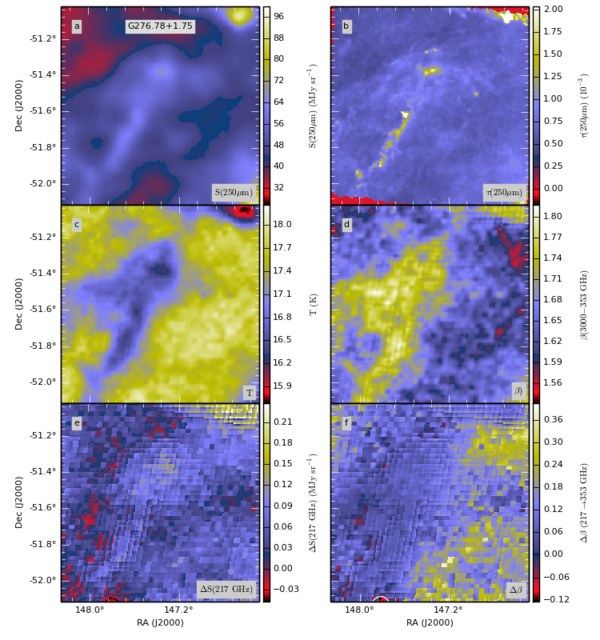
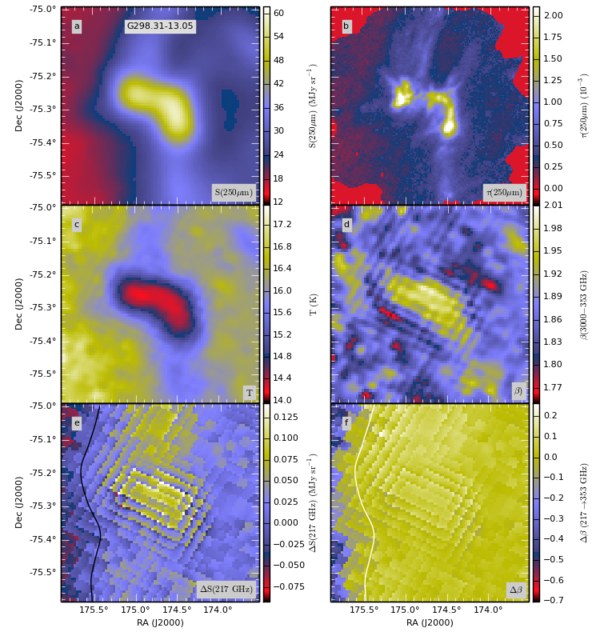
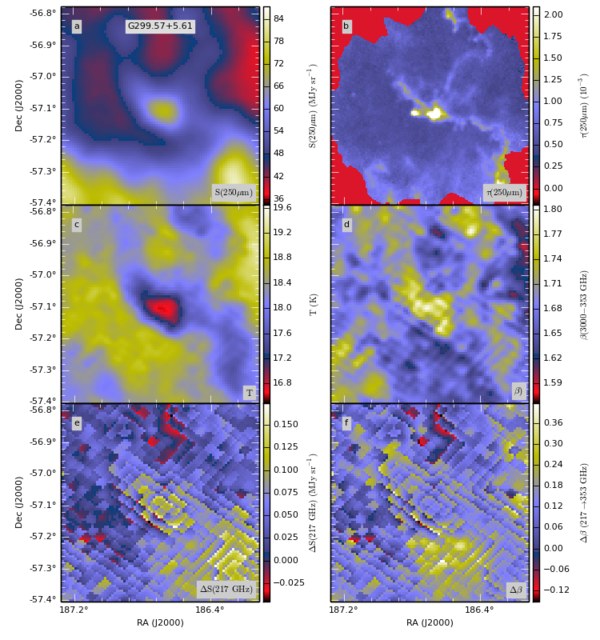
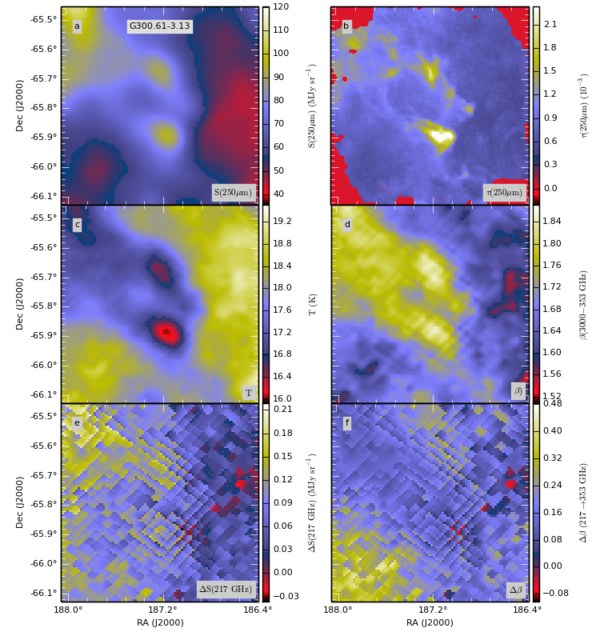

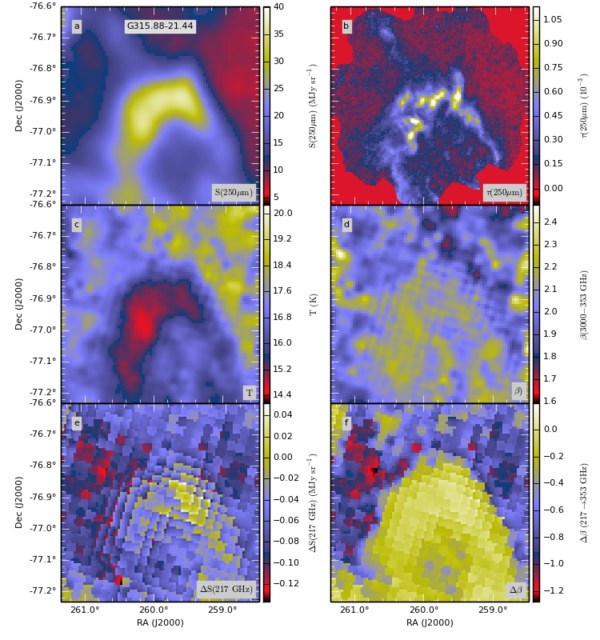
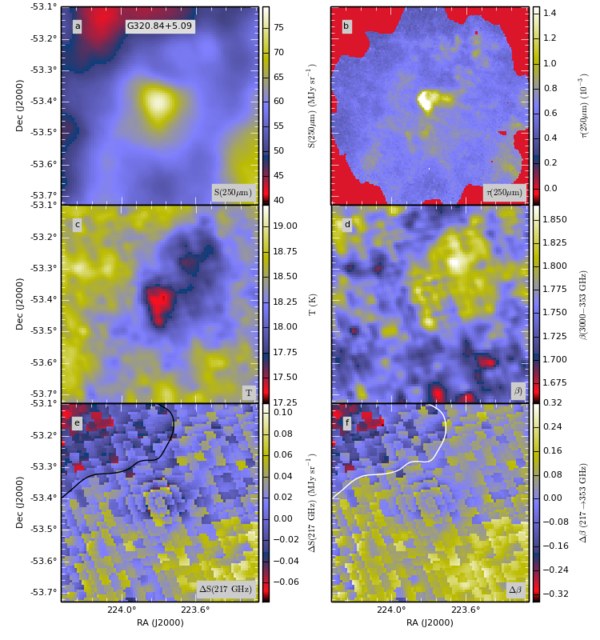
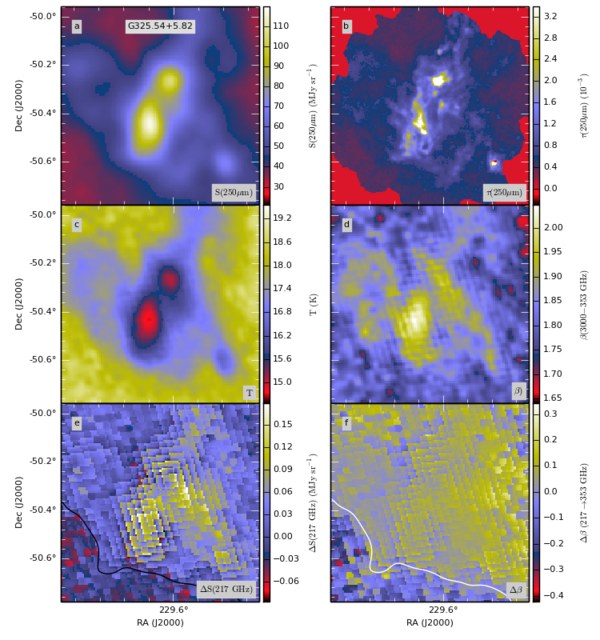
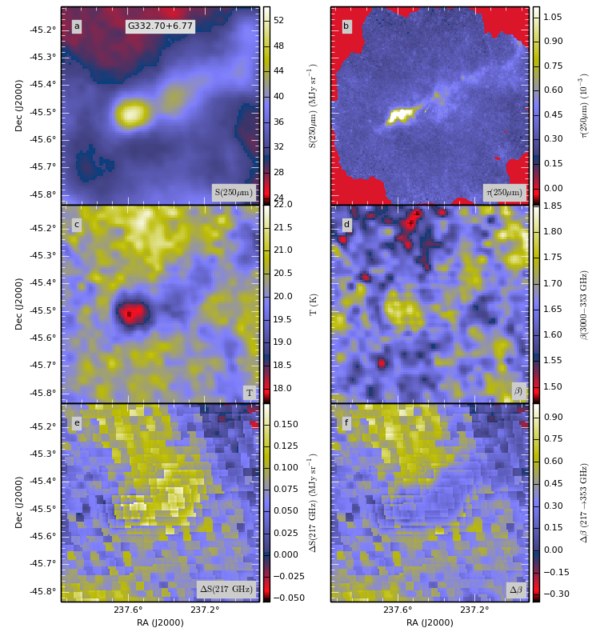
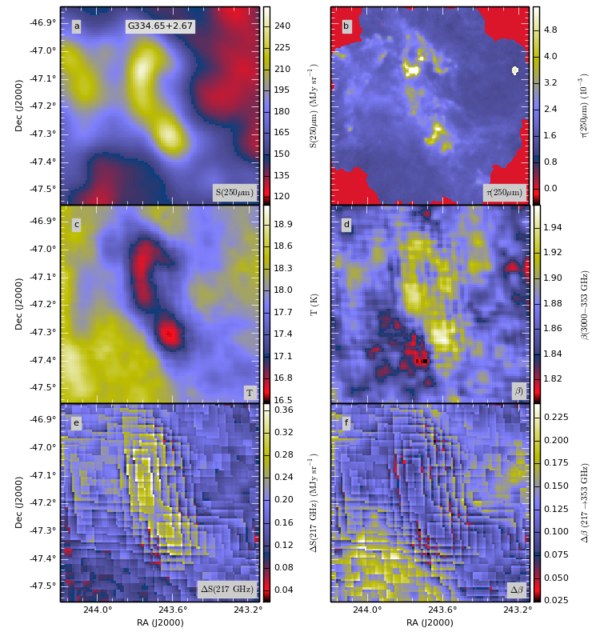
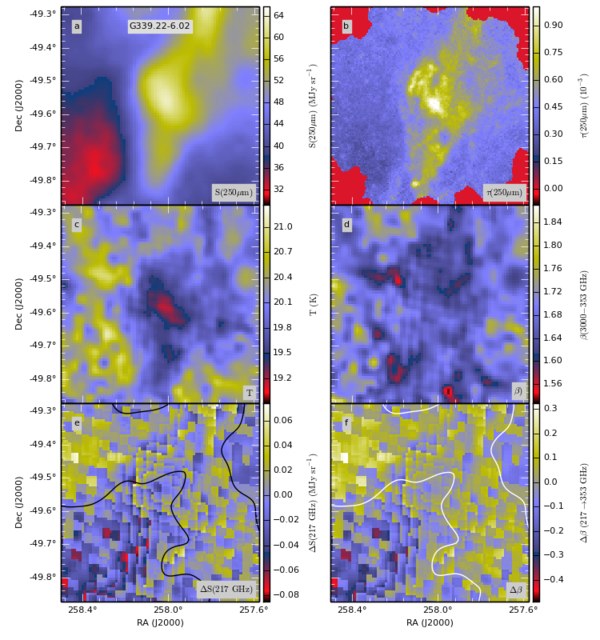
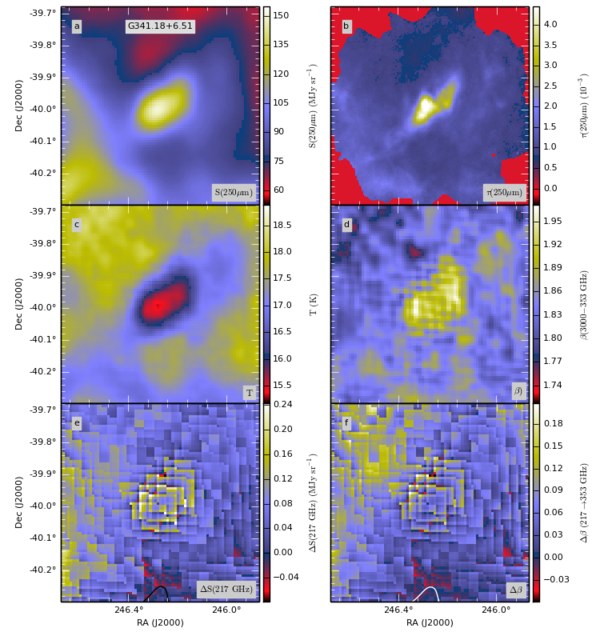
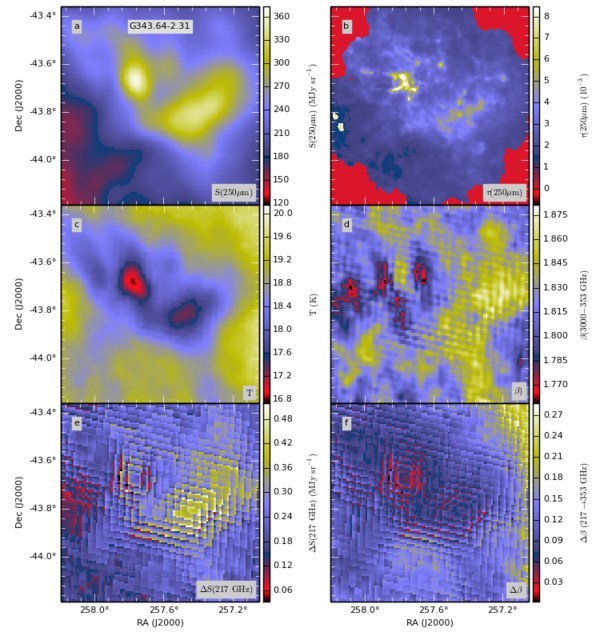
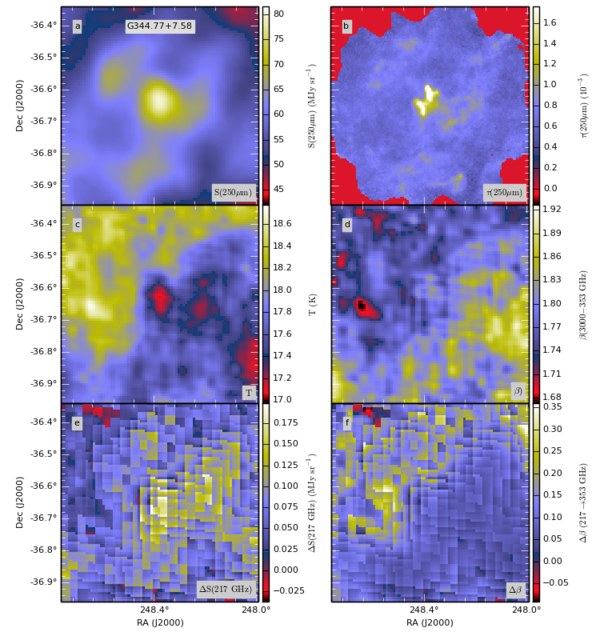
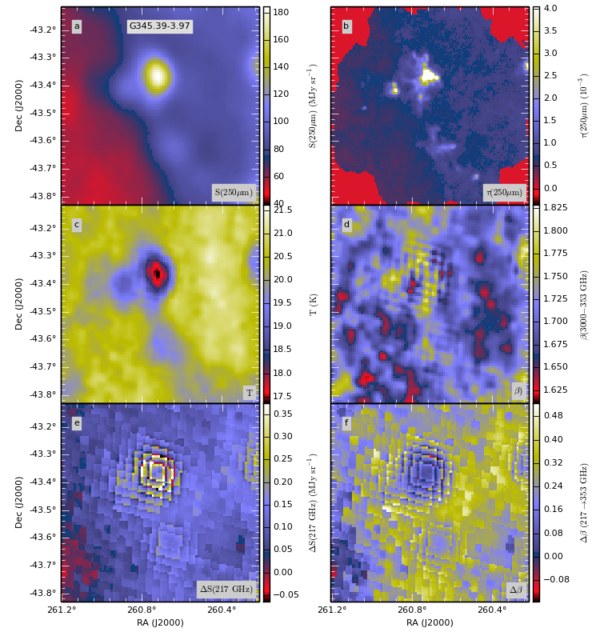
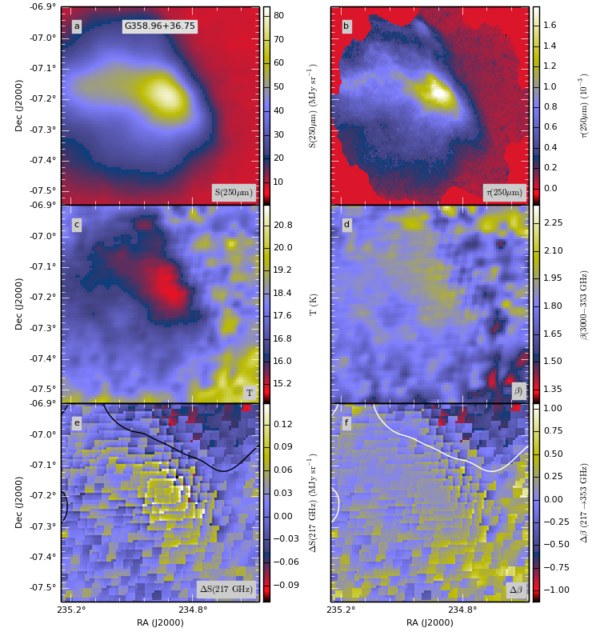
Appendix C Maps of (, ) with Herschel data
The figures 90–204 show the colour temperature and spectral index maps calculated with Herschel data. The figures include results derived with both 160–500 m and 250–500 m data.
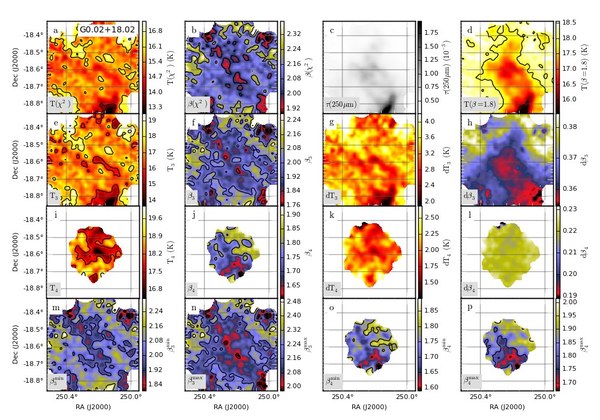
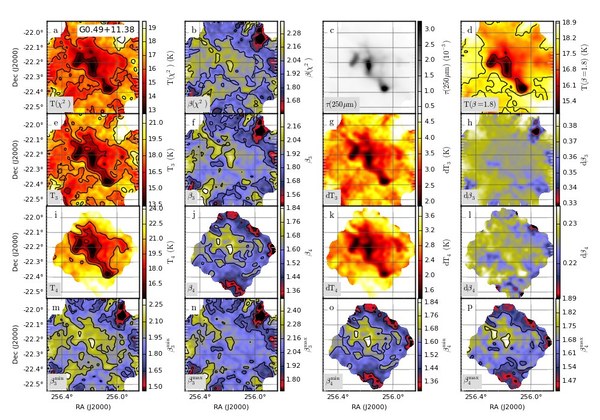
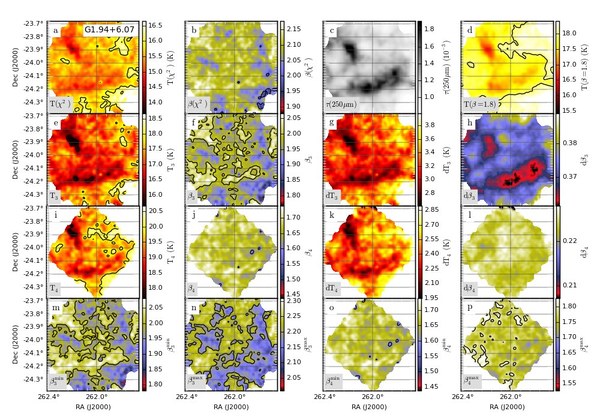
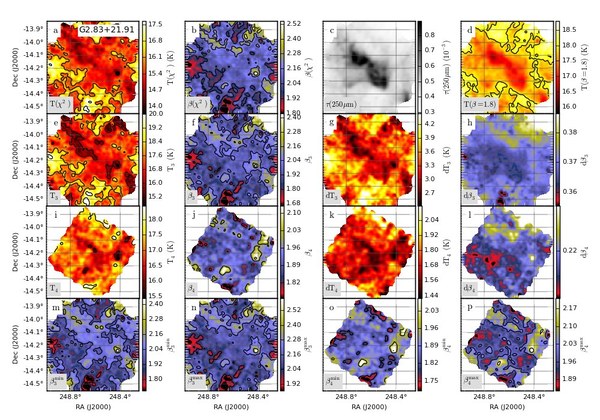
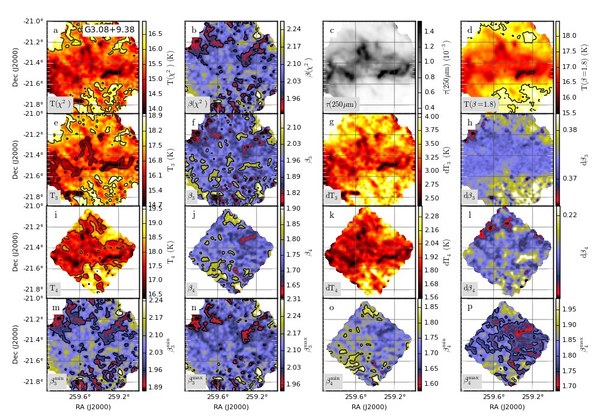
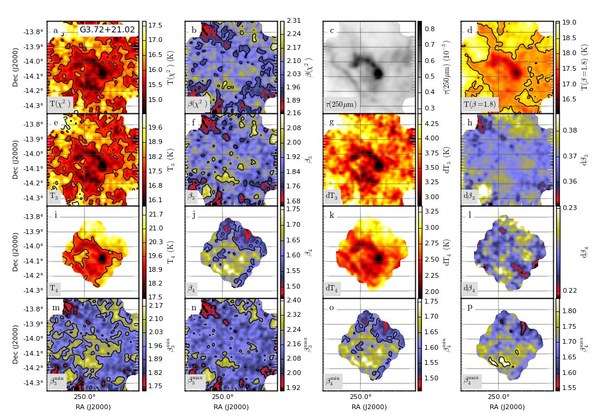
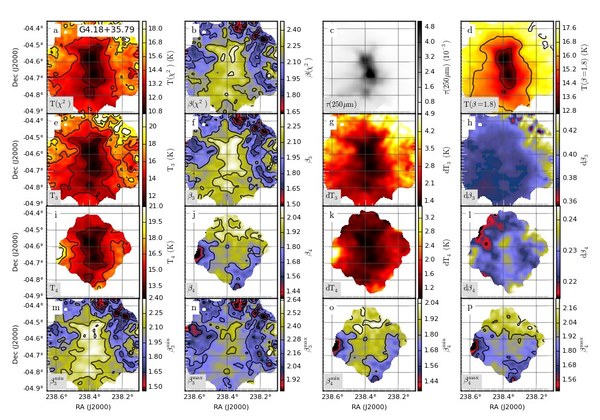
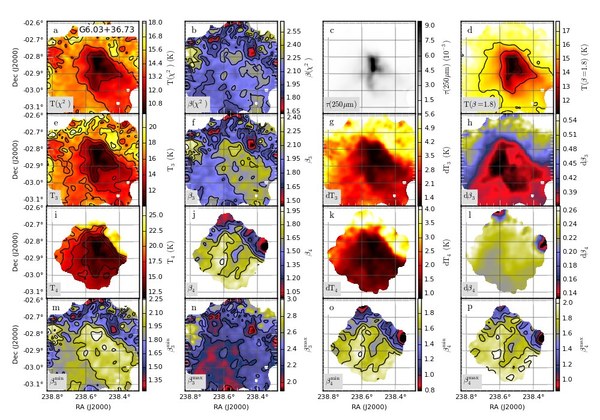
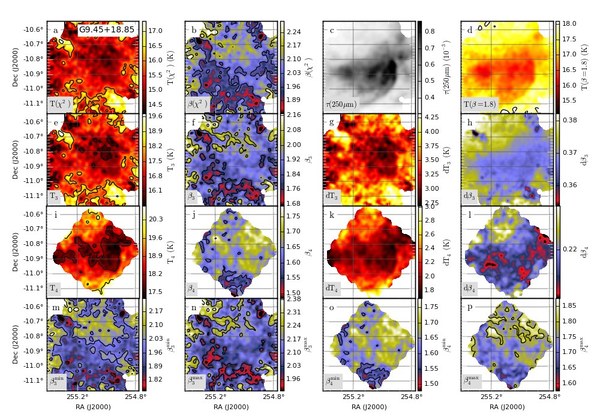
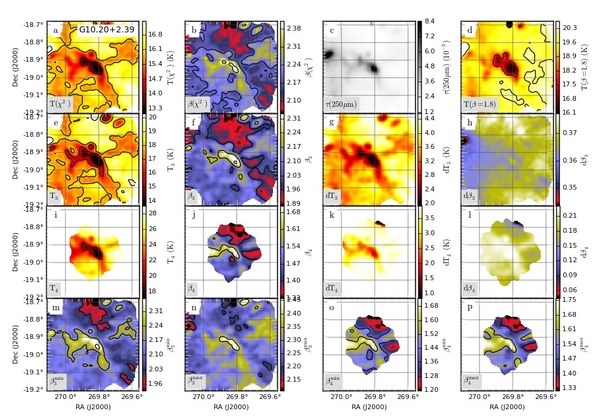
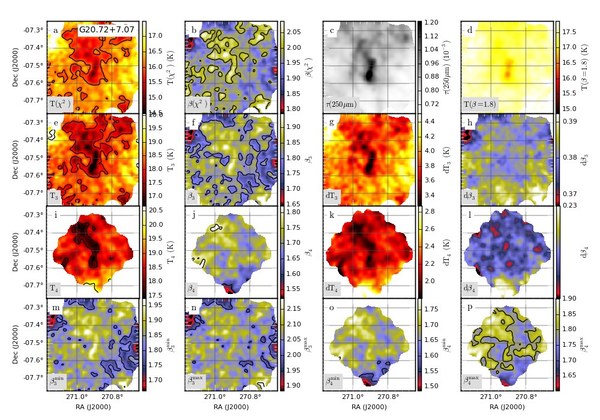
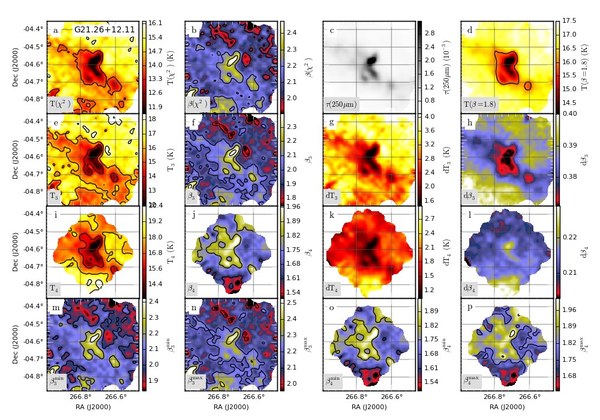
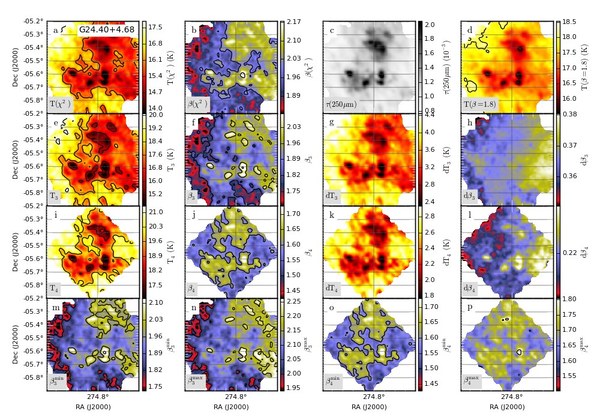
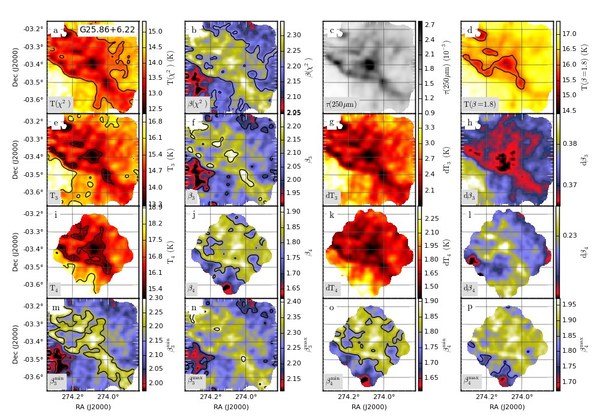
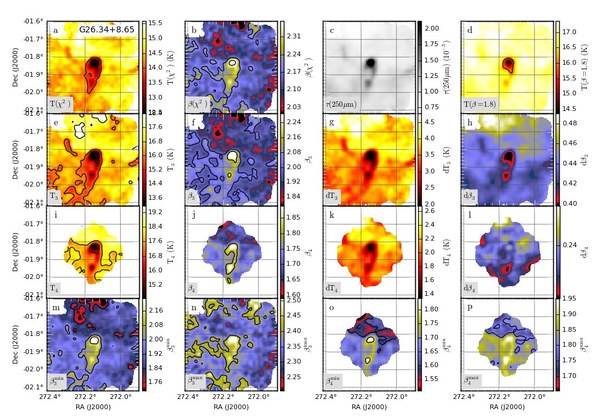
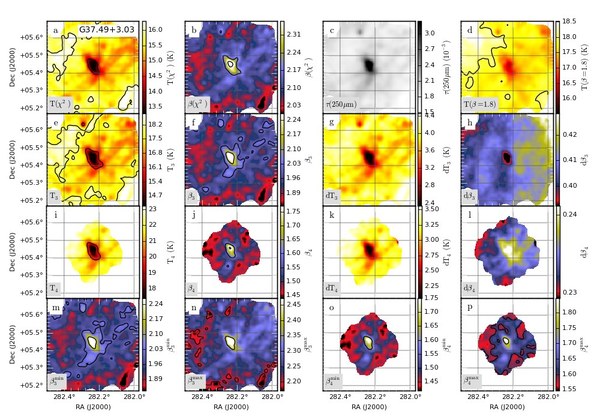
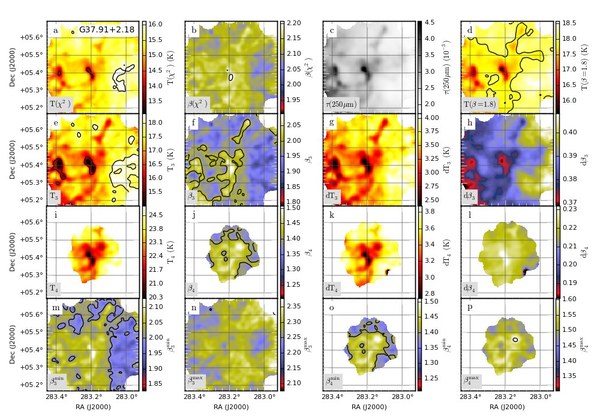
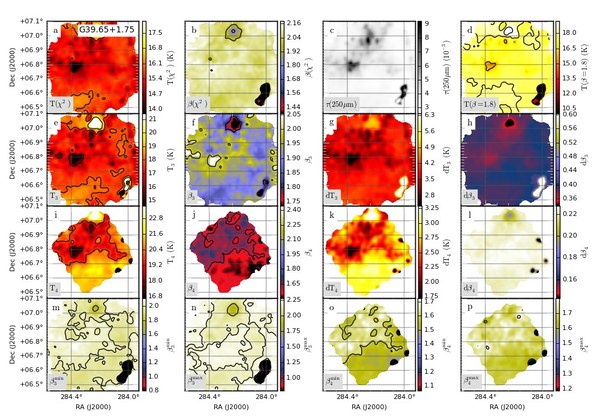
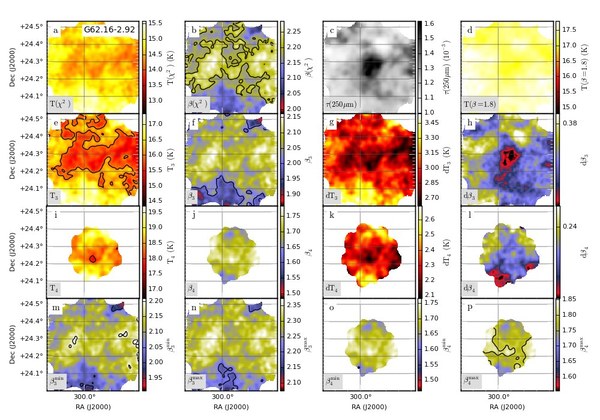
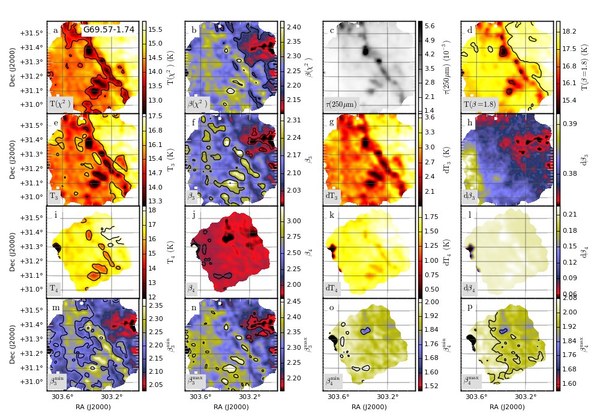
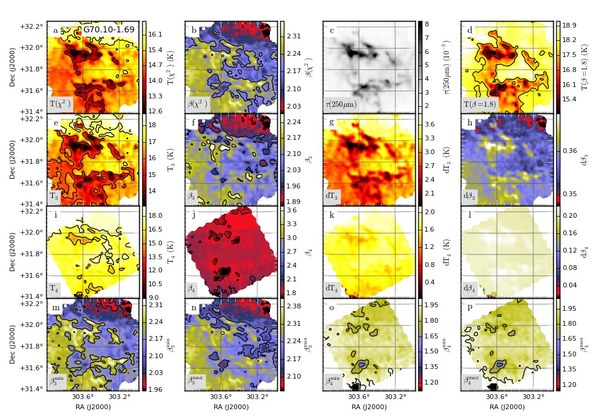
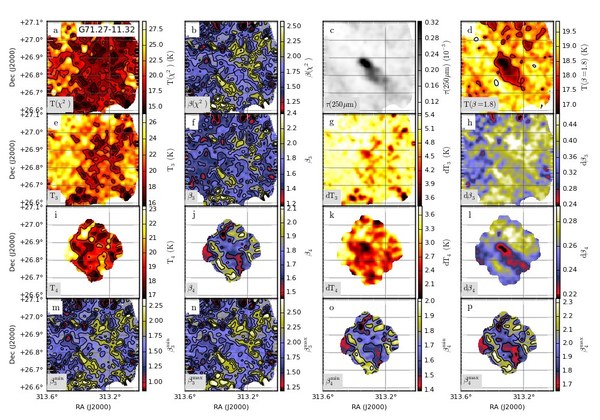
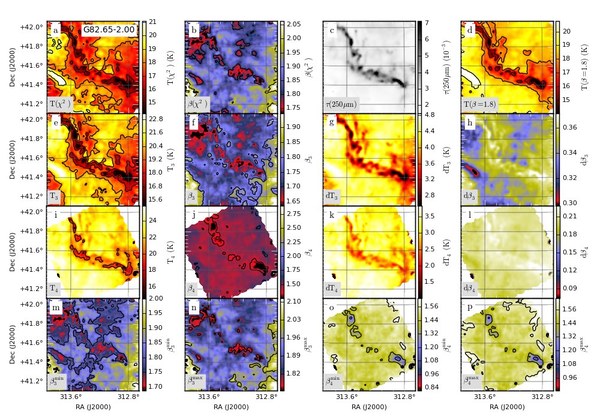
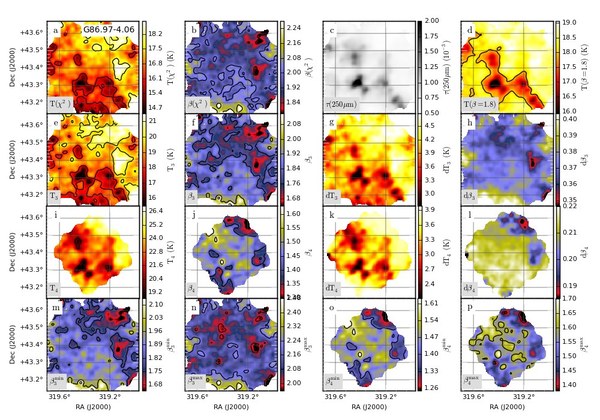
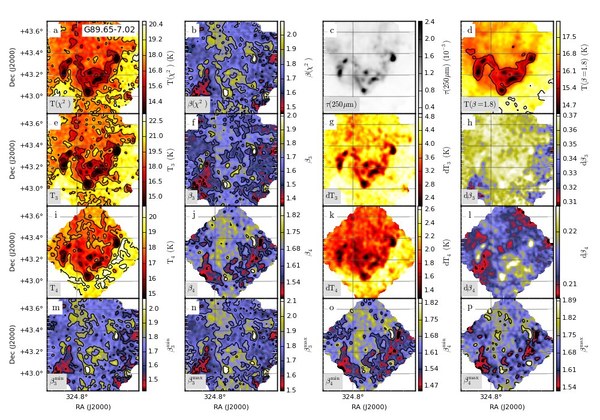
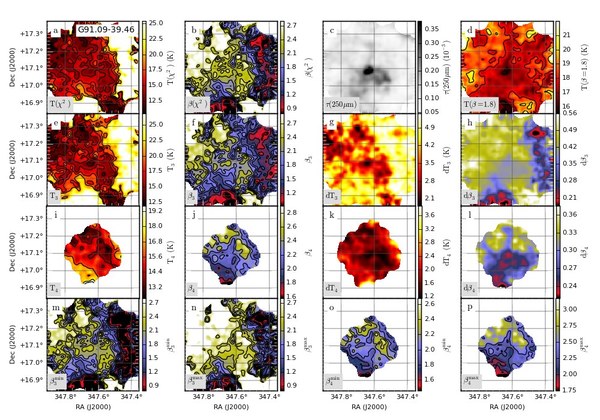
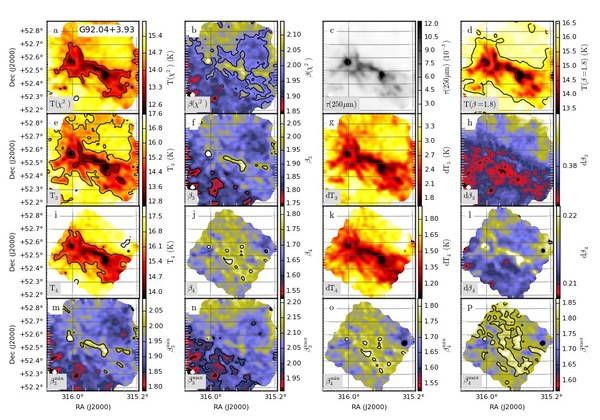
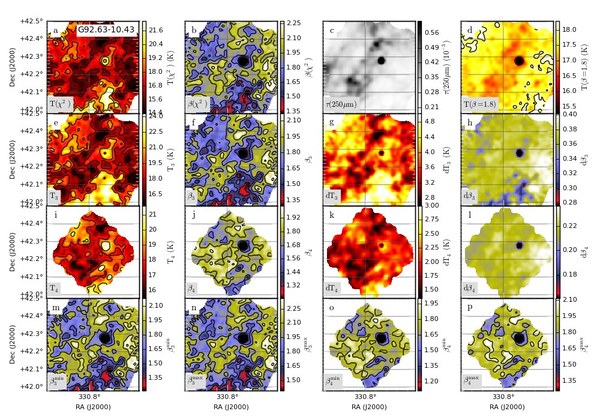
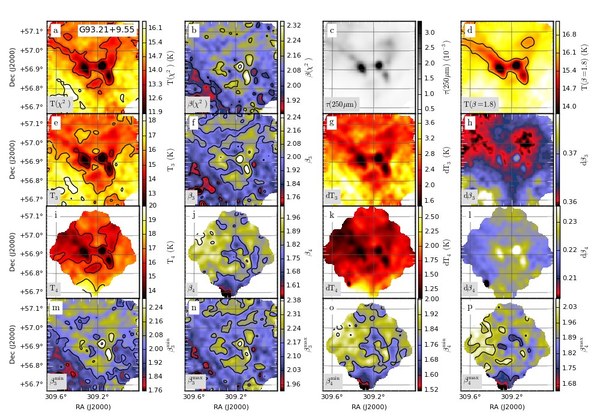
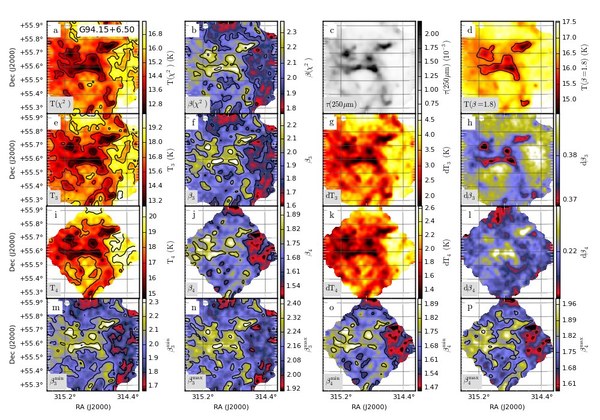
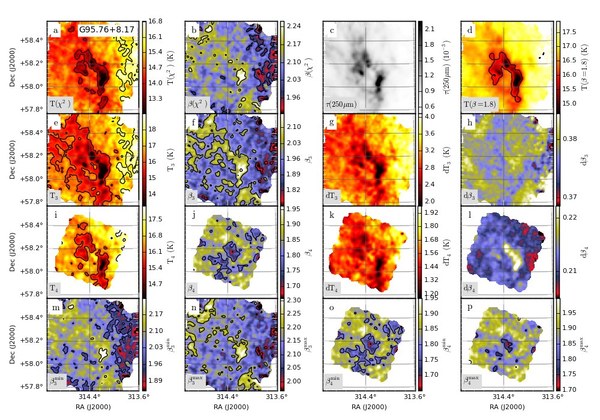
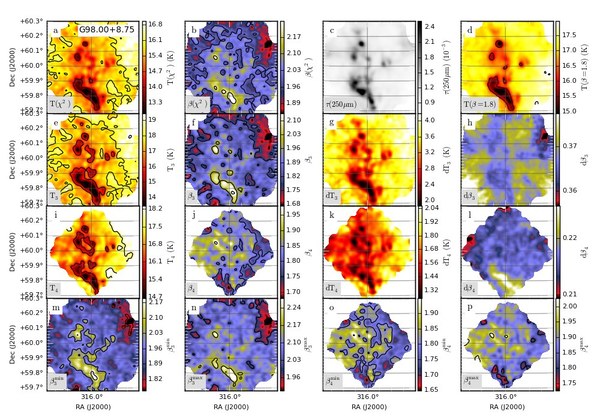
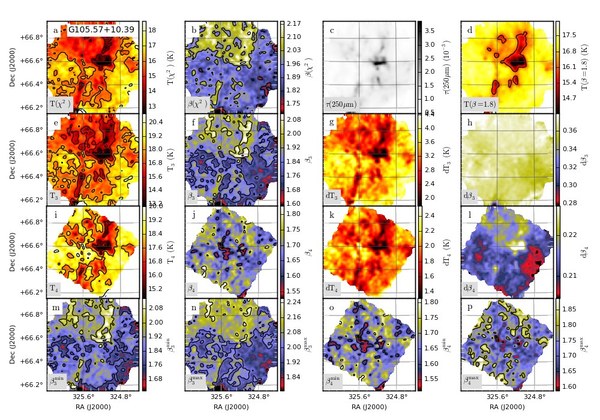
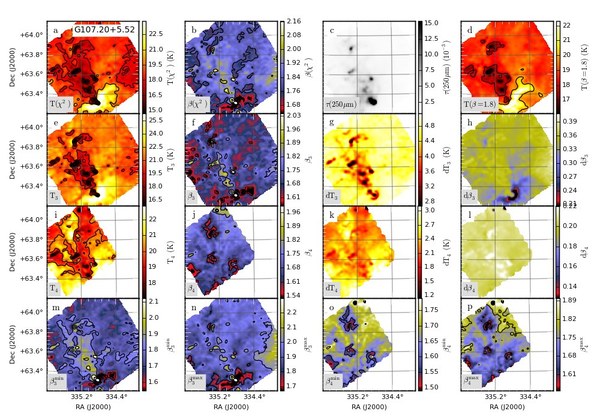
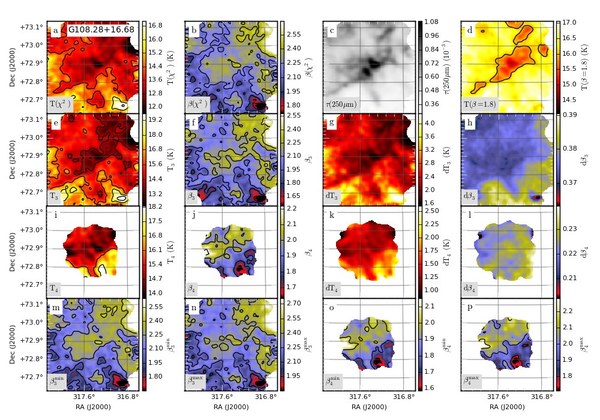
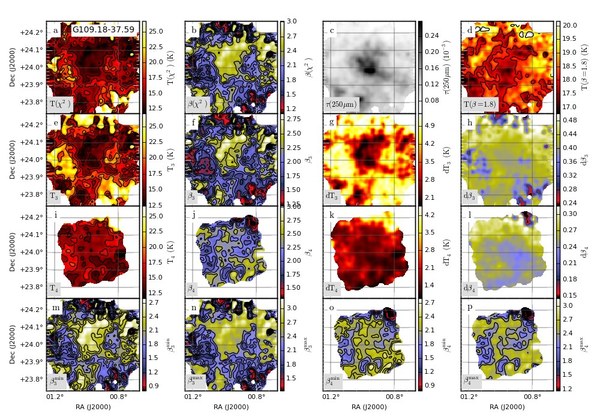
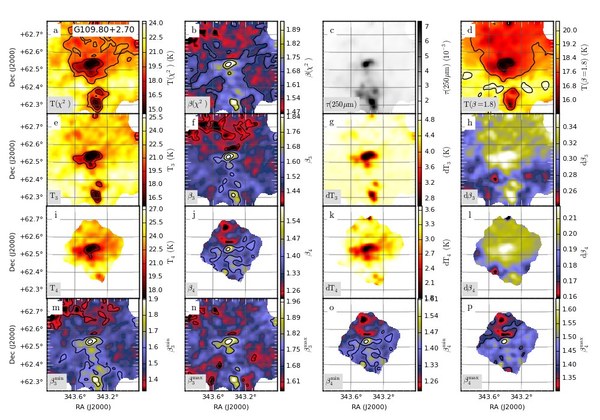
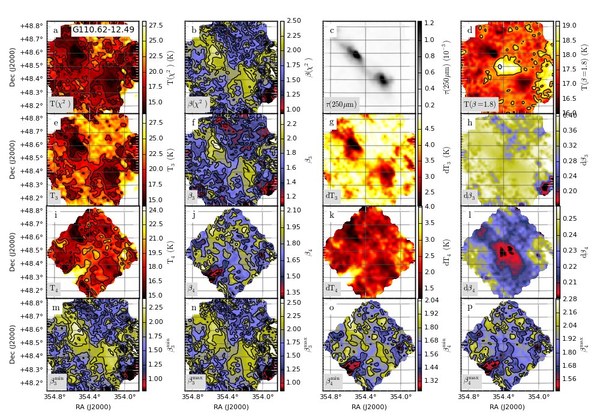
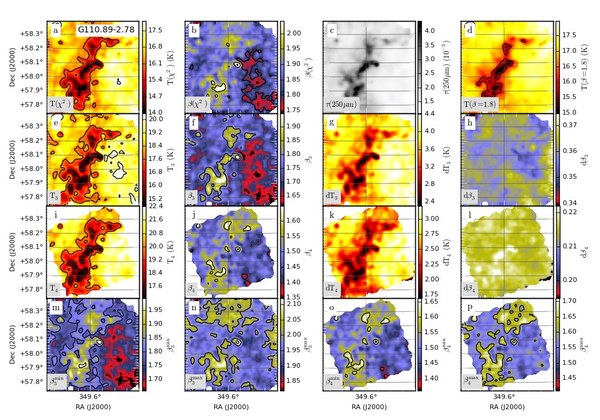
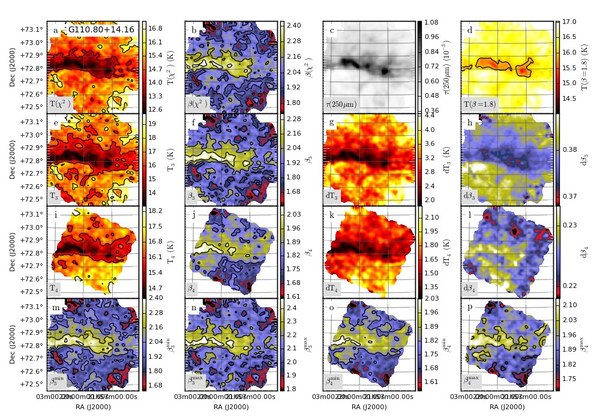
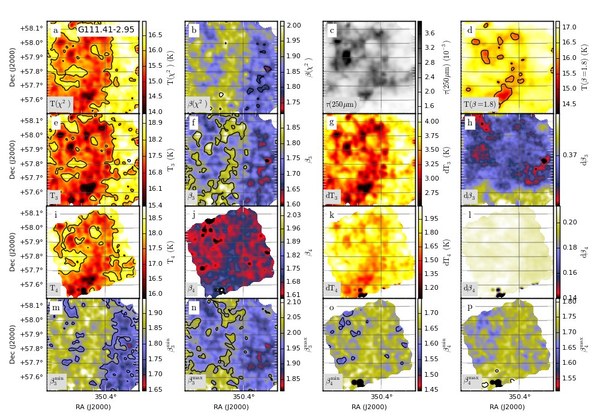
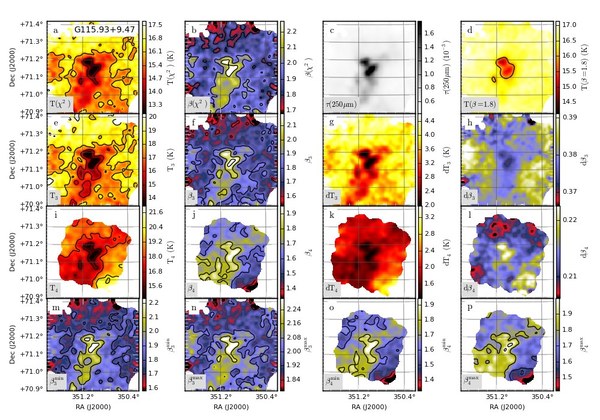
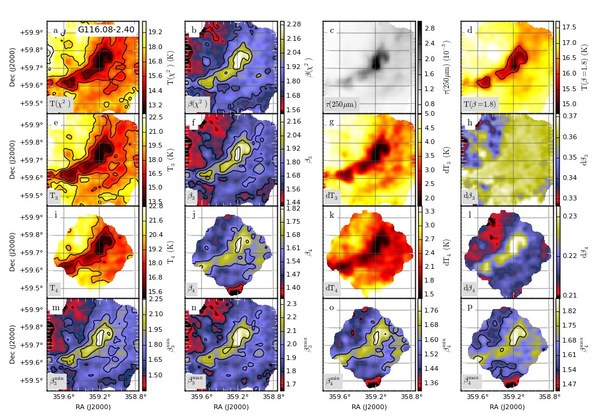
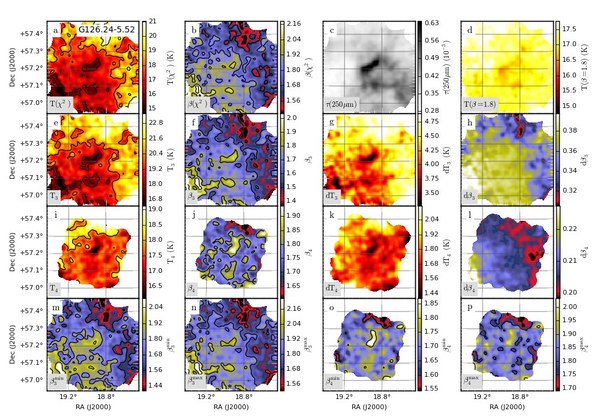
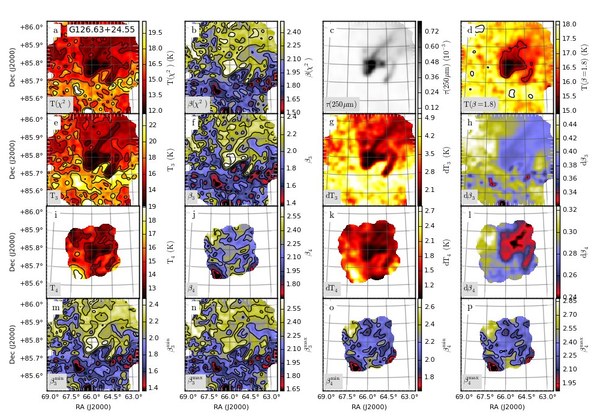
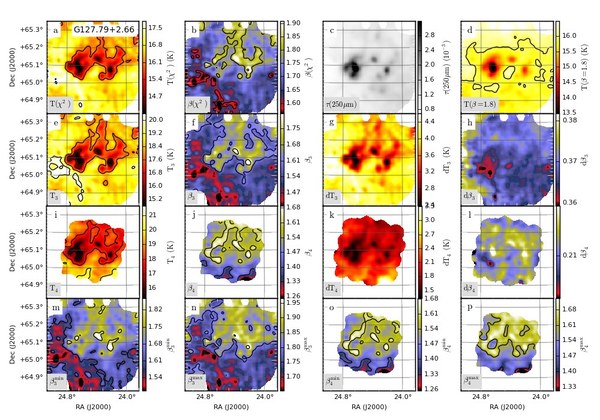
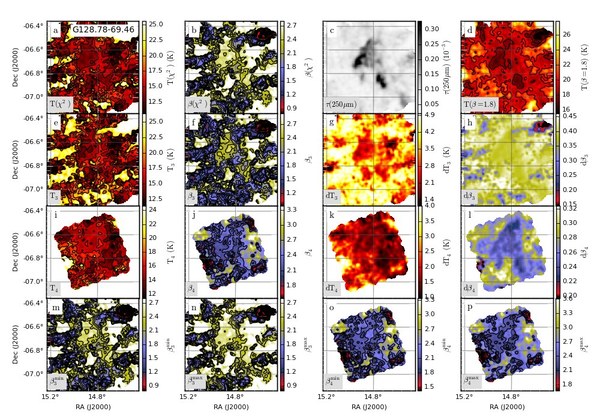
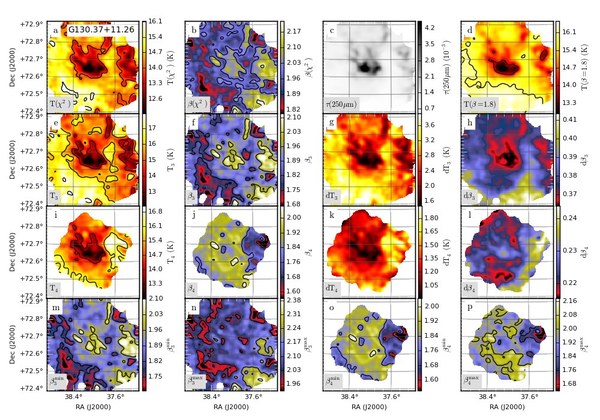
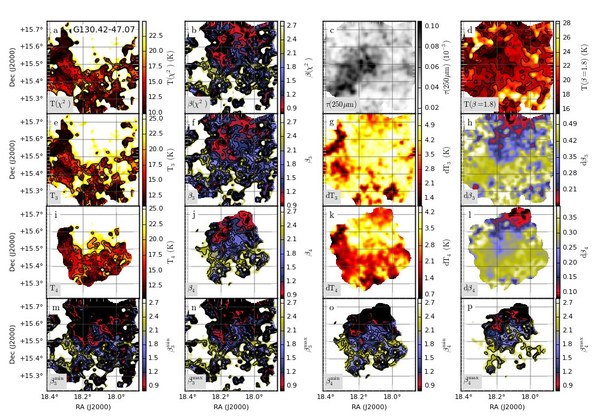
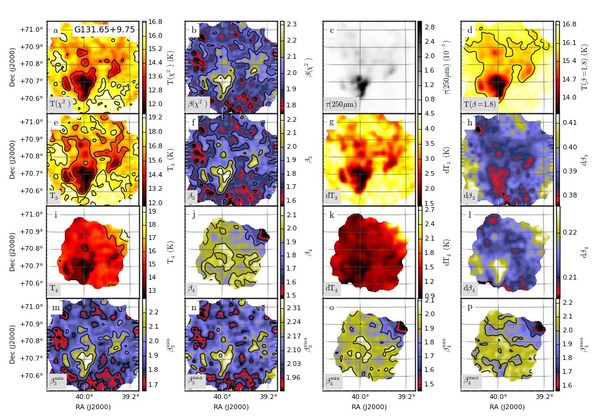
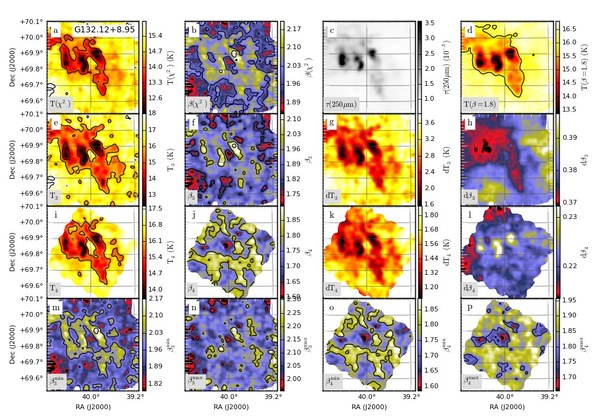
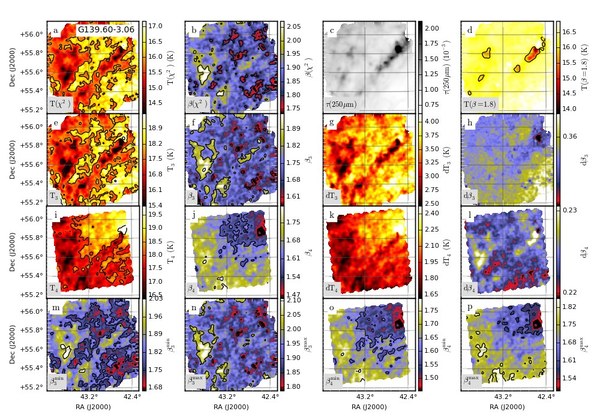
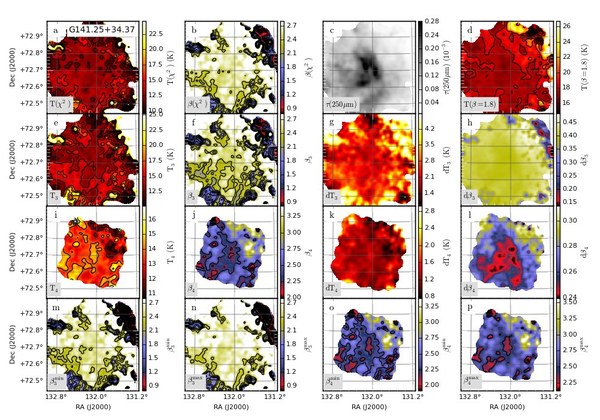
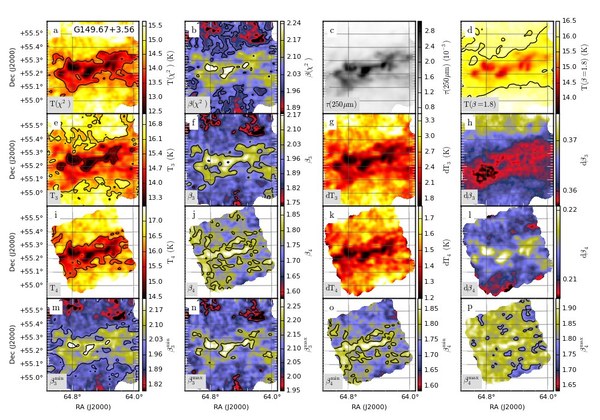
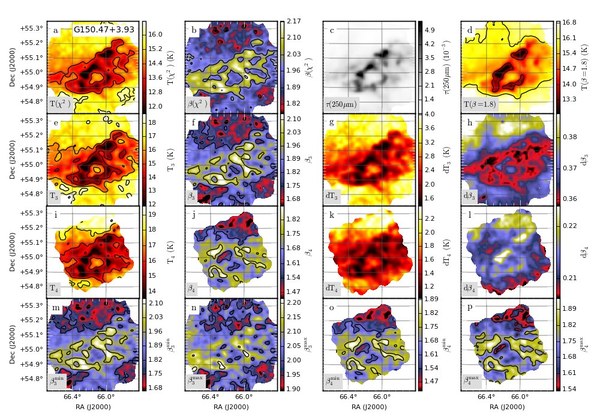
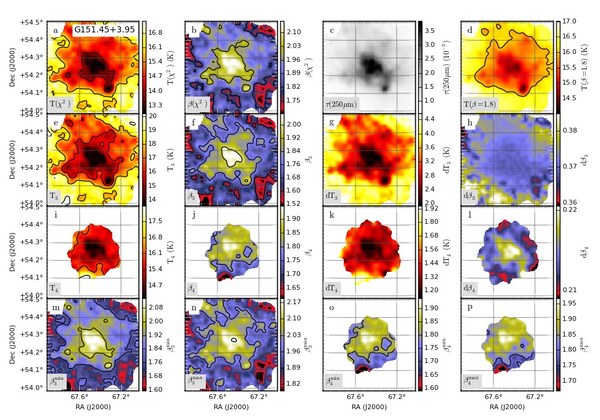
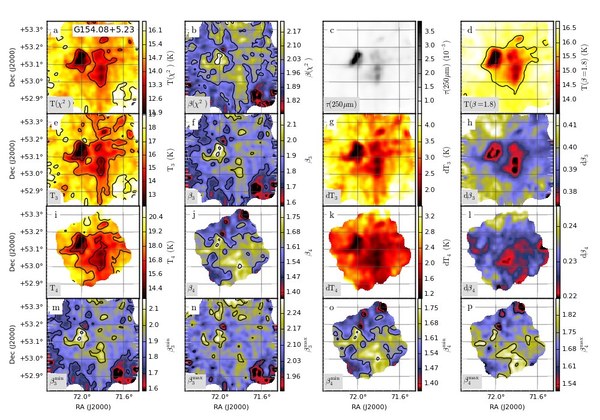
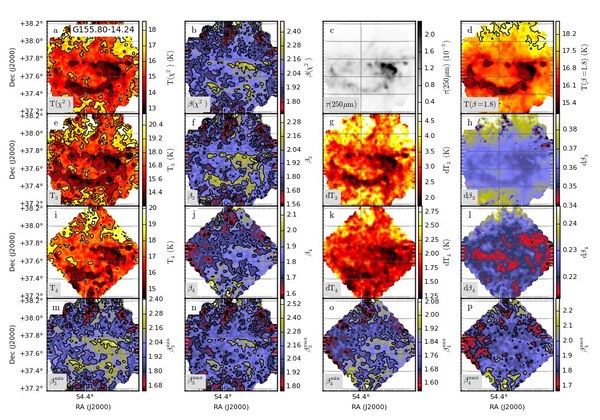
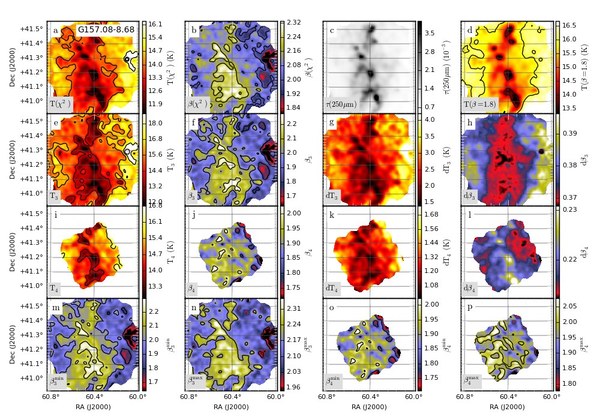
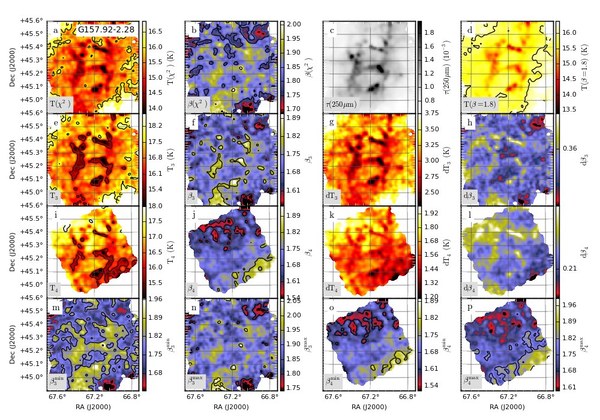
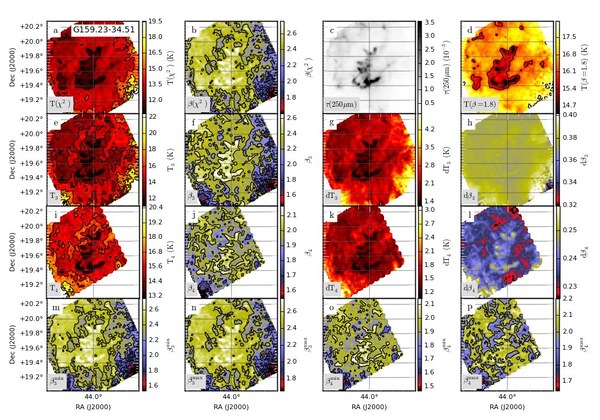
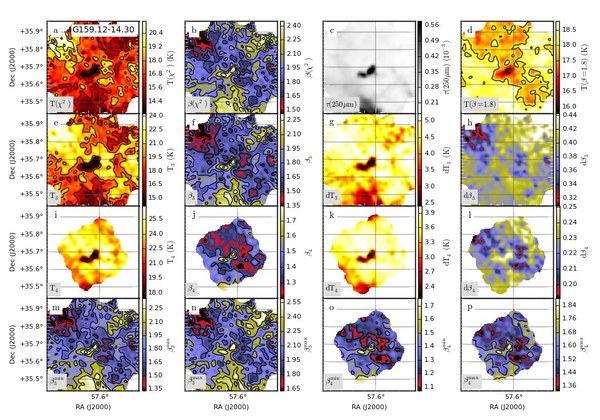
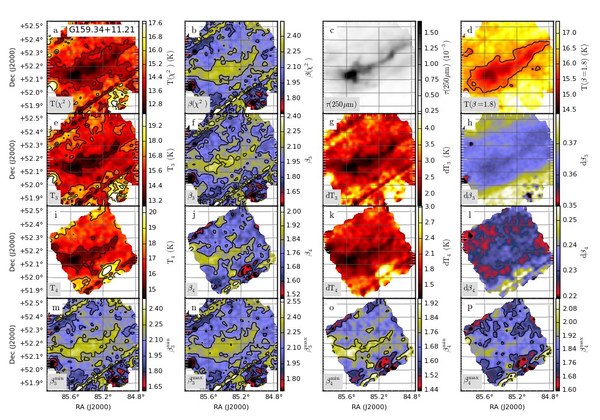
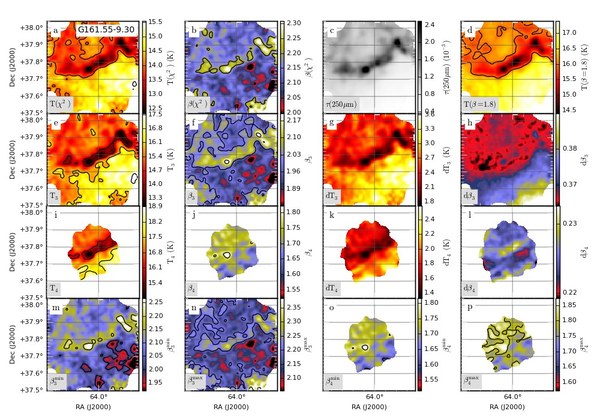
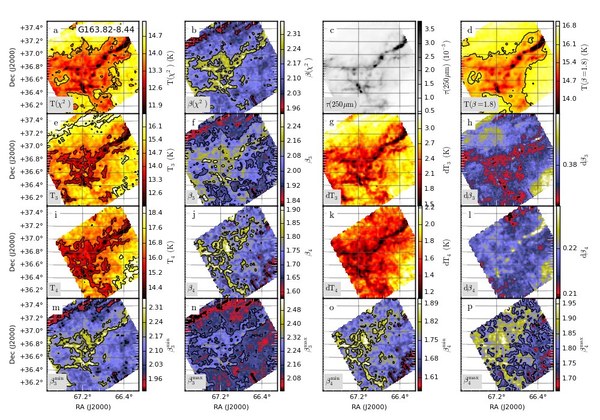
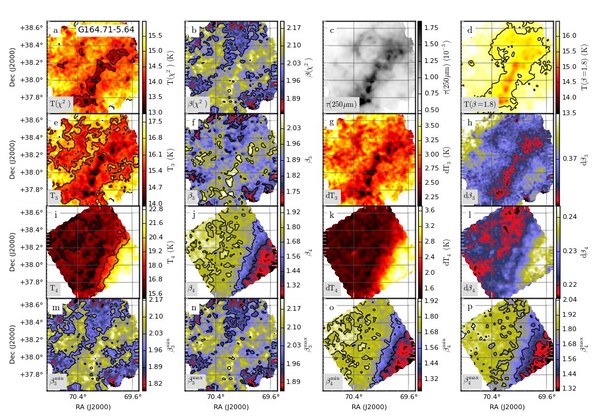
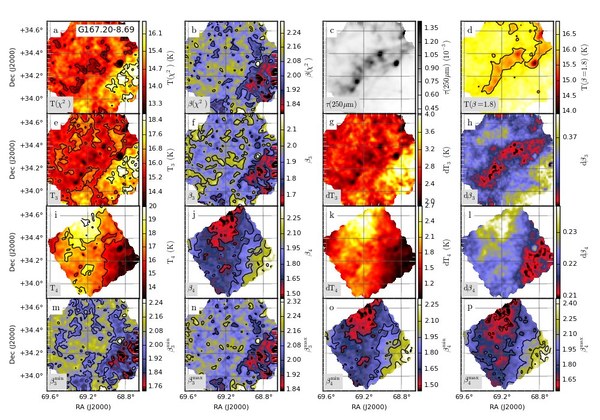
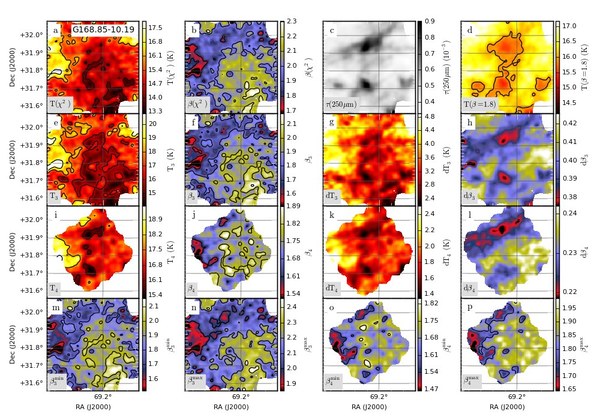
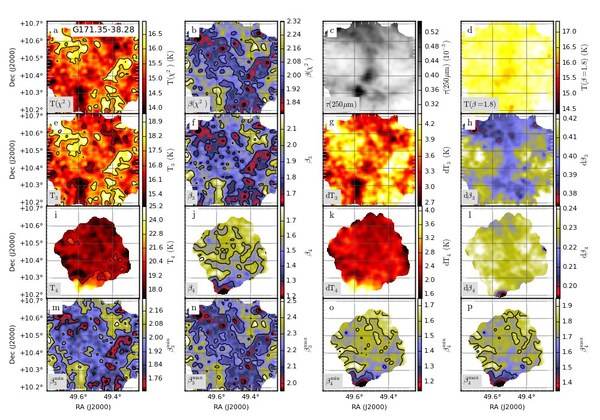
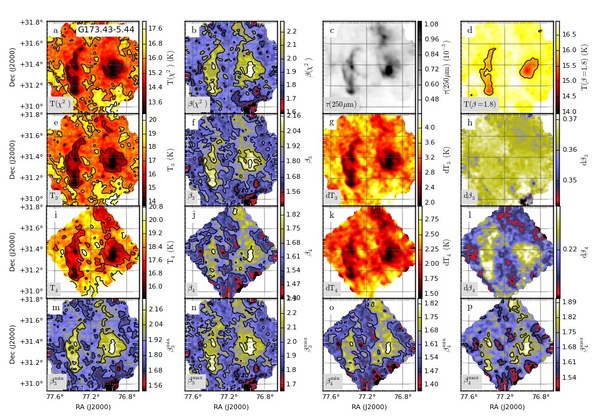
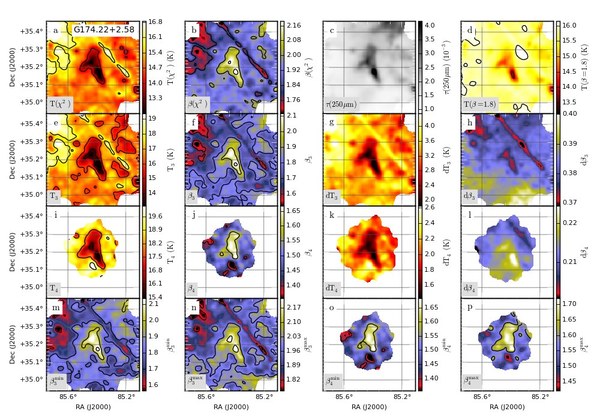
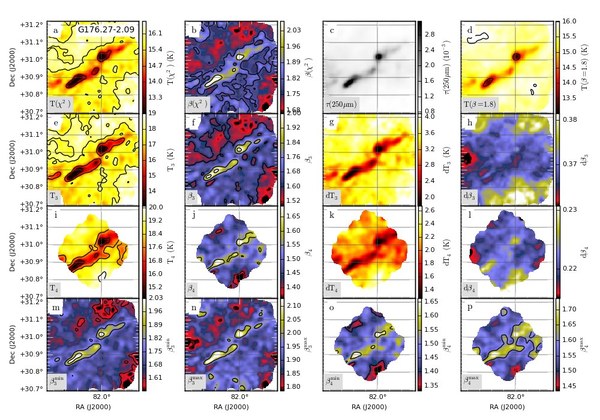
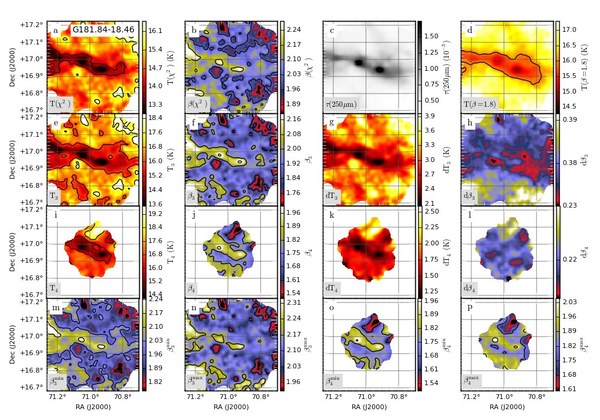
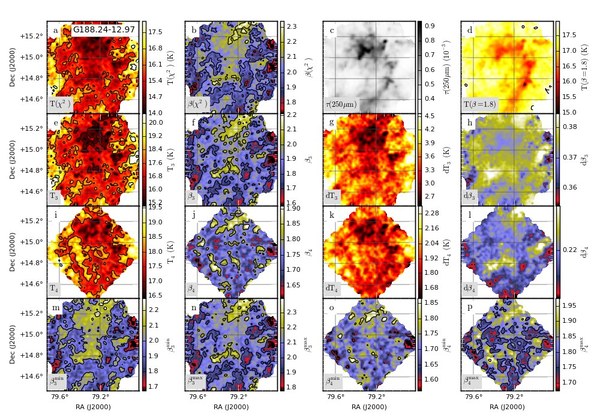
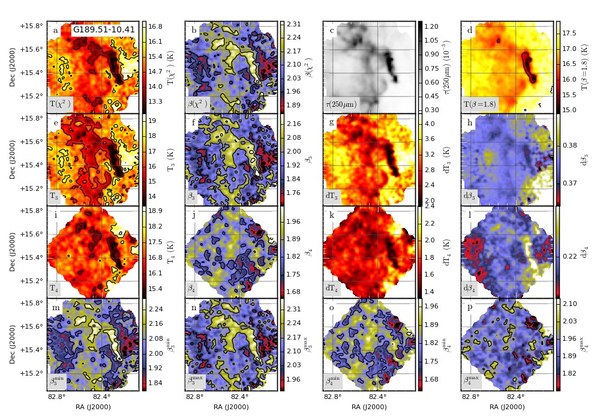
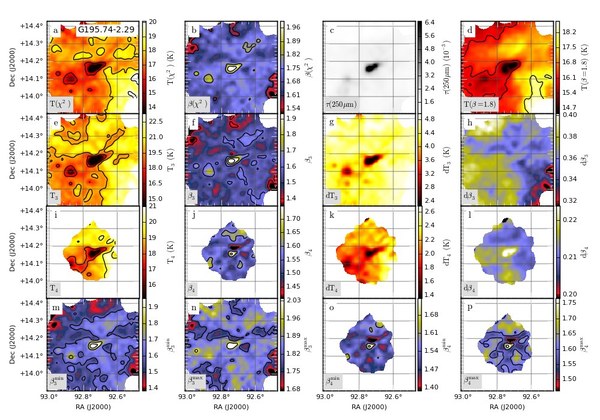
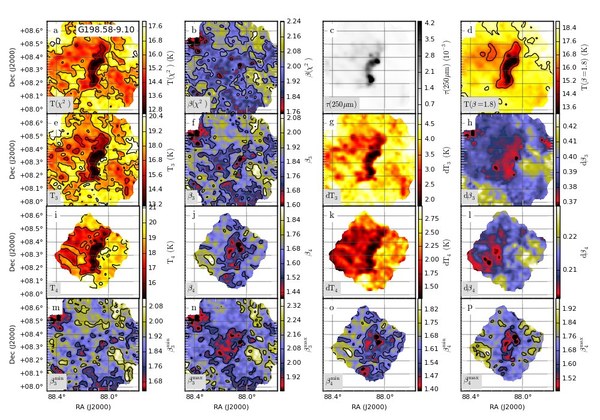
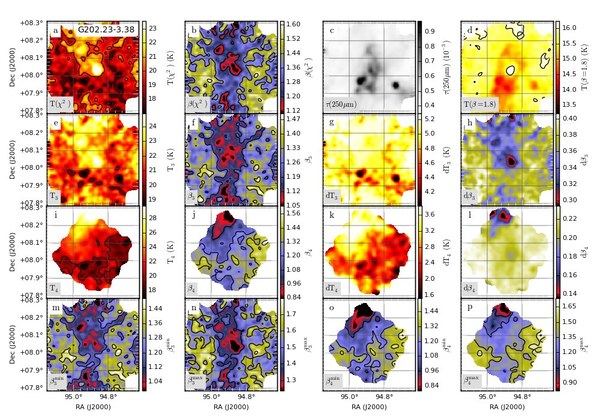
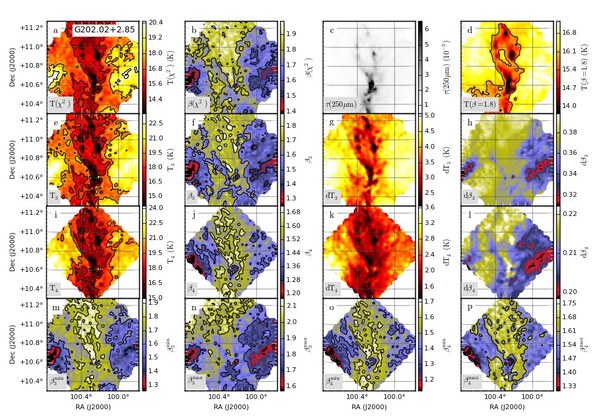
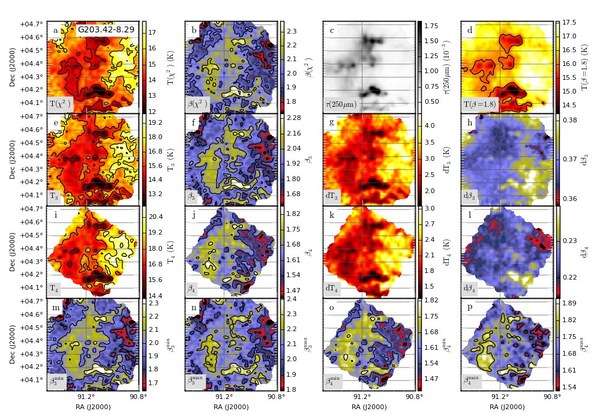
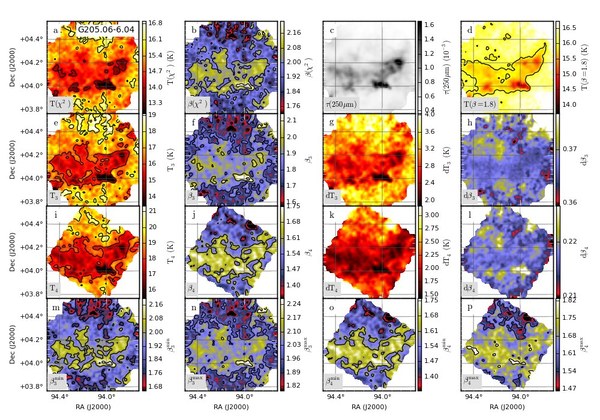
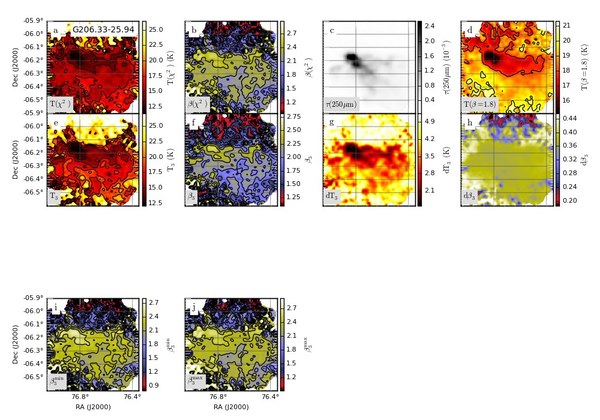
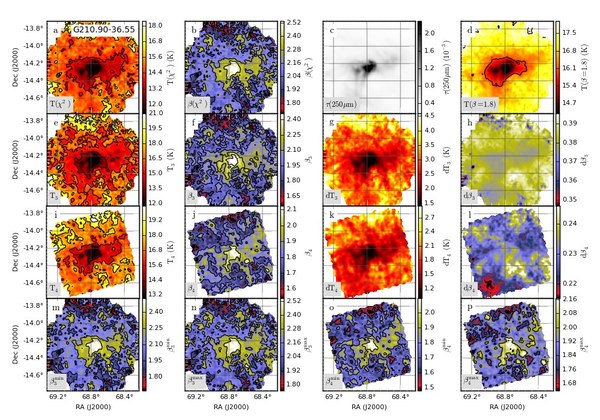
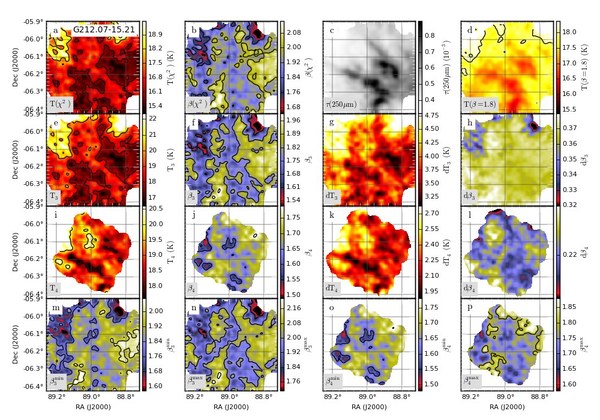
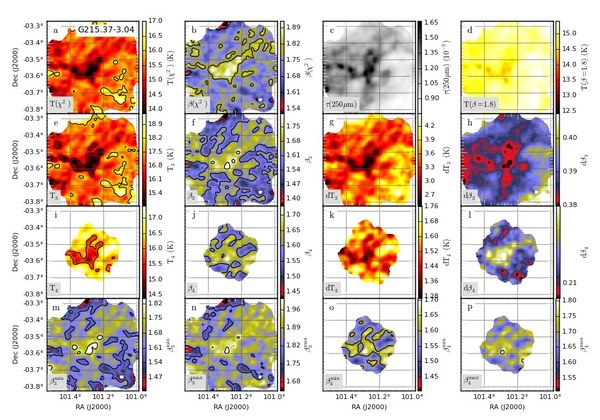
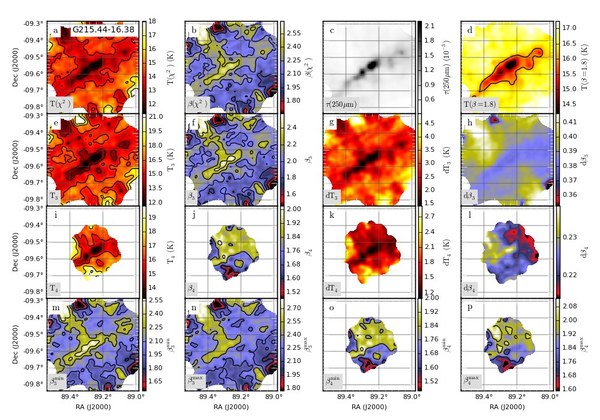
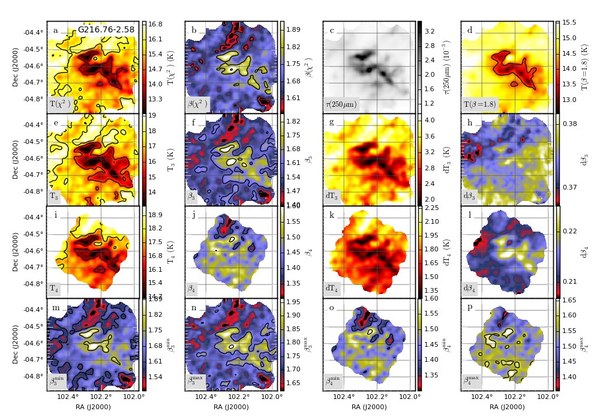
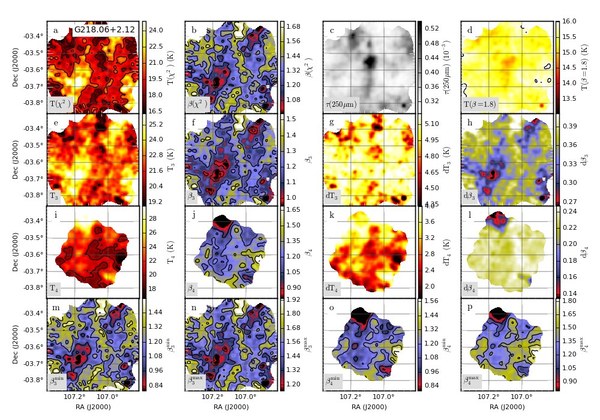
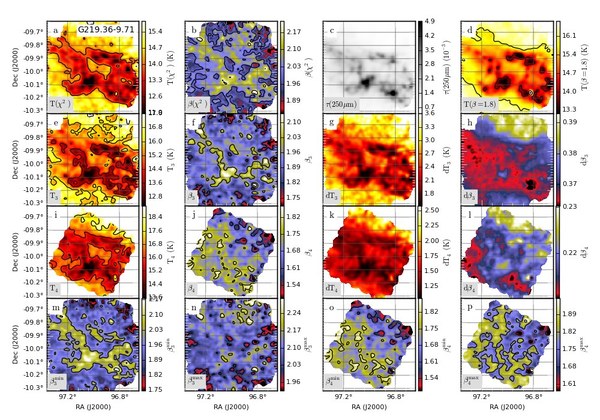
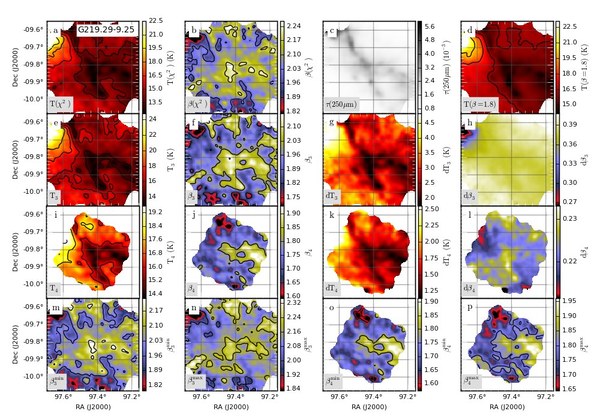
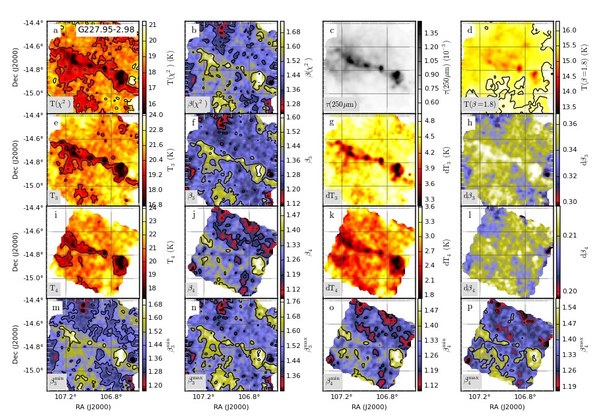
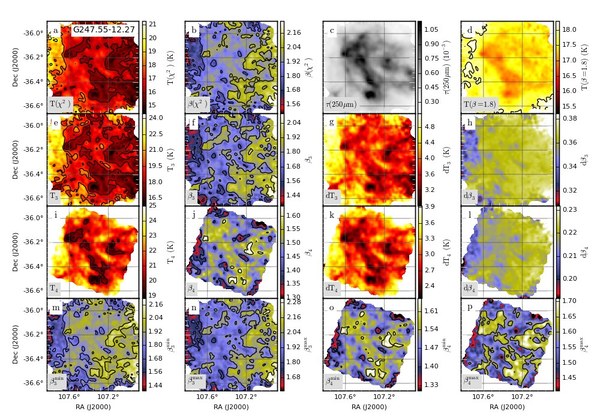
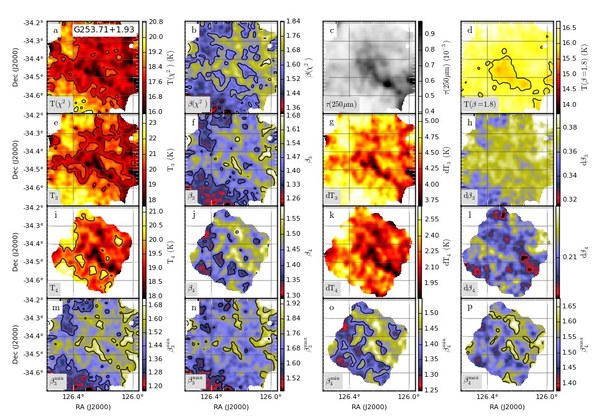
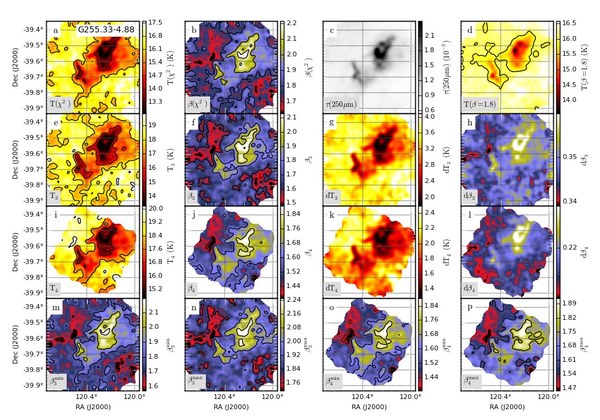
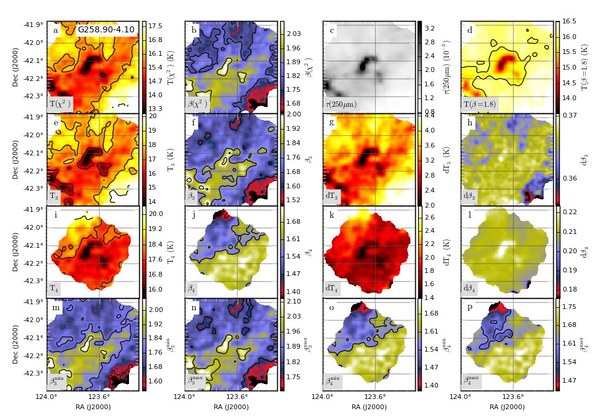
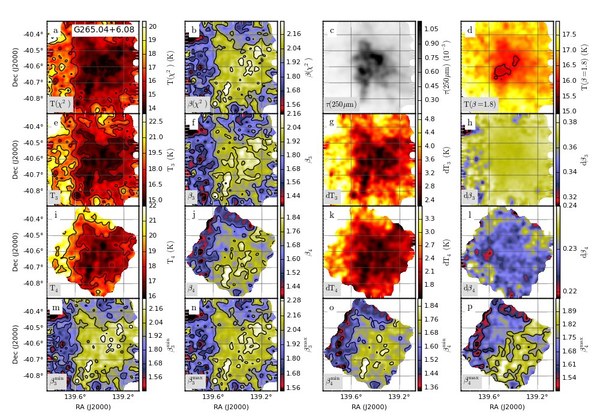
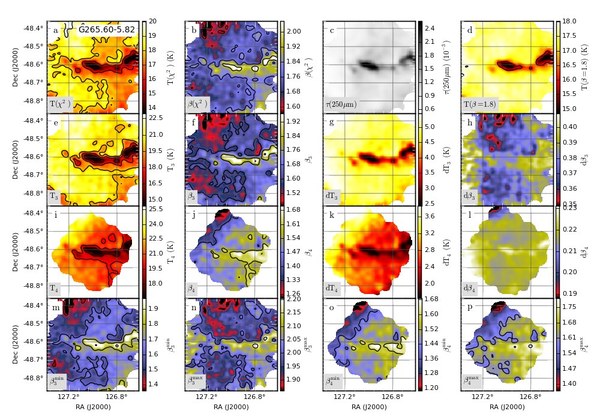
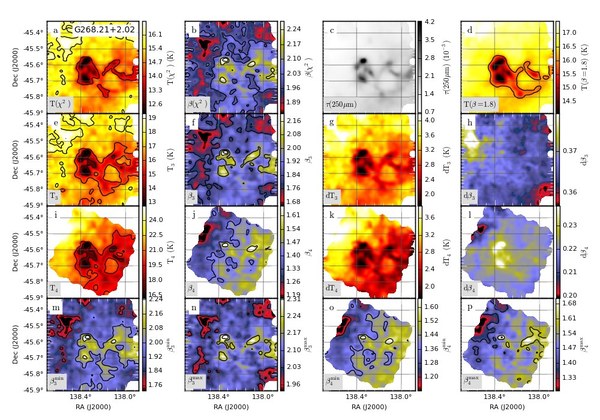
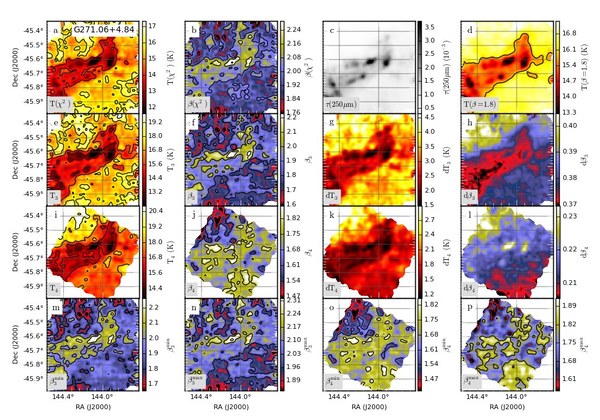
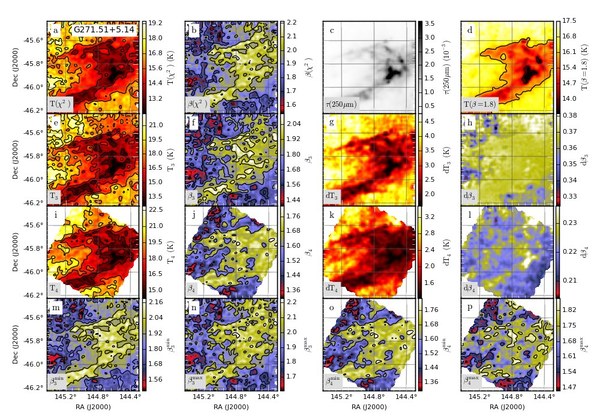
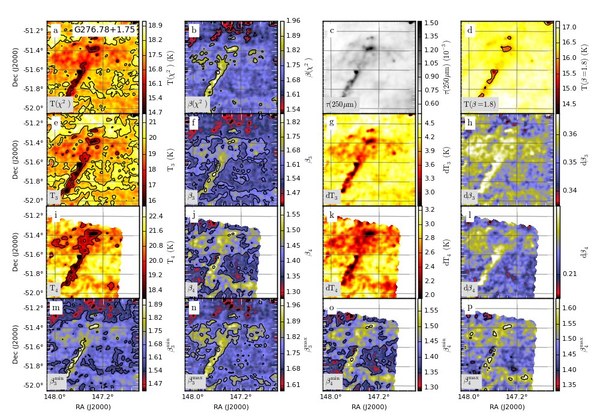
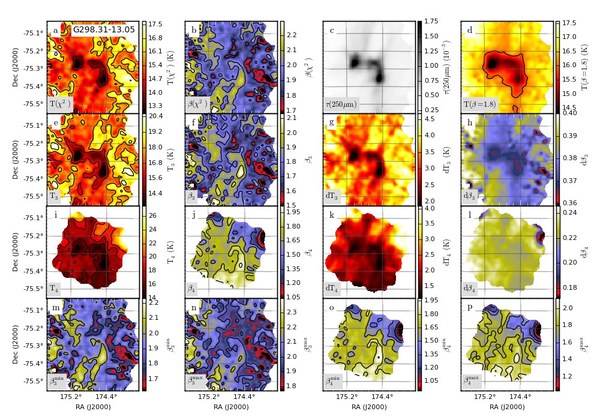
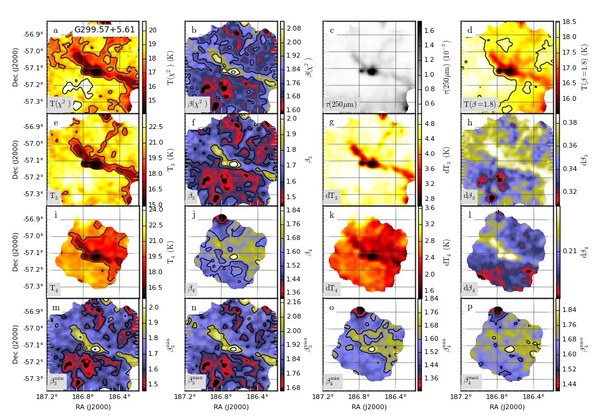
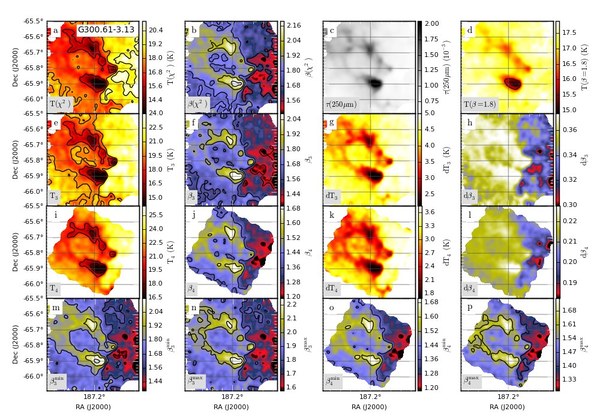
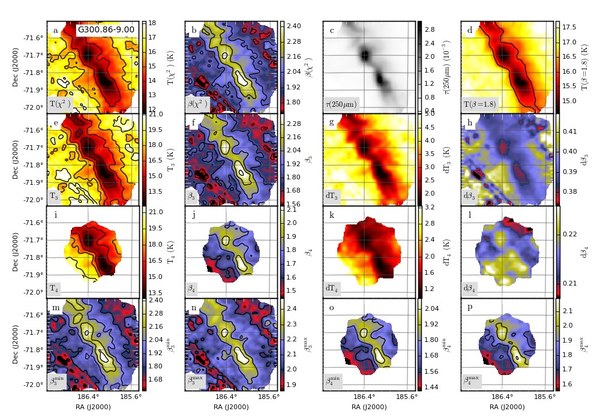
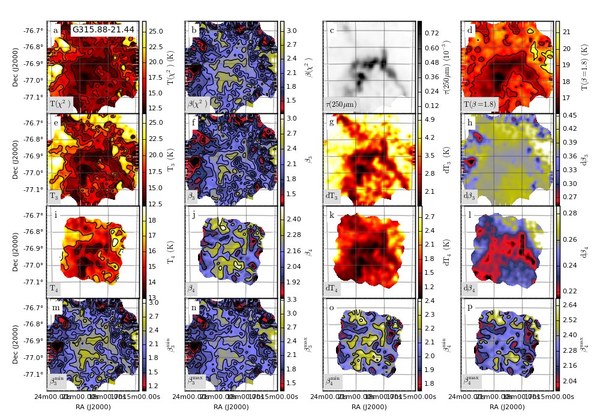
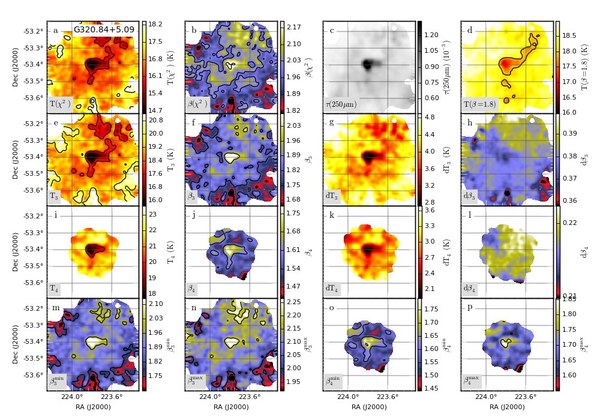
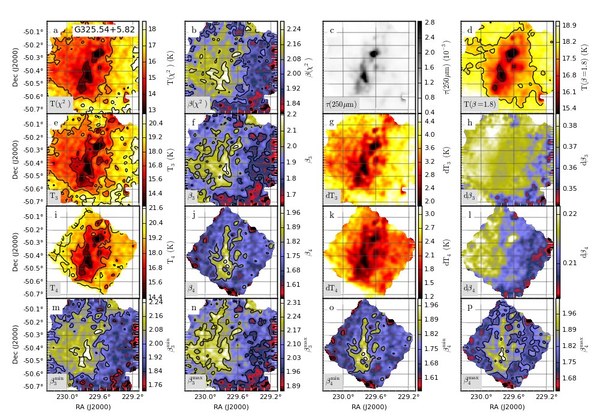
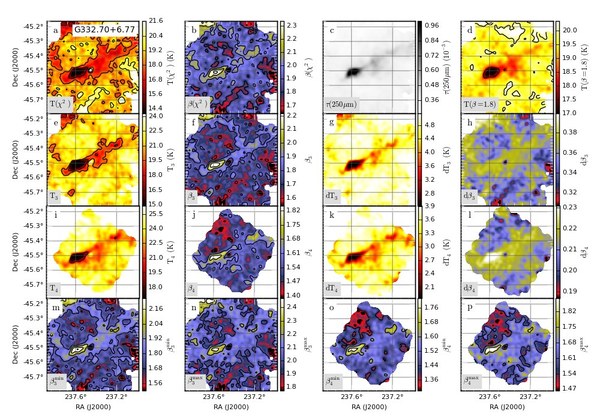
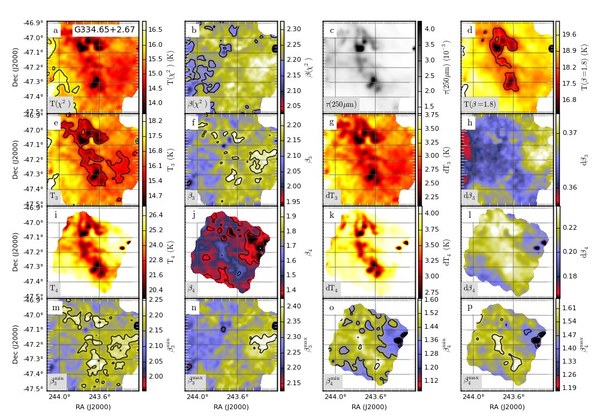
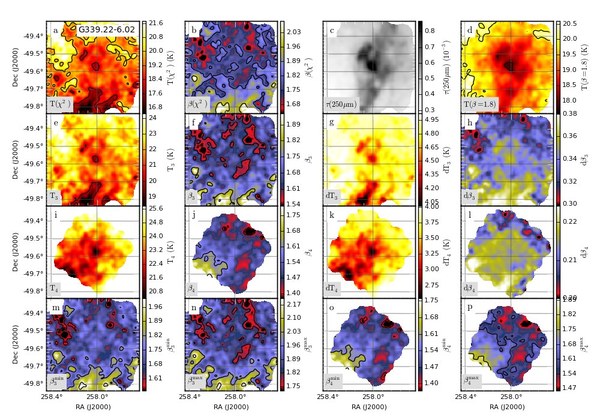
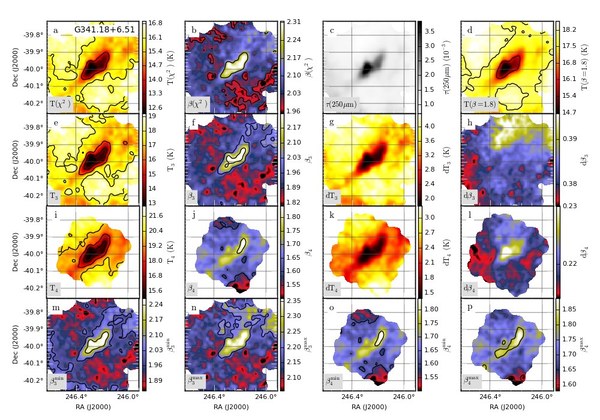
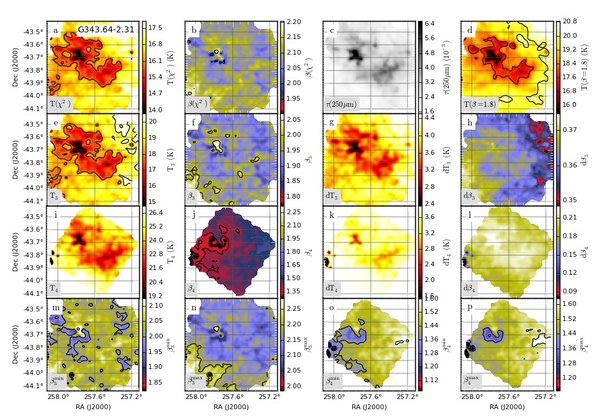
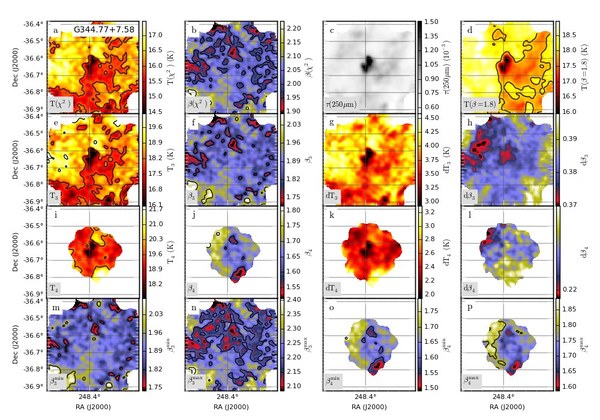
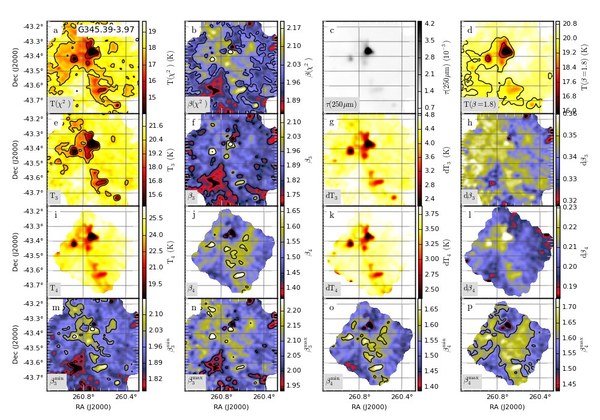
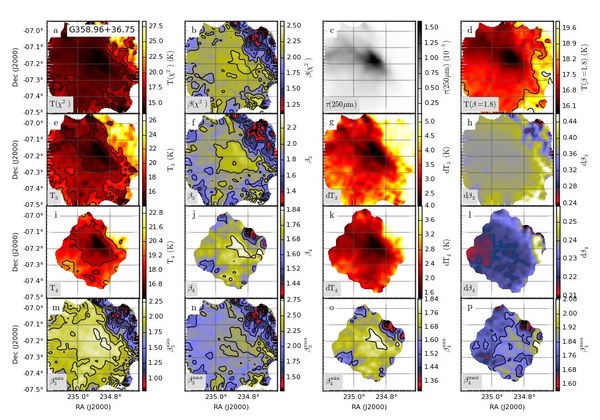
Appendix D Combined (, ) fits to Planck and Herschel data
The joint fit of Herschel (250 m–500 m) and Planck (857 GHz-217 GHz) data was carried out only for the 53 fields with estimated distances 400 pc (see Sect. 3.5). For comparison, the figures also include 353 GHz and 217 GHz residuals from fits where we assume twice the default CO correction (see Sect. 2.2). The larger correction could in some cases eliminate or even reverse the sign of the 217 GHz residual. However, for example in the case of field G6.03+36.73, ground-based observations confirm that the line ratios assumed in the default CO correction are of the correct magnitude (see Sect. 2.2).
