Sub-arcsec mid-IR observations of NGC 1614: Nuclear star-formation or an intrinsically X-ray weak AGN?
Abstract
We present new mid-infrared -band spectroscopy and -band photometry of the local luminous infrared galaxy NGC 1614, one of the most extreme nearby starbursts. We analyze the mid-IR properties of the nucleus (central 150 pc) and four regions of the bright circumnuclear (diameter pc) star-forming (SF) ring of this object. The nucleus differs from the circumnuclear SF ring by having a strong 8–12 m continuum (low 11.3 m PAH equivalent width). These characteristics, together with the nuclear X-ray and sub-mm properties, can be explained by an X-ray weak active galactic nucleus (AGN), or by peculiar SF with a short molecular gas depletion time and producing an enhanced radiation field density. In either case, the nuclear luminosity (61043 erg s-1) is only 5 % of the total bolometric luminosity of NGC 1614. So this possible AGN does not dominate the energy output in this object. We also compare three star-formation rate (SFR) tracers (Pa, 11.3 m PAH, and 24 m emissions) at 150 pc scales in the circumnuclear ring. In general, we find that the SFR is underestimated (overestimated) by a factor of 2–4 (2–3) using the 11.3 m PAH (24 m) emission with respect to the extinction corrected Pa SFR. The former can be explained because we do not include diffuse PAH emission in our measurements, while the latter might indicate that the dust temperature is particularly warmer in the central regions of NGC 1614.
keywords:
galaxies: active – galaxies: nuclei – galaxies: starburst – galaxies: individual: NGC 1614 – infrared: galaxies1 Introduction
Ultra-luminous and luminous infrared galaxies (U/LIRGs) are objects with infrared (IR) luminosities () between 1011 and 1012 (LIRGs) and 1012 (ULIRGs). Locally, objects with such high IR luminosities are unusual. However, between and 2, galaxies in the LIRG and ULIRG luminosity ranges dominate the star-formation rate (SFR) density of the Universe (Pérez-González et al., 2005; Le Floc’h et al., 2005; Caputi et al., 2007; Magnelli et al., 2011). Therefore, the study at high-angular resolution of local LIRGs provides a unique insight into extreme SF environments similar to those of high- galaxies near the SFR density peak of the Universe (Madau & Dickinson, 2014).
NGC 1614 (Mrk 617) is the second most luminous galaxy within 75 Mpc (; Sanders et al. 2003) and according to optical spectroscopy its nuclear activity is classified as composite (Yuan et al., 2010). It is an advanced minor merger (3:1–5:1 mass ratio; Väisänen et al. 2012) located at 64 Mpc (310 pc arcsec-1) with long tidal tails. Its bolometric luminosity is dominated by a strong starburst in the central kpc (Alonso-Herrero et al., 2001; Imanishi et al., 2010), and, so far, there is no clear evidence of an active galactic nucleus (AGN) in NGC 1614 (Herrero-Illana et al., 2014).
The central kpc of NGC 1614 contains a compact nucleus (45-80 pc), which dominates the near-IR continuum emission, and a bright circumnuclear SF ring (diameter pc), which is predominant in Pa (Alonso-Herrero et al., 2001) and other SF indicators like the polycyclic aromatic hydrocarbon (PAH) emission (Díaz-Santos et al., 2008; Väisänen et al., 2012), cold molecular gas (König et al., 2013; Sliwa et al., 2014; Xu et al., 2015), and radio continuum (Olsson et al., 2010; Herrero-Illana et al., 2014). In addition, García-Burillo et al. (2015) found a massive cold molecular gas outflow (3107 ; 40 yr-1) which can be powered by the SF in the ring.
A bright obscured AGN is discarded by X-ray observations (Pereira-Santaella et al., 2011; Herrero-Illana et al., 2014). However, previous mid-IR -band imaging of NGC 1614 showed that the compact nucleus has a relatively high surface brightness (Soifer et al., 2001; Díaz-Santos et al., 2008; Siebenmorgen et al., 2008). Therefore, these observations suggest an enhanced mid-IR luminosity to SFR (as inferred from the observed Pa luminosity) ratio in the nucleus (Díaz-Santos et al., 2008), which might indicate the presence of an active nucleus. However, without high angular resolution spectroscopy no detailed studies were possible.
In this paper we present the first high-angular resolution (05 ) -band (7.5–13 m) spectroscopy of the nucleus and surrounding star-forming ring of NGC 1614, as well as -band 24.5 m imaging using CanariCam on the 10.4 m Gran Telescopio CANARIAS (GTC). First, we describe the new observations in Section 2. The extraction of the spectra and photometry, and a simple two component modeling are presented in Section 3. We explore the AGN or SF nature of the nucleus in Section 4, and, in Section 5, the reliability of several SFR tracers at 150 pc scales is discussed. The main conclusions are presented in Section 6.
Throughout this paper we assume the following cosmology km s-1 Mpc-1, , and and the Kroupa (2001) IMF.
2 Observations and Data Reduction
2.1 Mid-IR Imaging
We obtained -band diffraction limited (05) images of NGC 1614 using the Q8 filter ( m, width at 50% cut-on/off of m) of CanariCam (CC; Telesco et al. 2003) on the 10.4 m GTC during December 2nd 2014. These observations are part of the ESO/GTC large program 182.B-2005 (PI Alonso-Herrero). The plate scale of CC is 008/pixel and its field of view is 26″19″, so it covers the central 6 kpc of NGC 1614.
Three exposures were taken with an on-source integration of 400 s each. To reduce the data we used the redcan pipeline (González-Martín et al., 2013). It performs the flat-fielding, stacking, and flux calibration of the individual exposures. The three reduced images were then combined after correcting the different background levels (right panel of Figure 1). For the flux calibration the standard star HD 28749 was observed. It is relatively weak at 24.5 m (1.2 Jy; Cohen et al. 1999) so the absolute calibration error of our -band observations is 20 %.
To check the flux calibration we also compared the integrated flux of NGC 1614 in our 24.5 m image (6.00.9 Jy) with the Spitzer/MIPS 24 m flux (5.70.3 Jy; Pereira-Santaella et al. 2015). Both values are in good agreement.
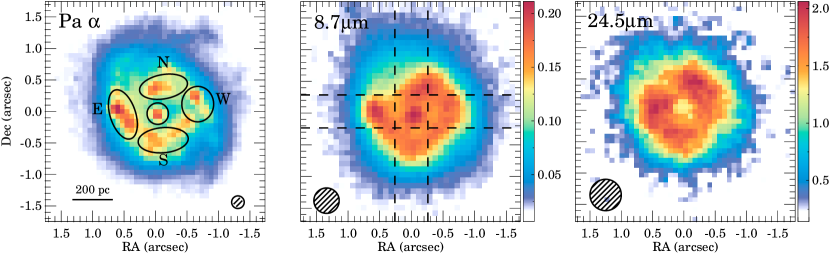
In addition, -band imaging of this galaxy was previously obtained using Gemini/T-ReCS in the Si2 filter ( m, m). This image was published by Díaz-Santos et al. (2008) and it is shown in the middle panel of Figure 1. The angular resolution of this observation estimated from the calibration star image is 04.
2.2 Mid-IR Spectroscopy
We obtained -band spectroscopy (7.5–13 m) of NGC 1614 with GTC/CanariCam on September 8th 2013 and January 5th 2014. The low spectral resolution () grating was used. These observations are also part of the ESO/GTC large program 182.B-2005. The nucleus of NGC 1614 was observed with a slit of 052 width using two perpendicular orientations (position angles 0 and 90∘). The approximate location of the slits is overplotted in the middle panel of Figure 1. The on-source integration time for each of the slit orientations was 1200 s.
The standard star HD 28749 was observed in spectroscopy mode to provide the absolute flux calibration and telluric correction. From the two-dimensional spectrum of the standard star we derive that the angular resolution, 05, is approximately constant with the wavelength both nights. That is, the spectroscopy was not obtained in diffraction limited conditions.
The data were reduced using the redcan pipeline. Flat-fielding, stacking, wavelength calibration, and flux calibration of the exposures are performed by this software. The spectra were extracted using a custom procedure (see Section 3.1) instead of the default redcan extraction.
3 Analysis and Results
3.1 Image modeling and spectral extraction
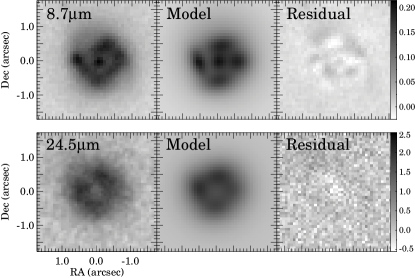
The HST/NICMOS Pa image of NGC 1614 (Alonso-Herrero et al. 2001, see Fig 1) revealed that the angular separation between the nucleus and the star-forming ring is 05–07, which is comparable to the angular resolution of the CC Q-band imaging and N-band spectroscopy. Therefore, to disentangle the emission produced by the different regions we modeled the mid-IR image with the highest resolution (i.e., the 8.7 m T-ReCS image) with galfit (Peng et al., 2010). Imanishi et al. (2011) published -band imaging of NGC 1614 at 17.7 m. In this image, the emissions from the SF ring and the nucleus are not as clearly separated as in the CC 24.5 m image, probably due to the slightly worse angular resolution (07; Asmus et al. 2014).
We used six Gaussian spatial components (nucleus, north, south, east, west, and diffuse) convolved with the PSF, to reproduce the 8.7 m image (see Figure 2). These components are motivated by the Pa morphology (Figure 1) and is the minimum number of components needed to reproduce the mid-IR images. The position and full width half maximum (FWHM) of these components are listed in Table 1. According to this decomposition, the ring is located 06 away from the nucleus (190 pc) and has a FWHM of 05–07 (160–220 pc). The residuals of the model are less than 20 % (Figure 2).
To extract the fluxes from the CC Q-band image, we used galfit fixing the relative positions and widths of these components, but allowing their intensities to vary (see Figure 2 and Table 2).
| Region | FWHMb | |
|---|---|---|
| (arcsec) | (arcsec) | |
| Nucleus | 0.21 | |
| Diffuse | 2.4 | |
| N | 0.52 | 0.73 |
| S | 0.59 | 0.72 |
| E | 0.60 | 0.54 |
| W | 0.61 | 0.45 |
Notes: (a) Angular distance between the nucleus and the component. (b) Deconvolved FWHM.
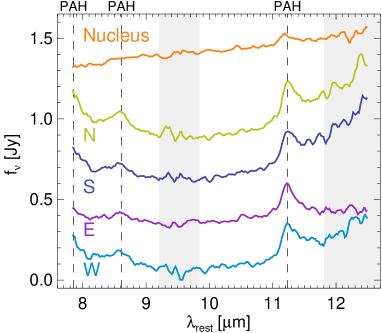
Similarly, we used this information to extract the CC N-band spectra. For each wavelength we generated a synthetic image taking into account the CC N-band PSF, and then we simulated the two slit orientations (P.A. 0 and 90∘) to obtain the one-dimensional spatial profiles. We varied the intensities of the different regions to reproduce simultaneously the observed N-S and E-W profiles at each wavelength. The resulting spectra are plotted in Figure 3. The fluxes at 10 and 12 m, and the 11.3 m PAH flux and equivalent width (EW) are listed in Table 2.
| Region | fν(10 m)a | fν(12 m)a | fν(24.1 m)b | 11.3 m PAHc | fν(Pa)e | |
|---|---|---|---|---|---|---|
| (mJy) | (mJy) | (Jy) | (10-13 erg cm-2 s-1) | (10-3 m) | (mJy) | |
| Nucleus | 120 8 | 210 20 | 0.5 | 3.2 0.6 | 79 8 | 2.2 |
| N | 91 10 | 390 30 | 1.7 0.6 | 12.7 0.2 | 220 5 | 5.2 |
| S | 81 10 | 390 50 | 1.6 0.4 | 9.3 0.5 | 170 3 | 5.0 |
| E | 61 6 | 130 10 | 2.0 0.7 | 13.2 0.3 | 500 20 | 5.5 |
| W | 73 20 | 280 30 | 0.6 0.3 | 14.2 0.4 | 350 10 | 4.6 |
Notes: 3 upper limits are indicated for non-detections. The uncertainties do not include the 10–15 % absolute calibration error. All the wavelengths are rest-frame. (a) The monochromatic 10 and 12 m fluxes are measured in the CC spectra of each region (see Section 3.1). (b) 24.1 m fluxes derived from the CC -band imaging (see Section 3.1). (c) Flux of the 11.3 m PAH feature. (d) EW of the 11.3 m PAH. (e) Pa flux measured in the continuum subtracted F190N NICMOS images (Alonso-Herrero et al., 2006). To convert to flux units, these values should be multiplied by 1.5610-14 erg cm-2 s-1 mJy-1.
3.2 Spectral Modeling
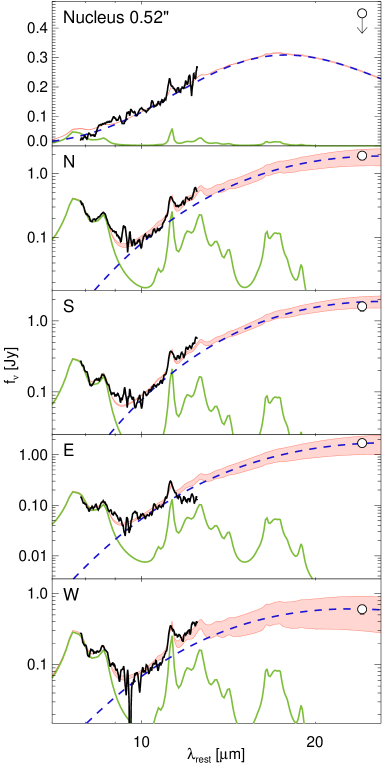
For the five selected regions, we decomposed the -band spectra together with the 24 m photometry using a two component model consisting of a modified black-body with and a PAH emission template. The latter is derived from the Spitzer/IRS starburst template presented by Smith et al. (2007) after removing the dust continuum emission (see Pereira-Santaella et al. 2015 for details). We excluded the low-atmospheric transmission spectral ranges marked in Figure 3 for the fitting.
The black-body temperature and the intensities of the black-body and the PAH template are free parameters of the model. In addition, we let the relative strength of the 11.3 m PAH feature free during the fit since the strength of the different PAH features varies both in starbursts (Smith et al., 2007) and Seyfert galaxies (Diamond-Stanic & Rieke, 2010).
We calculated the warm dust mass using the following relation
| (1) |
where is the distance, the observed flux, the absorption opacity coefficient, and the Planck’s blackbody law, all of them evaluated at 10 m. We assumed cm2 g-1 (Li & Draine, 2001).
The results of the fits are shown in Table 3 and Figure 4. The mid-IR emission of the SF ring regions are well fitted by a combination of a PAH component, which dominates the emission below 9 m, and a warm (110 K) dust continuum component which dominates the emission at longer wavelengths. By contrast, the nuclear 8–13 m spectrum is completely dominated by a warmer (160 K) dust component.
| Region | a | b | c |
|---|---|---|---|
| (K) | (103) | ||
| Nucleus | 1.7 0.2 | 160 8 | 0.2 |
| N | 3.6 0.5 | 110 3 | 7.6 |
| S | 3.1 0.4 | 109 4 | 8.9 |
| E | 2.9 0.5 | 108 6 | 6.3 |
| W | 3.3 0.6 | 115 3 | 3.9 |
4 The AGN or SF Nature of the Nucleus
The nature of the nucleus (central 150 pc) of NGC 1614 is not well established. In part, this is because it is surrounded by a circumnuclear ring with strong star-formation (ring SFR40 yr-1; Alonso-Herrero et al. 2001), which masks the relatively weak nuclear emission when observed at lower angular resolutions.
In the high-angular resolution (011) HST/NICMOS images, the nucleus is slightly resolved and shows near-IR colors compatible with stellar emission, although the CO index is inconsistent with an old stellar population (Alonso-Herrero et al., 2001). To explain this, Alonso-Herrero et al. (2001) suggested that the nuclear SF is more evolved than that of the star-forming ring.
Based on ASCA X-ray observations, Risaliti et al. (2000) suggested that NGC 1614 may host a Compton-thick AGN. However, the Fe K 6.4 keV line, which usually has a high EW in Compton-thick AGNs (although it depends on the obscuring matter geometry; see e.g., Fabian et al. 2002), is not detected in more sensitive XMM-Newton observations (Pereira-Santaella et al., 2011). More recently, the non-detection of CO(6–5) emission and 435 m continuum in the nucleus in high-resolution ALMA observations implies that the amount of dust and molecular gas is much lower than that expected for a Compton-thick AGN (Xu et al., 2015). Similarly, interferometric radio continuum observations reveal that the nuclear emission is mostly thermal and relatively weak, which also supports the non-AGN nuclear activity (Herrero-Illana et al., 2014). Consequently, SF, as traced by the nuclear Pa emission, would be the dominant energy source of the nucleus of NGC 1614.
Our new mid-IR data challenge these previous results. The nuclear spectrum shows a strong 12 m mid-IR continuum (and a low EW of the 11.3 m PAH feature), and the nuclear 24 m continuum is weak in comparison with the SF ring emission. Therefore, the nucleus of NGC 1614 presents some characteristics (weak X-ray and far-IR emissions, lacking molecular gas, strong 12 m mid-IR continuum, and Pa emission) that cannot be explained in a standard AGN or SF context. In the following, we discuss possible modifications to the AGN and SF scenarios to explain the observations available so far.
4.1 X-ray weak AGN?
4.1.1 Mid-IR AGN evidences
The CC spectrum of the nucleus is remarkably different from the spectra of the star-forming regions in the ring of SF. It shows a strong mid-IR continuum relative to the PAH emission, a dust temperature higher than in the SF regions of the ring (Table 3), and a continuum peak at around 20 m (Figure 4).
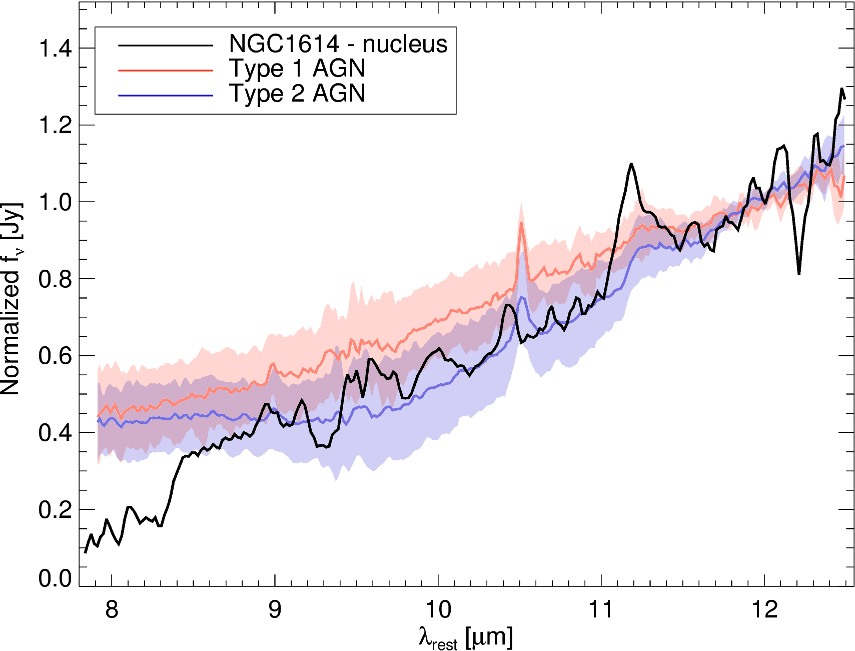
Differences in the dust continuum emission are also evident if we consider the 24 m to 10 m flux ratio which is 10-30 in the ring and 5 in the nucleus (see Table 2 and Figure 1). Low 24 m/10 m ratios are predicted by AGN torus models because of the high dust temperatures reached in the torus (150–1500 K; Nenkova et al. 2008). Moreover, mid-IR Spitzer/IRS spectroscopy of active galaxies shows that for 30 % of them (including Type 1 and 2 Seyfert objects) the mid-IR spectra peaks at 20 m indicating that a warm dust component ( K) dominates the mid-IR emission (Buchanan et al., 2006; Wu et al., 2009). This trend is also observed in ground-based sub-arcsecond mid-IR spectroscopic surveys of Seyfert galaxies (e.g., Alonso-Herrero et al. 2011; Ramos Almeida et al. 2009, 2011). In Figure 5 we compare the average Type 1 and Type 2 AGN mid-IR spectra obtained by Alonso-Herrero et al. (2014) for nearby Seyfert galaxies. It shows that they all have similar continuum slopes. This suggests that the warm dust conditions in the nucleus of NGC 1614 are similar to those found in Seyfert galaxies. Although, the emission of hotter dust (at 8 m) is weaker in NGC 1614.
The minimum 11.3 m PAH EW is located at the nucleus (79 8) m (Table 2). This behavior is also observed in local Seyfert galaxies, and it is explained in these objects by the increased AGN continuum contribution in the nucleus (Alonso-Herrero et al., 2014; Esquej et al., 2014; Ramos Almeida et al., 2014; García-Bernete et al., 2015). In addition, in the nucleus of NGC 1614, the 11.3 m PAH feature is enhanced by a factor of 2 with respect to the 7.7 m PAH feature (Table 3). Similar enhancements of the 11.3 m PAH feature are observed in active galaxies although on kpc scales (Diamond-Stanic & Rieke, 2010).
4.1.2 Weak X-ray Emission
A correlation between the 12 m and the 2–10 keV luminosities is observed for Seyfert galaxies (Horst et al., 2008; Levenson et al., 2009; Gandhi et al., 2009; Asmus et al., 2011). For the nuclear 12 m luminosity measured from the spectrum of NGC 1614 (2.61043 erg s-1) the expected hard X-ray luminosity would be 1.61043 erg s-1 according to the Gandhi et al. (2009) relation. Threfore, both the nuclear 12 m and expected 2–10 keV luminosities are comparable to that of an average local Seyfert galaxy (see Figure 1 of Gandhi et al. 2009). However, the observed integrated hard X-ray luminosity of this galaxy is just 1.41041 erg s-1, almost a factor of 200 lower than expected for an AGN, and most of it can be explained by the hard X-ray emission from star-formation (i.e., high-mass X-ray binaries; Pereira-Santaella et al. 2011). Similarly, the soft X-ray emission is also better explained by star-formation (Pereira-Santaella et al., 2011; Herrero-Illana et al., 2014).
If an AGN is present in the nucleus of NGC 1614, three possibilities may explain the weakness of the X-ray emission: it may be a strongly variable source observed during its low state; it may be a Compton-thick AGN so the 2–10 keV emission is absorbed; or it may be an intrinsically X-ray weak AGN. There are three hard X-ray observations of NGC 1614 during 18 yr (Table 4) which show that the variability is less than a factor of 2. So it is not likely that X-ray variability is the reason for the X-ray weakness. The Compton-thick AGN possibility was rejected by Xu et al. (2015) based on the low amount of molecular gas and cold dust in the nucleus. Moreover, NGC 1614 is not detected in the 14–195 keV Swift/BAT 70-Month Hard X-ray Survey (Baumgartner et al., 2013). If NGC 1614 would be a Compton-thick AGN with an intrinsic 2–10 keV luminosity of 1.61043 erg s-1 (see above), its 14–195 keV flux would be111Using XSPEC (Arnaud, 1996) and assuming a power-law spectrum with (Marconi et al., 2004) and 31024 cm-2. Increasing the up to 1026 cm-2 the flux would be reduced by factor of two. 610-11 erg cm-2 s-1, which is 4 times the 5 sensitivity of the Swift/BAT survey. Finally, it is also possible that the X-ray emission of the NGC 1614 AGN is intrinsically weak. The ultra-luminous IR galaxy Mrk 231 (Teng et al., 2014), as well as several quasars (Leighly et al., 2007; Miniutti et al., 2012; Luo et al., 2014), have X-ray luminosities 30–100 times weaker than those predicted by the 222 vs. correlation, probably due to a distortion of the accretion disk corona (Miniutti et al., 2012; Luo et al., 2013). In the case of NGC 1614, the nuclear UV emission is completely obscured (see Petty et al. 2014), so a direct comparison with the results for these X-ray weak AGNs is not possible. However, using the 12 m emission we obtain that the observed 2–10 keV emission is more than two orders of magnitude lower than the expected value, similar to the X-ray weakness observed on those objects.
4.2 or Nuclear Star-formation?
Alternatively, it is possible to explain the nuclear observations assuming only star-formation (SF). However, the nuclear SF and the SF taking place in the ring surrounding the nucleus must have very different characteristics. In particular, the nuclear mid-IR spectrum shows a strong 8–12 m continuum that is not present in the ring spectra (Figure 4), and the nucleus remains undetected in the 435 m far-IR continuum and CO(3–2) maps (Xu et al., 2015; Usero, 2015 in prep.) while the ring is clearly detected.
In our nuclear mid-IR spectrum, we detect the 11.3 m PAH feature which is usually associated with SF (mostly B stars, see Peeters et al. 2004). Using the SFR calibration of Diamond-Stanic & Rieke (2012), we estimate a nuclear SFR of 0.9 yr-1 (Table 5 and see Section 5). We also used the nuclear Pa flux (Díaz-Santos et al., 2008) to derive a SFR 1.5 yr-1 (assuming 0.3 mag; Alonso-Herrero et al. 2001), so both SFR tracers are in agreement within a factor of 2. Finally, we used the IR continuum upper limits at 24 and 432 m to derive an upper limit for the nuclear IR (4-1000 m) luminosity of 61043 erg s-1. This upper limit is compatible with the expected IR luminosity for a SFR1.5 yr-1 (41043 erg s-1; Kennicutt & Evans 2012). Therefore, all these IR SFR tracers are compatible and they indicate that the nuclear SFR is 1.5 yr-1, that is, less than 2 % of the total SFR of NGC 1614 (100 yr-1; Pereira-Santaella et al. 2015).
However, the nuclear and the integrated IR (8–500 m) spectral energy distributions are very different. The ring is detected at 435 m (Xu et al., 2015) and 24 m (Figure 1),but the nucleus is not. Therefore, this implies that the dust temperature is much higher in the nucleus, as already suggested by our mid-IR data. This higher nuclear dust temperature (Table 3) can be explained by the enhanced radiation field density, which is expected to increase the dust temperature (see Draine & Li 2007), due to an increased density of young stars in the nucleus (or an AGN, see Section 4.1.2).
Molecular gas is not detected in the nucleus of NGC 1614. From the 05 resolution CO(3-2) ALMA observations of NGC 1614, Usero (2015 in prep.) estimate an upper limit to the nuclear molecular gas mass of 3106 333Assuming a CO(3-2) to CO(1-0) ratio of 1 and the Galactic CO-to-H2 conversion factor (Bolatto et al., 2013). Using the conversion factor for ULIRGs it would be a factor of 4 lower.. This low molecular gas mass puts the nucleus of NGC 1614 well above the Kennicutt-Schmidt relation (see Figure 8 of Xu et al. 2015). Consequently, the molecular gas depletion time is 3 Myr, much lower than in normal galaxies at 100 pc scales (1–3 Gyr; e.g., Leroy et al. 2013), and also lower than in local ULIRGs (70–100 Myr; e.g., Combes et al. 2013). A short depletion time might indicate that the ignition of the nuclear SF occurred earlier than in the ring (see Alonso-Herrero et al. 2001). Therefore, the nuclear starburst would have consumed a larger fraction of the original cold molecular gas than the younger starburst of the ring. Actually, the evolutionary state of the SF regions is commonly used to explain the dispersion of individual SF regions in the Kennicutt-Schmidt relation (e.g., Onodera et al. 2010; Schruba et al. 2010; Kruijssen & Longmore 2014). However, the integrated (including nucleus and SF ring) dense molecular gas depletion time in NGC 1614 is also shorter (10 Myr) than in other LIRGs (50 Myr; García-Burillo et al. 2012), so it is not obvious to associate the particularly short nuclear depletion time with older SF. Alternatively, a massive molecular outflow, produced by an AGN or SN explosions (see García-Burillo et al. 2015), could have swept most the molecular gas away from the nucleus.
On the other hand, the hard X-ray luminosity of this object is also compatible with a SF origin (Pereira-Santaella et al., 2011), although most of the emission would be produced in the ring. Unfortunately, the angular resolution of the Chandra X-ray data is not sufficient to separate the nucleus and the ring (Herrero-Illana et al., 2014).
Note that, in principle, a combination of SF and a normal AGN would be also possible. However, this assumption suffers the same problems explaining the observations than the SF and AGN individually. For these reason, we do not discuss this AGNSF composite possibility.
| SFR ( yr-1) | ||||
|---|---|---|---|---|
| Region | a | Pa b | 11.3 m PAH c | 24 m d |
| Nucleus⋆ | 0.3 | 1.5 | 0.9 | 6 |
| N | 0.7 | 9.3 | 4.1 | 22 |
| S | 0.8 | 11.2 | 3.1 | 21 |
| E | 0.6 | 7.8 | 4.1 | 26 |
| W | 1.0 | 16.4 | 5.2 | 7 |
Notes: (a) -band extinction in magnitudes derived from the stellar colors (Alonso-Herrero et al., 2001). (b) Extinction corrected Pa SFR using the Kennicutt & Evans (2012) calibration assuming H/Pa = 8.51. (c) SFR obtained from the 11.3 m PAH luminosities (Table 2) based on the Diamond-Stanic & Rieke (2012) calibration. We multiplied by 2 our 11.3 m PAH luminosities to account for the different method used to measure the PAH features (local continuum vs. full decomposition, see Smith et al. 2007). (d) SFR derived from the monochromatic 24 m luminosities (Table 2) using the Rieke et al. (2009) calibration. (⋆) Nuclear SFR derived assuming that all the nuclear emission is produced by SFR (i.e., no AGN).
5 SFR Tracers at 150 pc Scales
Using the new CC mid-IR data (11.3 m PAH and 24 m continuum) in combination with the NICMOS Pa image, we can test several SFR calibrations at 150 pc scales in this galaxy.
In Table 5 we show a summary of the SFR derived using these tracers for the five regions we defined in NGC 1614. We used the calibrations of Kennicutt & Evans (2012), Diamond-Stanic & Rieke (2012), and Rieke et al. (2009) for the Pa, 11.3 m PAH, and 24 m tracers, respectively. The Pa emission was corrected for extinction using the near-IR continuum colors (see Alonso-Herrero et al. 2001). Since the extinction corrected Pa calibration is a direct measurement of the number of ionizing photons produced by young stars, we consider it as the reference SFR tracer.
The 24 m luminosity gives the highest SFR values (2–3 and 5–7 times higher than those derived from the Pa and 11.3 m PAH luminosities, respectively), except in the W region of the ring. The modeling of the radio emission of the W region indicates the presence of supernovae (SN; Herrero-Illana et al. 2014), so it could be more evolved than the rest of the ring. Therefore, a lower amount of young stars would be dust embedded in this region reducing the warm dust emission.
The disagreement between the extinction corrected Pa and the 24 m SFR values is 0.4 dex, which is higher than the calibration uncertainty (0.2 dex). Although, in principle, both tracers should produce similar SFR estimates (see Equations 5 and 8 of Rieke et al. 2009). There are two possibilities to explain this. First, it is possible that even the extinction corrected Pa emission underestimates the SFR. In extremely obscured regions (e.g., 15–20 mag), dust might absorb the Pa emission completely, as well as part of the ionizing photons, and therefore, rendering any extinction correction ineffective. Alternatively, an increase of the dust temperature at high SFR densities, like in the SF ring of NGC 1614, can produce enhanced 24 m emission that might not be taken into account by the 24 m SFR calibration which is valid for integrated emission of galaxies (e.g., Calzetti et al. 2010). The stellar measured in the SF ring of NGC 1614 is 0.6–1.0 mag ( 5–10 mag; Alonso-Herrero et al. 2001), so the obscuration level is not as extreme as observed in some ULIRGs ( 8–80 mag; Armus et al. 2007). In addition, the 9.7 m silicate absorption in the SF ring spectra is not very deep (Figure 4). Therefore, this favors the second possibility. That is, an increased 24 m emission in the SF ring of NGC 1614 due to a warmer dust emission.
According to Table 5, the SFR derived from the 11.3 m PAH luminosity is 2–4 times lower than that derived from Pa. The 11.3 m PAH SFR calibration is based on kpc integrated measurements (Diamond-Stanic & Rieke, 2012). However, it is known that the PAH emission, and in particular the 11.3 m PAH emission, is more extended than the warm dust continuum and other ionized gas tracers (e.g., [Ne ii]12.81 m; Díaz-Santos et al. 2011). Actually, 30–40 % of the total PAH emission is not related to recent SF (Crocker et al., 2013). Therefore, this SFR calibration possibly includes a considerable amount of PAH emission not produced by young stars. In addition, using templates of SF galaxies, Rieke et al. (2009) showed that the 11.3 m PAH contribution to the total IR luminosity drops by a factor of 2.5 for galaxies with . A similar result was found by Alonso-Herrero et al. (2013) for a sample of local LIRGs. A combination of these reasons might explain why we obtain these relatively low SFR estimates from the 11.3 m PAH luminosities for the 150 pc SF regions in the ring of NGC 1614.
6 Conclusions
We analyzed new GTC/CC high-angular resolution (05) mid-IR observations of the local LIRG NGC 1614. The new -band spectroscopy and -band imaging are combined with existing HST/NICMOS Pa and T-ReCS 8.7 m images to study the properties of the bright circumnuclear SF ring and the nucleus of this object. The main results are the following:
-
1.
We extracted mid-IR spectra from four different regions in the circumnuclear SF ring and from the nuclear region (central 05150 pc). The spectra from the SF ring are typical of a SF region with strong PAH emission and a shallow 9.7 m silicate absorption. By contrast, the nuclear spectrum has a strong mid-IR continuum, which dominates its mid-IR emission, and weak PAH emission (EW=8010-3 m). Similarly, the SF ring is clearly detected in the 24.5 m image, as expected for a SF region, while the nucleus is weaker at this wavelength.
-
2.
A two component model, consisting of a modified black-body with and a PAH emission template, reproduces the observed spectra and photometry well. The main differences between the nuclear and the SF ring observations are: the higher dust temperature in the nucleus (160 K in the nucleus vs. 110 K in the ring); the lower PAH EW; and the lower nuclear 7.7 m/11.3 m PAH ratio.
-
3.
The above results based on the mid-IR data, suggest that an AGN might be present in the nucleus. However, this is at odds with the low X-ray luminosity of NGC 1614 (200 times lower than that expected for an AGN with the observed 12 m continuum luminosity). Since the hard (2–10 keV) X-ray emission shows no variability, and likely it is not a Compton-thick AGN, if an AGN is present in NGC 1614, it must be an intrinsically X-ray weak AGN. We also calculated an upper limit to the IR luminosity of the nucleus, 61043 erg s-1.
-
4.
Alternatively, SF can explain the observations of the nucleus too. However, we need to invoke extremely short molecular gas depletion times (3 Myr for a nuclear SFR of 1–1.5 yr-1), and an increased radiation field density to explain the observed hot dust in the nucleus.
-
5.
Finally, we compared three SFR tracers at 150 pc scales in the circumnuclear ring: extinction corrected Pa, 11.3 m PAH, and 24 m continuum. Since the extinction is not extremely high ( mag), we take as reference the Pa derived SFR. In general, the 24 m SFR overestimates the SFR by a factor of 2–3, while the 11.3 m PAH underestimates the SFR by a factor of 2–4. The former might be explained if the dust temperature is higher in the SF regions of NGC 1614, while the latter could be because we do not include diffuse PAH emission in our measurements as well as because the PAH contribution to the total IR luminosity might be reduced in LIRGs.
-
6.
In the West region of the ring, the 24 m emission is 5 times weaker than expected based on the observed Pa/24 m ratio in this galaxy. We propose that this is because this is a more evolved SF region (SN are present; Herrero-Illana et al. 2014) where a larger fraction of the young stars are not dust embedded.
In summary, our mid-IR data suggest that an intrinsically X-ray weak AGN (1043 erg s-1, 5 % of the NGC 1614 bolometric luminosity) might be present in the nucleus of NGC 1614. However, SF with a short molecular gas depletion time and increased dust temperatures can explain the observations as well. In order to further investigate the nature of the nucleus of this galaxy, IR and sub-mm high-angular resolution observations are needed.
Acknowledgments
We thank the anonymous referee for useful comments and suggestions. We thank the GTC staff for their continued support on the CanariCam observations. We acknowledge support from the Spanish Plan Nacional de Astronomía y Astrofísica through grants AYA2010-21161-C02-01, and AYA2012-32295. AAH and AA acknowledges funding from the Spanish Ministry of Economy and Competitiveness under grants AYA2012-31447 and AYA2012-38491-CO2-02, which are party funded by the FEDER program. MAPT acknowledges support from the Spanish MICINN through grant AYA2012-38491-C02-02. CRA acknowledges support from a Marie Curie Intra European Fellowship within the 7th European Community Framework Programme (PIEF-GA-2012-327934). Based on observations made with the Gran Telescopio Canarias (GTC), installed in the Spanish Observatorio del Roque de los Muchachos of the Instituto de Astrofísica de Canarias, in the island of La Palma. Partially based on observations obtained at the Gemini Observatory (program GS-2006B-Q-9), which is operated by the Association of Universities for Research in Astronomy, Inc., under a cooperative agreement with the NSF on behalf of the Gemini partnership: the National Science Foundation (United States), the National Research Council (Canada), CONICYT (Chile), the Australian Research Council (Australia), Ministério da Ciência, Tecnologia e Inovação (Brazil) and Ministerio de Ciencia, Tecnología e Innovación Productiva (Argentina).
References
- Alonso-Herrero et al. (2001) Alonso-Herrero, A., Engelbracht, C. W., Rieke, M. J., Rieke, G. H., & Quillen, A. C. 2001, ApJ, 546, 952
- Alonso-Herrero et al. (2013) Alonso-Herrero, A., Pereira-Santaella, M., Rieke, G. H., et al. 2013, ApJ, 765, 78
- Alonso-Herrero et al. (2014) Alonso-Herrero, A., Ramos Almeida, C., Esquej, P., et al. 2014, MNRAS, 443, 2766
- Alonso-Herrero et al. (2011) Alonso-Herrero, A., Ramos Almeida, C., Mason, R., et al. 2011, ApJ, 736, 82
- Alonso-Herrero et al. (2006) Alonso-Herrero, A., Rieke, G. H., Rieke, M. J., et al. 2006, ApJ, 650, 835
- Armus et al. (2007) Armus, L., Charmandaris, V., Bernard-Salas, J., et al. 2007, ApJ, 656, 148
- Arnaud (1996) Arnaud, K. A. 1996, in Astronomical Society of the Pacific Conference Series, Vol. 101, Astronomical Data Analysis Software and Systems V, ed. G. H. Jacoby & J. Barnes, 17
- Asmus et al. (2011) Asmus, D., Gandhi, P., Smette, A., Hönig, S. F., & Duschl, W. J. 2011, A&A, 536, A36
- Asmus et al. (2014) Asmus, D., Hönig, S. F., Gandhi, P., Smette, A., & Duschl, W. J. 2014, MNRAS, 439, 1648
- Baumgartner et al. (2013) Baumgartner, W. H., Tueller, J., Markwardt, C. B., et al. 2013, ApJS, 207, 19
- Bolatto et al. (2013) Bolatto, A. D., Wolfire, M., & Leroy, A. K. 2013, ARA&A, 51, 207
- Buchanan et al. (2006) Buchanan, C. L., Gallimore, J. F., O’Dea, C. P., et al. 2006, AJ, 132, 401
- Calzetti et al. (2010) Calzetti, D., Wu, S.-Y., Hong, S., et al. 2010, ApJ, 714, 1256
- Caputi et al. (2007) Caputi, K. I., Lagache, G., Yan, L., et al. 2007, ApJ, 660, 97
- Cohen et al. (1999) Cohen, M., Walker, R. G., Carter, B., et al. 1999, AJ, 117, 1864
- Combes et al. (2013) Combes, F., García-Burillo, S., Braine, J., et al. 2013, A&A, 550, A41
- Crocker et al. (2013) Crocker, A. F., Calzetti, D., Thilker, D. A., et al. 2013, ApJ, 762, 79
- Diamond-Stanic & Rieke (2010) Diamond-Stanic, A. M. & Rieke, G. H. 2010, ApJ, 724, 140
- Diamond-Stanic & Rieke (2012) Diamond-Stanic, A. M. & Rieke, G. H. 2012, ApJ, 746, 168
- Díaz-Santos et al. (2008) Díaz-Santos, T., Alonso-Herrero, A., Colina, L., et al. 2008, ApJ, 685, 211
- Díaz-Santos et al. (2011) Díaz-Santos, T., Charmandaris, V., Armus, L., et al. 2011, ApJ, 741, 32
- Draine & Li (2007) Draine, B. T. & Li, A. 2007, ApJ, 657, 810
- Esquej et al. (2014) Esquej, P., Alonso-Herrero, A., González-Martín, O., et al. 2014, ApJ, 780, 86
- Evans et al. (2014) Evans, P. A., Osborne, J. P., Beardmore, A. P., et al. 2014, ApJS, 210, 8
- Fabian et al. (2002) Fabian, A. C., Wilman, R. J., & Crawford, C. S. 2002, MNRAS, 329, L18
- Gandhi et al. (2009) Gandhi, P., Horst, H., Smette, A., et al. 2009, A&A, 502, 457
- García-Bernete et al. (2015) García-Bernete, I., Ramos Almeida, C., Acosta-Pulido, J. A., et al. 2015, MNRAS, 449, 1309
- García-Burillo et al. (2015) García-Burillo, S., Combes, F., Usero, A., et al. 2015, A&A, 580, A35
- García-Burillo et al. (2012) García-Burillo, S., Usero, A., Alonso-Herrero, A., et al. 2012, A&A, 539, A8
- González-Martín et al. (2013) González-Martín, O., Rodríguez-Espinosa, J. M., Díaz-Santos, T., et al. 2013, A&A, 553, A35
- Herrero-Illana et al. (2014) Herrero-Illana, R., Pérez-Torres, M. Á., Alonso-Herrero, A., et al. 2014, ApJ, 786, 156
- Horst et al. (2008) Horst, H., Gandhi, P., Smette, A., & Duschl, W. J. 2008, A&A, 479, 389
- Imanishi et al. (2011) Imanishi, M., Imase, K., Oi, N., & Ichikawa, K. 2011, AJ, 141, 156
- Imanishi et al. (2010) Imanishi, M., Nakagawa, T., Shirahata, M., Ohyama, Y., & Onaka, T. 2010, ApJ, 721, 1233
- Kennicutt & Evans (2012) Kennicutt, R. C. & Evans, N. J. 2012, ARA&A, 50, 531
- König et al. (2013) König, S., Aalto, S., Muller, S., Beswick, R. J., & Gallagher, J. S. 2013, A&A, 553, A72
- Kroupa (2001) Kroupa, P. 2001, MNRAS, 322, 231
- Kruijssen & Longmore (2014) Kruijssen, J. M. D. & Longmore, S. N. 2014, MNRAS, 439, 3239
- Le Floc’h et al. (2005) Le Floc’h, E., Papovich, C., Dole, H., et al. 2005, ApJ, 632, 169
- Leighly et al. (2007) Leighly, K. M., Halpern, J. P., Jenkins, E. B., et al. 2007, ApJ, 663, 103
- Leroy et al. (2013) Leroy, A. K., Walter, F., Sandstrom, K., et al. 2013, AJ, 146, 19
- Levenson et al. (2009) Levenson, N. A., Radomski, J. T., Packham, C., et al. 2009, ApJ, 703, 390
- Li & Draine (2001) Li, A. & Draine, B. T. 2001, ApJ, 554, 778
- Luo et al. (2013) Luo, B., Brandt, W. N., Alexander, D. M., et al. 2013, ApJ, 772, 153
- Luo et al. (2014) Luo, B., Brandt, W. N., Alexander, D. M., et al. 2014, ApJ, 794, 70
- Madau & Dickinson (2014) Madau, P. & Dickinson, M. 2014, ARA&A, 52, 415
- Magnelli et al. (2011) Magnelli, B., Elbaz, D., Chary, R. R., et al. 2011, A&A, 528, A35
- Marconi et al. (2004) Marconi, A., Risaliti, G., Gilli, R., et al. 2004, MNRAS, 351, 169
- Miniutti et al. (2012) Miniutti, G., Brandt, W. N., Schneider, D. P., et al. 2012, MNRAS, 425, 1718
- Nenkova et al. (2008) Nenkova, M., Sirocky, M. M., Nikutta, R., Ivezić, Ž., & Elitzur, M. 2008, ApJ, 685, 160
- Olsson et al. (2010) Olsson, E., Aalto, S., Thomasson, M., & Beswick, R. 2010, A&A, 513, A11
- Onodera et al. (2010) Onodera, S., Kuno, N., Tosaki, T., et al. 2010, ApJ, 722, L127
- Peeters et al. (2004) Peeters, E., Spoon, H. W. W., & Tielens, A. G. G. M. 2004, ApJ, 613, 986
- Peng et al. (2010) Peng, C. Y., Ho, L. C., Impey, C. D., & Rix, H.-W. 2010, AJ, 139, 2097
- Pereira-Santaella et al. (2015) Pereira-Santaella, M., Alonso-Herrero, A., Colina, L., et al. 2015, A&A, 577, A78
- Pereira-Santaella et al. (2011) Pereira-Santaella, M., Alonso-Herrero, A., Santos-Lleo, M., et al. 2011, A&A, 535, A93
- Pérez-González et al. (2005) Pérez-González, P. G., Rieke, G. H., Egami, E., et al. 2005, ApJ, 630, 82
- Petty et al. (2014) Petty, S. M., Armus, L., Charmandaris, V., et al. 2014, AJ, 148, 111
- Ramos Almeida et al. (2014) Ramos Almeida, C., Alonso-Herrero, A., Esquej, P., et al. 2014, MNRAS, 445, 1130
- Ramos Almeida et al. (2011) Ramos Almeida, C., Levenson, N. A., Alonso-Herrero, A., et al. 2011, ApJ, 731, 92
- Ramos Almeida et al. (2009) Ramos Almeida, C., Levenson, N. A., Rodríguez Espinosa, J. M., et al. 2009, ApJ, 702, 1127
- Rieke et al. (2009) Rieke, G. H., Alonso-Herrero, A., Weiner, B. J., et al. 2009, ApJ, 692, 556
- Risaliti et al. (2000) Risaliti, G., Gilli, R., Maiolino, R., & Salvati, M. 2000, A&A, 357, 13
- Sanders et al. (2003) Sanders, D. B., Mazzarella, J. M., Kim, D.-C., Surace, J. A., & Soifer, B. T. 2003, AJ, 126, 1607
- Schruba et al. (2010) Schruba, A., Leroy, A. K., Walter, F., Sandstrom, K., & Rosolowsky, E. 2010, ApJ, 722, 1699
- Siebenmorgen et al. (2008) Siebenmorgen, R., Haas, M., Pantin, E., et al. 2008, A&A, 488, 83
- Sliwa et al. (2014) Sliwa, K., Wilson, C. D., Iono, D., Peck, A., & Matsushita, S. 2014, ApJ, 796, L15
- Smith et al. (2007) Smith, J. D. T., Draine, B. T., Dale, D. A., et al. 2007, ApJ, 656, 770
- Soifer et al. (2001) Soifer, B. T., Neugebauer, G., Matthews, K., et al. 2001, AJ, 122, 1213
- Telesco et al. (2003) Telesco, C. M., Ciardi, D., French, J., et al. 2003, Proc. SPIE, 4841, 913
- Teng et al. (2014) Teng, S. H., Brandt, W. N., Harrison, F. A., et al. 2014, ApJ, 785, 19
- Usero (2015 in prep.) Usero, A. 2015 in prep.
- Väisänen et al. (2012) Väisänen, P., Rajpaul, V., Zijlstra, A. A., Reunanen, J., & Kotilainen, J. 2012, MNRAS, 420, 2209
- Wu et al. (2009) Wu, Y., Charmandaris, V., Huang, J., Spinoglio, L., & Tommasin, S. 2009, ApJ, 701, 658
- Xu et al. (2015) Xu, C. K., Cao, C., Lu, N., et al. 2015, ApJ, 799, 11
- Yuan et al. (2010) Yuan, T.-T., Kewley, L. J., & Sanders, D. B. 2010, ApJ, 709, 884