Motor protein accumulation on antiparallel microtubule overlaps
Abstract
Biopolymers serve as one-dimensional tracks on which motor proteins move to perform their biological roles. Motor protein phenomena have inspired theoretical models of one-dimensional transport, crowding, and jamming. Experiments studying the motion of Xklp1 motors on reconstituted antiparallel microtubule overlaps demonstrated that motors recruited to the overlap walk toward the plus end of individual microtubules and frequently switch between filaments. We study a model of this system that couples the totally asymmetric simple exclusion process (TASEP) for motor motion with switches between antiparallel filaments and binding kinetics. We determine steady-state motor density profiles for fixed-length overlaps using exact and approximate solutions of the continuum differential equations and compare to kinetic Monte Carlo simulations. Overlap motor density profiles and motor trajectories resemble experimental measurements. The phase diagram of the model is similar to the single-filament case for low switching rate, while for high switching rate we find a new low density-high density-low density-high density phase. The overlap center region, far from the overlap ends, has a constant motor density as one would naïvely expect. However, rather than following a simple binding equilibrium, the center motor density depends on total overlap length, motor speed, and motor switching rate. The size of the crowded boundary layer near the overlap ends is also dependent on the overlap length and switching rate in addition to the motor speed and bulk concentration. The antiparallel microtubule overlap geometry may offer a previously unrecognized mechanism for biological regulation of protein concentration and consequent activity.
Key words: motor proteins; microtubules; TASEP; cytoskeleton
Introduction
The motion of motor proteins on biopolymers is important for diverse biological processes (1). Actin, microtubules, and nucleic acids can serve as one-dimensional tracks on which motor proteins (including myosins, kinesins, helicases, and ribosomes) move (2, 3). Motors must accumulate on filaments in sufficient density to perform their biological roles. This motor accumulation along a biopolymer is affected by two key effects: the directional walking of motors and motor binding to/unbinding from the filament.
Motor accumulation on filaments is related to extensive theoretical work on asymmetric exclusion processes (ASEP) (4). In ASEP models, particles move on a one-dimensional (1D) lattice by biased hopping and experience excluded-volume interactions with other particles. These models have been applied to diverse examples of one-dimensional nonequilibrium transport ranging from molecular motors to vehicular and pedestrian traffic. Active particle motion leads to non-zero flux of particle density and nontrivial flux and density profiles. To compare to experimental studies of molecular motors, ASEP models have been extended to incorporate important biophysical ingredients such as binding kinetics. A model extending the totally asymmetric exclusion process (TASEP) to include motor binding and unbinding (Langmuir kinetics) predicted motor density profiles along single fixed-length filaments (5). Experimental work measured kinesin-8 motor protein traffic jams on microtubules and found good agreement with the predicted density profiles (6).
Motor motion on cytoskeletal filaments is important for biological length regulation, including regulation of the length of the polymer (7), lengths of overlap regions between filaments (8), and the length of cytoskeletal assemblies such as the mitotic spindle (9, 10) and even whole cells (11, 12). The case of regulation of microtubule (MT) length has seen the most work. MTs undergo nonequilibrium polymerization dynamics characterized by switching between distinct growing and shrinking states. While this dynamic instability alone leads to a broad distribution of MT lengths (13), numerous proteins targeted to MT ends modify their dynamics and can dramatically alter the length distribution (14). Single MTs can have their length regulated, for example, by kinesin-8 motors that walk with directional bias and shorten the MT from its end (15, 16, 7). Theoretical work on TASEP-like models has described how length-dependent depolymerization affects otherwise static filaments (17, 7, 18), filaments with simplified polymerization kinetics, (19, 20, 21, 22), and dynamic MTs (23, 24, 25).
Because the mitotic spindle includes arrays of overlapping antiparallel MTs at the spindle midzone, regulation of MT overlaps is important for mitotic spindle function and cytokinesis. The MT crosslinking protein PRC1/Ase1/MAP65 and kinesin-4 motors (chromokinesins) play roles in maintenance of the spindle midzone in anaphase (26, 27, 28), along with other motors and MAPs (29). Direct binding interactions of PRC1 and kinesin 4 can cause length-dependent accumulation at plus ends of single MTs (30). Bieling, Telley, and Surrey (BTS) reconstituted a minimal system of stable antiparallel MT overlaps in which PRC1 bound preferentially to overlapping regions of antiparallel MTs (8) (see also Subramanian et al. (31)). PRC1 recruited the kinesin-4 motor Xklp1 to the overlap. Xklp1 motors could bind to and unbind from the MTs, walk toward the plus end of each MT, and switch between the two MTs at a relatively high rate (8). Motors present near the MT plus ends slowed the polymerization speed, consistent with earlier work showing that Xklp1 inhibits dynamic instability (32) and affects spindle MT mass (33). As a result, antiparallel MT overlaps reached a constant length that depended on the bulk concentration of motors. This work demonstrated that motor-dependent regulation of dynamics and length can occur not just for single MTs, but for overlapping MT pairs.
Here we model the motor density profiles of motor proteins on antiparallel MT overlaps of fixed lengths. We do not explicitly consider MT length regulation in this system, as the combination of binding kinetics and coupled switching of the motors between the two antiparallel filaments is sufficient to produce a rich phenomenology. Our work is an extension of Parmeggiani, Franosch, and Frey’s TASEP with binding kinetics on a single filament (5, 34) to include two antiparallel filaments coupled by switching; it is also an extension of TASEP models of two antiparallel lanes with lane switching (35, 36) to incorporate binding and unbinding kinetics.
We first develop the model and show that measured and estimated parameters can give overlap motor density profiles and motor trajectories qualitatively similar to those found in the BTS experiments. We then develop an analytic solution to the mean-field steady state equations, and use it to determine the phase diagram of the model. For high motor switching rate between filaments, we find a new low density-high density-low density-high density phase. We then study the model for the reference parameter set in more detail. Because the motor density profiles are controlled by both boundary conditions and a non-local total binding constraint, the density in the center of the overlap depends not just on motor binding kinetics but also on motor speed and overlap length. We find an analytical approximation that describes the overlap center density and the size of the motor-dense boundary layer near the overlap ends. The degree of motor accumulation near the overlap ends depends on the overlap length and motor switching rate in addition to the motor speed and bulk concentration. The coupling of motor motion, binding, and switching kinetics on antiparallel MT overlaps may therefore offer a previously unrecognized mechanism for the control of one-dimensional motor density profiles.
Materials and Methods
Model
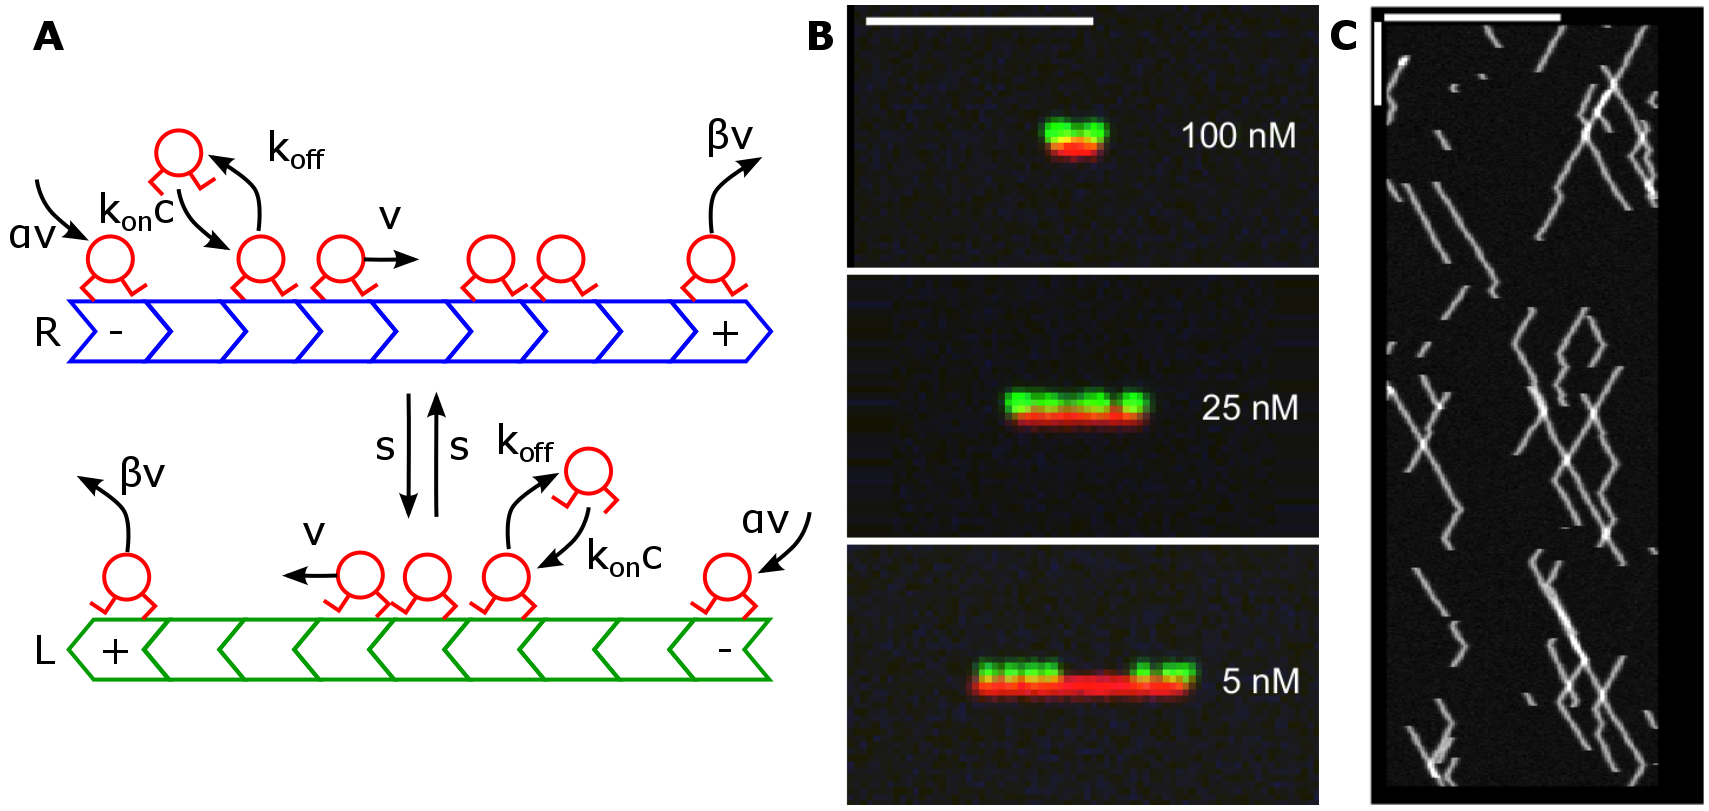
In this section, we develop a mathematical model of motor density on antiparallel filament overlaps, inspired by the experiments of Bieling, Telley, and Surrey (BTS) (8). In the BTS experiments, the crosslinking protein PRC1 binds preferentially to overlapping regions of antiparallel MTs and recruits the kinesin motor protein Xklp1 to the overlap region. Because PRC1 and therefore the motors are present at much higher concentrations in the overlap, in the model we consider the overlap region only and consider the regions of single filaments as sources or sinks of motor proteins (fig. 1A). While previous work has shown that PRC1/Ase1 alone can develop density inhomogeneities and exert forces on sliding MTs (37, 38), in the BTS experiments little to no MT sliding occurred and the PRC1 distribution was uniform in the overlaps (8). Therefore we do not explicitly model the PRC1 molecules or their spatial distribution, but assume they are uniformly distributed so that each lattice site in the overlap is identical with a binding affinity that would correspond to the density-weighted average of the PRC1 and bare tubulin affinities. We treat each MT as a single track and neglect the multiple-protofilament structure of the MT, consistent with previous theoretical work (19, 7, 17, 18, 20, 21, 24, 22). In our model, motors can bind to and unbind from each of the MTs, walk toward the plus end of a MT, and switch between the two MTs (fig. 1A).
There are two competing processes in this model: motor stepping (TASEP) and motor binding, unbinding, and MT switching (Langmuir kinetics). The Langmuir kinetics dominate the system behavior if the overlap length is sufficiently large, , so that each bound motor can only walk for a short fraction of the overlap length before it unbinds. Thus, the competition between TASEP and Langmuir kinetics occurs only if the overall binding rate to one MT in the overlap (where is the bulk motor concentration), and unbinding rate , are of similar magnitude to the motor speed (5).
In the next section, we develop the discrete microscopic model and corresponding stochastic simulation, then derive the mean-field continuum description.
Discrete model
We consider two overlapping antiparallel MTs of fixed length, so the number of sites is fixed (fig. 1A). At each site, motor binding or unbinding can occur with binding rate , where is the binding rate constant per site and the bulk motor concentration, and unbinding rate . Each bound motor steps at rate to the next site toward the MT plus end (if the next site is unoccupied), and switches at rate to the site on the adjacent MT (if that site is unoccupied). Note that Xklp1 is plus-end directed, and we therefore assume that the motion on a single MT is unidirectional.
The occupation number is if site is occupied or if site is empty. Then the equations for interior sites () on MTs with plus end to the right () and left () are
| (1) | |||||
| (2) | |||||
At the boundary sites, we modify these equations to incorporate fluxes into and out of the overlap. The flux into the overlap is , where nonzero results from motors moving into the overlap from the adjacent single-MT region. The flux out of the overlap is , where is derived fromthe rate at which motors at an MT plus end unbind. In principle, each filament could have different boundary conditions. Because we have no physical reason to distinguish the two halves of the overlap, we focus on the symmetric case and . The resulting boundary site equations are
| (3) | |||||
| (4) | |||||
| (5) | |||||
| (6) |
As shown below, these boundary conditions fix the motor densities to be at the minus end and at the plus end of each filament.
At steady state, we can derive a total binding constraint on the equations by summing all of sites on both filaments. The bulk flux terms of the form sum to zero and only the binding and boundary terms remain:
| (7) |
We find a binding constraint on the total motor binding
| (8) |
where we have defined the Langmuir density . Therefore, at steady state an equilibrium involving binding, unbinding, and the filament-end boundary conditions must be reached on average for the entire overlap. This is related to the zero-current condition found in previous work on the antiparallel TASEP without binding kinetics (35, 36). We did not find an analytical solution to the discrete equations. Instead, we performed kinetic Monte Carlo (kMC) simulations of the discrete model (Supporting Material) and compared to solutions in the continuum limit.
Mean-field continuum model
We derive the mean-field continuum model as in previous work (5) by taking the stationary average , applying the random phase approximation . We also assume motor commutation during track switching to give discrete mean-field equations with linear switching terms (Supporting Material). We take the continuum limit and nondimensionalize the parameters and variables by choosing the length of the overlap, , as the unit of length and as the unit of time. Capital letters denote the nondimensionalized parameters ( and so on, Supporting Material). We choose as the center of the overlap, and the boundary conditions become and . The steady-state continuum mean-field equations are
| (9) | |||||
| (10) |
In the continuum mean-field model, the total binding constraint (Eqn. 8) is
| (11) |
Results
| Symbol | Parameter | Reference value | Notes |
|---|---|---|---|
| Motor speed | 0.5 m s-1 | Measured by Bieling et al. (8); varied up to 8 m s-1 to study effect of varying speed on density profiles | |
| Binding rate constant | nM-1 s-1 | Estimated based on motor density profiles and kymographs to give affinity of 6.3 nM, 15x higher than measured for motor on single MT by Bieling et al. (39) | |
| Bulk motor concentration | 1–200 nM | Varied by Bieling et al. (8) | |
| Unbinding rate | 0.169 s-1 | Measured by Bieling et al. (8) | |
| Switching rate | s-1 | Measured by Bieling et al. (8) | |
| Motor flux constant into overlap from MT minus end | 0 | Motors bind primarily inside the overlap; see discussion in the Results. We varied between 0 and 1 to determine the model phase diagram | |
| Motor flux constant out of overlap from MT plus end | 0 | An upper bound on the end motor unbinding rate is ; see discussion in the Results. We varied between 0 and 1 to determine the model phase diagram | |
| Number of sites | 120–2500 | Varied to study overlaps of length 1–20 m | |
| Length of a single site | 8 nm | Length of an - tubulin dimer, see Bray (1) |
Motor density and trajectories in overlap
To study whether our model can qualitatively describe the motor density in antiparallel MT overlaps observed experimentally, we determined a reference parameter set corresponding to the BTS experiments (table 1). Most parameters were directly measured by BTS. We estimated the motor on rate constant by comparison to the single-molecule imaging of low-density Xklp1 in an overlap (8). To estimate the minus-end boundary condition , note that BTS found that Xklp1 binding was greatly increased on overlaps due to recruitment by PRC1. In the BTS experiments, low ionic strength (which favors motor-MT binding) was needed to observe significant Xklp1 binding to single MTs outside of overlaps. Therefore, we assume that the flux of motors into the overlap from outside is negligible, and set in our reference parameters. The plus-end boundary condition is related to the motor unbinding rate at MT plus ends. While this end off rate was not directly measured by BTS, kinesin motors typically pause at MT plus ends and have an end unbinding rate smaller than the unbinding rate in the bulk. We therefore expect that lies between 0 (no end unbinding) and (the value of corresponding to an unbinding rate equal to , the motor unbinding rate in the bulk). We found that is so small that the motor density profiles were indistinguishable from those with (fig. LABEL:fig:beta). Therefore we used in our reference parameter set.
With these parameters, we studied kMC simulations of our model with varying motor concentration and overlap lengths corresponding to the steady-state values measured by BTS. We made simulated images that represent how our model’s motor distributions would appear in an experiment with fluorescently tagged motors (green) and antiparallel MT overlap region (red) (fig. 1B, Supporting Material). Motors decorating the overlap, with greater density and end accumulation for higher bulk motor concentration. The simulated images are qualitatively similar to the experimental images (fig. 4 in Bieling et al. (8)). We also made simulated kymographs (fig. 1C, Supporting Material), which show directed motor motion with direction reversal, qualitatively similar to the experimental results (figs. 6 and S5 in Bieling et al. (8)). We note that the experimental kymographs show a larger population of paused/immobile motors than occurs in our model.
Analytic solution of the steady-state continuum equations
To further study the behavior of our model, we determined analytic steady-state solutions of the continuum mean-field equations. One solution to Eqn. 9, 10 is the constant Langmuir density set by binding/unbinding equilibrium, . To find spatially varying solutions, we first define , the difference of the motor occupancies from . The rate combinations are and . Then the equations become
| (12) | |||||
| (13) |
Eqns 12 and 13 are well defined for . This allows solution of the differential equation relating and with one integration constant (Supporting Material). Our kMC simulation results for motor density in the overlap differ substantially from this analytic solution (fig. LABEL:fig:phase), because the analytic solution (Eqn. LABEL:exact) does not satisfy the total binding constraint (Eqn. 11). Therefore, the full density profiles must be determined by matching continuum solutions corresponding to different integration constants. This mathematical result implies several remarkable properties of the density profiles, as discussed below.
Phase diagram
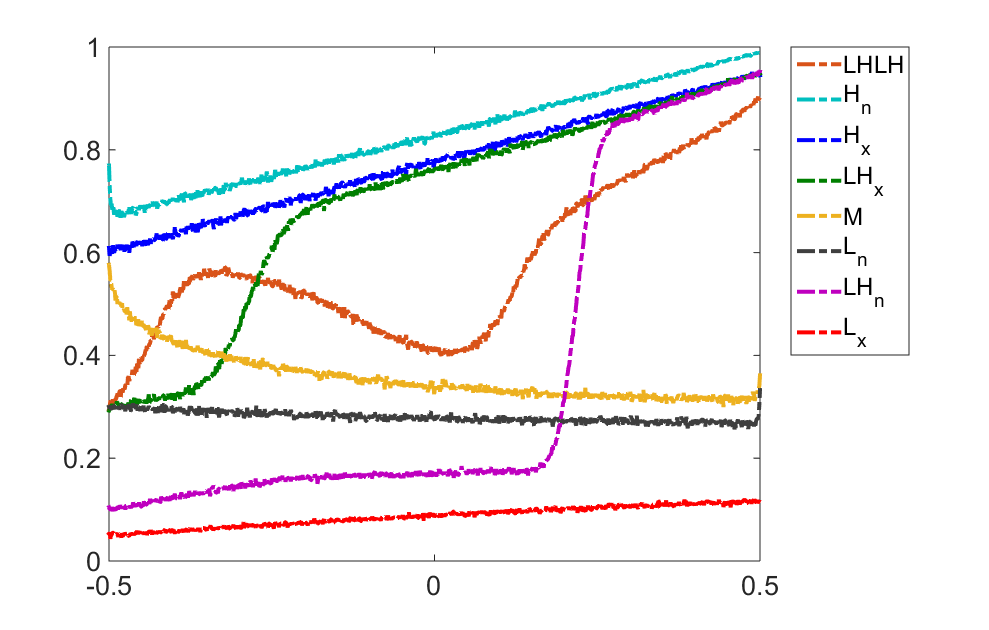
We determined the phase diagram of the model as a function of the boundary condition parameters and , as well as how the phase diagram changes with the other model parameters. We find four phases previously observed for the single-filament case (5), the low density (L), high density (H), low density-high density (LH), and Meissner (M) phases (figs. 2, LABEL:nonlinear_flow_phases). We distinguish two different classes of L, H, and LH phase on overlaps: the center-accumulating case (abbreviated c) has a higher total motor concentration profile near the center of the filament and motor accumulation at the overlap center, while the end-accumulating case (e) has a lower total motor concentration profile near the filament center and motor accumulation at the overlap ends. In addition, for high switching rate we observe a new low density-high density-low density-high density (LHLH) phase (fig. 2).
We studied flows in the phase plane to determine the motor concentration profiles (fig. LABEL:nonlinear_phase_space_flow) and therefore the phase diagram, as discussed in the Supporting Material. Representative phase diagrams for small and large switching rate are shown in fig. 3. We note that the new LHLH phase occurs when and the switching frequency is sufficiently high, conditions which apply to the BTS experiments. This phase can appear for high switching rate when two analytic solutions to the steady-state continuum equations intersect, causing transition points in the phase plane where the density is ill defined (fig. LABEL:nonlinear_phase_space_flow–LABEL:exact_solution_beyond_and_above_transition_lin). Our LHLH phase is reminiscent of multi-phase coexistence found by Pierobon (40). However, in this previous work the multi-phase co-existence occurs due to a point defect in the lane, while here it occurs for spatially uniform dynamics.
The phase boundaries change with parameters of the model. Increases (decreases) to the Langmuir density (through changes in bulk motor concentration or binding/unbinding rate constants) shift the lower boundary of the LH phase closer to (farther from) the line where when and closer to (farther from) the line when . Similar shifts occur for the upper boundary of the LH phase. The motor speed affects the width and the shape of the LH phase: for higher motor speed, the LH phase region becomes narrower in width and the LH boundaries become more flat.
Density profiles for reference parameters
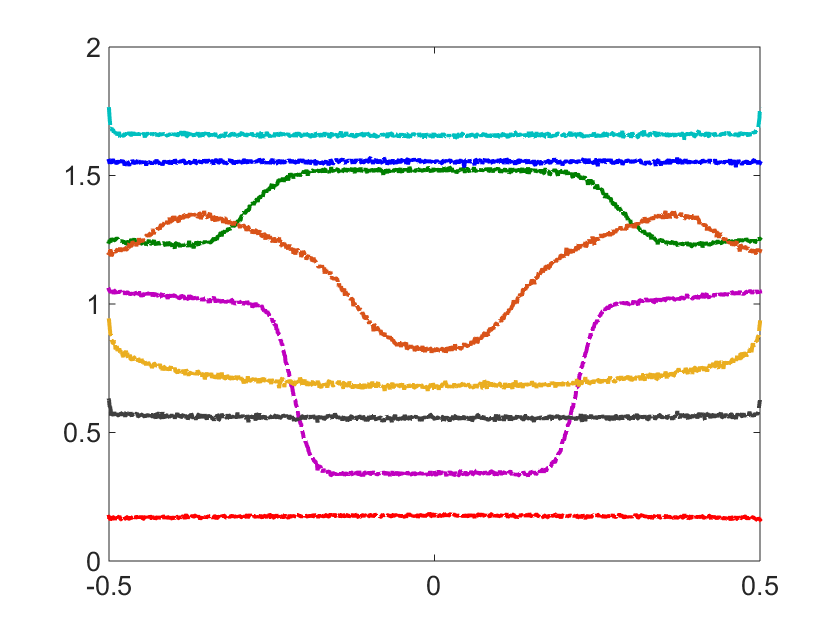
The motor density profiles that we determine by kMC simulation are qualitatively consistent with those observed experimentally (figs. 1, 4). Here we illustrate our results for the reference parameter set (table 1); in the Supporting Material we also discuss a large- parameter set chosen to approximate the limit of large switching rate (table LABEL:tab:units_extended, fig. LABEL:fig:density_x_larges)). This parameter regime typically shows the LH phase, where the density profiles have three regions separated by domain walls. For motors moving to the right, there is a boundary layer on the left with the motor density increasing from zero, then a region of approximately linearly varying density, then a sharp transition to another boundary layer of linearly increasing density that approaches 1 on the right boundary (fig. 4). If we fix all other parameters, the boundary layer regions increase in size as the bulk motor concentration increases. The total motor density in the overlap is the sum of the motor densities on the two filaments, which have the symmetry . The linear density variation near the overlap ends can be seen in the continuum mean-field equations (Supporting Material): the slope is at the minus end and at the plus end. This approximation agrees well with simulation results near the overlap ends (fig. LABEL:fig:phase, LABEL:linsoln).
Control of center density by the total binding constraint
Motor density profiles must satisfy the total binding constraint of Eqn. 11, which requires that when , the integral of the density on a single MT must equal , the Langmuir density determined by binding/unbinding equilibrium. We verified that the total binding constraint is satisfied in our simulations by determining the integrated motor density and comparing it to (fig. LABEL:overall_conc). However, as noted above, the analytic solutions we found for the steady-state motor density (Eqns. LABEL:exact, LABEL:nearend1, LABEL:nearend2) do not in general satisfy the total binding constraint. As a result, the motor concentration in the center of the filaments does not necessarily approach the Langmuir density (fig. 4). This is a significant difference between the model of microtubule overlaps we study and the single-filament model (5).
The total binding constraint also controls the length of the boundary layer regions near the overlap ends. To derive an analytic approximation expression for this length, we approximate the motor densities as piecewise linear, and assume the domain walls are infinitely thin so that we can neglect them in integrating the concentration (fig. LABEL:density_regions). A filament is divided into three regions: boundary layers near the plus and minus ends, and the central region. We can then determine the motor density profile (Eqn. LABEL:eq:rho_lin2), the boundary layer ends, (Eqn. LABEL:eq:xbl), and the motor density in the center of the overlap, (Eqn. LABEL:eq:center_dens).
The motor density at the center of the overlap , even when the overlap is long. Instead the center density depends on the motor speed and filament switching rate in addition to binding parameters (fig. 4) In fig. 5, we compare simulation results and the prediction of Eqn. LABEL:eq:center_dens, showing that our approximation is in good agreement with simulations. (Note that our approximation of the density as linearly varying becomes less exact for slow motor speeds, leading to a discrepancy between simulation results and our analytic approximation.) For comparison, we show the Langmuir density for the same parameter. Varying motor speed has no effect on (right panel), but a significant effect on . To further illustrate the dependence of the center density on motor kinetic parameters, we show in fig. 6 examples of motor density profiles from kMC simulations with varying motor speed. Changing motor kinetic parameters can have a large effect on the center density in the overlap, even for systems with identical binding kinetic parameters and .
Control of end accumulation by the total binding constraint
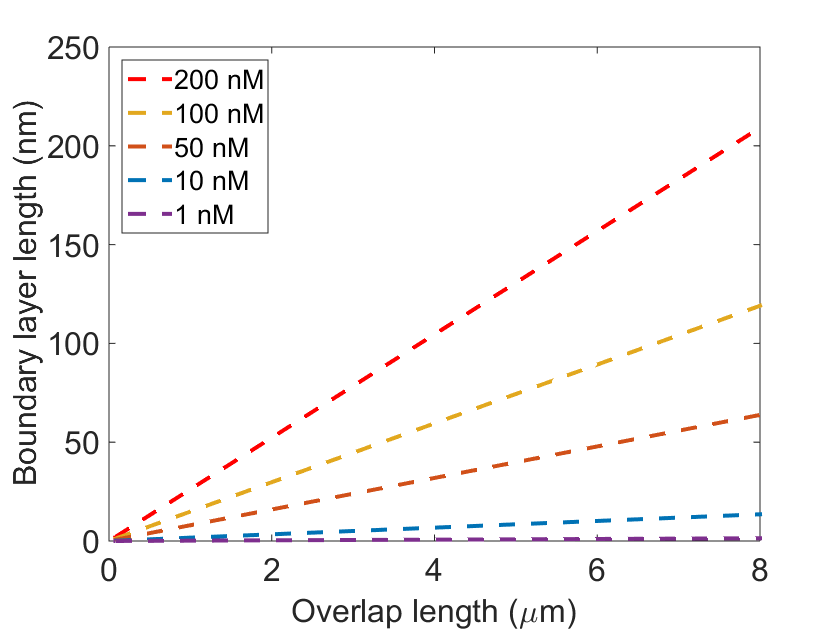
The length of the boundary layer at the overlap ends depends on motor binding and kinetic parameters as well as the overlap length (Eqn. LABEL:eq:xbl). We compared the analytic approximation to simulation results and found good agreement (fig. LABEL:bl_length), allowing us to predict how varying experimental control parameters will alter the degree of motor accumulation near the overlap ends (fig. 7). We note that although the boundary layer lengths predicted for typical experimental parameters are below the optical resolution limit of nm, they could be distinguished by fits of fluorescent motor intensity profiles to model predictions (c.f. figs. 1, 4, 6), similar to how fits to a Gaussian fluorescence intensity profile allow sub-resolution localization of single molecules (41).
The total binding constraint means the the boundary layer length is determined as fraction of the overlap length. In the single-filament model, the motor density profile in the MT minus-end boundary layer is independent of MT length (17, 24), with important consequences: MT length regulation by the kinesin-8 motor Kip3 (16, 7) depends on a motor density profile that maintains the same functional form near the minus end as MT length changes. By contrast, on antiparallel MT overlaps the density profile, boundary-layer length, and extent of motor accumulation at the overlap ends change with overlap length (fig. 7). This means that a length regulation mechanism identical to that of Kip3 cannot occur on antiparallel MT overlaps.
Conclusion
We studied a model of motor motion on antiparallel MT overlaps that incorporates motor binding and unbinding, plus-end directed motor motion, and switching between filaments (fig. 1). Our model is inspired by the experiments of Bieling, Telley, and Surrey on the motion of the kinesin-4 motor Xklp1 on antiparallel MT overlaps (8). Our model is an extension of previous theory that studied motor motion on a single MT with binding kinetics (5, 34), or motor motion on two antiparallel filaments with lane switching, but no binding kinetics (35, 36). To our knowledge, this is the first theoretical study of a two-lane TASEP model with oppositely oriented lanes, switching, and binding/unbinding.
To compare to the BTS experiments, we used measured or estimated parameters (table 1). Because PRC1 recruits motors directly into the overlap and motor binding to single MTs is much weaker, we neglect motor binding to MTs outside of the overlap and set the minus-end flux parameter . Using the bulk motor unbinding rate as an upper bound on the plus-end unbinding rate, we find . This value is sufficiently small that it gives motor density profiles indistinguishable from those with (fig. LABEL:fig:beta). Therefore no-flux boundary conditions with are used to model the experiments. Simulated images of the motor distribution in an overlap and simulated kymographs of motor trajectories are similar to those found experimentally (fig. 1).
We derived analytical and approximate solutions of the continuum steady-state equations and compared them to kMC simulation results (fig. LABEL:fig:phase). Focusing on the symmetric case where the boundary conditions and are the same for both filaments in the overlap, we used both kMC simulations and phase plane flows (fig. LABEL:nonlinear_flow_phases – LABEL:exact_solution_beyond_and_above_transition_lin) to determine the nonequilibrium phases possible in our model (fig. 2). For low rate of motor switching between filaments in the overlap, we find the low density, high density, low density-high density, and Meissner phases previously studied for the single-lane case (5). In addition, for high switching rate we find a novel low density-high density-low density-high density phase with three domain walls. We determined representative phase diagrams for small and large switching rate (fig. 3).
We then studied the model in more detail both for the reference parameters and a high-switching-rate parameter set (table LABEL:tab:units_extended). Results of kMC simulations (fig. 4, LABEL:fig:density_x_larges) agree well with exact and approximate solutions of the continuum steady-state equations (fig. LABEL:fig:phase, LABEL:linsoln). In contrast to systems in which motors move on single filaments (19, 7, 17, 18, 20, 21, 24, 22), we find that antiparallel overlaps with no-flux boundary conditions have total zero current. This leads to a total binding constraint that the integral of the total motor density on a single filament must equal , the motor density set by binding/unbinding equilibrium (fig. LABEL:overall_conc).
For the experimentally relevant low density-high density coexistence phase, the density profiles are approximately piecewise linear (fig. LABEL:density_regions). This motivates an analytic approximation to determine the density profiles consistent with the total binding constraint and gives analytic expressions for the overlap center motor density and the length of the boundary layer in which motors accumulate near the overlap ends. We find that as a result of the total binding constraint, the motor density at the center of the overlap is not determined solely by the motor binding equilibrium, but is also controlled by the overlap length, motor speed, and filament switching rate (fig. 5, 6). These same parameters control the length of the boundary layer at the overlap ends where motors accumulate (fig. LABEL:bl_length).
The mitotic spindle contains arrays of overlapping antiparallel MTs to which multiple motors and crosslinkers bind (29). The surprising differences in motor density profiles between single filaments and the antiparallel overlaps we study here are therefore of interest in the study of the spindle midzone. For antiparallel overlaps, both the motor density far from the overlap ends and the number of motors near the overlap ends can be tuned not just by motor binding kinetics but also by motor speed, filament switching rate, and overlap length (fig. 7). The antiparallel filament geometry gives biological systems additional handles to control motor density, its spatial distribution, and therefore motor function. Motor density can affect recruitment of other proteins and MT dynamics. Therefore, this previously undescribed mechanism of regulation of motor density along MTs may offer advantages to the control of motor activity.
For single MTs, length regulation by the kinesin-8 motor Kip3 depends on a functional form of motor density that is independent of MT length (16, 7). The physics we describe here means that the motor density and extent of motor accumulation at the overlap ends depends on overlap length. Therefore, length regulation of antiparallel MT overlaps must occur differently. In future work, it will be of interest to understand how the motor density profiles on fixed-length overlaps can be used to understand the length regulation of dynamic overlaps.
Acknowledgements
We thank Robert Blackwell, Matthew Glaser, and Loren Hough for useful discussions. This work was supported by NSF grant DMR-0847685 and NIH grant GM110486 to MDB, fellowship to H-SK provided by matching funds from the NIH/CU Biophysics Training Program, and facilities of the Soft Materials Research Center under NSF MRSEC Grants DMR-0820579 and DMR-1420736.
References
- Bray (2000) Bray, D., 2000. Cell movements: from molecules to motility. Routledge.
- Kolomeisky (2015) Kolomeisky, A. B., 2015. Motor Proteins and Molecular Motors. CRC Press.
- Chowdhury (2013) Chowdhury, D., 2013. Modeling Stochastic Kinetics of Molecular Machines at Multiple Levels: From Molecules to Modules. Biophysical Journal 104:2331–2341.
- Helbing (2001) Helbing, D., 2001. Traffic and related self-driven many-particle systems. Rev. Mod. Phys. 73:1067–1141.
- Parmeggiani et al. (2004) Parmeggiani, A., T. Franosch, and E. Frey, 2004. Totally asymmetric simple exclusion process with Langmuir kinetics. Phys. Rev. E 70:046101.
- Leduc et al. (2012) Leduc, C., K. Padberg-Gehle, V. Varga, D. Helbing, S. Diez, and J. Howard, 2012. Molecular crowding creates traffic jams of kinesin motors on microtubules. PNAS 109:6100–6105.
- Varga et al. (2009) Varga, V., C. Leduc, V. Bormuth, S. Diez, and J. Howard, 2009. Kinesin-8 Motors Act Cooperatively to Mediate Length-Dependent Microtubule Depolymerization. Cell 138:1174–1183.
- Bieling et al. (2010a) Bieling, P., I. A. Telley, and T. Surrey, 2010. A Minimal Midzone Protein Module Controls Formation and Length of Antiparallel Microtubule Overlaps. Cell 142:420–432.
- Goshima et al. (2005) Goshima, G., R. Wollman, N. Stuurman, J. M. Scholey, and R. D. Vale, 2005. Length control of the metaphase spindle. Curr. Biol. 15:1979–1988.
- Walczak et al. (1996) Walczak, C. E., T. J. Mitchison, and A. Desai, 1996. XKCM1: A Xenopus Kinesin-Related Protein That Regulates Microtubule Dynamics during Mitotic Spindle Assembly. Cell 84:37–47.
- Rivero et al. (1996) Rivero, F., B. Koppel, B. Peracino, S. Bozzaro, F. Siegert, C. J. Weijer, M. Schleicher, R. Albrecht, and A. A. Noegel, 1996. The role of the cortical cytoskeleton: F-actin crosslinking proteins protect against osmotic stress, ensure cell size, cell shape and motility, and contribute to phagocytosis and development. J Cell Sci 109:2679–2691.
- Revenu et al. (2004) Revenu, C., R. Athman, S. Robine, and D. Louvard, 2004. The co-workers of actin filaments: from cell structures to signals. Nat. Rev. Mol. Cell Biol. 5:635–646.
- Dogterom and Leibler (1993) Dogterom, M., and S. Leibler, 1993. Physical aspects of the growth and regulation of microtubule structures. Phys. Rev. Lett. 70:1347–1350.
- Drummond (2011) Drummond, D. R., 2011. Regulation of microtubule dynamics by kinesins. Seminars in Cell & Developmental Biology 22:927–934.
- Gupta et al. (2006) Gupta, M. L., P. Carvalho, D. M. Roof, and D. Pellman, 2006. Plus end-specific depolymerase activity of Kip3, a kinesin-8 protein, explains its role in positioning the yeast mitotic spindle. Nat Cell Biol 8:913–923.
- Varga et al. (2006) Varga, V., J. Helenius, K. Tanaka, A. A. Hyman, T. U. Tanaka, and J. Howard, 2006. Yeast kinesin-8 depolymerizes microtubules in a length-dependent manner. Nat Cell Biol 8:957–962.
- Hough et al. (2009) Hough, L. E., A. Schwabe, M. A. Glaser, J. R. McIntosh, and M. D. Betterton, 2009. Microtubule depolymerization by the kinesin-8 motor Kip3p: a mathematical model. Biophys. J. 96:3050–3064.
- Reese et al. (2011) Reese, L., A. Melbinger, and E. Frey, 2011. Crowding of Molecular Motors Determines Microtubule Depolymerization. Biophys. J. 101:2190–2200.
- Govindan et al. (2008) Govindan, B. S., M. Gopalakrishnan, and D. Chowdhury, 2008. Length control of microtubules by depolymerizing motor proteins. Europhys. Lett. 83:40006.
- Johann et al. (2012) Johann, D., C. Erlenkämper, and K. Kruse, 2012. Length Regulation of Active Biopolymers by Molecular Motors. Phys. Rev. Lett. 108:258103.
- Melbinger et al. (2012) Melbinger, A., L. Reese, and E. Frey, 2012. Microtubule Length Regulation by Molecular Motors. Phys. Rev. Lett. 108:258104.
- Reese et al. (2014) Reese, L., A. Melbinger, and E. Frey, 2014. Molecular mechanisms for microtubule length regulation by kinesin-8 and XMAP215 proteins. Interface Focus 4:20140031.
- Tischer et al. (2010) Tischer, C., P. R. ten Wolde, and M. Dogterom, 2010. Providing Positional Information with Active Transport on Dynamic Microtubules. Biophys. J. 99:726–735.
- Kuan and Betterton (2013) Kuan, H.-S., and M. D. Betterton, 2013. Biophysics of filament length regulation by molecular motors. Phys. Biol. 10:036004.
- Glunčić et al. (2015) Glunčić, M., N. Maghelli, A. Krull, V. Krstić, D. Ramunno-Johnson, N. Pavin, and I. M. Tolić, 2015. Kinesin-8 Motors Improve Nuclear Centering by Promoting Microtubule Catastrophe. Phys. Rev. Lett. 114:078103.
- Kurasawa et al. (2004) Kurasawa, Y., W. C. Earnshaw, Y. Mochizuki, N. Dohmae, and K. Todokoro, 2004. Essential roles of KIF4 and its binding partner PRC1 in organized central spindle midzone formation. EMBO J. 23:3237–3248.
- Zhu and Jiang (2005) Zhu, C., and W. Jiang, 2005. Cell cycle-dependent translocation of PRC1 on the spindle by Kif4 is essential for midzone formation and cytokinesis. PNAS 102:343–348.
- Khmelinskii et al. (2007) Khmelinskii, A., C. Lawrence, J. Roostalu, and E. Schiebel, 2007. Cdc14-regulated midzone assembly controls anaphase B. J Cell Biol 177:981–993.
- Fededa and Gerlich (2012) Fededa, J. P., and D. W. Gerlich, 2012. Molecular control of animal cell cytokinesis. Nat Cell Biol 14:440–447.
- Subramanian et al. (2013) Subramanian, R., S.-C. Ti, L. Tan, S. A. Darst, and T. M. Kapoor, 2013. Marking and Measuring Single Microtubules by PRC1 and Kinesin-4. Cell 154:377–390.
- Subramanian et al. (2010) Subramanian, R., E. M. Wilson-Kubalek, C. P. Arthur, M. J. Bick, E. A. Campbell, S. A. Darst, R. A. Milligan, and T. M. Kapoor, 2010. Insights into Antiparallel Microtubule Crosslinking by PRC1, a Conserved Nonmotor Microtubule Binding Protein. Cell 142:433–443.
- Bringmann et al. (2004) Bringmann, H., G. Skiniotis, A. Spilker, S. Kandels-Lewis, I. Vernos, and T. Surrey, 2004. A Kinesin-like Motor Inhibits Microtubule Dynamic Instability. Science 303:1519–1522.
- Castoldi and Vernos (2006) Castoldi, M., and I. Vernos, 2006. Chromokinesin Xklp1 Contributes to the Regulation of Microtubule Density and Organization during Spindle Assembly. Mol. Biol. Cell 17:1451–1460.
- Parmeggiani et al. (2003) Parmeggiani, A., T. Franosch, and E. Frey, 2003. Phase Coexistence in Driven One-Dimensional Transport. Phys. Rev. Lett. 90:086601.
- Juhász (2007) Juhász, R., 2007. Weakly coupled, antiparallel, totally asymmetric simple exclusion processes. Phys. Rev. E 76:021117.
- Ashwin et al. (2010) Ashwin, P., C. Lin, and G. Steinberg, 2010. Queueing induced by bidirectional motor motion near the end of a microtubule. Phys. Rev. E 82:051907.
- Braun et al. (2011) Braun, M., Z. Lansky, G. Fink, F. Ruhnow, S. Diez, and M. E. Janson, 2011. Adaptive braking by Ase1 prevents overlapping microtubules from sliding completely apart. Nat. Cell Biol. 13:1259–1264.
- Lansky et al. (2015) Lansky, Z., M. Braun, A. Lüdecke, M. Schlierf, P. R. ten Wolde, M. E. Janson, and S. Diez, 2015. Diffusible Crosslinkers Generate Directed Forces in Microtubule Networks. Cell 160:1159–1168.
- Bieling et al. (2010b) Bieling, P., I. Kronja, and T. Surrey, 2010. Microtubule Motility on Reconstituted Meiotic Chromatin. Current Biology 20:763–769.
- Pierobon et al. (2006) Pierobon, P., M. Mobilia, R. Kouyos, and E. Frey, 2006. Bottleneck-induced transitions in a minimal model for intracellular transport. Phys. Rev. E 74:031906.
- Yildiz et al. (2003) Yildiz, A., J. N. Forkey, S. A. McKinney, T. Ha, Y. E. Goldman, and P. R. Selvin, 2003. Myosin V Walks Hand-Over-Hand: Single Fluorophore Imaging with 1.5-nm Localization. Science 300:2061–2065.
Figure Legends
Figure 1.
Model and results overview. (A) Schematic of the model of motor motion on an antiparallel microtubule overlap. Two filaments (green and blue) are modeled as 1D lattices with their plus ends oppositely oriented. The filaments are labled R (L) if the plus end is pointing to the right (left). Motors (red) bind to empty lattice sites with rate and unbind with rate . Bound motors step toward the MT plus end with rate (if the adjacent site toward the MT plus end is empty) or switch to the other MT with rate (if the corresponding site on the adjacent MT is empty). At MT minus ends, motors are inserted at rate . At MT plus ends, motors are removed at rate . (B) Simulated experimental images made from our kMC model. Green, motor density. Red, overlap region. Scale bar, 5 m. Simulations used to generate these images used the reference parameter set (table 1) and the indicated bulk motor concentrations. (C) Simulated kymograph made from our kMC model with motor spatial position on the horizontal axis and time increasing down. Horizontal scale bar, 10 m. Vertical scale bar, 5s. The simulations used to generate the kymograph used the reference parameter set and 0.5 nM bulk motor concentration.
Figure 2.
Nonequilibrium phases. Left: motor density on MT with rightward-moving motors. Right: total motor density on both MTs in the overlap. The parameters used are the reference parameter set of table 1 with a bulk motor concentration of 200 nM, except for the switching rate which is 0.5 s-1 for the LHLH curve and 0.1 s-1 for all other curves and the boundary conditions as noted below. LHLH: low density-high density-low density-high density coexistence (, , orange). He: high-density end-accumulating phase (, , light blue). Hc: high-density center-accumulating phase (, , dark blue). LHc: low density-high density center-accumulating coexistence (, , green). M: Meissner phase , , yellow). Le: low-density end-accumulating phase (, , black). LHe: low density-high density end-accumulating coexistence (, , magenta). Lc: low-density center-accumulating phase (, , red).
Figure 3.
Phase diagrams. Left: low switching rate (0.1 s-1); right: high switching rate (0.5 s-1). Solid lines indicate phase boundaries, and dotted lines boundaries between center-accumulating (v) and end-accumulating (e) overlap motor density profiles. The bulk motor concentration is 200 nM, the motor speed is 5 m s-1, and other parameters are the reference values (table 1).
Figure 4.
Motor density profiles for the reference parameter set. Left: motor density on MT with rightward-moving motors. Right: total motor density on both MTs in the overlap. Parameters are the reference parameter set of table 1 with the bulk motor concentrations indicated in the legend.
Figure 5.
Motor density at the center of the overlap. Left: variation with bulk motor concentration; right: variation with motor speed. Points indicate simulation results and dashed lines theoretical prediction from Eqn. LABEL:eq:center_dens. The red line shows the value of the Langmuir density for the same parameters.
Figure 6.
Dependence of density profiles on motor speed. Left: motor density on MT with rightward-moving motors. Right: total motor density on both MTs in the overlap. Varying motor speed can significantly alter the motor density at the center of the overlap. These simulations use the large- parameter set of table LABEL:tab:units_extended with bulk motor concentration nM and the motor speeds indicated in the legend.
Figure 7.
Control of boundary layer length. Left: boundary layer length as a fraction of total overlap length, shown as a function of bulk motor concentration and motor speed. Right: boundary layer length as a function of overlap length for the reference parameter set and varying bulk motor concentration. The boundary layer length is the distance at each end of the overlap where significant motor accumulation occurs and is determined by Eqn. LABEL:eq:xbl.