Terrestrial-type planet formation:
Abstract
Context. In order to study the terrestrial-type planet formation during the post oligarchic growth, the initial distributions of planetary embryos and planetesimals used in N-body simulations play an important role. In general, most of these studies typically use ad hoc initial distributions based primarily on theoretical and numerical studies.
Aims. We analyze the formation of planetary systems without gas giants around solar-type stars focusing on the sensitivity of the results to the particular initial distributions used for planetesimals and planetary embryos at the end of the gas phase of the protoplanetary disk. The formation process of terrestrial planets in the habitable zone (HZ) and the study of their final water contents are also topics of special interest in this work.
Methods. We developed two different sets of N-body simulations starting with the same protoplanetary disk. The first set assumes typical ad hoc initial distributions for embryos and planetesimals and the second set obtains these initial distributions from the results of a semi-analytical model which simulates the evolution of the protoplanetary disk during the gaseous phase.
Results. Both sets of simulations form planets within the HZ. Using ad hoc initial conditions the masses of the planets that remain in the HZ range from to . Using more realistic initial conditions obtained from a semi-analytical model, we found that the masses of the planets range from to . Both sets of simulations form planets in the HZ with water contents ranging between 4.5% and 39.48% by mass. Those planets that have the highest water contents with respect to those with the lowest water contents, present differences regarding the sources of water supply.
Conclusions. Comparing both sets of simulations we suggest that the number of planets that remain in the HZ is not sensitive to the particular initial distribution of embryos and planetesimals and thus, the results are globally similar between them. However, the main differences observed between both sets are associated to the accretion history of the planets in the HZ. These discrepancies have a direct impact in the accretion of water-rich material and in the physical characteristics of the resulting planets.
Key Words.:
Astrobiology - Methods: numerical - Protoplanetary disks1 Introduction
The formation process of terrestrial-type planets goes through different stages. In the classical core accretion model (Lissauer & Stevenson 2007), the first step in the planet formation process is the sedimentation to the mid-plane of the dust of the disk and the formation of planetesimals. The mechanisms which lead to the formation of planetesimals are still under debate. However, in the last few years, three main scenarios for the formation of planetesimals have emerged: formation via coagulation-fragmentation cycles and mass transfer from small to large aggregates, growth of fluffy particles and subsequent compaction by self-gravity, and concentration of small particles (often called pebbles) in the turbulent gas, and gravitational fragmentation of over dense filaments (see Johansen et al. 2014 for a detailed discussion and references therein). After the formation of the first population of planetesimals, these bodies grow quickly by mutual accretion until some of them (often called embryos) start to separate from the population of planetesimals. This process is known as planetesimal runaway growth. When embryos begin to gravitationally dominate the dynamic of the population of planetesimals, the runaway growth regime switches to the oligarchic growth regime. In this regime, the gravitational excitation of the embryos over the planetesimals limits their growth, and embryos are the only population that continue growing by accretion of planetesimals (Kokubo & Ida 1998).
The interaction of the embryos with the gaseous disk could lead to the migration of these bodies along the disk, a phenomenon known as type I migration. In idealized isothermal disks type I migration is always inward and at high migration rates (Tanaka et al. 2002). However, if more realistic disks are considered (Paardekooper et al. 2010, 2011) type I migration could be outward. This outward migration can also occur when the planet achieves a significant mass () and corrotation torques become not negligible (Masset et al. 2006). But even in isothermal disks, type I migration could be outward if full magnetohydrodynamic disk (MHD) turbulence is considered (Guilet et al. 2013). More recently, Benítez-Llambay et al. (2015) found that if the released energy by the planet due to accretion of solid material is taken into account this phenomena generates a heating torque which could significantly slow down, cancel, or even reverse, inward type I migration for planets with masses . Embryos continue growing by accretion of planetesimals and other embryos when the distance between them becomes less than 3-4 mutual Hill radii (Agnor & Asphaug 2004) due to the fact that the damping generated by the gas remains the embryos in nearly circular and coplanar orbits.
It is worth mentioning that in the last years a new alternative model was proposed for the formation of giant planet cores and terrestrial planets. This model proposes that the core of giant planets and terrestrial planets could be formed as seeds that accrete small particles, often called pebbles. Ormel & Klahr (2010), Lambrechts & Johansen (2012), and Guillot et al. (2014) showed that pebbles, which are strong coupled to the gas, could be accreted very efficiently to form planetary bodies.
More recently, Johansen et al. (2015) showed that other structures of our Solar System, like the asteroid belt and the transneptunian belt, could also be explained by the pebble accretion mechanism.
Once the gas has dissipated from the system, and maybe some giant planet have formed, the terrestrial planet region contains a great number of planetary embryos which still evolve embedded in a remnant swarm of planetesimals. Embryos continue growing by accreting planetesimals and by stochastic collisions with other embryos in a regime known as pos-oligarchic growth. Finally, the terrestrial-type planets form and settle onto stable orbits on time scales of the order of 108 years.
In general terms, the numerical simulations that analyze the late stage planetary accretion after the gas disk dissipation require physical and orbital initial conditions for planetesimals and planetary embryos, as well as for the gas giants of the system. These initial conditions are tipically selected ad hoc by many works that investigate the process of planetary formation (O’Brien et al. 2006; Raymond et al. 2009; Morishima et al. 2010; Walsh et al. 2011).
The study of planetary systems without gas giants results to be very interesting. In fact, several observational studies (Cumming et al. 2008; Mayor et al. 2011) and theoretical works (Mordasini et al. 2009; Miguel et al. 2011) have suggested that the planetary systems consisting only of rocky planets would seem to be the most common in the Universe. Recently, Ronco & de Elía (2014) have analyzed the terrestrial-type planet formation and water delivery in systems without gas giants around Sun-like stars. In particular, the authors focused on low-mass protoplanetary disks for a wide range of surface density profiles. In that work, Ronco & de Elía (2014) assumed ad hoc initial conditions for the distributions of planetesimals and planetary embryos after the gas dissipation.
Here, we present results of N-body simulations aimed at analyzing the process of planetary formation around Sun-like stars in absence of gas giants. In particular, the present study focuses on the sensitivity of the results to the particular initial distribution adopted for planetesimals and planetary embryos after the gas dissipation. To do this, we decided to carry out two different sets of numerical simulations starting with the same initial protoplanetary disk and modifying the particular initial distribution for planetesimals and planetary embryos. The first set of numerical simulations assumes ad hoc initial conditions for planetesimals and embryos like in Ronco & de Elía (2014) while the second set of numerical simulations obtains initial conditions from a semi-analytical model, which is able to analyze the evolution of a system of planetesimals and embryos during the gaseous phase. A comparative analysis between these two sets of numerical simulations will allow us to enrich our knowledge concerning the process of planetary formation. Moreover, we consider that the present work will allow us to clarify our understanding about a correct selection of initial conditions for numerical simulations of formation and evolution of planetary systems.
This paper is therefore structured as follows. In Sect. 2, we present the main properties of the protoplanetary disk used in our simulations. Then, we outline our choice of initial conditions in Sect. 3 and discuss the main characteristics of the N-body code in Sect. 4. In Sect. 5, we present the results of all our simulations. We discuss such results within the framework of current knowledge of planetary systems in Sect. 6 and present our conclusions in Sect. 7.
2 Protoplanetary Disk: Properties
The properties of the protoplanetary disk considered in this work are the same presented in Ronco & de Elía (2014). The gas surface density profile that represents the structure of the protoplanetary disk is given by
| (1) |
where is a normalization constant, a characteristic radius and the exponent that represents the surface density gradient. can be found by integrating Eq. 1 over the total area of the disk and is a function of , and the mass of the disk .
Analogously, the solid surface density profile is represented by
| (2) |
where represents an increase of a factor of 4 in the amount of solid material due to the condensation of water beyond the snow line, which is located at 2.7 au (Hayashi 1981). Although other authors found a much lower value for this increase of solids (Lodders 2003) we used the same factor as Ronco & de Elía (2014) in order to be consistent with the comparisons.
The relation between both profiles is given by
| (3) |
where is the primordial abundance of heavy elements in the Sun and the metallicity.
The central star is assumed to have the same mass as our Sun and is a solar metallicity star, so that . Then, where (Lodders 2003). We consider a low-mass disk with in order to guarantee that the formation of giant planets is not performed (Miguel et al. 2011). For the characteristic radius we adopt a value of 50 au which is in agreement with the different disk’s observations studied by Andrews et al. (2010), and for the exponent we adopt a value of 1.5 according to other planetary formation works (Raymond et al. 2005; Miguel et al. 2011). The gas surface density profile of this disk is a factor of higher than that proposed by the Minimun Mass Solar Nebula (MMSN) between 0 and 15 au. It is worth noting that the simulations developed by Ronco & de Elía (2014) using density profiles with show distinctive results since true water worlds are formed in the habitable zone111 The definition of the habitable zone is postponed to Sec. 5 but we anticipate that we consider a conservative and an optimistic habitable zone as in Kopparapu et al. (2013a, b). (HZ) of the system .
Finally, we assumed that the protoplanetary disk presents a radial compositional gradient. Thus, the water content by mass assumed as a function of the radial distance is described as: embryos and planetesimals contain water inside 2 au, contain water between 2 au and 2.5 au, contain water between 2.5 au and 2.7 au, and water past 2.7 au. This water distribution is the same used by Ronco & de Elía (2014) and is based on that proposed by Raymond et al. (2004). Such a distribution is assigned to each body in the N-body simulations, based on its starting location. Our model does not consider water loss during impacts, thus, the final water contents of the resulting planets will represent upper limits.
3 Initial conditions
As mentioned in Sec. 1, many works that investigate the process of planetary formation consider ad hoc initial conditions, particularly dividing the solid mass of the disk equally between the planetesimal and embryo components. Moreover, some works (Chambers 2001; O’Brien et al. 2006) assume that the individual mass of the planetary embryos has a constant value throughout the portion of the disk under consideration. However, it is worth emphasizing that these conditions represent a particular state of the disk. To consider that the solid mass in the inner region of the disk is equally distributed between embryos and planetesimals could be a reasonable assumption because in fact, this depends on the evolution of the system. However, considering that the population of planetesimals is homogeneously distributed throughout the inner region of the disk could not be. Planetesimal accretion rates are proportional to the surface density of solids and to the keplerian frequency. These two quantities increase closer to the star. Thus, it is expected that inner embryos grow quickly accreting all the available planetesimals. Due to the fact that embryos can only accrete planetesimals from their feeding zones, which are very narrow as we get closer to the central star, we expected a considerable number of small embryos, and practically no planetesimals in the inner region at the moment of the dissipation of the disk.
Another consideration that could be not realistic is that all the embryos have the same mass in the inner region of the disk. Basically, the final mass of an embryo (during the gaseous phase) is a function of the distance to the star and of the time-scale dissipation of the disk. Brunini & Benvenuto (2008) showed that this functional dependence is maximized near the snow line. Thus, it is expected that the most massive embryos of the distribution are located near the snow line.
In order to test the sensitivity of the results to the initial distributions of planetary embryos and planetesimals, we construct two different sets of simulations from the same protoplanetary disk. The first one uses ad hoc initial conditions for planetesimals and embryos like in Ronco & de Elía (2014) while the second set assumes initial conditions derived from a semi-analytical model, which analyzes in detail the evolution of embryos and planetesimals during the gaseous phase.
Since our main goal is to analyze the formation process of terrestrial planets and to focus in those of the HZ, our region of study extends between 0.5 au and 5 au. Our model assumes an inner zone in the disk between 0.5 au and the snow line, and an outer zone, which extends between the snow line and 5 au.
In the following, we describe the generation of initial conditions for both sets of numerical simulations.
3.1 First set: ad hoc initial conditions
In this first set of simulations, we assumed the ad hoc initial conditions used in the work developed by Ronco & de Elía (2014). Considering a protoplanetary disk of 0.03 and an exponent = 1.5 associated with the surface density profile, the total mass of solids in the region of study is 13.66 . In agreement with various planetary accretion studies such as Kokubo & Ida (1998), this mass of solids is divided equally between the planetesimal and embryo components. On the one hand, 45 planetary embryos are distributed in the study region, 35 of which are in the inner zone with masses of 0.06 , and 10 in the outer zone with masses of 0.47 . On the other hand, 1000 planetesimals are distributed in the disk with masses of 2.68 10-3 and 0.021 in the inner and outer zone, respectively.
3.2 Second set: initial conditions from a semi-analytical model
In this second set of simulations, we generate initial conditions for embryos and planetesimals using a semi-analytical model based on the works of Brunini & Benvenuto (2008) and Guilera et al. (2010) with the inclusion of some minor improvements. This model analyze the evolution of a protoplanetary disk during the gaseous phase and thus, it is possible to obtain more realistic initial conditions to be used in a N-body code. A detailed description of this model can be found in de Elía et al. (2013) Sec.3.
In this semi-analytical model, the embryos are separated by 10 mutual Hill radii and the mass of each embryo corresponds to the transition mass between runaway and oligarchic growth (Ida & Makino 1993). At the beginning there are 223 embryos in the study region, between 0.5 au and 5 au, which present a density of 3 gr cm-3 and the planetesimals present a density of 1.5 gr cm-3 and have radii of 10 km. The population of planetesimals is represented by the density profile of planetesimals. In this model, the initial planetesimal size distribution evolves in time through planetesimal migration and accretion by embryos. Embryos then grow by accretion of planetesimals and also by collisions between them. We do not include type I migration in our model and the main reason for neglecting this effect is that many quantitative aspects of the type I migration are still uncertain as we have already mentioned in Sec. 1. Besides, although planetesimals are affected by the gas drag, as they are so big (10 km), this migration is not important to produce significant changes in the final amounts of water on embryos and in the distribution of water along the planetesimal population. We consider that when the distance between two embryos becomes smaller than 3.5 mutual Hill radii, they merge into one object. We assume perfect inelastic collisions. For mergers between embryos, we neglected the presence of embryo gaseous envelopes because the masses of the embryos are small enough not to produce major differences.
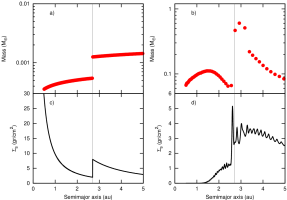
The final configuration obtained after the gas is completely dissipated in 3 Myr is also in agreement with that used ad hoc in several works as mentioned in Sec. 3.1: we found the same proportion for both populations, half the mass in embryos and half the mass in planetesimals. Figure 1 shows the results of our semi-analytical model for the distribution of embryos and planetesimals for a disk of at the end of the gas phase. In particular, the top left panel represent the mass distribution of planetary embryos as a function of the distance from the central star used to initiate the evolution of the gas phase with the semi-analytical model, while the left bottom panel shows the surface density profile of planetesimals used to do the same. The top right panel represents the final distribution of embryos obtained with the semi-analytical model after 3 Myr of evolution until the gas is already gone and the bottom right panel represents the final surface density profile of planetesimals. These (right panels) final distributions of embryos and planetesimals represent the initial conditions to be used in our N-body simulations. In this case, 57 planetary embryos are distributed between 0.5 au and 5 au and 1000 planetesimals with individual masses of are generated using the distribution shown in Fig. 1d).
4 N-body simulations: characteristics
Our N-body simulations begin when the gas of the disk has already dissipated. The numerical code used in our N-body simulations is the MERCURY code developed by Chambers (1999). We particularly adopted the hybrid integrator, which uses a second-order mixed variable simplectic algorithm to treat the interaction between objects with separations greater than 3 Hill radii, and a Burlisch-Stoer method for resolving closer encounters.
In both sets of simulations, all collisions were treated as inelastic mergers that conserve mass and water content. Given that the N-body simulations are very costly numerically, we decided to reduce the CPU time considering only gravitational interactions between embryos and planetesimals (Raymond et al. 2006). Thus, planetesimals do not gravitationally interact and neither collide with each other. These N-body high-resolution simulations allowed us to describe in detail the dynamical processes involved during the formation and post evolution stages.
Since terrestrial planets in our Solar System might have formed in 100 Myr - 200 Myr (Touboul et al. 2007; Dauphas & Pourmand 2011), we integrated each simulation for 200 Myr. To compute the inner orbit with enough precision we used a 6 day time step. Moreover, the Sun’s radius was artificially increased to 0.1 au in order to avoid numerical error for small-perihelion orbits.
The orbital parameters, such as initial eccentricities and inclinations, were taken randomly considering values lower than and , respectively, both for embryos and planetesimals. In the same way, we adopted random values for the argument of pericenter , longitude of ascending node and the mean anomaly between and .
Due to the stochastic nature of the accretion process, we performed three simulations S1, S2 and S3 with different random number seeds for every set of initial conditions. It is worth mentioning that each simulation conserved energy to at least one part in .
5 Results
5.1 General comparative analysis
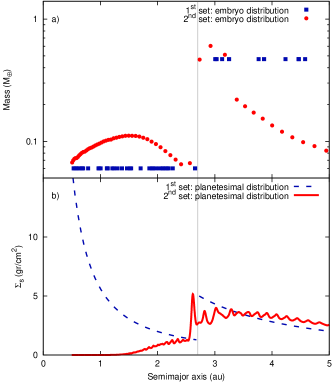
The initial distributions associated to planetary embryos and planetesimals for both sets of simulations used as initial conditions for the N-body simulations are shown in Figure 2. The blue distributions correspond to the simulations performed by Ronco & de Elía (2014) and the red ones correspond to the new set of simulations performed from a semi-analytical model. Panel a) presents the initial distributions of embryos corresponding to the end of the gas phase and panel b) presents the surface density profiles used to distribute 1000 planetesimals in the study region, also when the gas is already dissipated.
As we can see, the embryos inside the snow line of the second set of simulations present masses that range from 1 to 2 times the masses of the embryos inside the snow line of the first set. Something similar happens with the embryos beyond the snow line. In fact, the masses of the outermost embryos of the first set of simulations are at most 5 times greater than those of the second set. Another difference evidenced in panel b) is that the surface density of planetesimals of both sets are quite different in the region inside the snow line since the surface density profile of planetesimals for the second set of simulations is almost zero between 0.5 au and 2.7 au. This is because the planetesimals in this region were accreted by the embryos during the gaseous phase. Could these differences lead to significant changes in the final results of our simulations or not? A discussion on this issue will be addressed in Section 6.
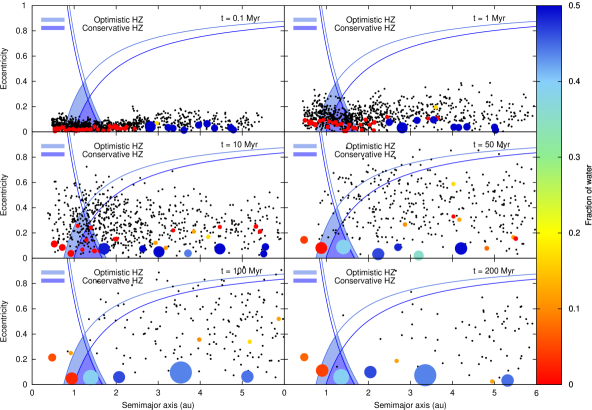
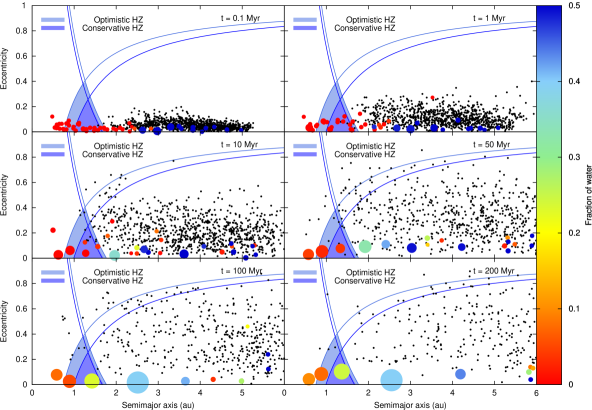
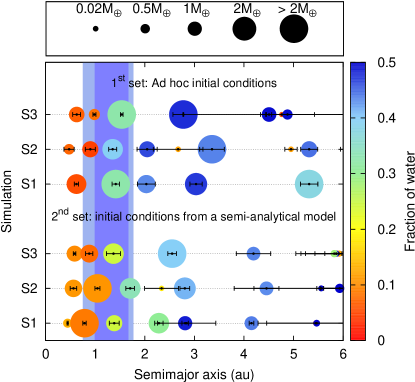
Figures 3 and 4 show six snapshots in time on the semimajor axis eccentricity plane of the evolution of the S2 and S3 simulations of the first and the second set, respectively. In general terms, the overall progression of both sets of simulations can be described as follows. From the beginning, the planetary embryos are quickly excited by their own mutual gravitational perturbations. At the same time, the planetesimals, which are not self-interacting bodies, significantly increase their eccentricities due to perturbations from embryos. In time, the eccentricities of embryos and planetesimals increase until their orbits cross and accretion collisions occur. Then, planetary embryos grow by accretion of other embryos and planetesimals and the total number of bodies decreases. Finally, at the end of the simulations, the entire study region from 0.5 au and 5 au contains between four and seven planets with separations ranging from 18 to 53 mutual hill radii and a total mass that represents between and of the initial mass of solids in the disk which is .
Between the resulting planets of each simulation, it is possible to distinguish three classes of special interest: 1) the innermost planet of the system; 2) the planet (or planets) in the HZ; and 3) the most massive planet of the system. Tables 1 and 2 show the general characteristics of these three distinctive planets resulting from S1, S2, and S3 simulations for the first and the second set of initial conditions, respectively, and Fig. 5 shows the final configuration of all the simulations performed. The main similarities and differences obtained in these simulations for the resulting planets as well as the remaining planetesimal population are discussed throughout the following subsections.
| Simulation | Planet | (au) | (au) | () | () | (Myr) | ||
|---|---|---|---|---|---|---|---|---|
| S1 | Innermost | 0.68 | 0.62 | 0.07 | 1.57 | 5.47 | 56.1 | |
| Planet a in HZ | 4.52 | 1.41 | 0.06 | 2.21 | 32.55 | 35 | ||
| Most massive | 4.52 | 1.41 | 0.06 | 2.21 | 32.55 | 35 | ||
| S2 | Innermost | 0.78 | 0.47 | 0.14 | 0.6 | 7.12 | 5.55 | |
| Planet b in HZ | 1.30 | 0.90 | 0.08 | 1.19 | 4.51 | 35 | ||
| Planet c in HZ | 3.13 | 1.35 | 0.06 | 1.65 | 39.48 | 22 | ||
| Most massive | 3.25 | 3.35 | 0.05 | 2.15 | 43.66 | 96.8 | ||
| S3 | Innermost | 0.50 | 0.63 | 0.08 | 1.13 | 6.66 | 11.45 | |
| Planet d in HZ | 0.64 | 0.98 | 0.07 | 0.66 | 8.10 | 6.00 | ||
| Planet e in HZ | 3.43 | 1.53 | 0.05 | 2.27 | 32.46 | 71.9 | ||
| Most massive | 4.69 | 2.77 | 0.04 | 3.08 | 47.86 | 44.3 |
| Simulation | Planet | (au) | (au) | () | () | (Myr) | ||
|---|---|---|---|---|---|---|---|---|
| S1 | Innermost | 0.54 | 0.44 | 0.12 | 0.45 | 13.03 | 74.24 | |
| Planet a in HZ | 1.05 | 0.78 | 0.05 | 2.21 | 8.75 | 51.6 | ||
| Planet b in HZ | 1.49 | 1.38 | 0.06 | 1.18 | 24.30 | 28.2 | ||
| Most massive | 1.05 | 0.78 | 0.05 | 2.21 | 8.75 | 51.6 | ||
| S2 | Innermost | 0.87 | 0.56 | 0.07 | 1.33 | 10.93 | 198.8 | |
| Planet c in HZ | 0.73 | 1.04 | 0.04 | 2.00 | 10.76 | 20.5 | ||
| Planet d in HZ | 2.73 | 1.70 | 0.05 | 1.67 | 33.63 | 90.5 | ||
| Most massive | 0.73 | 1.04 | 0.04 | 2.00 | 10.76 | 20.5 | ||
| S3 | Innermost | 0.87 | 0.58 | 0.06 | 1.18 | 9.90 | 34.8 | |
| Planet e in HZ | 1.33 | 0.88 | 0.06 | 1.37 | 7.49 | 18.3 | ||
| Planet f in HZ | 1.14 | 1.37 | 0.05 | 1.65 | 24.38 | 59.7 | ||
| Most massive | 2.92 | 2.55 | 0.03 | 2.36 | 39.74 | 62.7 |
5.2 Removal of embryos and planetesimals
It is worth mentioning that while the total mass of the planetesimal population starting the N-body simulations is almost the same for both sets of initial conditions ( and for the first and the second set, respectively), the initial surface density profile of planetesimals is very different in both cases (see Fig. 2b). In fact, for the first set of simulations, 31% of the mass of the planetesimal population is located inside the snow line, while the remaining 69% is distributed beyond 2.7 au. On the other hand, for the second set of initial conditions, only 10% of the mass of the planetesimal population is distributed inside the snow line, while the remaining 90% is located beyond 2.7 au. Thus, some differences should be observed in the evolution of the planetesimal population between both sets of initial conditions.
After 200 Myr of evolution, many embryos and planetesimals were removed from the disks of both sets of simulations. In the S2 simulation of the first set of initial conditions, the mass of planetary embryos and planetesimals that still remain in the study region, between 0.5 au and 5 au, is and 0.43, respectively. We consider that this remaining planetesimal mass, which represents of the initial planetesimal mass, is not significant to produce important changes in the orbital and physical characteristics of the resulting planets. Similar results were found in the other simulations of this set.
In the S3 simulation of the second set of initial conditions, the mass that still survive after 200 Myr is 7.49 in embryos and 1.08 in planetesimals. Thus, the remaining mass of planetary embryos in the study region is comparable in both sets of initial conditions. However, the mass of remaining planetesimals associated to the second set of simulations, which represents of the initial planetesimal mass, is a factor of 2.4 greater than that obtained from the first set of initial conditions. This situation is repeated in the rest of the simulations of this set.
From a quantitative point of view, the populations of embryos at the end of a simulation obtained from both sets of initial conditions result to be comparable, while the remaining populations of planetesimals show the main discrepancies. In order to understand such differences, it is very important to analyze the main mechanisms of removal of planetesimals in our simulations. On the one hand, in the S2 simulation of the first set, in planetesimals, which represents of the initial mass in planetesimals, collide with the central star, remains outside the study region (beyond 5 au) or is ejected from the disk. On the other hand, in the S3 simulation of the second set , which represents of the initial mass in planetesimals, collide with the central star, remains outside the study region or is ejected from the disk. Then, the removed mass in planetesimals is also comparable in both sets of simulations. However, the accreted mass in planetesimals (by embryos) represents of the initial mass in planetesimals for the S2 simulation of the first set and represents of the initial mass in planetesimals for the S3 simulation of the second set. Similar results were found for the rest of the simulations. While the removed mass in planetesimals is comparable in both sets and range between and of the initial planetesimal mass for the second and the first set, the percentage of the accreted mass in planetesimals range between and for the first set and between and for the second set. This difference in the accreted mass in planetesimals between both sets of simulations reveals distinct accretion histories of the final planets. The accretion history of the planets is of great interest because the final characteristics and properties of the planets depend on it. Thus, initial conditions obtained from more realistic models allow us to obtain more reliable physical properties of the resulting planets like, for example, a more reliable final water distribution.
5.3 Dynamical friction
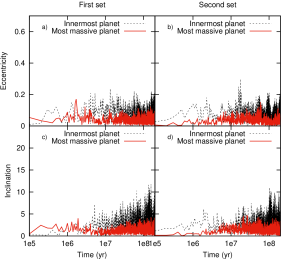
From the beginning, the dynamical friction seems to be a significant phenomenon in both sets of simulations. This dissipative force dampens the eccentricities and inclinations of the large bodies embedded in a swarm of smaller bodies represented by planetesimals. Figure 6 shows the evolution of the eccentricities and inclinations of the innermost planet and the most massive planet in S3 of the first set and in S3 of the second set. The masses of the innermost planets are comparable and the same happens with the most massive planets (see Tables 1 and 2). Thus, we find similar results for both of them.
On the one hand, the innermost planets of and show mean values of the eccentricity of 0.08 and 0.06 for the first and the second set, respectively, while the mean values for the inclinations are and . On the other hand, the most massive planets of and present mean values of the eccentricity of 0.04 and 0.03 for the first and the second set, respectively, while the mean values for the inclinations are and . This means that, for both kinds of simulations, the effects of dynamical friction still prevail over larger bodies. It is worth noting that both planets are initially located in regions embedded in planetesimals, therefore, it is expected to see the same effects in both of them.
Similar results are obtained with the comparison between S2 of the first set and S1 of the second set. In this particular scenario, it is worth noting that the most massive planet in S1 of the second set is not located in a region embedded in planetesimals at the beginning of the integration. However, this planet has of the order of close encounters with planetesimals during its evolution, which allow to keep the low values associated to its eccentricity and inclination. Therefore, the fact that the planet is located at the beginning in a region without planetesimals does not implies that the effect of dynamic friction is absent throughout its evolution.
An interesting scenario to analyze is represented for the S2 simulation of the second set. In this particular case, the innermost and the most massive planets started the simulation in a region of the disk which is not embedded in planetesimals at the beginning of the integration. It is important to note that the final masses of such planets have comparable values. However, the mean values of the eccentricity and inclination of the innermost planet are a factor of 2 greater than those associated to the most massive planet. Such a difference is due to the fact that the most massive planet suffered one order of magnitude more close encounters with planetesimals that the innermost planet throughout the evolution. Thus, the results of our simulations suggest that the dynamical friction is an inefficient mechanism for the innermost planets.
5.4 Planets in the habitable zone
The formation of terrestrial planets in the HZ of the system and the analysis of their water contents are topics of special interest in our work. The HZ is defined as the range of heliocentric distances at which a planet can retain liquid water on its surface (Kasting et al. 1993). For the case of the Solar System, Kopparapu et al. (2013a, b) proposed that an optimistic HZ is between 0.75 au and 1.77 au and a conservative HZ is between 0.99 au and 1.67 au. However, it is worth noting that the fact that a planet is in the HZ does not guarantee that there may be developed life. Planets with very eccentric orbits may pass most of their periods outside the HZ, not allowing long times of permanent liquid water on their surfaces. To avoid this problem, we considered that a planet is in the optimistic HZ if it has a perihelion au and a aphelion au and is in the conservative HZ if it has a perihelion au and a aphelion au. In this work, we considered it is sufficient that a planet is in the optimistic HZ to be potentially habitable. On the other hand, we considered the water contents to be significant when they are similar to that of the Earth. The mass of water on the Earth surface is 2.8 10-4 , which is defined as 1 Earth ocean. Taking into account the water content in the Earth mantle, several studies (Lécuyer & Gillet 1998; Marty 2012) suggested that the present-day water content on Earth should be to by mass, which represents between to Earth oceans. Moreover, some works suggest that the primitive mantle of the Earth could have contained between 10 and 50 Earth oceans (Abe et al. 2000; Righter & Drake 1999), although this is still under debate.
We developed three different N-body simulations for every of the two sets of initial conditions. It is worth noting that all of them form planets within the optimistic HZ. For the first set of initial conditions, our simulations produce a total of five planets in the HZ with masses from 0.66 to 2.27 and final water contents ranging from 4.5% to 39.48% of the total mass, which represents from 192 to 2326 Earth oceans. For the second set, our simulations form a total number of six planets in the HZ with masses ranging from 1.18 to 2.21 and final water contents from 7.5% to 33.63% of the total mass, which represents from 427 to 2006 Earth oceans.
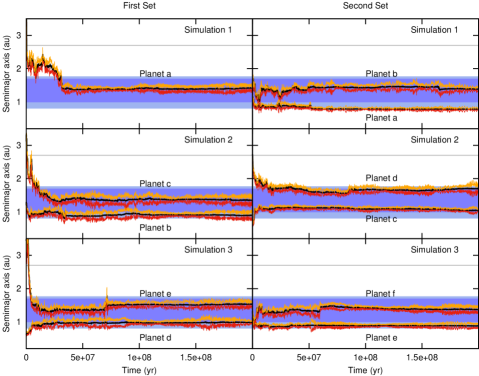
Figure 7 shows the evolution of the semimajor axis, the perihelion and the aphelion of the planets that remain in the HZ at the end of the simulation for both sets of initial conditions. As we can see, most of the planets are kept within the conservative HZ almost throughout the whole integration, and their semimajor axes do not change significantly in the last 100 Myr of evolution. Planet b (S2 simulation) in the first set of initial conditions as well as planets a (S1 simulation) and e (S3 simulation) in the second set remain in the limits of the optimistic HZ, with perihelions entering and leaving it due to oscillations in the eccentricity of their orbits. Since the definition of HZ is not accurate, we will consider that these planets are targets of potential interest. Planet d (S2 simulation) in the second set of initial conditions reaches maximum values of the eccentricity of 0.15. This planet shows changes in its aphelion, which carry it in and out of the HZ at the end of the simulation. The incident stellar flux on such a planet may have considerable variations between perihelion and aphelion. The study developed by Williams & Pollard (2002) shows that, provided that an ocean is present to act as a heat capacitor, it is primarily the time-averaged flux that affects the habitability over an eccentric orbit. Given that planets on eccentric orbits have higher average orbital flux, planet d (S2 simulation) in the second set may maintain habitable conditions.
5.4.1 Highly water-rich planets
As the reader can see in Tables 1 and 2, simulations developed from both sets of initial conditions form planets in the HZ with a wide range of final water contents. In particular, some of them show very high water contents. In fact, planets a, c and e in the first set of simulations show water contents of 32.6%, 39.5% and, 32.5% by mass, respectively, while planets b, d and f in the second set present 24.3%, 33.6%, and 24.4% water by mass, respectively. It is worth noting that the evolution of such water-rich planets has different characteristics for both sets of simulations. Tables 1 and 2, and Figure 7 give us an interesting vision concerning this point. In fact, Table 1 and Figure 7 (left panel) show us that potentially habitable planets a, c and e of the first set of simulations come from beyond the snow line. The migration suffered by these planets is due to the strong gravitational interaction between planetary embryos and planetesimals in the outer disk. Given their initial locations, it is worth noting that an important percentage (31%-36%) of the very high final water contents of such planets results to be primordial. Moreover, our simulations indicate that the remaining water content of those planets is acquired by impacts of planetesimals and planetary embryos in equal parts. Thus, taking into account the primordial and acquired water contents, we infer that the embryos play the most important role to provide the water to the potentially habitable planets a, c and e of the first set of simulations.
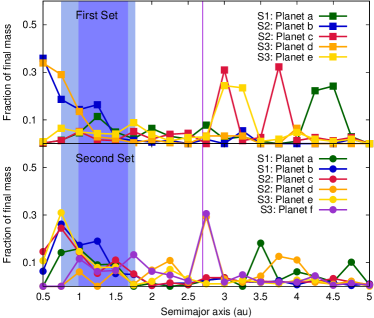
Table 2 and Figure 7 (right panel) show us that potentially habitable planets b, d and f of the second set of simulations present different characteristics. On the one hand, planet d starts the simulation beyond the snow line, like the potentially habitable planets a, c and e of the first set. In the same way, 41.4% of the high final water content of this planet is primordial, being a consequence of its initial location. Moreover, the remaining water content is provided equally by impacts of embryos and planetesimals associated to the outer disk. Thus, taking into account the primordial water content, we find that the embryos are the main responsible to provide the water to planet d of the second set of simulations. On the other hand, planets b and f present a semimajor axis which do not change significantly from the beginning of the integration. This means that such planets grow near their initial positions and do not suffer significant migration. Given their initial locations, the primordial water content of the planets b and f is negligible. In fact, for both planets, the final water content is fully acquired throughout evolution by impacts of planetesimals and planetary embryos associated to the outer disk. This can be seen in the bottom panel of Fig. 8 where the feeding zones of the planets are represented. In particular, planets b and f accreted two and one embryos from beyond the snow line respectively, which significantly increased their final water contents. However, planetesimals provide 53% and 44% of the final water contents of planet b and f. Thus, for these cases, both embryos and planetesimals are equally responsible to provide the final water contents of such planets.
Although these highly water-rich planets remain within the optimistic habitable zone, their potential habitability is still under debate (Abbot et al. 2012; Alibert 2014; Kitzmann et al. 2015) and that analysis is beyond the scope of this work. However we consider water worlds as a particular and very interesting kind of exoplanets.
5.4.2 Earth-like planets
Our simulations also form Earth-like or terrestrial-type planets within the optimistic HZ. We consider the Earth is comparable to these planets not only because they present masses similar to that of the Earth, but rather because of the features that have to do with the dynamics of their formation. These Earth-like planets in our simulations form in situ. There is no significant migration of the accretion seeds that end up forming such planets. Moreover, their feeding zones, unlike what happens with highly water-rich planets, are restricted to the inner region of the disk (see Fig. 8). This kind of exoplanets results to be the most interesting one from an astrobiological point of view since, as they present similarities in terms of the dynamics of the formation of the Earth, they are more likely to develop life. It is worth mentioning that these Earth-like planets formed in our simulations present several times the Earth’s water content. This is directly related to two important facts: on the one hand, as we mentioned before, our model does not consider water loss during impacts, thus, the final water contents represent upper limits. On the other hand, our formation scenario without gas giants is particularly conducive to a more efficient water delivery from external planetesimals. Giant planets could act as a barrier preventing that many of the external planetesimals, which are now accreted by the planets in the HZ, reach the inner zone of the disk (Raymond et al. 2009).
Two of the five planets formed within the optimistic HZ in the first set and three of the six planets that remain in the HZ of the second set are Earth-like planets. The Earth-like planets in the first set (see Table 1: planet b in S2 and planet d in S3) present masses of and and water contents of and by mass, respectively, which represent 192 and 190 Earth oceans. The Earth-like planets in the second set (see Table 2: planet a in S1, planet c in S2 and planet e in S3) present masses of , and , and water contents of , and by mass, respectively, which represent 692, 768 and 366 Earth oceans.
The evolution of these Earth-like planets presents similar characteristics in both sets of simulations unlike what happens with the water worlds already described. Figure 7 shows that planets b and d in the first set, and planets a, c and e in the second set, start their formation in the inner zone of the disk, particularly inside 1.5 au, and they evolve without exceeding this limit. This means that the percentage of water that they have achieved during their evolution is not primordial. In fact, a detailed analysis of their collisional histories reveals that planetesimals are the only population responsible for their final amounts of water. Moreover, none of them accreted embryos from beyond the snowline. However there is a difference regarding what class of planetesimals these planets have accreted. From now on we will call planetesimals class-D to those planetesimals which were originally located inside the snow line and are dry, and we will call planetesimals class-W to those planetesimals which were originally located beyond the snow line and present half of their mass in water. Planets b and d of the first set accreted 185 and 100 planetesimals of the total of planetesimals, of which only 5 were class-W. This represents only and of the total amount of accreted planetesimals. In contrast, planets a, c and e of the second set accreted 65, 69 and 41 planetesimals of the total accreted planetesimals, of which 53, 59 and 28 were class-W planetesimals. This represents , and of the total amount of accreted planetesimals for planets a, c and e, respectively. Thus, the class-W planetesimals accreted for both sets of simulations is quite difference. Nevertheless it is necessary to remember that the masses of the class-W planetesimals are different in both sets of simulations. We can note that the mass of water accreted by the Earth-like planets considering only class-W planetesimals in the second set is between 1.9 and 4 times the mass of water accreted by the planets of the first set.
An important topic to consider is the comparison between the timescale for an Earth-like planet to accrete half of the class-W population of planetesimals (), the timescale to accrete half of the class-D planetesimals () and the timescale for the same planet to achieve at least of its final mass (). Table 3 shows the main characteristics of the Earth-like planets formed within the HZ in both sets of simulations and shows that, for all of them, is greater than , greater than and even more, is greater than . This means that class-W population of planetesimals was accreted significantly later than class-D planetesimals during the formation process and after the planet achieved half of its final mass. Moreover, class-W planetesimals were accreted after the planet achieved of its final mass. This late arrival of the class-W planetesimals during the formation of terrestrial planets may favor water retention on the surface of the planet brought by these planetesimals. O’Brien et al. (2014) studied the water delivery and giant impacts on terrestrial planets in the “Grand Tack” scenario. Particularly, O’Brien et al. (2014) analyzed the water delivery of primitive planetesimals (“C-Type” planetesimals in Walsh et al. 2011) which were initially located between the orbits of Jupiter and Saturn, or beyond. Although the Grand Tack scenario is quite different from the one we proposed since our planetary systems do not include giant planets, we find similar results concerning timescales of primitive planetesimals accretion.
Moreover, we find that the Earth-like planets of the first and the second set are still accreting water due to class-W planetesimals after 90 Myr of evolution. Although planets b and d of the first set only accreted 5 class-W planetesimals, 3 of them were accreted after 90 Myr, particularly between 110 and 170 Myr. These planetesimals provided and of the total accreted water by planets b and d, respectively, which represent and of their final masses. For the second set, planet a accreted 10 class-W planetesimals between 93 and 191 Myr which provided of the total accreted water, and represent of its final mass. Planet c accreted 20 class-W planetesimals between 91 and 199 Myr which provided of the total accreted water and represent of its final mass and finally planet e accreted 11 class-W planetesimals between 92 and 192 Myr which provided of the total accreted water and represent of its final mass. This analysis may be of particular interest for the habitable zone planets formed around M dwarfs regarding the work of Tian & Ida (2015). Although the Earth-mass planets found by Tian & Ida (2015) in M dwarf habitable zones may have lost their water content through dissociation and hydrodynamic scape during the first 90 Myr of evolution, they could still accrete ice planetesimals and retain significant amounts of water on their surfaces.
| Simulations | Planet | () | () | (Myr) | (Myr) | (Myr) | (Myr) |
|---|---|---|---|---|---|---|---|
| First Set | b | 1.19 | 4.51 | 21.9 | 81.3 | 35 | 35 |
| d | 0.66 | 8.10 | 21.8 | 67.3 | 2.9 | 13.4 | |
| Second Set | a | 2.21 | 8.75 | 21.8 | 56.6 | 51.7 | 51.7 |
| c | 2.00 | 10.76 | 39.8 | 66.9 | 6 | 20.5 | |
| e | 1.37 | 7.49 | 27.1 | 67.8 | 4.4 | 18.4 |
6 Discussion
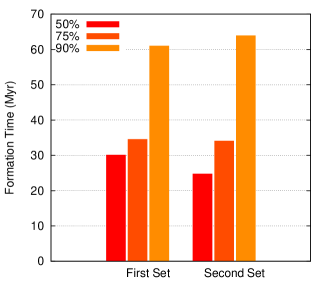
We found that at the end of the evolution of our simulations, five and six planets are produced in the HZ of the system from the first and second set of initial conditions, respectively. For the first set, planets of the HZ present masses ranging from 0.66 to 2.27, with a median value of 1.65. For the second set, the mass of the planets formed in the HZ ranges from 1.18 to 2.21, with a median value of 1.66. The timescales associated to the last giant impact received for the planets of the HZ are quite similar for both sets of simulations, with mean values of 35 Myr and 40 Myr for the first and second set, respectively. However, not always the last giant impact means that the planet presents the majority of it final mass. Figure 9 shows the mean time values that the planets in the HZ need to reach 50%, 75%, and 90% of their final mass for both sets. The values are averages for all planets in the HZ and, as we can see, the results are also quite similar for both sets.
A simple analysis of the feeding zones of the HZ planets (Figure 8) reveals that the planets in the first set of simulations accrete a higher percentage of material from the outer disk that the potentially habitable planets produced in the second set. In fact, for the first set, the final water contents range from 4.5% to 39.5% by mass, with a median value of 32.5%. For the second set, planets in the HZ have final water contents ranging from 7.5% to 33.6% by mass, with a median value of 17.5%.
Our simulations form “Earth-like planets” and “highly water-rich planets” or “water worlds” in the HZ. All the Earth-like planets, in both sets, grow in situ and their feeding zones are restricted to the inner disk. Thus, their final water contents are not primordial, and a detailed analysis shows that planetesimals are the only population responsible for their final amounts of water. In addition, an analysis of the accretion timescales shows that all these planets accreted half of the class-W planetesimals after they have achieved of their final masses. Moreover, they continue accreting class-W planetesimals after 90 Myr of evolution. On the other side, the Earth-like planets in both sets of simulations accreted different ammounts of class-W planetesimals. Particularly, the mass of water accreted by the Earth-like planets of the second set is greater than the one accreted by the first set, by a factor of 1.9 - 4. The highly water-rich planets are planets whose accretion seeds come from the outer zone of the disk (planets a, c and e of the first set and planet d of the second set) or grow near their initial positions but have accreted embryos from beyond the snow line. The sourses of water suply are also different in both sets. Planetary embryos are the most responsible for the final water contents of the water worlds of the first set but for two of the three planets of the second set, the final water contents are provided by embryos and planetesimals in equal parts.
However, it is worth mentioning that embryos and planetesimals might not be the only source of water. Izidoro et al. (2013) suggested that a compound model that considers water accretion through collisions of protoplanetary bodies and the contribution of the water locally adsorbed from the nebula is more efficient in the amount and time of the delivery of water to Earth-like planets.
Considering more realistic initial conditions to include in the N-body simulations is important to get a more realistic accretion history of the final planets. However, it is worth noting that the semi-analytical model used to generate these initial conditions contains several simplifications which might affect the results and could lead to different final configurations for the distribution of embryos and planetesimals. Particularly, our model neglects the presence of embryo gaseous envelopes because the masses of the embryos are small enough not to produce major differences. Moreover, the semi-analytical model does not include the effects of planetesimal fragmentation or pebble accretion. On the other hand, we do not include type I migration in our model because many aspects of this phenomenon are still under debate. Computing the N-body interactions for the embryos during the gaseous phase could also change their spacial distribution. Regarding the planetesimal distribution, different sizes of planetesimals could lead to different final planetesimal surface densities.
A detailed knowledge about the accretion history of the planets of a given system is very important in order to analyze several physical characteristics. In particular, all our simulations are developed assuming perfectly inelastic collisions that conserve mass and water content. However, a more realistic treatment of the collisions can lead us to a better understanding about the differentiation of a planet, composition, formation of structures such as a core and a mantle, as well as to quantify its abundance of water (Marcus et al. 2010; Chambers 2013; Bonsor et al. 2015). At the same way, a better knowledge about the accretion history of a planet allows us to understand the evolution of its atmosphere (Schlichting et al. 2015). In fact, impacts due to planetary embryos and planetesimals can generate a relevant atmospheric mass loss during the formation and evolution process.
7 Conclusions
We carried out N-body simulations aimed at studying the planetary formation process and water delivery around Sun-like stars in low-mass disks and in absence of gas giants. The main goal of our investigation is to study the sensitivity of the results to the particular initial distribution addopted for planetesimals and planetary embryos after the gas dissipation. The first set of simulations was based on Ronco & de Elía (2014) and assumes ad hoc initial conditions while the second set of simulations derives initial conditions from a semi-analytical model, which is capable of analyzing the evolution of a planetary system during the gas phase. Our main results suggest:
-
•
The number of planets formed in the HZ of the system is not sensitive to the initial conditions proposed in both sets of simulations. Moreover, the masses of the planets of the HZ do not show significant differences in both sets.
-
•
The main differences observed between both sets of simulations are associated to the accretion history of the planets of the HZ. Primarily, such discrepancies are related to the accretion of water-rich material.
-
•
Earth-like planets form in situ and their feeding zones are restricted to the inner region of the disk and these Earth-like planets present several Earth’s water contents.
-
•
Highly water-rich planets present different characteristics in both sets: these are planets whose accretion seeds come from the outer zone of the disk or are planets which grow near their initial positions but have accreted embryos from beyond the snow line, meaning that their feeding zones extend to the outer region of the disk.
-
•
Our simulations indicate that planetary embryos are the most responsible for the final water contents of the water worlds in the HZ of the first set, while planetesimals play a secondary role. Of the three water worlds formed in the HZ from the second set of initial conditions, only one of them shows a similar behavior to that previously described. However, the primordial water content of two of such planets is negligible and their final water contents are provided by impacts of embryos and planetesimals in equal parts.
-
•
Almost all the simulations formed Earth-like planets within the HZ. As they grow in situ, their final water contents are not primordial, and planetesimals are the only population responsible for their final amounts of water. In addition, all these planets accreted half of the class-W planetesimals after they have achieved of their final masses. Moreover, they continue accreting class-W planetesimals after 90 Myr of evolution. These results show that the water delivery is a late process in the evolution of an Earth-like planet and this is of great interest because it can facilitate the retention of water and other volatiles on the surface.
Finally we conclude that the inclusion of more realistic initial conditions in N-body simulations of terrestrial-type planet formation is crucial to do a more realistic analysis of the accretion history of the planets resulting from the formation of a planetary system.
Acknowledgements.
We thank the anonymous referee for constructive coments and we also thank the suggestions of the editor Tristian Guillot which helped us to improved the manuscript. This work was funded with grants from Consejo Nacional de Investigaciones Científicas y Técnicas de la República Argentina and Universidad Nacional de La Plata (Argentina).References
- Abbot et al. (2012) Abbot, D. S., Cowan, N. B., & Ciesla, F. J. 2012, ApJ, 756, 178
- Abe et al. (2000) Abe, Y., Ohtani, E., Okuchi, T., Righter, K., & Drake, M. 2000, Water in the Early Earth, ed. R. M. Canup, K. Righter, & et al., 413–433
- Agnor & Asphaug (2004) Agnor, C. & Asphaug, E. 2004, ApJ, 613, L157
- Alibert (2014) Alibert, Y. 2014, A&A, 561, A41
- Andrews et al. (2010) Andrews, S. M., Wilner, D. J., Hughes, A. M., Qi, C., & Dullemond, C. P. 2010, ApJ, 723, 1241
- Benítez-Llambay et al. (2015) Benítez-Llambay, P., Masset, F., Koenigsberger, G., & Szulágyi, J. 2015, Nature, 520, 63
- Bonsor et al. (2015) Bonsor, A., Leinhardt, Z. M., Carter, P. J., et al. 2015, Icarus, 247, 291
- Brunini & Benvenuto (2008) Brunini, A. & Benvenuto, O. G. 2008, Icarus, 194, 800
- Chambers (1999) Chambers, J. E. 1999, MNRAS, 304, 793
- Chambers (2001) Chambers, J. E. 2001, Icarus, 152, 205
- Chambers (2013) Chambers, J. E. 2013, Icarus, 224, 43
- Cumming et al. (2008) Cumming, A., Butler, R. P., Marcy, G. W., et al. 2008, PASP, 120, 531
- Dauphas & Pourmand (2011) Dauphas, N. & Pourmand, A. 2011, Nature, 473, 489
- de Elía et al. (2013) de Elía, G. C., Guilera, O. M., & Brunini, A. 2013, A&A, 557, A42
- Guilera et al. (2010) Guilera, O. M., Brunini, A., & Benvenuto, O. G. 2010, A&A, 521, A50
- Guilet et al. (2013) Guilet, J., Baruteau, C., & Papaloizou, J. C. B. 2013, MNRAS, 430, 1764
- Guillot et al. (2014) Guillot, T., Ida, S., & Ormel, C. W. 2014, A&A, 572, A72
- Hayashi (1981) Hayashi, C. 1981, Progress of Theoretical Physics Supplement, 70, 35
- Ida & Makino (1993) Ida, S. & Makino, J. 1993, Icarus, 106, 210
- Izidoro et al. (2013) Izidoro, A., de Souza Torres, K., Winter, O. C., & Haghighipour, N. 2013, ApJ, 767, 54
- Johansen et al. (2014) Johansen, A., Blum, J., Tanaka, H., et al. 2014, Protostars and Planets VI, 547
- Johansen et al. (2015) Johansen, A., Mac Low, M.-M., Lacerda, P., & Bizzarro, M. 2015, Science Advances, 1, 15109
- Kasting et al. (1993) Kasting, J. F., Whitmire, D. P., & Reynolds, R. T. 1993, Icarus, 101, 108
- Kitzmann et al. (2015) Kitzmann, D., Alibert, Y., Godolt, M., et al. 2015, ArXiv e-prints
- Kokubo & Ida (1998) Kokubo, E. & Ida, S. 1998, Icarus, 131, 171
- Kopparapu et al. (2013a) Kopparapu, R. K., Ramirez, R., Kasting, J. F., et al. 2013a, ApJ, 770, 82
- Kopparapu et al. (2013b) Kopparapu, R. K., Ramirez, R., Kasting, J. F., et al. 2013b, ApJ, 765, 131
- Lambrechts & Johansen (2012) Lambrechts, M. & Johansen, A. 2012, A&A, 544, A32
- Lissauer & Stevenson (2007) Lissauer, J. J. & Stevenson, D. J. 2007, Protostars and Planets V, 591
- Lodders (2003) Lodders, K. 2003, ApJ, 591, 1220
- Lécuyer & Gillet (1998) Lécuyer, C. & Gillet, P.and Robert, F. 1998, Chem. Geol., 145, 249–261
- Marcus et al. (2010) Marcus, R. A., Sasselov, D., Stewart, S. T., & Hernquist, L. 2010, ApJ, 719, L45
- Marty (2012) Marty, B. 2012, Earth and Planetary Science Letters, 313, 56
- Masset et al. (2006) Masset, F. S., D’Angelo, G., & Kley, W. 2006, ApJ, 652, 730
- Mayor et al. (2011) Mayor, M., Marmier, M., Lovis, C., et al. 2011, ArXiv e-prints
- Miguel et al. (2011) Miguel, Y., Guilera, O. M., & Brunini, A. 2011, MNRAS, 417, 314
- Mordasini et al. (2009) Mordasini, C., Alibert, Y., Benz, W., & Naef, D. 2009, A&A, 501, 1161
- Morishima et al. (2010) Morishima, R., Stadel, J., & Moore, B. 2010, Icarus, 207, 517
- O’Brien et al. (2006) O’Brien, D. P., Morbidelli, A., & Levison, H. F. 2006, Icarus, 184, 39
- O’Brien et al. (2014) O’Brien, D. P., Walsh, K. J., Morbidelli, A., Raymond, S. N., & Mandell, A. M. 2014, Icarus, 239, 74
- Ormel & Klahr (2010) Ormel, C. W. & Klahr, H. H. 2010, A&A, 520, A43
- Paardekooper et al. (2010) Paardekooper, S.-J., Baruteau, C., Crida, A., & Kley, W. 2010, MNRAS, 401, 1950
- Paardekooper et al. (2011) Paardekooper, S.-J., Baruteau, C., & Kley, W. 2011, MNRAS, 410, 293
- Raymond et al. (2009) Raymond, S. N., O’Brien, D. P., Morbidelli, A., & Kaib, N. A. 2009, Icarus, 203, 644
- Raymond et al. (2004) Raymond, S. N., Quinn, T., & Lunine, J. I. 2004, Icarus, 168, 1
- Raymond et al. (2005) Raymond, S. N., Quinn, T., & Lunine, J. I. 2005, ApJ, 632, 670
- Raymond et al. (2006) Raymond, S. N., Quinn, T., & Lunine, J. I. 2006, Icarus, 183, 265
- Righter & Drake (1999) Righter, K. & Drake, M. J. 1999, Earth and Planetary Science Letters, 171, 383
- Ronco & de Elía (2014) Ronco, M. P. & de Elía, G. C. 2014, A&A, 567, A54
- Schlichting et al. (2015) Schlichting, H. E., Sari, R., & Yalinewich, A. 2015, Icarus, 247, 81
- Tanaka et al. (2002) Tanaka, H., Takeuchi, T., & Ward, W. R. 2002, ApJ, 565, 1257
- Tian & Ida (2015) Tian, F. & Ida, S. 2015, Nature Geosci, 8, 177
- Touboul et al. (2007) Touboul, M., Kleine, T., Bourdon, B., Palme, H., & Wieler, R. 2007, Nature, 450, 1206
- Walsh et al. (2011) Walsh, K. J., Morbidelli, A., Raymond, S. N., O’Brien, D. P., & Mandell, A. M. 2011, Nature, 475, 206
- Williams & Pollard (2002) Williams, D. M. & Pollard, D. 2002, in Astronomical Society of the Pacific Conference Series, Vol. 269, The Evolving Sun and its Influence on Planetary Environments, ed. B. Montesinos, A. Gimenez, & E. F. Guinan, 201