Corrugated velocity patterns in the spiral galaxies: NGC 278, NGC 1058, NGC 2500 & UGC 3574
Abstract
We address the study of the H vertical velocity field in a sample of four nearly face-on galaxies using long slit spectroscopy taken with the ISIS spectrograph attached to the WHT at the Roque de los Muchachos Observatory (Spain). The spatial structure of the velocity vertical component shows a radial corrugated pattern with spatial scales higher or within the order of one kiloparsec. The gas is mainly ionized by high-energy photons: only in some locations of NGC 278 and NGC 1058 is there some evidence of ionization by low-velocity shocks, which, in the case of NGC 278, could be due to minor mergers. The behaviour of the gas in the neighbourhood of the spiral arms fits, in the majority of the observed cases, with that predicted by the so-called hydraulic bore mechanism, where a thick magnetized disk encounters a spiral density perturbation. The results obtained show that it is difficult to explain the H large scale velocity field without the presence of a magnetized, thick galactic disk. Larger samples and spatial covering of the galaxy disks are needed to provide further insight into this problem.
keywords:
spectroscopy — corrugations— galaxies: spiral–kinematics.1 Introduction
The Milky Way shows a galactic disk quite far from the planarity (Kerr et al., 1957). This high degree of structure was first observed in the gas and can be classified into three categories associated with different regions and spatial scales of the disk: a) the gas in the innermost region of the galaxy appears to be tilted with respect to the formal galactic plane (Gum et al., 1960) ; b) warping of the gas in the outer regions of the disk is almost a ubiquitous feature of spiral galaxies in the Local universe, even for those that are seemingly isolated (i.e. Gum et al., 1960; Verschuur, 1973; Florido et al., 1991) ; and c) since the 1950s we have known that HI in the Milky Way shows a coherent wavy structure with respect to the fundamental plane of the Galaxy in the inner region of the Sun called “corrugations” (i.e. Lockman, 1977; Alfaro & Efremov, 1996).
Corrugations have also been observed in different stellar populations of the Milky Way (i.e. Quiroga, 1977; Alfaro, Cabrera-Cano, & Delgado, 1992) and both in the azimuthal direction along different spiral arms (Spicker & Feitzinger, 1986), and in the radial direction at different galactocentric radii (Malhotra & Rhoads, 1995). This phenomenon is not just limited to our Galaxy but has also been observed in external galaxies (e.g. Florido et al., 1991; Matthews & Uson, 2008), and for different tracers of both gas and stellar populations. In addition, although most of the stellar corrugations were determined from the distribution of young stars, infrared observations seem to show that old stellar populations also participate in this structure (Djorgovski & Sosin, 1989; Rhoads, 1995).
All these results suggest that this is a universal phenomenon common in late-type galaxies, observable at almost any wavelength (Alfaro & Efremov, 1996; Matthews & Uson, 2008). However, despite the universality of this phenomenon it has barely been studied and is poorly understood.
These spatial corrugations clearly must be associated with wavy vertical motions in the galactic plane. Evidence of these kinematic waves was first detected in the analysis of the rotation curves of spiral galaxies (e.g. de Vaucouleurs & de Vaucouleurs, 1963; Pişmiş, 1965), but it was not until Alfaro et al. (2001) analysed the velocity corrugations in NGC 5427 in more detail that a likely physical mechanism was proposed for their origin.
Henceforth, we use the term “velocity corrugation” to refer to the observed wavy field of the velocity vertical component. The two kinds of structures have been observed in spiral galaxies: a) spatial corrugations in our Galaxy and other edge-on external galaxies, and b) velocity corrugations in face-on galaxies.
Given the nature of the problem, galaxy-observer geometry plays a fundamental role in the interpretation of the observables. Within our Galaxy we can easily observe the corrugated structure of the spiral arms in the solar neighbourhood in the optical range, as well as the HI structure at larger distances in the radio wavelength range. The vertical velocity field of these morphologies shows an almost null component in the direction of the line of sight. However, Feitzinger & Spicker (1985) were able to detect true velocity gradients perpendicular to the Galactic plane that could not be totally explained by geometric effects.
By contrast, the face-on external galaxies represent the best natural laboratory for the study of the vertical velocity field, given that most of the observed radial velocity is representative of the galaxy disk velocity vertical component. However, they do not provide any information about spatial corrugations.
In summary, in the last 60 years several pieces of evidence have been collected showing that most disks of spiral galaxies present a residual wavy structure with respect to the galactic main plane. This undulatory behaviour is observable at different wavelengths, being representative of the gas in different physical conditions, as well as of different stellar populations. Different scenarios have been proposed to explain this phenomenon (see Alfaro & Efremov, 1996; Alfaro et al., 2004), but there is a lack of systematic studies which would help to better understand these structures and their possible origin.
In this paper, we address the study of the vertical velocity in a sample of four nearly face-on spiral galaxies. As aforementioned, the geometry of the problem is a main criterion in the selection of the sample as well as of the long slit azimuthal position angles. In Section 2 we show the galaxy sample and their selection criteria. Observations and data reduction details are presented in Section 3. In section 4 we describe the geometry of the problem and establish its fundamental relationships. The main results and relationships between the vertical component of the velocity field and the H emission lines are shown in Section 5. In Section 6 we present an analysis of the ionization sources via Diagnostic Diagrams. Finally, a summary of this work can be found in Section 7.
2 Galaxy Sample
The galaxies were selected from the LEDA database111Lyon-Meudon Extragalactic Database, http://leda.univ-lyon1.fr/ with the criteria: (i) low inclination angle ( i)222For NGC 1058, LEDA gives , but its correct inclination angle is in the range (Lewis 1987; van der Kruit & Shostak 1984; 2007AJ….134.1952P); (ii) nearby ( km s-1); (iii) a well-defined spiral morphological type (2t8); and (iv) a diameter larger than 2 arcmin (D).
This information and other basic properties of the galaxy sample are summarized in Table LABEL:tab1. With the aim of having a uniform and homogeneous criterion for the inclination and for the position angle, and since these values can change significantly between different authors, we show the values given by Epinat et al. (2008). We also take the data for the calculation of the rotation curves from these authors.
Figure 1 displays images of the galaxies with the different slit positions. Next, we summarize the main references and properties for these galaxies found in the literature.
-
•
NGC 278 is isolated (Bushouse et al., 1988) and almost face-on, part of the local supercluster of galaxies centred around the Virgo cluster (Vallee, 1993). It is relatively small in the optical emission, with size of about (Israel 2009) corresponding to a diameter of 7 kpc at a distance of Mpc (see Table LABEL:tab1). However, in HI its diameter is five times larger (Knapen et al., 2004).
In optical images its morphology is that of a small, non-barred galaxy with a bright star-forming nucleus and spiral arms. Its nucleus is not only quite bright in H, but also in the infrared continuum (Dale et al., 2000; Sanders, 2003), and in the [CII] line (Malhotra et al., 2001), consistent with intense star-forming activity (Ho et al., 1995; Eskridge et al., 2002). There is no indication of a low-luminosity AGN (Tzanavaris & Georgantopoulos, 2007).
NGC 278 can be found in many recent works, but mostly forming part of surveys (e.g. Israel, 2009). A specific study of this galaxy can be found in Knapen et al. (2004), who concluded that its appearance most likely reflects a recent minor merger. Asymmetries set up in the disk by this minor merger may well be the cause of the intense star formation in the inner region, which can be interpreted as a rare example of a nuclear ring in a non-barred galaxy. Rather than being induced by the secular evolution of a bar, this nuclear ring would then be the direct result of an interaction event in the recent history of the galaxy. It also shows a disturbed velocity field in its H kinematics, which may be partly the result of spiral density wave streaming motions. The HI emission, although faint, also shows disturbed morphology and kinematics.
-
•
NGC 1058 is a nearly face-on spiral galaxy with an inclination angle in the range to (Petric & Rupen, 2007). The distance to this galaxy is uncertain, ranging from 8.4 Mpc (Battinelli et al., 2000) to 14.5 Mpc (Sandage & Tammann, 1974). We adopt a distance of 9.8 Mpc, given by a more recent work (Moustakas & Kennicutt, 2006), for which 1″ corresponds to 47.5 pc.
It has a clear knotty structure not organized into spiral arms (Battinelli et al., 2000), with a complete absence of any well-defined arms in H emission, and a flocculent appearance of the disk’s innermost regions (Ferguson et al., 1995). These features are also observed in the HST image (Figure 1).
Radial metallicity and reddening gradients, both decreasing with the galactocentric distance, are found from studies of H emitting regions by Ferguson et al. (1998), a trend often observed in spirals (Sánchez et al., 2014).
The HI velocity dispersion (ranging 4 – 15 km s-1) also decreases with radius, but the decline of starlight with radius is much steeper than that of the velocity dispersion (Petric & Rupen, 2007). These authors also find that the HI velocity dispersion is not correlated with star formation or the spiral arms, so a global radial falloff must be explained in the context of significant local effects.
Battinelli et al. (2000) also found a steeper radial slope for the star formation rate (SFR) in NGC 1058, with young star associations relatively small (peak at 50 pc), the star formation being clearly stronger in the central regions. However, from our long slit spectra, Figure 1, H reveals stronger emission in the outer than in the innermost regions.
-
•
UGC 3574 is a nearby late-type spiral galaxy, with low inclination; at a distance of 21.8 Mpc (James et al., 2004) it is the furthest galaxy of the sample. Two faint spiral arms can be distinguished, while the stronger emission comes from the nuclear region and some very compact and clumpy sources at the end of the southern spiral arm or across the northern one.
No specific studies for this galaxy are found in the literature, but it is included in many surveys for different purposes, e.g. Böker et al. (2002) who study the nuclear star clusters in late-type spiral galaxies. In this work, UGC 3574 is characterized as having a “naked” nuclear cluster in the I-band WFPC2 image, forming a distinct and isolated entity within the disk and without any signs of a kinematic centre.
-
•
NGC 2500 belongs to a quartet of galaxies (Sandage & Bedke, 1994). Epinat et al. (2008) find diffuse H emission in their observed H maps, in agreement with James et al. (2004), where its short bar is almost aligned with its minor kinematical axis. There are no individual works for this galaxy, mainly found as part of surveys, e.g. Epinat et al. (2008) or James et al. (2004).
In the HST/WFPC2+F450W image, Figure 1, it is observed that the star formation is mainly concentrated in the nuclear region and its well-defined, northern spiral arm. The southern arm is fainter and, globally, the southern region of this galaxy appears more flocculent.
These features are enhanced in H emission, as can be observed in Figure 1. The H image is taken from the public database of the Local Volume Legacy (LVL) survey333http://irsa.ipac.caltech.edu/data/SPITZER/LVL/, and is over-plotted to the HST image, in flux scaled contours.
3 Observations and data reduction
We obtained long-slit spectroscopy with the double arm ISIS spectrograph attached to the 4.2m William Herschel Telescope (WHT), at the Roque de los Muchachos Observatory (La Palma) during December 2003. This instrument consists of two intermediate dispersion spectrographs operating simultaneously, separating the blue and red spectral regions, which are imaged onto an EEV12 and a MARCONI2 CCD chip, respectively. In this way we have two spectral ranges observed simultaneously, a blue one centred around H (4861 ), and a red one around H (6563 ). The gratings used, R1200R and R600B, provide a dispersion of 0.23 and 0.45 /pixel respectively. The slit width of 1 arcsec projects onto about 3.64 pixels Full-Width-Half-Maximum (FWHM) on the detector; the spatial sampling along the slit is 0.2 arcsec/pixel. The slit was placed at two or three different position angles for each galaxy (Table 2). An angle close to the minor axis of the galaxy was chosen, so the projection of the rotation velocity is nearly negligible and the observed velocities are mainly the projected vertical component on the line of sight. Moreover, other intermediate angles were taken to compare corrugated patterns with the latter, and/or to cross some brighter H features.
The spectra were reduced and calibrated following the standard procedure. Bias subtraction, flat-fielding, wavelength and flux calibration were done with the IRAF444IRAF is distributed by the National Optical Astronomy Observatory, which is operated by the Association of Universities for Research in Astronomy (AURA) under cooperative agreement with the National Science Foundation task ccdproc. For the wavelength calibration CuNe CUAR lamps were used. The standard stars Feige 34, g191b2b, gd248, gd50 and hz21 from the Oke (1990) catalogue were used for flux calibration. Sky subtraction was done using the IRAF NOAO package task background. For each wavelength range, the different exposures at each slit orientation were combined, eliminating cosmic rays and bad pixels, thus obtaining the final spectra.
The observed velocity along the slit is obtained from the H emission line fitting. Moreover, to calculate the diagnostic diagrams to study the ionization (section 6), we fit the emission lines H, [NII], [SII], H, and [OIII], with a Gaussian at each pixel along the slit where the emission was strong enough to be fitted. Line flux, FWHM, central wavelength, and their corresponding errors, are calculated with the STARLINK555http://star-www.rl.ac.uk/star/docs/sun50.htx/sun50.html package DIPSO. The continuum level is simultaneously fitted locally with a first order polynomial.
| Galaxy | RA (J2000) | Dec. (J2000) | Type | Redshift | Dist.b | Inclin.c | PAc | Dimensions | MB |
|---|---|---|---|---|---|---|---|---|---|
| h m s | ∘ ′ ′′ | (Mpc) | (deg) | (deg) | (arcmin) | ||||
| NGC 278 | 00 52 04.3 | +47 33 02 | SAB(rs)b | 0.002090 | 12.1 | 2114 | 52 3 | 2.12.0 | -19.6 |
| NGC 1058 | 02 43 30.0 | +37 20 29 | SA(rs)c | 0.001728 | 9.8 | 6 15 | 125 6 | 3.02.8 | -18.7 |
| UGC 3574 | 06 53 10.4 | +57 10 40 | SA(s)cd | 0.004807 | 21.8 | 19 10 | 99 3 | 4.23.6 | -18.0 |
| NGC 2500 | 08 01 53.2 | +50 44 14 | SAB(rs)d | 0.001715 | 11.0 | 41 10 | 85 2 | 2.92.6 | -18.2 |
| a | Sourced from NASA Extragalactic Database |
|---|---|
| b | Moustakas & Kennicutt 2006; except for UGC 3574, James et al. 2004 |
| c | Epinat et al. 2008. Inclination and position angle deduced from their analysis of the velocity field (from H data). |
| The galaxies were selected from the LEDA database1 with a criterium of a low inclination angle ( i). NGC 2500 | |
| appears in this catalog with an inclination angle of 18∘, but we use data from Epinat et al. (2008) to determine the galactic | |
| rotation curve, where a kinematic inclination angle of 41∘ is estimated. For the sake of coherence in our data, we take this | |
| value into our analysis. |
| Galaxy | Date | P.A. (deg) | Wavelength range () | Exposure time (s) | Slit (″) | Airmass |
|---|---|---|---|---|---|---|
| NGC 278 | 15.12.2003 | 40.5, 93.15, 143.5 | 60347088 | 31200 | 1.03 | 1.06 - 1.33 |
| NGC 2500 | 15.12.2003 | 24, 79.5, 40.7 | 60347088 | 2,31200 | 1.03 | 1.08 - 1.14 |
| NGC 1058 | 16.12.2003 | 32.5, 125 | 60347088 | 31800 | 1.03 | 1.01 - 1.17 |
| UGC 3574 | 16.12.2003 | 0, 27, 122 | 60347088 | 31200; 2,31800 | 1.03 | 1.14 - 1.28 |
4 VZ calculation
In the case of face-on galaxies, the vertical component of the disk velocity field may be obtained straightforwardly. As our galaxies are nearly face-on, the observed velocity is the result of the sum of several projected velocity components, due to their inclination angle. This sum can be summarized as the vertical component to the disk, , plus its parallel component . We assume then that the observed velocity can be expressed in terms of
| (1) | |||||
where Vsys is the systemic velocity of the galaxy (radial velocity of the galactic centre with respect to LSR), Vrot and Vexp the rotational and expansion velocity respectively, at the plane of the disk, and VZ is the velocity perpendicular to the galaxy main plane; is the angle in the plane of the galaxy (counterclockwise from the major axis), and is the inclination angle of the galaxy disk.
We consider the x-axis in the direction of the maximum diameter passing through the galaxy centre and the north equatorial pole, contained in the plane of the sky. And the x-axis coincides with the major axis in the plane of the galactic disk. Thus, the polar coordinates in the plane of the sky, (r,), and in the plane of the galaxy, (R,), are related as follows:
| (2) | |||||
| (3) | |||||
| (4) |
From equation 1, neglecting the expansion velocity (i.e., assuming ), and applying the relations between the celestial coordinates (equations 2 and 3), the vertical velocity component can be calculated as:
| (6) | |||||
The vertical velocities are therefore computed as a function of Vsys, the systemic velocity of the Galaxy taken from the literature; and , the observed velocity, obtained by fitting the H emission lines from our long-slit spectra, and their corresponding slit position angles; and Vrot, and , the rotational velocity of the galaxy, the position angle of the line of nodes and the inclination angle of the galactic disk.
| Galaxy | R | |||
|---|---|---|---|---|
| (km s-1) | (arcsec) | (correlation) | ||
| NGC 278 | 219.7359.1 | 1.080.36 | -0.400.17 | 0.907 |
| NGC 1058 | 74.512.7 | 0.160.10 | 0.050.03 | 0.668 |
| UGC 3574 | 155.518.5 | 1.290.31 | 0.0240.017 | 0.916 |
| NGC 2500 | 55.93 | 0.400.53 | 0.040.007 | 0.872 |
** The rotation curve has been fitted by a least squares fit, following the parametric model of Giovanelli & Haynes (2002): .
As a first approximation, we consider a global velocity model where the main movement in the galactic plane is the rotational velocity, neglecting any other kind of kinematics, and it is assumed that they depend on the galactocentric distance or radius, . We try to explain those movements that do not fit to the model as vertical motions with respect to the galactic plane.
The observed velocities are obtained from the H emission line fitting of the long-slit spectra, described in Section 3 above.
Data for the calculation of the rotation curves , inclination angles and PAs for each galaxy are taken from Epinat et al. (2008), see Table LABEL:tab1. Rotation curves data are given as a set of points with their errors (Figure 2), so the rotation curves are obtained by fitting these sets of points using the parametric model of Giovanelli & Haynes (2002),
| (7) |
where regulates the overall amplitude of the rotation curve, yields a scale length for the inner steep rise, and sets the slope of the slowly changing outer part. After a least square fit of this model to the data, the parameters obtained for each galaxy are summarized in Table 3.
Figure 2 shows the rotation curve fitted to the data of each galaxy. The approaching side of the curve is represented by grey circles and the receding side by black squares. Both sides of the curve were fitted separately, represented with dashed and dotted lines, respectively. The kinematic lopsidedness commonly observed in the dynamics of galaxies can be clearly seen. This lopsidedness occurs in two different ways, as already described by van Eymeren et al. (2011), who found five different types for the kinematic behaviour of disk galaxies based on the rotation curves of the receding and approaching sides separately. NGC 278 shows their third type, in which receding and approaching sides agree well at small radii but differ at large radii, whereas the other three galaxies show type 5, in which the curves of receding and approaching sides change sides at a certain radius.
Despite this lopsidedness, the rotation curves were fitted to both receding and approaching points as a whole data set, given by the bold line in Figure 2. This global fit remains at intermediate values between the rotation curves of the receding and approaching sides, as a combination of both sides.
Finally, as is expressed as a function of and ( and are consider part of our data), we can calculate its uncertainty by propagating the error as:
| (8) |
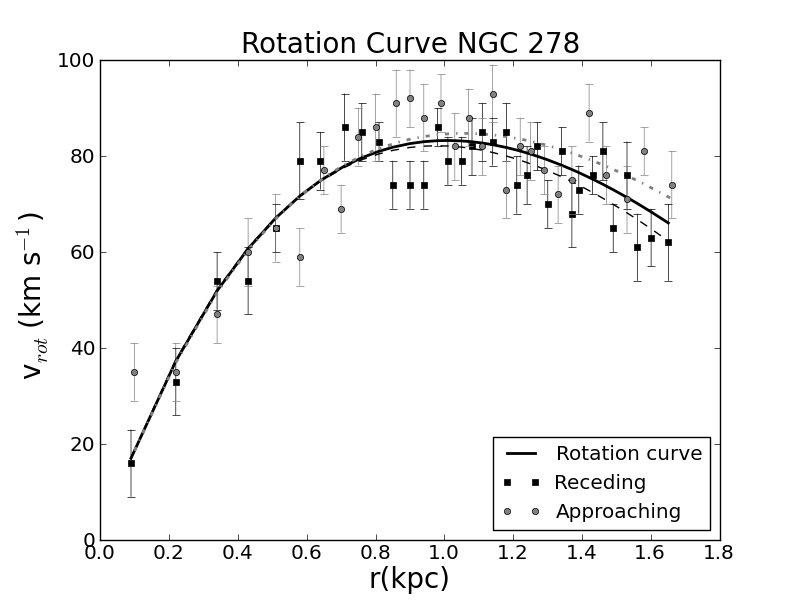
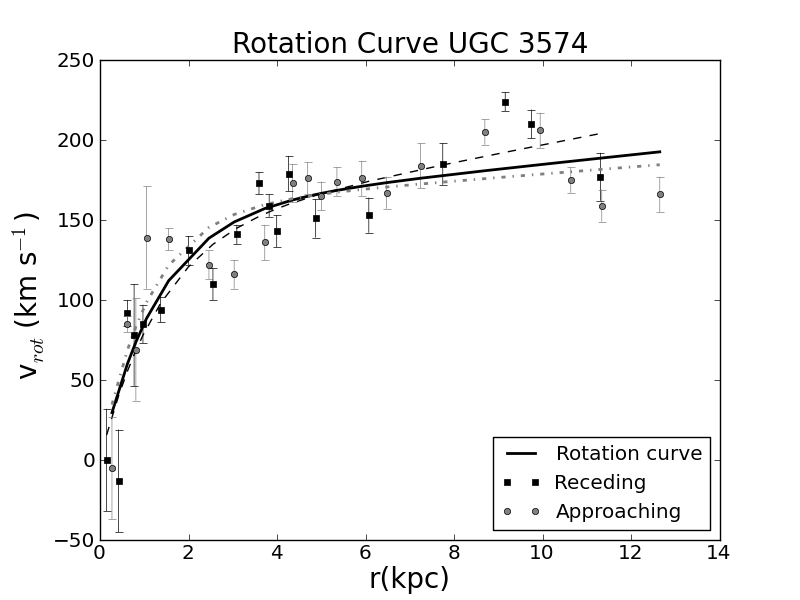
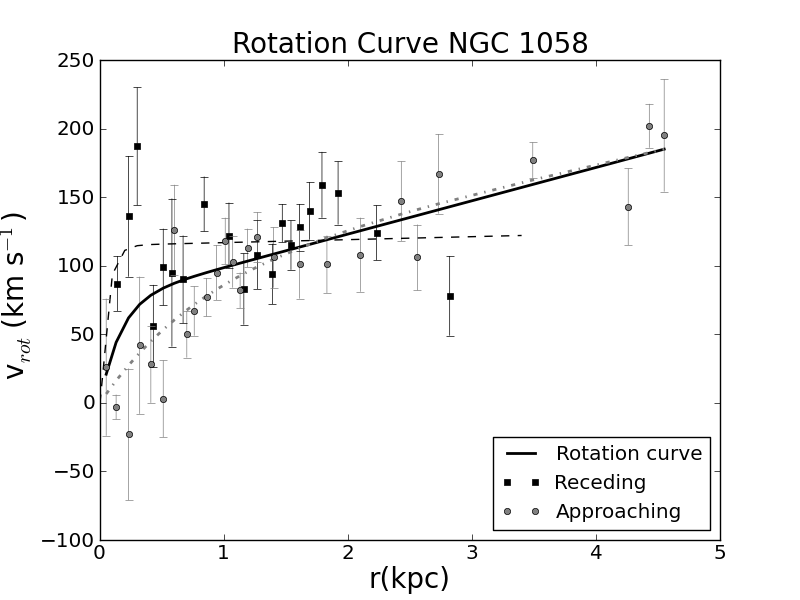
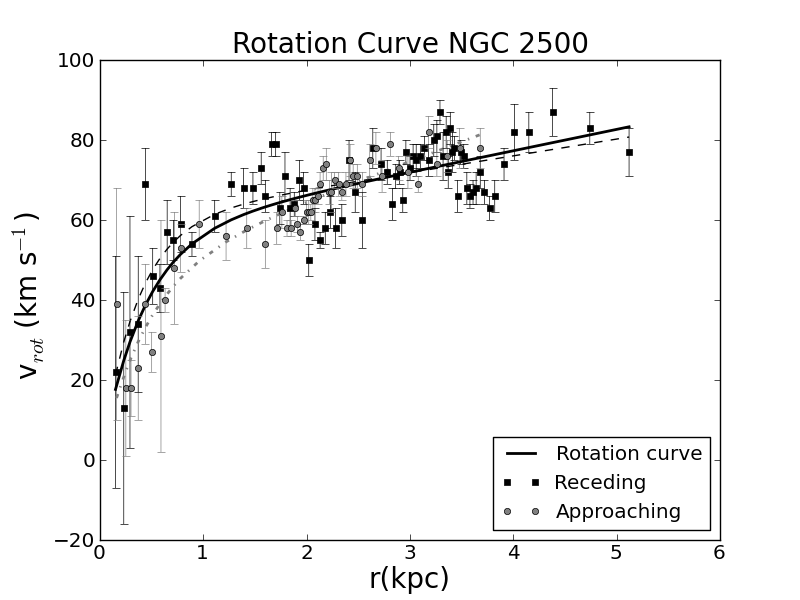
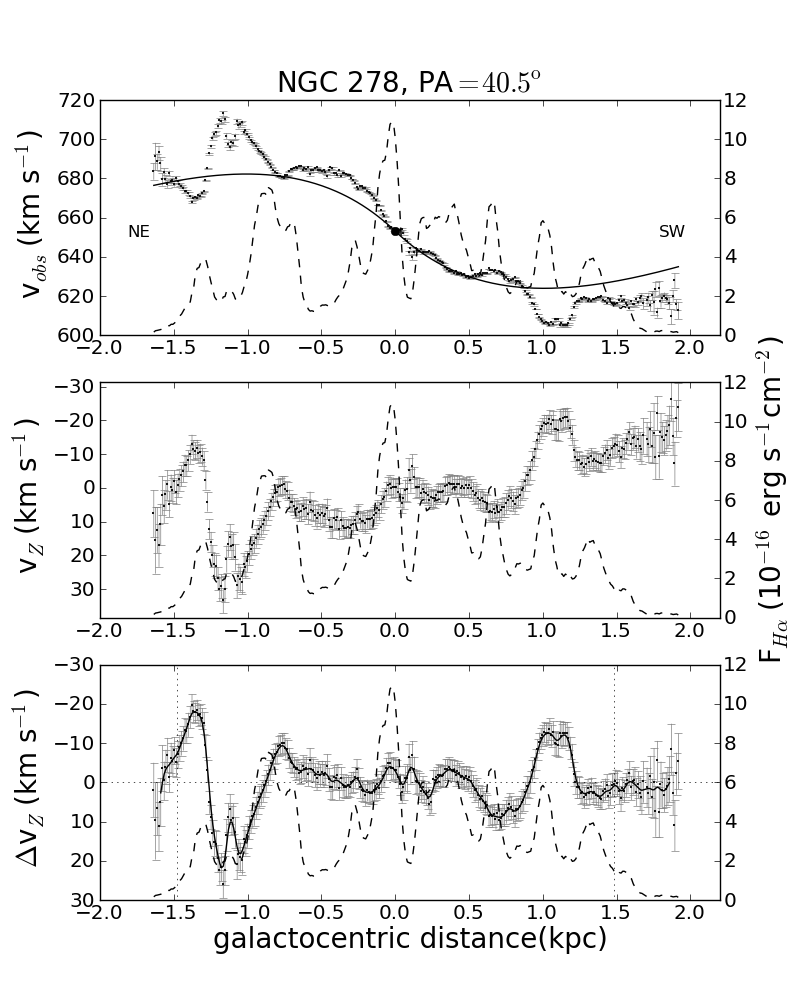
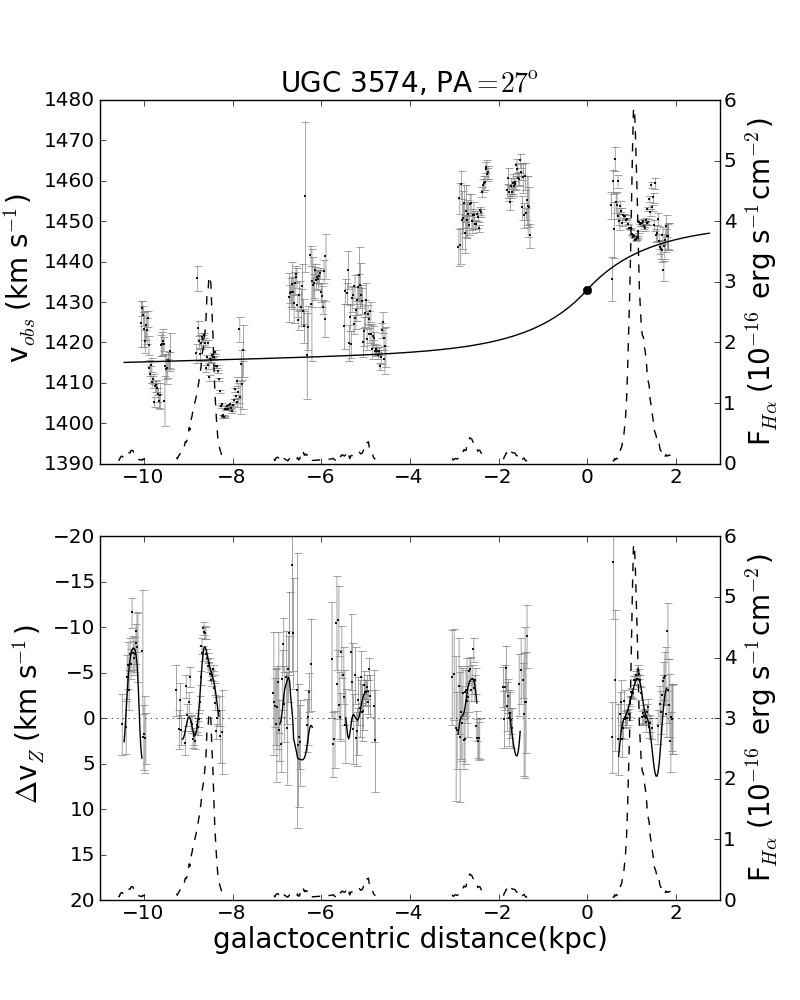
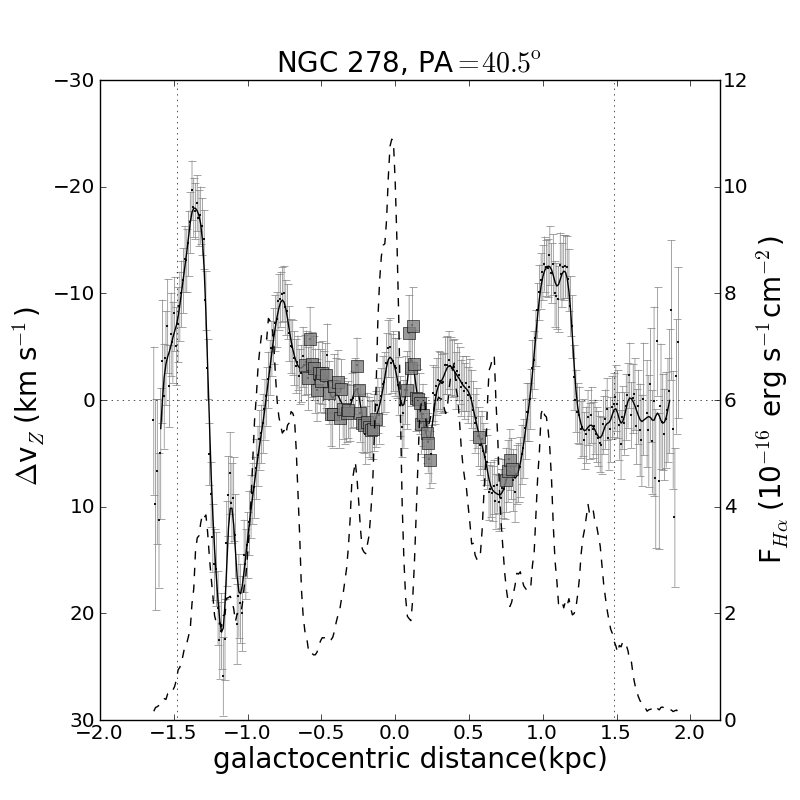
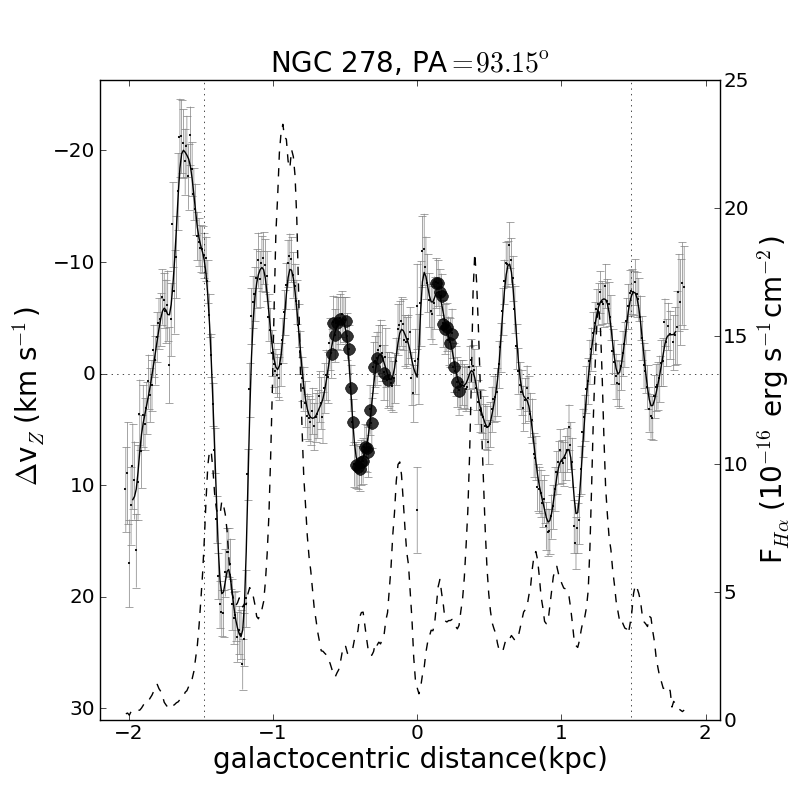
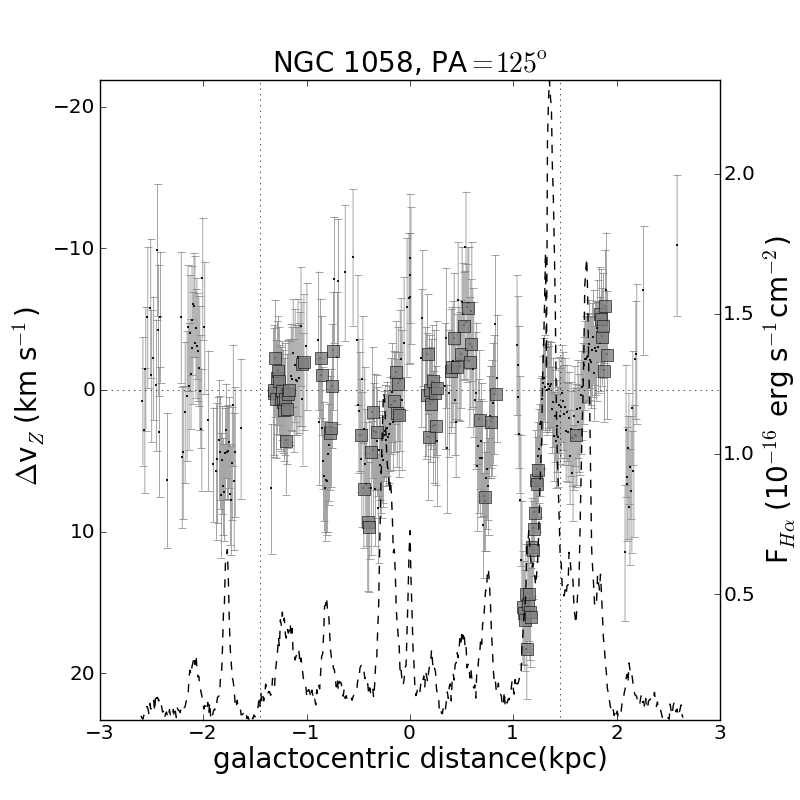
Figure 3 shows the procedure for obtaining the vertical motions for the galaxy NGC 278, at each of the three position angles. The top panels show the observed radial velocities with their error bars, together with the projection of the rotation curve (the bold line) fitted as described above. The systemic velocity is marked by a black-filled circle. All these plots have the galactocentric distance in the -axis, where zero distance marks the galactic centre position. The H emission line flux is also plotted, with the aim of looking for some relation or correlation between the velocity and flux peaks.
The middle panels show that has some residual trend, as residual of the rotational velocity removal probably due to the described lopsidedness. To remove these rotational residues, the vertical velocity component has been detrended, hereafter denoted as , by fitting a linear component to the gentle rise for each rotation curve side, the approaching and the receding sides. In this simple way, the residual trend from the difference between the approaching and the receding sides of the rotation curve is removed; and thus only the local fluctuations, or oscillations, of the vertical velocity component across the disk, throughout the spiral arms and for different slit positions, remain. The bottom panels show the detrended velocities .
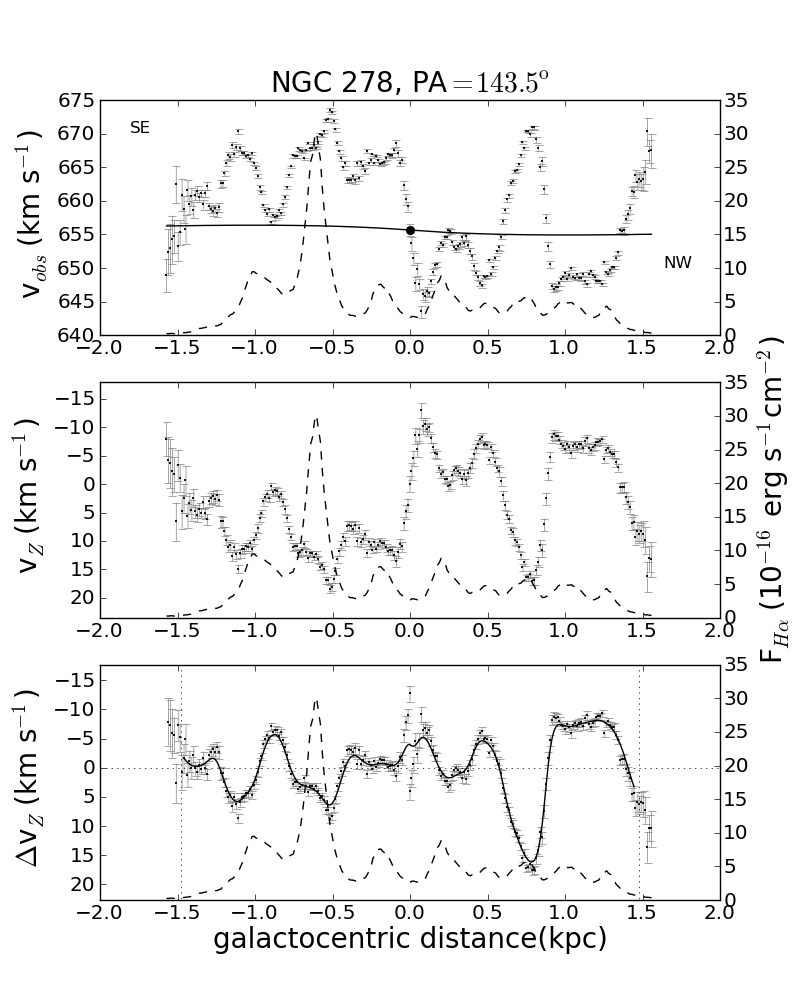
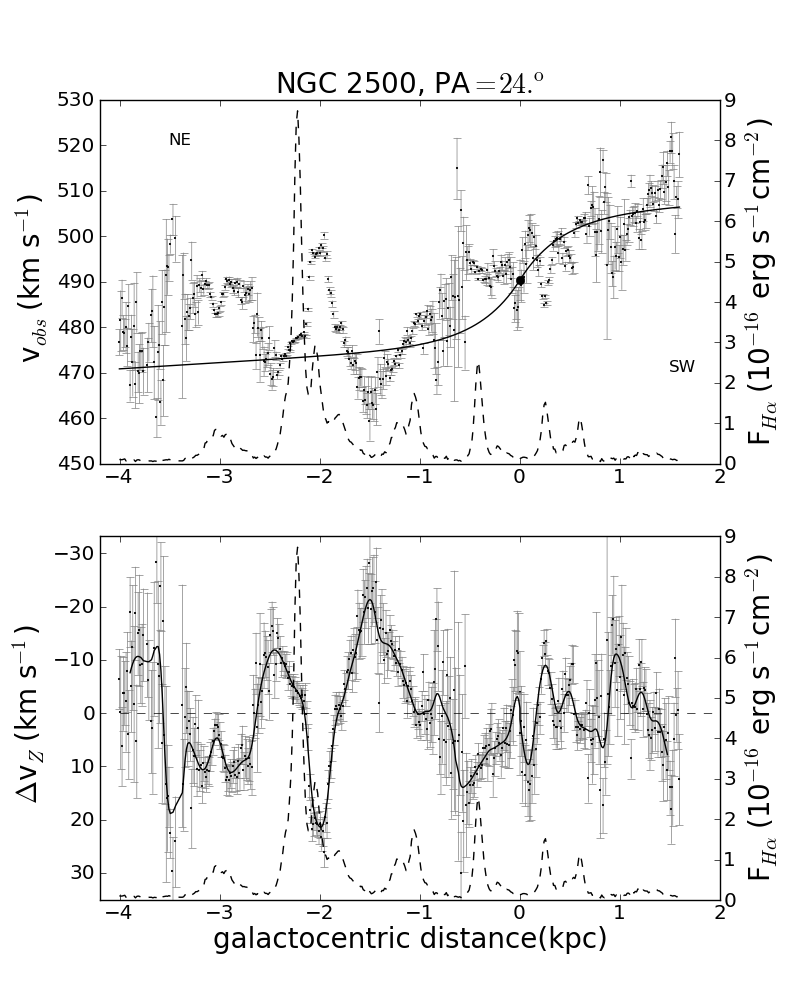
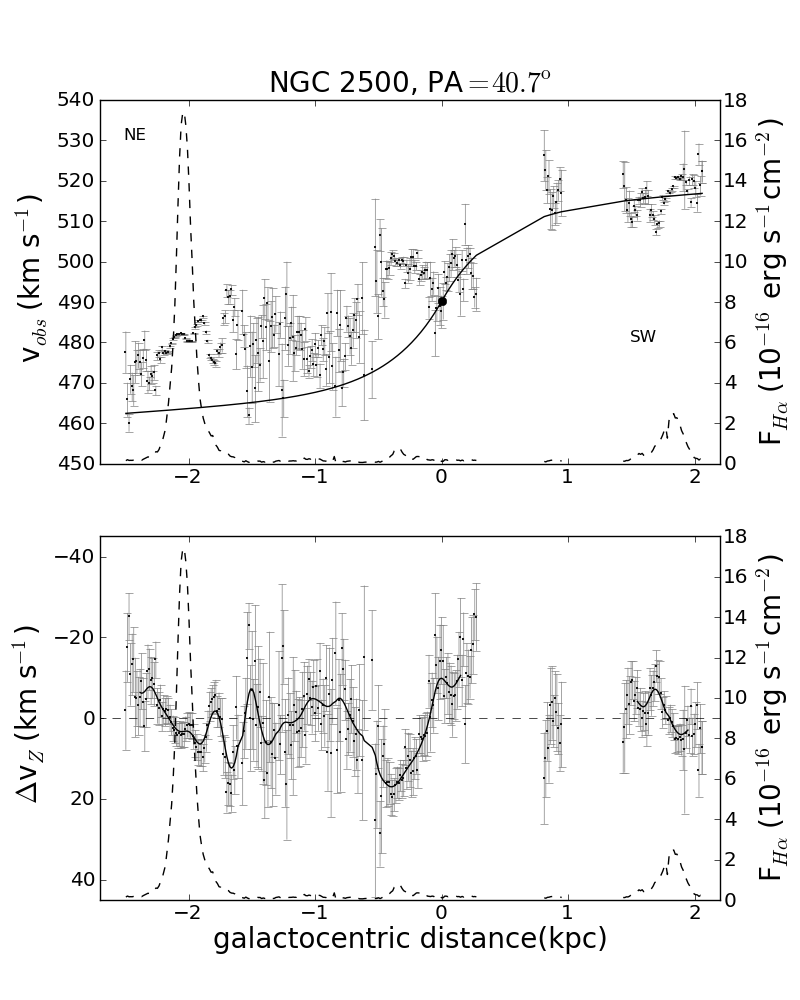
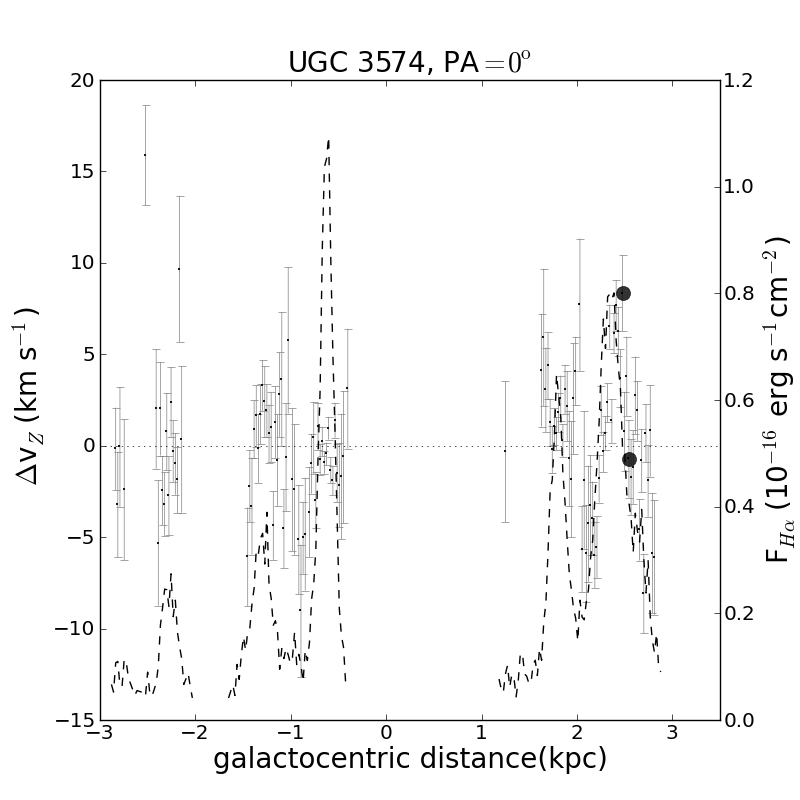
The same procedure is applied for the rest of the galaxies, although, for the sake of clarity, only the observed velocities (on the top panels) and the final detrended vertical velocities (on the bottom) are shown in Figures 4 and 5. In the next section we describe a more detailed analysis or description of the morphologies or patterns found from these plots for each galaxy.

5 Results
In this section we describe the deviations from the main rotation observed, , which we interpret as perpendicular motions of the ionized gas from the galactic disk, or corrugations. The aim is to show the existence of such corrugations in galaxies, as well as giving a description of its morphologies or patterns. We found the maxima and minima values of are usually related with H emission line peaks, and with the morphology of the galaxy. Its interpretation is still an open matter of discussion.
For NGC 278 and NGC 1058 a wavelike structure of , along the whole slit, is clearer than for the other two galaxies. In NGC 2500 and UGC 3574 there are some regions with no H emission or too faint to be fitted, and consequently there is no associated with these regions. This last feature is more remarkable in UGC 3574, the most distant galaxy of the sample, losing therefore a global view of the vertical velocity deviations with respect to the H emission (Figure 5).
In a previous study for the corrugated velocities in NGC 5427, Alfaro et al. (2001) found a systematic spatial shift between the velocity peaks, , and the emission line intensity peaks of H; where the approaching (negative values) peaks of occur in the convex border of the arms, and the receding (positive values) maxima are located behind the H emission maxima, in the concave side. This kinematical behaviour is interpreted as the response of the gas flow into a spiral density wave in a thick and magnetized gaseous disk, described by the Martos & Cox (1998) and Martos et al. (1999) galactic bore models.
For each slit in all galaxies, we find some of these features of the variation of the vertical motions when the slit passes through spiral arms, but with a varied phenomenology.
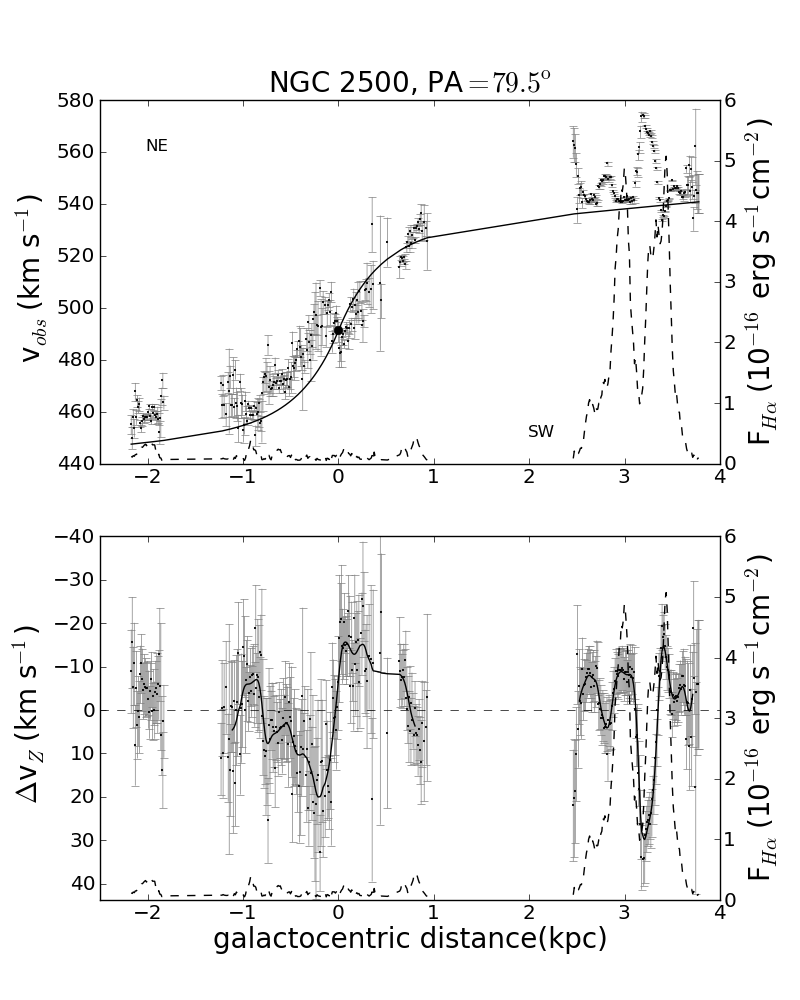
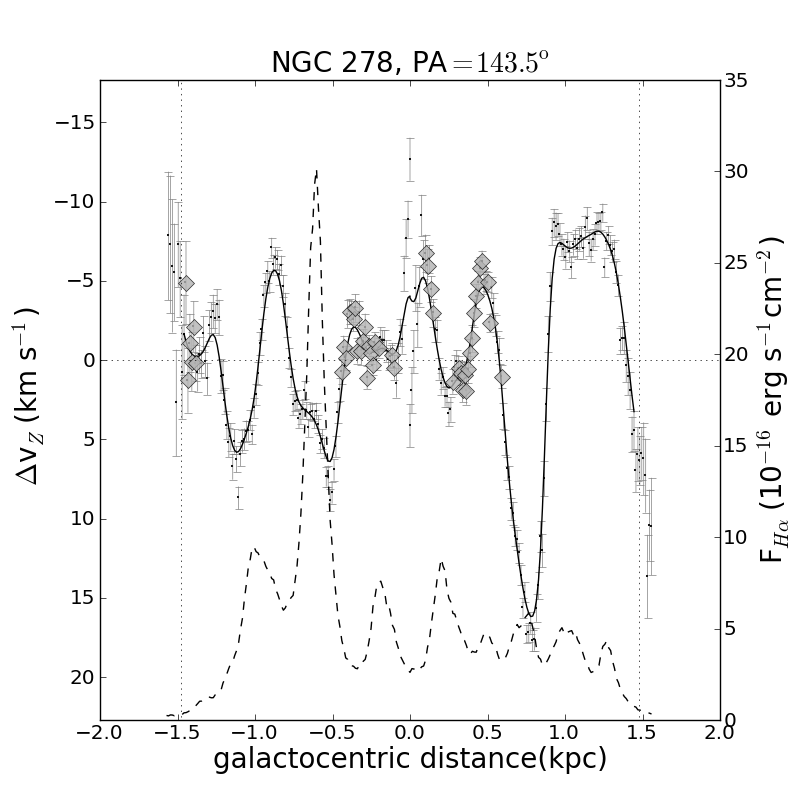
In NGC 278, the behaviour described by (Alfaro et al., 2001) is clearly observed for the slit PA = 40.5∘, between galactocentric distances and kpc, with km s-1 (Figure 6). This feature is in the concave side of the spiral arm, since it is located within the corotation radius ( kpc, Buta & Zhang 2009). The gas reaches the density wave behind the spiral arm border -or concave side-, so the approaching (negative values) peak in occurs behind the H emission maxima, or the corresponding spiral arm, when the gas is flowing up to higher galactic latitudes above the arm. Then it falls down onto the galactic plane, which corresponds to the receding maxima (positive values) in that appear ahead of the arm.
This phenomenon is also observable, although for fainter H emission maxima, and close to the corotation radius, between galactocentric distances and kpc, with high vertical km s-1, and around kpc with km s-1.
Another interpretation for the approaching and receding peaks in could be the deceleration and acceleration with respect to the rotation velocity. If this were the case, the observed velocities would be represented by . If the vertical motions were neglected, the associated variation in the observed velocities of km s-1 cannot be explained by the difference between the rotation velocities.
An even more outstanding example is found for the slit PA = 143.5∘, the minor axis. The most important peak in this case shows a variation in the observed velocities between galactocentric distances 0.5 and 0.8 kpc. A km s-1 cannot be explained by the difference between the rotation velocities km s-1. On the other hand, if the were not considered and with a projection factor of , for a of km s-1 a difference for the rotation velocity of the order of 2400 km s-1 would be required. This would imply a velocity radial gradient km s-1/kpc, which makes no sense in a galactic disk and radial distances of 300 pc.
With our data and resolution we cannot discern if this is the case of a bubble in expansion or a merger, as the process that would explain such behaviour in . Moreover, this feature at PA is found as the largest vertical displacement, whereas it does not seem to be related with a significant H emission peak. However, we cannot claim that it is not related with a spiral arm, since the weakness of H emission does not determine the presence of a spiral arm.
At slit PA, between and kpc (close to corotation), we can identify a double peak associated with H emission peaks. So its interpretation in the framework of Alfaro et al. (2001) is not clear. Although this is a quite plausible model, with the current data, we cannot discard other mechanisms as the origin or contributing to the enhancement of the corrugations in the velocity field.
Similar patterns can be observed in the rest of the galaxies. In some locations, it is possible to discern similar behaviour to that expected from a galactic bore. For many others, the mechanism behind it is not clear. However, the changes in are still clearly seen, as it crosses a spiral arm (as identified by the H peaks), from the receding to the approaching side, or vice versa. So these changes in are definitely related to the spiral arms.
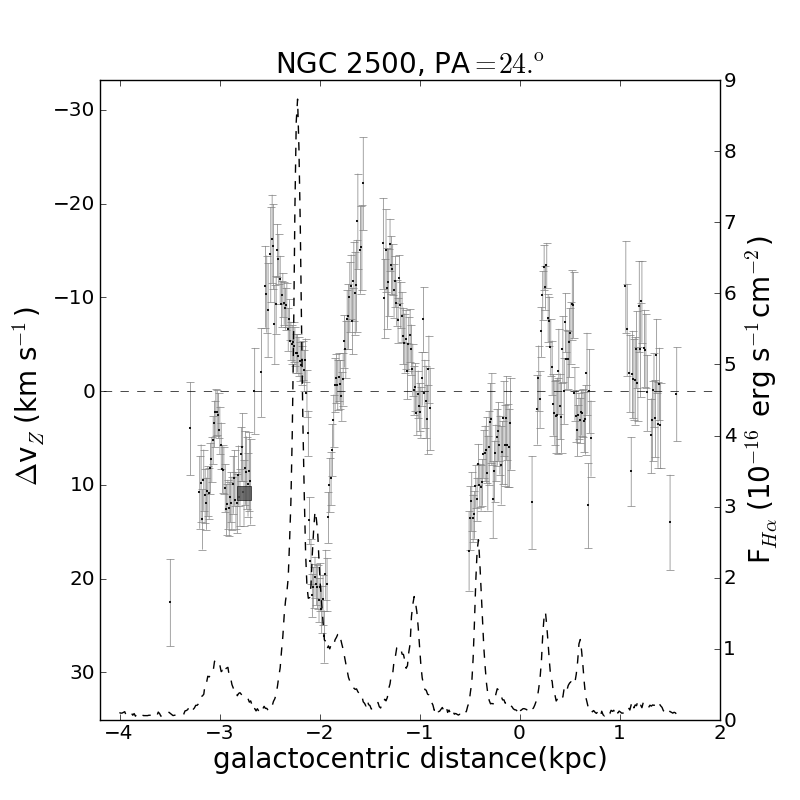
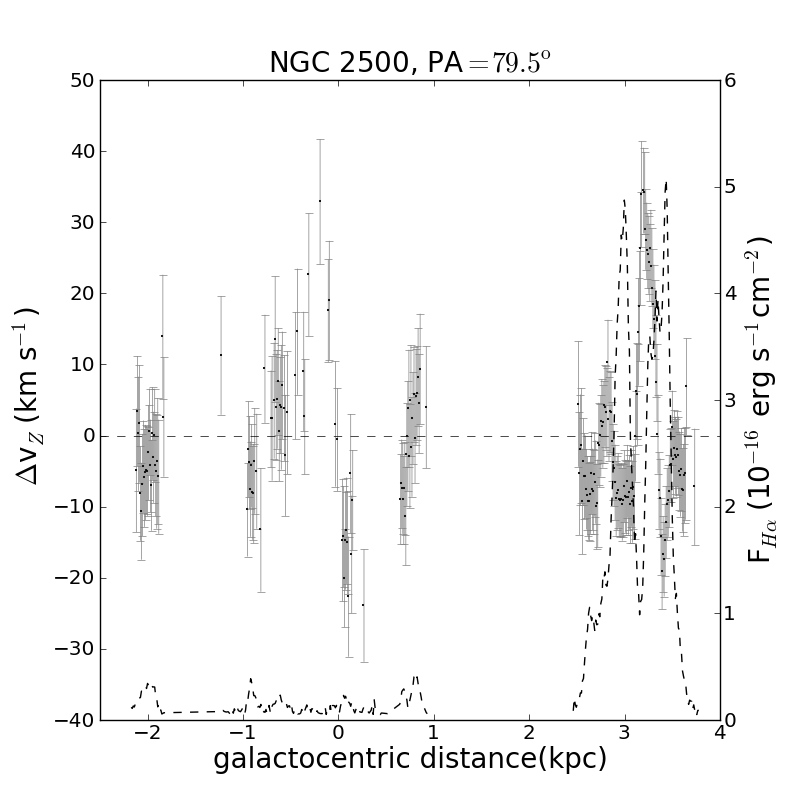
Some examples of such patterns are found, for example in NGC 2500, between and kpc at PA, goes from to km s-1. Again, just after the spiral arm, the gas flows up to nearly km s-1. At PA, in the central part of the slit, are more pronounced but they are also noisier due to the faint H. The stronger H emission peaks are at the ends of the slit, where we can observe the pattern described above, around and kpc, respectively. At PA, close to the minor axis, this is observed between and kpc, where the gas flows up from to km s-1. Between the two arms there is a similar change in from to km s-1. As in the previous PA, there is a weaker and noisier zone between and kpc, but the corrugations are still observable.
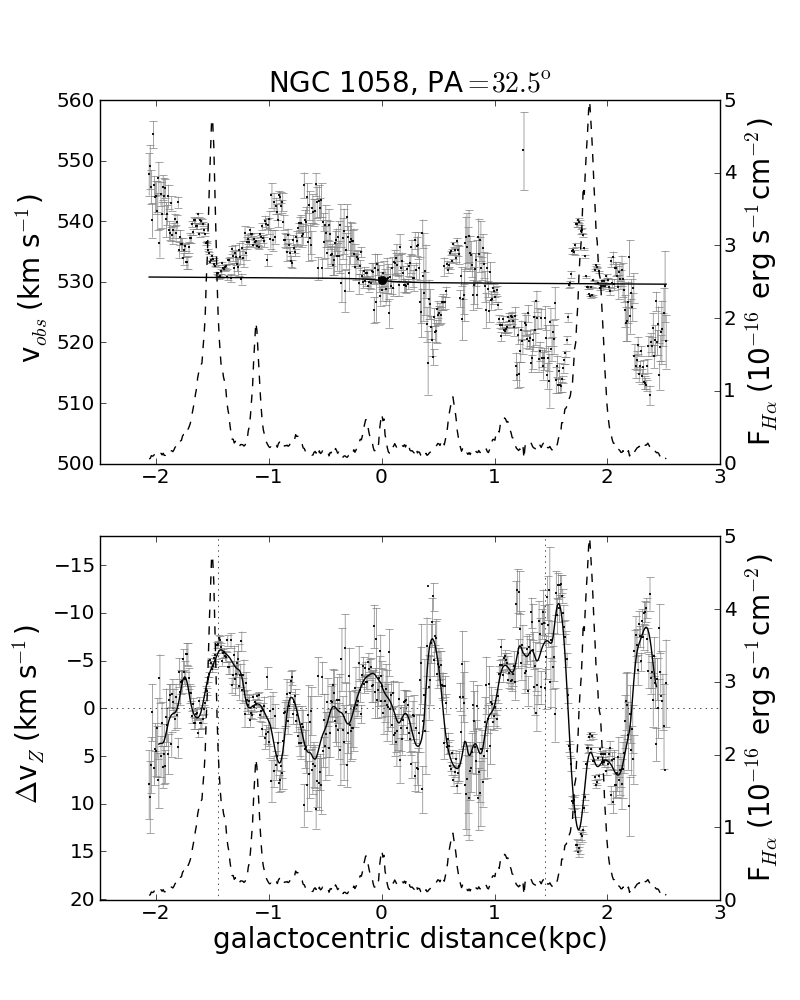
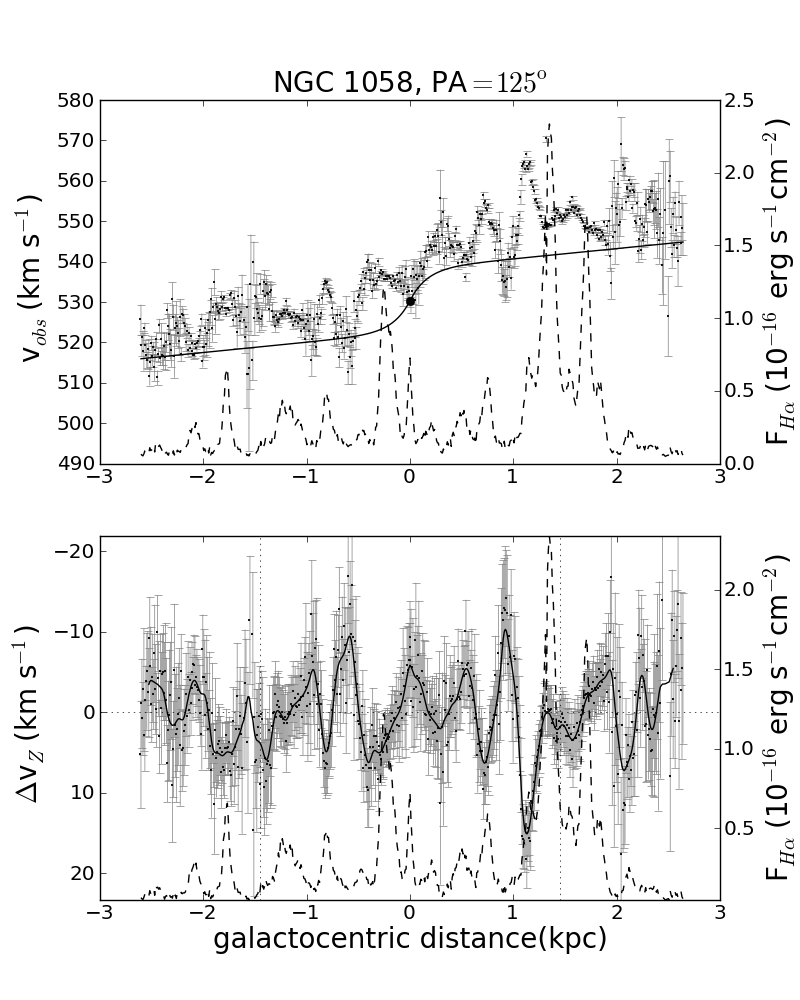
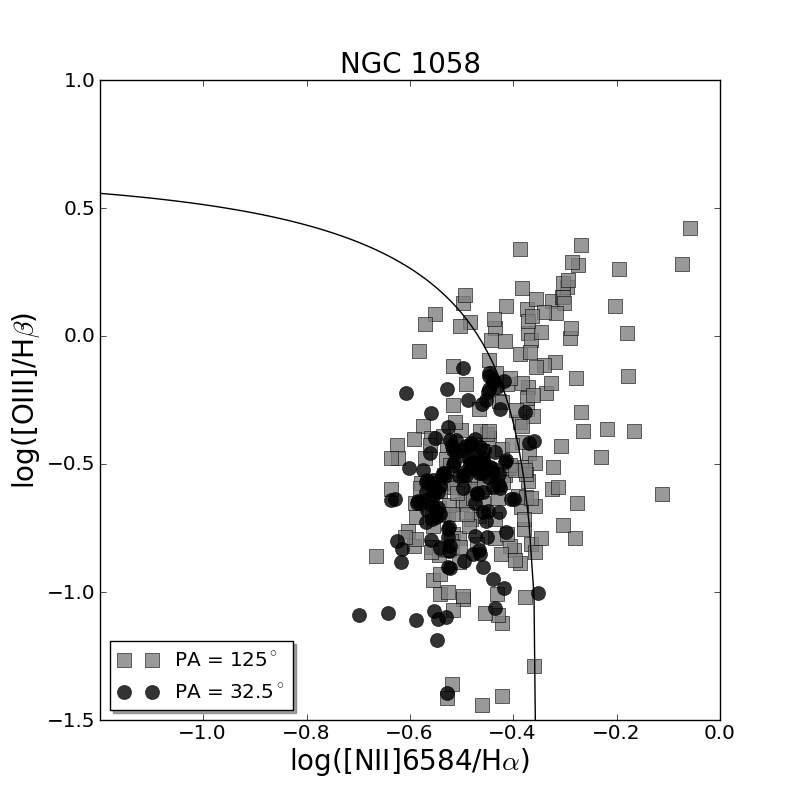
In NGC 1058, for PA and around the corotation radius at kpc, there is another example of across the spiral arm. In the opposite side of the slit, between and kpc, just before the spiral arm there is an important change of to km s-1. Another example of the pattern we are describing as similar to a galactic bore is found at PA, between and kpc, just before the arm (around kpc) where there is a large vertical deviation. At this PA the H emission is bright enough that peaks have been measured continuously, and so corrugations are more noticeable.
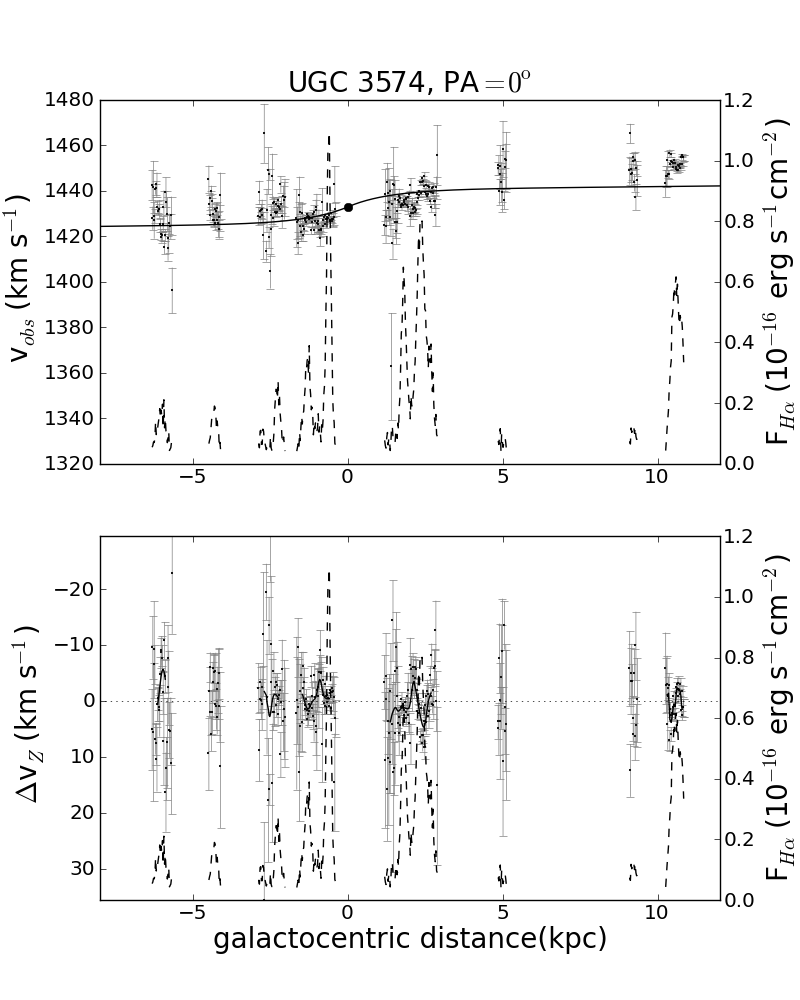
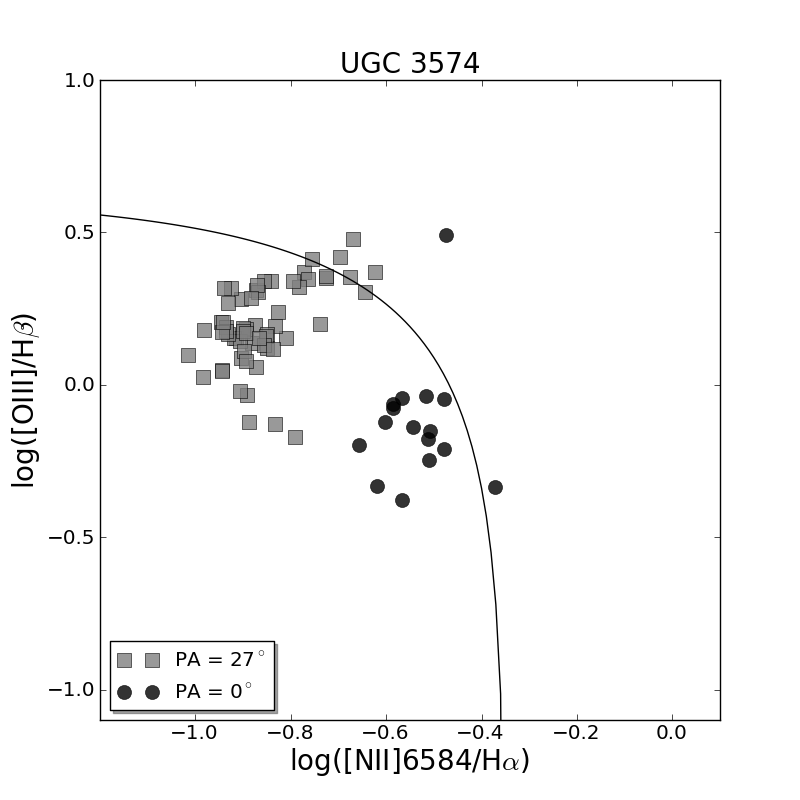
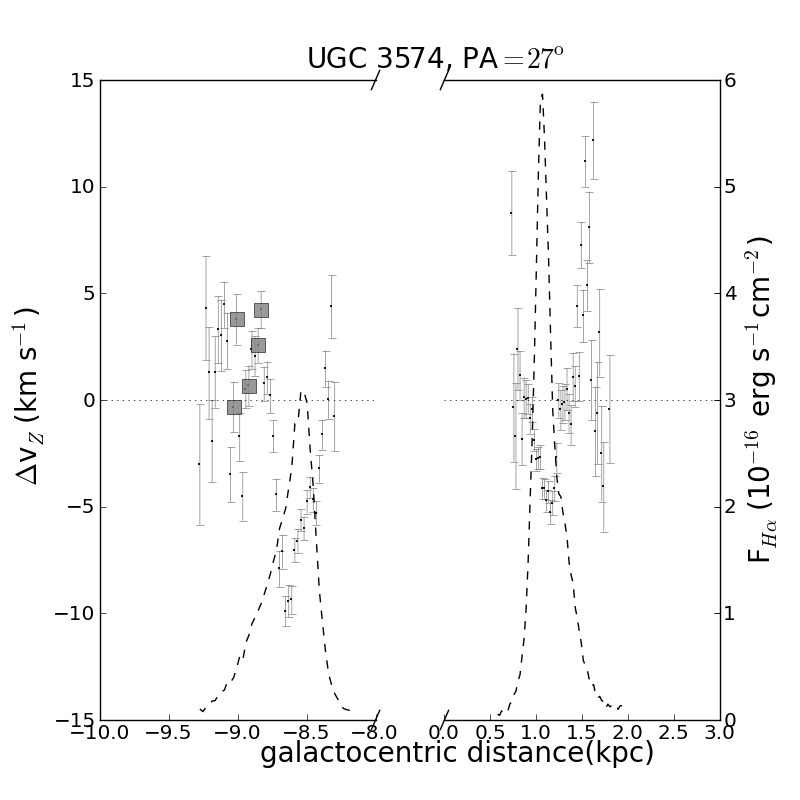
UGC 3574 is the farthest galaxy of the sample, therefore the H emission is fainter and more difficult to measure along the slit (Figure 5). Nevertheless, the vertical velocity deviations are appreciable and these seem to be linked to the spiral arms. At PA, between to kpc and to kpc we can see how the changes across the spiral arms.
In summary, we found in some cases that it is easy to see how changes across the arm, quite similar to the pattern described by Alfaro et al. (2001), and it could be explained by galactic bore models. But in many other cases, changes are shifted, or they become wider, or lengthened beyond the arm. That is, there are other features where the expected pattern for this model is not so clear or is not observed. In some cases, an important vertical displacement does not seem to be related with an H emission peak, as for example the feature described above at PA in NGC 278 or between and kpc at PA in NGC 2500.
5.1 Comparison between Observations and Models
Our analysis establishes the existence of a vertical velocity field that shows a sinusoidal structure associated mainly with the observed spiral arms. How can the generation of these structures be explained? Since the 1970s, different models have been proposed to explain the genesis of the spatial corrugations observed in our Galaxy and other external galaxies (see Alfaro & Efremov (1996) for a review of this topic to that date). But, regarding the variations of the vertical velocity field, the first article that took the possible corrugation of velocities into consideration was published by Alfaro et al. (2001), for the galaxy NGC 5427, in which the hydraulic bore mechanism (Martos & Cox, 1998; Gómez & Cox, 2004a, b) was proposed for the formation of the velocity field observed in the vicinity of the spiral arms. The choice of this model, for comparison with the observations of the velocity field of NGC 5427, was determined by it being the only model that predicted the expected velocity structure in the neighbourhood of spiral arms, and therefore the only one that made it possible to perform the comparison. Moreover, both the quantitative and qualitative aspects of the model fitted with the velocity field observed. The situation has not changed much over the last decade, and few models of the Galaxy, if any, incorporate corrugations into their description. Yet, what is the principal ingredient that makes the models proposed by the Wisconsin group (and successors) different to the rest? The answer is simple: the magnetic field. The majority of models prior to the one proposed by Martos & Cox (1998) are based on the interaction between different galactic subsystems (like discs and halos), and the impact of the disc with high-velocity clouds (whether HI or dark matter), and do not include the magnetic field in their physical fundamentals – with the exception of Santillán et al. (1999) on the impact with HVCs, and those on the Parker instability for the generation of super-clouds and corrugations in spiral arms (i.e. Franco et al., 2002). Should we include the magnetic field in the physical foundations of any model that tries to explain the observed corrugations? Our answer is yes, and there are two types of arguments that back this affirmation: a) there is a non-negligible magnetic field in our Galaxy (Planck Collaboration et al., 2015; Beck, 2015); and b) in the evolutionary models of the Galactic interstellar medium, the inclusion of the Galactic magnetic field is far from being irrelevant (Martos & Cox, 1998; Santillán et al., 1999; Gómez & Cox, 2004a, b).
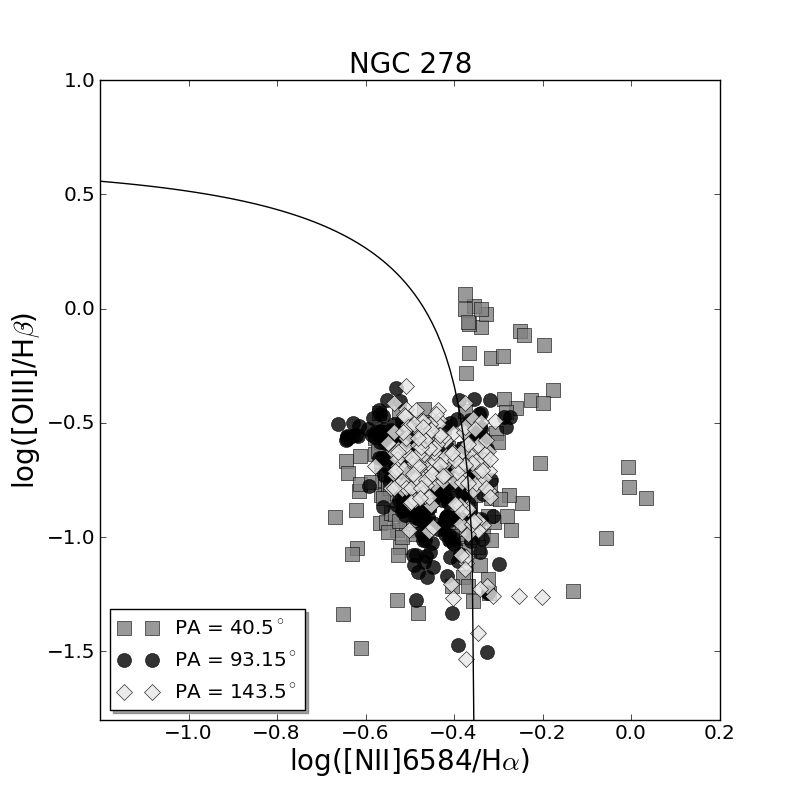
6 Diagnostic Diagrams
To complement the kinematic analysis, diagnostic diagrams (DD) are included to study the ionization structure in the observed features. As it is well known, the ionization and excitation process can be determined by plots of [NII]/H versus [OIII]/H, depending on its location in such diagrams (Baldwin, Phillips & Terlevich, 1981). These ratios are the best options among all the possible emission line ratios (Veilleux & Osterbrock, 1987), and therefore one of the most commonly and widely used DD.
Before plotting the DD, the flux ratios are corrected for reddening following the relation
| (9) |
where is the unreddened emission at a certain wavelength from the source, and is the observed flux, affected by dust absorption. is the extinction factor at a particular waveband , and and are the extinction curve and the absorption in the V band, respectively. The Balmer decrement is a method for reddening correction, deduced from the comparison of the observed H to H flux ratio with the theoretical value of (Osterbrock, 1989), based on case B recombination. Applying the Balmer decrement we have that,
| (10) |
So, the unreddened flux ratios can be obtained as
| (11) | |||||
where , and .
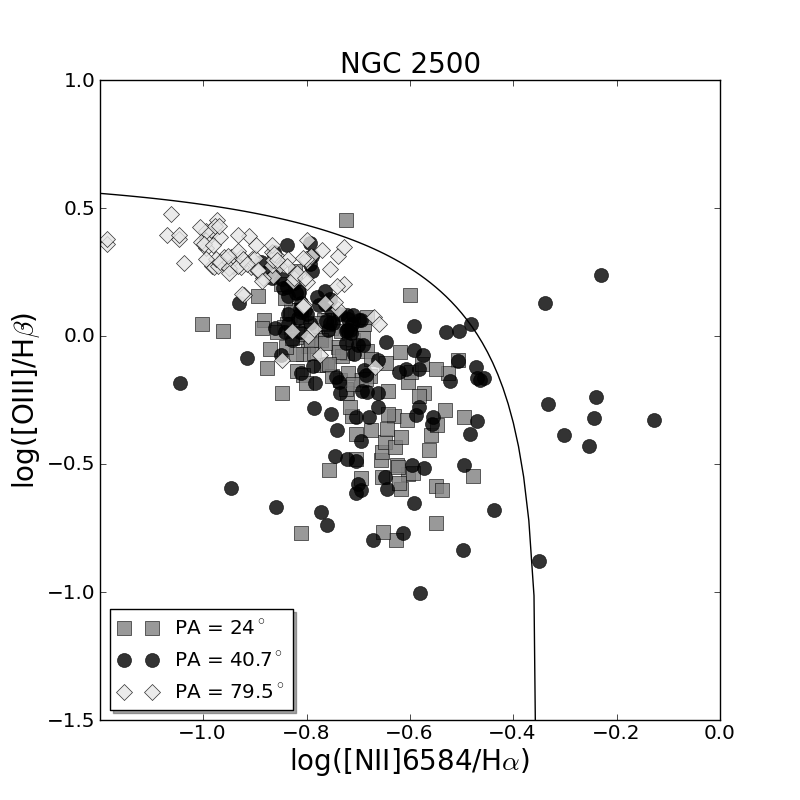
The DD for each galaxy are found in Figures 6 to 9, together with the plots of . Plotted individually, they have a better resolution than the above plots of in Figures 35. To include more robust information, only those pixels with less than the mean of the errors are plotted. So they clearly show the relationship between the velocity and the H emission line flux peaks.
The different slit position angles for each galaxy are represented with different symbols and grey colour scale, as indicated in the figures. The locations where the DD ratios are above the reference line for photoionization by young stars are shown in the panels with the kinematics. This could provide some clues as to whether the ionization mechanism is related to the presence of corrugations and the encounter of the density wave with a spiral arm. Within the galactic bore model framework (Martos & Cox, 1998; Martos et al., 1999), we would expect the presence of shocks at these locations.
No concluding results are obtained from the DD, which show that photoionization by young massive stars seems to be the main ionization mechanism in most locations.
There is only a small portion of the gas that appears to be ionized by low-velocity shocks. In NGC 278 and in NGC 1058, at PA, this portion is more important. In NGC 278, for example, these low-velocity shocks would be located in the innermost central kpc, coinciding with the minor merger found by Knapen et al. (2004).
Moreover, two different forms of behaviour appear in the [NII]/H vs. [OIII]/H diagnostic diagrams. NGC 278 and NGC 1058 have most of their pixels, for the three slit positions, concentrated at the same location in the DD, whereas for NGC 2500 and UGC 3574 different slit positions occupy a different location in the DD, nearly covering the theoretical curve separating the different ionization mechanisms. This behaviour may be related to a metallicity gradient, but a more detailed study, beyond the scope of this paper, would be needed.
In summary, although the association between the gas ionization mechanisms and kinematic properties do not offer a conclusive pattern, some general characteristics are observed: a) most of the gas is ionized by high-energy photons; and b) in NGC 278 and NGC 1058 there is a not negligible number of points whose diagnostic diagram suggests ionization through low-velocity shocks. In NGC 278 these shocks seem particularly limited to the central region where some authors have observed signs of an inner merger (Knapen et al., 2004). Otherwise, we note the potential to explore this idea further with the integral field spectroscopic data sets that are becoming available, such as from the surveys CALIFA (Sánchez et al., 2012; García-Benito et al., 2015), MaNGA (Bundy et al., 2015), and SAMI (Croom, 2012), and with much better resolution from data already becoming available from the MUSE instrument at the VLT (Bacon et al., 2010).


7 Summary
In this work we extend the detection and study of kinematic corrugations, already reported in the literature (e.g. Alfaro et al., 2001), to a small sample of face on spirals.
The galaxies studied here show a similar behaviour to NGC 5427 (Alfaro et al., 2001) at some locations, with a clear displacement between the velocity and the emission line peaks, where the approaching peaks of occur in the convex side of the spiral arms, and the receding maxima are located behind the H flux maxima, in the concave side. This kinematical pattern is similar to the one expected in a galactic bore generated by the interaction of a spiral density wave with a thick magnetized gaseous disk.
In locations where peaks are found to be related to H emission maxima, a strong velocity gradient crossing the arm is sometimes observed, as seen in Figures 6 to 9, and described in Section 5.
This relation is not so clear in NGC 2500 and UGC 3574. However, in these galaxies the H emission is much fainter, and the H emission line could only be fitted in a limited number of points along the slit. This produces a bias, and no clear conclusions can be deduced for these two galaxies.
In NGC 278, at PA=143.5∘ there is a strong peak in a weak H emission zone. This could be associated with corotation or with a recent merger in the inner disk. We have checked that the stronger velocity peaks do not necessarily coincide with the stronger emission line intensity peaks.
From the analysis of the ionized emission line diagnostic diagrams, we conclude that photoionization by young stars is the main mechanism, and only a small portion of the gas appear to be ionized by alternative mechanisms, such as low velocity shocks. In this DD we see different behaviour for the two galaxies NGC 278 and NGC 1058 on one hand, and NGC 2500 and UGC 3574 on the other hand. The former have most of the pixels concentrated at the same location of the DD, whereas for the latter they are distributed covering more of the parameter space along the theoretical curve separating the different ionization mechanisms. This may be understood as a consequence of metallicity gradients, but further investigations are warranted.
The origin of kinematic corrugations is still a matter of debate. Corrugations are closely linked, as cause-effect, to the large scale star formation processes: density waves, tidal interactions, collisions of high velocity clouds with disk, or a galactic bore generated by the interaction of a spiral density wave with a thick gaseous disk, etc. Which mechanism is the origin of disk gas corrugations is still an open question.
acknowledgment
We are deeply grateful to the referee for constructive comments and valuable advice. We acknowledge financial support from the Spanish Ministry of Economy and Competitiveness through grants AYA2010-17631 and AYA2013-40611-P, and from the Consejería de Educación y Ciencia (Junta de Andalucía) through TIC-101, TIC-4075 and TIC-114.
References
- Alfaro, Cabrera-Cano, & Delgado (1992) Alfaro E. J., Cabrera-Cano J., Delgado A. J., 1992, ApJ, 399, 576
- Alfaro & Efremov (1996) Alfaro E. J., Efremov Y. N., 1996, RMxAC, 4, 1
- Alfaro et al. (2001) Alfaro E. J., Pérez E., González Delgado R. M., Martos M. A., Franco J., 2001, ApJ, 550, 253
- Alfaro et al. (2004) Alfaro, E. J., Pérez, E., & Franco, J. 2004, How Does the Galaxy Work?, 315,
- Alfaro & Elías (2006) Alfaro, E., & Elías, F. 2006, Lecture Notes and Essays in Astrophysics, vol. 2, p. 111-126., 2, 111
- Alfaro et al. (2007) Alfaro, E. J., García-Lorenzo, B., Efremov, Y. N., & Muñoz-Tuñón, C. 2007, Astrophysics and Cosmology After Gamow, 437
- Bacon et al. (2010) Bacon, R., Accardo, M., Adjali, L., et al. 2010, SPIE Conf. Ser., 7735, 8
- Baldwin, Phillips & Terlevich (1981) Baldwin, J. A., Phillips, M. M., & Terlevich, R. 1981, PASP, 93, 5
- Battinelli et al. (2000) Battinelli, P., Capuzzo-Dolcetta, R., Hodge, P. W., Vicari, A., & Wyder, T. K. 2000, A&A, 357, 437
- Beck (2015) Beck R., 2015, ASSL, 407, 507
- Böker et al. (2002) Böker, T., Laine, S., van der Marel, R. P., et al. 2002, AJ, 123, 1389
- Bundy et al. (2015) Bundy, K., Bershady, M.A., Law, D.R., et al. 2015, ApJ, 798, 7
- Bushouse et al. (1988) Bushouse, H. A., Werner, M. W., & Lamb, S. A. 1988, ApJ, 335, 74
- Buta & Zhang (2009) Buta, R. J., & Zhang, X. 2009, ApJS, 182, 559
- Croom (2012) Croom, S. M., Lawrence, J. S., Bland-Hawthorn, et al. 2012, MNRAS, 421, 872
- Dale et al. (2000) Dale, D. A., Silbermann, N. A., Helou, G., et al. 2000, AJ, 120, 583
- Djorgovski & Sosin (1989) Djorgovski, S., & Sosin, C. 1989, ApJL, 341, L13
- Epinat et al. (2008) Epinat, B., Amram, P., Marcelin, M., et al. 2008, MNRAS, 388, 500
- Epinat et al. (2008) Epinat, B., Amram, P., & Marcelin, M. 2008, MNRAS, 390, 466
- Eskridge et al. (2002) Eskridge, P. B., Frogel, J. A., Pogge, R. W., et al. 2002, ApJS, 143, 73
- Feitzinger & Spicker (1985) Feitzinger, J. V., & Spicker, J. 1985, The Milky Way Galaxy, 106, 175
- Feitzinger & Spicker (1985) Feitzinger, J. V., & Spicker, J. 1985, MNRAS, 214, 539
- Ferguson et al. (1995) Ferguson, A., Wyse, R., Gallagher, J., & Hunter, D. 1995, Stellar Populations, 164, 425
- Ferguson et al. (1998) Ferguson, A. M. N., Wyse, R. F. G., Gallagher, J. S., & Hunter, D. A. 1998, ApJL, 506, L19
- Florido et al. (1991) Florido, E., Battaner, E., Sanchez-Saavedra, M. L., Prieto, M., & Mediavilla, E. 1991, MNRAS, 251, 193
- Franco et al. (2002) Franco J., Kim J., Alfaro E. J., Hong S. S., 2002, ApJ, 570, 647
- García-Benito et al. (2015) García-Benito R., et al., 2015, A&A, 576, A135
- Giovanelli & Haynes (2002) Giovanelli, R., & Haynes, M. P. 2002, ApJL, 571, L107
- Gómez & Cox (2004a) Gómez G. C., Cox D. P., 2004, ApJ, 615, 758
- Gómez & Cox (2004b) Gómez G. C., Cox D. P., 2004, ApJ, 615, 744
- Gum et al. (1960) Gum, C. S., Kerr, F. J., & Westerhout, G. 1960, MNRAS, 121, 132
- Ho et al. (1995) Ho, L. C., Filippenko, A. V., & Sargent, W. L. 1995, ApJS, 98, 477
- Hodge (1967) Hodge, P. W. 1967, PASP, 79, 29
- Israel (2009) Israel, F. P. 2009, A&A, 506, 689
- James et al. (2004) James, P. A., Shane, N. S., Beckman, J. E., et al. 2004, A&A, 414, 23
- Kerr et al. (1957) Kerr, F. J., Hindman, J. V., & Carpenter, M. S. 1957, NAT, 180, 677
- Knapen et al. (2004) Knapen, J. H., Whyte, L. F., de Blok, W. J. G., & van der Hulst, J. M. 2004, A&A, 423, 481
- Larsen & Richtler (1999) Larsen, S. S., & Richtler, T. 1999, A&A, 345, 59
- Larsen et al. (2001) Larsen, S. S., Brodie, J. P., Elmegreen, B. G., Efremov, Y. N., Hodge, P. W., & Richtler, T. 2001, ApJ, 556, 801
- Lockman (1977) Lockman, F. J. 1977, AJ, 82, 408
- Malhotra & Rhoads (1995) Malhotra, S., & Rhoads, J. E. 1995, The Formation of the Milky Way, 87
- Malhotra et al. (2001) Malhotra, S., Kaufman, M. J., Hollenbach, D., et al. 2001, ApJ, 561, 766
- Martos & Cox (1998) Martos, M. A., & Cox, D. P. 1998, ApJ, 509, 703
- Martos et al. (1999) Martos, M., Allen, C., Franco, J., & Kurtz, S. 1999, ApJL, 526, L89
- Matthews & Uson (2008) Matthews, L. D., & Uson, J. M. 2008, ApJ, 688, 237
- Moustakas & Kennicutt (2006) Moustakas, J., & Kennicutt, R. C., Jr. 2006, ApJS, 164, 81
- Oke (1990) Oke, J. B. 1990, AJ, 99, 1621
- Osterbrock (1989) Osterbrock, D. E. 1989, Research supported by the University of California, John Simon Guggenheim Memorial Foundation, University of Minnesota, et al. Mill Valley, CA, University Science Books, 1989, 422 p.,
- Osterbrock, D. E. & G. Ferland (2006) Osterbrock, D. E. & G. Ferland. 2006. Astrophysics of Gaseous Nebulae and Active Galactic Nuclei, Science University Press.
- Petric & Rupen (2007) Petric, A. O., & Rupen, M. P. 2007, AJ, 134, 1952
- Pişmiş (1965) Pişmiş P., 1965, BOTT, 4, 8
- Planck Collaboration et al. (2015) Planck Collaboration, et al., 2015, A&A, 576, A104
- Quiroga (1977) Quiroga, R. J. 1977, APSS, 50, 281
- Rhoads (1995) Rhoads, J. E. 1995, The Formation of the Milky Way, 91
- Sánchez et al. (2012) Sánchez S. F., et al., 2012, A&A, 538, A8
- Sánchez et al. (2014) Sánchez, S.F., Rosales-Ortega, F., Iglesias-Páramo, J., et al. 2014, A&A, 563, 49
- Sandage & Bedke (1994) Sandage, A., & Bedke, J. 1994, The Carnegie Atlas of Galaxies. Volumes I, II., by Sandage, A.; Bedke, J.. Carnegie Institution of Washington Publ., No. 638,,
- Sandage & Tammann (1974) Sandage, A., & Tammann, G. A. 1974, ApJ, 194, 559
- Sanders (2003) Sanders, D. B. 2003, Journal of Korean Astronomical Society, 36, 149
- Santillán et al. (1999) Santillán A., Franco J., Martos M., Kim J., 1999, ApJ, 515, 657
- Spicker & Feitzinger (1986) Spicker, J., & Feitzinger, J. V. 1986, A&A, 163, 43
- Tzanavaris & Georgantopoulos (2007) Tzanavaris, P., & Georgantopoulos, I. 2007, A&A, 468, 129
- Vallee (1993) Vallee, J. P. 1993, MNRAS, 264, 665
- van Eymeren et al. (2011) van Eymeren, J., Jütte, E., Jog, C. J., Stein, Y., & Dettmar, R.-J. 2011, A&A, 530, A29
- de Vaucouleurs & de Vaucouleurs (1963) de Vaucouleurs, G., & de Vaucouleurs, A. 1963, ApJ, 137, 363
- Veilleux & Osterbrock (1987) Veilleux, S., & Osterbrock, D. E. 1987, ApJS, 63, 295
- Verschuur (1973) Verschuur G. L., 1973, A&A, 27, 407