Galaxy And Mass Assembly (GAMA): the wavelength dependence of galaxy structure versus redshift and luminosity
Abstract
We study how the sizes and radial profiles of galaxies vary with wavelength, by fitting Sérsic functions simultaneously to imaging in nine optical and near-infrared bands. To quantify the wavelength dependence of effective radius we use the ratio, , of measurements in two restframe bands. The dependence of Sérsic index on wavelength, , is computed correspondingly. Vulcani et al. (2014) have demonstrated that different galaxy populations present sharply contrasting behaviour in terms of and . Here we study the luminosity dependence of this result. We find that at higher luminosities, early-type galaxies display a more substantial decrease in effective radius with wavelength, whereas late-types present a more pronounced increase in Sérsic index. The structural contrast between types thus increases with luminosity.
By considering samples at different redshifts, we demonstrate that lower data quality reduces the apparent difference between the main galaxy populations. However, our conclusions remain robust to this effect.
We show that accounting for different redshift and luminosity selections partly reconciles the size variation measured by Vulcani et al. with the weaker trends found by other recent studies. Dividing galaxies by visual morphology confirms the behaviour inferred using morphological proxies, although the sample size is greatly reduced.
Finally, we demonstrate that varying dust opacity and disc inclination can account for features of the joint distribution of and for late-type galaxies. However, dust does not appear to explain the highest values of and . The bulge-disc nature of galaxies must also contribute to the wavelength-dependence of their structure.
keywords:
galaxies: general – galaxies: structure – galaxies: fundamental parameters – galaxies: formation1 Introduction
The assembly history of a galaxy is written in its stellar populations. Their colours (and spectral features) reflect the time and conditions of star formation, while their spatial (and kinematic) distributions provide insight into the structures in which the stars formed and their subsequent redistribution by mergers and secular processes. These observables are all coupled; studying the detailed relationships between them helps us identify typical scenarios and unusual cases. We can therefore hope to understand more about the developmental histories of galaxies and their internal components by studying the wavelength dependence of their spatial structure.
Galaxies can be split visually into two main morphological types: elliptical and spiral. The primary distinguishing feature is the presence of a disc component. Lenticular galaxies are commonly grouped with ellipticals, as early-types, although their disc-component suggests they are more closely related to spirals (van den Bergh, 1976). To complicate matters, even ellipticals sometimes appear to have a somewhat ‘disky’ appearance (Kormendy & Bender, 1996) or kinematics (Cappellari et al., 2011).
The radial luminosity profile of a galaxy, or its components, is often modelled by a Sérsic profile. This function provides a good description of how the surface brightness of many galaxies varies with radius (Sérsic, 1963; Graham & Driver, 2005).
Elliptical galaxies are typically well-described by a single Sérsic profile. The index is often taken to be fixed at (de Vaucouleurs, 1948), although it has been shown to vary from at low masses to for high mass ellipticals (Hodge, 1971; Caon, Capaccioli & D’Onofrio, 1993; Graham, 2013).
Spiral galaxies, on the other hand, generally require a combination of two different Sérsic profiles. The discs of spirals (and lenticulars) can usually be accurately described by an exponential () profile (e.g., Kormendy 1977, Allen et al. 2006). Bulges are often described by a de Vaucouleurs () profile. As with elliptical galaxies, this is usually not accurate (Andredakis, Peletier & Balcells, 1995; Graham & Prieto, 2001; de Souza, Gadotti & dos Anjos, 2004), so recent studies (including this one) tend to adopt a general Sérsic profile, where is not fixed. Some studies also account for the presence of a bar, commonly with a third Sérsic profile (Gadotti, 2011).
Ideally we would be able to decompose galaxies into all their constituent structures. However, with limited physical resolution and signal-to-noise, even bulge-disc decompositions can prove difficult to perform robustly. Although many galaxies comprise multiple components, fitting with a single Sérsic profile can provide valuable insights into their structure, providing sizes, axial ratios, rough morphological classifications and total photometry (e.g., Kelvin et al. 2012).
Fitting Sérsic models to galaxy images in different wavebands allows one to explore the dependence of galaxy structure on wavelength for large samples in a homogeneous manner. Variation in a galaxy’s surface brightness profile parameters with wavelength is qualitatively equivalent to a radial trend in the colour of the galaxy. Such ‘colour gradients’ have been well-studied, usually by measuring the surface brightness in a series of elliptical annuli. This approach is usually limited by the seeing, and hence confined to relatively extended objects. The result is a colour profile for the galaxy, usually summarised as the overall change in colour over some (logarithmic) radial range (e.g., Goudfrooij et al. 1994; deJong 1996; Saglia et al. 2000; den Brok et al. 2011).
The wavelength-dependence of Sérsic model parameters provides an alternative description. This is less detailed than a full colour profile, though more robustly determined in typical survey imaging. In addition, as the PSF can be easily accounted for when fitting the model, the results are not biased by seeing.
Considering the wavelength-dependence of Sérsic parameters is more efficient than dealing with empirical colour profiles, while providing significantly more general information than quoting a colour gradient over a single (or several) radial ranges. Furthermore, the ubiquity of the Sérsic profile in describing galaxy profiles, and the correlations between its parameters and other galaxy properties, suggests that the profile and its parameters have a physical significance. Expressing colour gradients in terms of the wavelength-dependence of effective (half-light) radius and Sérsic index naturally separates the proportions associated with changes in size and profile shape, which may have different physical drivers. However, the price of all this is the assumption of a particular functional form for the surface brightness profile. When this assumption is inappropriate (e.g., in merging galaxies, multi-component systems or potentially very high redshift), it may result in biases or misinterpretations.
Some studies have chosen a compromise between performing a parametric fit and directly measuring a colour profile. La Barbera & de Carvalho (2009) fit independent Sérsic models in various wavebands and then use elliptical annuli to measure colour profiles and gradients on the model images. This removes the effect of the PSF and reduces noise in the measurements.
Several groups have examined the trends of Sérsic model parameters with wavelength. For a sample of bright elliptical galaxies, La Barbera et al. (2010b) find that the mean effective radius decreases significantly with increasing wavelength from to , but that there is little variation in Sérsic index. Kelvin et al. (2012) find similar behaviour in data from the Galaxy And Mass Assembly survey (GAMA; Liske et al. 2015). They also consider late-types, finding a substantial increase in Sérsic index, and decrease in effective radius, across the same wavelength range. Metallicity gradients and dust attenuation are proposed as reasons for these trends.
Lange et al. (2015) have recently extended the work of Kelvin et al. (2012), replacing the GAMA infrared UKIDSS LAS imaging (Lawrence et al., 2007) with deeper VISTA-VIKING data (Edge et al., 2013). They also separate the galaxy population into early- and late-types using a variety of dividers, including visual classification. Lange et al. find that their results are not sensitive to chosen divider, but show that the bimodality of galaxy structure becomes less distinct at lower stellar masses. They confirm that galaxies appear more compact at redder wavelengths, although this appears less dramatic than in the previously mentioned studies. Lange et al. argue that these structural variations with wavelength may arise from the two-component nature of many galaxies, in which the bulge is observed in the redder wavebands whilst the disc is observed in the bluer wavebands (also see Driver et al. 2007a). However, they do not examine the dependence of Sérsic index on waveband.
The above studies fit the image in each filter-band independently. This model freedom can be seen as an advantage. However, such an approach does not utilise the expected strong correlations between structural parameters at neighbouring wavelengths. In data with low signal-to-noise or poor resolution, using these physical expectations can improve the reliability and precision of structural measurements. Furthermore, even in high-quality data, utilising available colour information can improve the performance of decompositions. To address these issues, the MegaMorph project (Bamford et al., 2012) has developed a technique which fits a single, wavelength-dependent model simultaneously to a set of imaging in different filter-bands. These developments have been implemented in an extended version of galfit (Peng et al., 2002, 2010) named galfitm (Häußler et al. 2013, hereafter H13; Vika et al. 2013, 2014). galapagos (Barden et al., 2012), a software package dedicated to running galfit on large surveys, has been similarly extended to become galapagos-2, which uses galfitm (H13).
Using MegaMorph multi-band techniques to perform single-Sérsic fits, Vulcani et al. (2014, hereafter V14) studied the wavelength dependence of galaxy effective radius and Sérsic index. They confirmed the trends described above, and demonstrated that galaxies with contrasting total colours and Sérsic indices display strikingly different behaviour in terms of the wavelength dependence of their effective radii and Sérsic indices.
V14 speculate that the behaviour seen for early-types may result from the superposition of red compact structures and more-extended, bluer structures, all of which possess the profile of systems supported by random motions. This is similar to the picture presented by Huang et al. (2013). The behaviour of late-types is attributed to their two-component nature, as mentioned above.
In this paper we aim to gain a greater confidence in, and deeper understanding of, the trends of galaxy structural parameters with wavelength as measured by the various studies described above. This work will advise our application of multi-band structural fitting to the full set of high-quality imaging currently being assembled by GAMA, and our subsequent analysis. We build on the results of V14, first ensuring they are robust to redshift effects.
For the first time, we examine the wavelength-dependence of galaxy structure as a function of luminosity. We also show that the measured trends persist for selections based on visually classifed morphology, rather than morphological proxies. Next, we investigate the role of dust in driving the wavelength dependence of late-type galaxy structure. We conclude by discussing the various potential factors responsible for the variation of galaxy structural parameters with wavelength. By taking the novel approach of considering the joint wavelength dependence of Sérsic index and effective radius, we can begin to decouple the relationships between concentration, size and colour.
The analysis has been carried out using a cosmology with ( and AB magnitudes.
2 Data
2.1 Parent sample and structural parameters
The galaxy measurements used in this paper have previously been presented in H13, and a subsample of these were studied in V14. A detailed description of the selection criteria, robustness of fits and properties of the sample can be found in those papers; here, we only give a brief overview.
Our data is taken from the extended Galaxy And Mass Assembly survey (GAMA II) (Liske et al, submitted), which is the largest homogeneous, multi-wavelength dataset currently available for the low-redshift Universe. The imaging data GAMA has assembled, from both SDSS (York et al. 2000) and UKIDSS (Lawrence et al. 2007), provides a consistent set of pixel-registered multi-wavelength data, covering the () optical bands and the () near-infrared (NIR) bands, respectively (Hill et al., 2011). It has been demonstrated that these data have sufficient depth and resolution to allow Sérsic profiles to be fit to large samples (Kelvin et al. 2012; H13).
As in V14, the data we use in this paper are limited to the G09 region of GAMA. We therefore only utilise approximately one-fifth of the area covered by GAMA II. For efficiency, we chose to focus on a single region for our initial exploration of multi-band fitting techniques with GAMA. The application of MegaMorph methods to the full GAMA dataset, with UKIDSS-LAS replaced by VISTA-VIKING data, are ongoing.
We use galapagos-2 with galfitm to fit a single wavelength-dependent 2D model to all images of a galaxy simultaneously. galfitm allows each parameter in the standard Sérsic light profile to vary as a function of wavelength; the user may choose the degree of smoothness they require. In this work, galaxy magnitudes are allowed to vary freely, while Sérsic index and effective radius are modelled as quadratic functions of wavelength. All other parameters are not permitted to vary with wavelength. galfitm accounts for seeing by convolving the model with a PSF before comparing to the data. We utilise the PSFs produced by Kelvin et al. (2012).
Restframe values of Sérsic index and effective radius for each wavelength have been obtained from the polynomials returned by galfitm. For the magnitudes, k-corrections have been performed using InterRest (Taylor et al. 2009).
2.2 Sample selection
We take the galapagos-2 output catalogue, however not every fit was necessarily accurate or meaningful, so a number of cleaning criteria were applied to eliminate galaxies for which the fit has violated our criteria in one or more bands. These criteria are identical to those used in H13 and V14, with the exception of Sérsic index which is limited to . We have reduced the upper limit on Sérsic index to avoid including suspected poor fits, with final parameters close to the fitting constraint (objects with very high are typically poor fits, often to point sources, and are therefore removed).
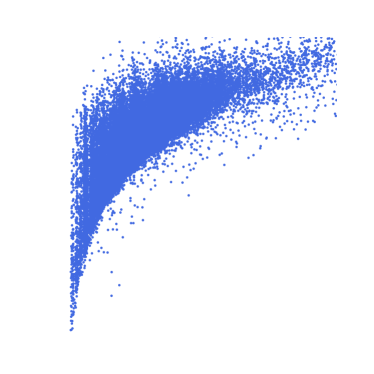
In this paper we use two different volume-limited samples to avoid selection effects, which are illustrated in Fig. 1. For studying variation in galaxy properties with redshift, a first volume-limited sample of 13,871 galaxies is taken with , , in line with V14. Within this redshift limit the restframe -band can be interpolated from measurements in the observed – wavelength range.
For studying variation in galaxy properties with absolute magnitude, , a second volume-limited sample (, ) of 5331 galaxies is used, allowing galaxies to be considered over a wider range of absolute magnitude.
Note that the cleaning described above removes only 0.42 / 0.39 per cent of our V14 / low-redshift samples.
One of the aims of this project is to study how galaxy properties vary as a function of wavelength. It is expected that different types of galaxies will behave in different ways, so we subdivide our sample (as in V14) by both colour and Sérsic index. The number of galaxies in each subsample are given in Tables 1 & 2 for both volume-limited samples, after basic cleaning has been applied.
| Colour | no. | % | no. | % | |
|---|---|---|---|---|---|
| Blue: | 1380 | 9.9 | 322 | 2.3 | |
| Green: | 3311 | 23.9 | 1047 | 7.5 | |
| Red: | 2523 | 18.2 | 5288 | 38.1 | |
| Colour | no. | % | no. | % | |
|---|---|---|---|---|---|
| Blue: | 1323 | 24.8 | 134 | 2.5 | |
| Green: | 1417 | 26.6 | 245 | 4.6 | |
| Red: | 994 | 18.6 | 1218 | 22.8 | |
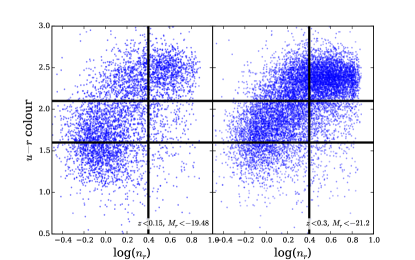
Initially the samples are divided into ‘red’ and ‘blue’ at . We also want to separate the bluest galaxies, which may contain starbursts, so we further divide this ‘blue’ sample at into ‘green’ and ‘blue’. Note that our ‘green’ sample corresponds to the main population of star-forming galaxies, not the green valley. We have confirmed that altering these colour cuts does not affect our results. The galaxy sample is also split by Sérsic index, in an attempt to separate discy galaxies from ellipticals, at . These divisions can be seen in Fig. 2.
3 Results
V14 examined the variation of and with wavelength in order to reveal trends of internal structure, and therefore formation history, for galaxies in different subsamples. For consistency we continue to use the notation and , which express the variation for a given waveband, , versus that in the -band. For simplicity, we will only consider the ratio of -band to -band in this paper, as V14 shows that there is a consistent trend with wavelength and this pair has the longest robust wavelength baseline. We omit the band labels from and when discussing their general behaviour.
If we convert our and trends to colour gradients we find good agreement with previous work, e.g. , high- galaxies show identical colour gradients to the passive, ‘early-type’ sample studied in La Barbera et al. (2010a). We also see the same behaviour of colour gradient with luminosity. However, here we focus on and , which allows us to decouple variations in concentration and size with wavelength, which are combined in a measurement of colour gradient alone.
V14 concluded that, regardless of overall colour, low- galaxies display a very different behaviour to high- galaxies, implying that both and depend strongly on Sérsic index. They suggested that low- discy (two-component) galaxies show a large change in Sérsic index with wavelength because in bluer wavebands the Sérsic index of the disc is being measured, whereas in redder wavebands the Sérsic index of the bulge dominates. High- galaxies are, on the other hand, likely to be bulge-dominated (closer to one-component), so there is little change in Sérsic index with wavelength. There is, however, a large change in with wavelength for high- galaxies, which indicates that elliptical galaxies contain a number of different pressure-supported stellar populations with different extent, possibly resulting from multiple merging events throughout a galaxy’s lifetime.
3.1 Redshift effects on galaxy structure
The sample used in V14 extends to , , so much of the sample is faint and of small angular size. This selection was partly chosen to demonstrate the power of multi-band fitting in this challenging regime. V14 showed that the measured and correspond to differences in the visual appearance of the galaxies. However, before exploring the luminosity dependence of these trends, we will further test the resilience of our and measurements versus redshift.
We split our bright volume-limited sample (, ) into three redshift bins: , and . These bins were chosen to span the redshift range of our volume-limited sample, while ensuring a similar number of galaxies in each bin to permit meaningful comparisons (see Table 1). In Fig. 3 we show the wavelength dependence of effective radius, for galaxies split by colour, , and redshift. Galaxies of all colours and Sérsic indices are typically found to have , indicating they are smaller at redder wavelengths, while (i.e. ) corresponds to no variation in size with wavelength. Here, does not appear to change substantially with redshift in any subsample. Kolmogorov–Smirnov (KS) tests do indicate some significant differences between the distributions in the different redshift samples. However, these differences are generally small, particularly in comparison with the width of each distribution and the offsets between the low- and high- subsamples. To determine whether an offset between subsamples can be considered ‘large’ or ‘small’ we sum the standard deviations of the widest and narrowest distributions in quadrature. We then find the difference in the median value of in the highest and lowest redshift bins, as a fraction of the summed standard deviation. Here, there average offset is 15.5% of the distribution widths, which can be considered small.
What trends are present, indicate that at lower redshift (higher S/N and better resolution) we measure closer to unity for low- galaxies. The departure of from unity may therefore be slightly overestimated in V14. High- systems appear unaffected, with perhaps the exception of blue, high- galaxies. There are, however, very few galaxies in this subsample as blue spheroids are uncommon. We therefore consider our measurements of the wavelength dependence of effective radius to be robust out to .
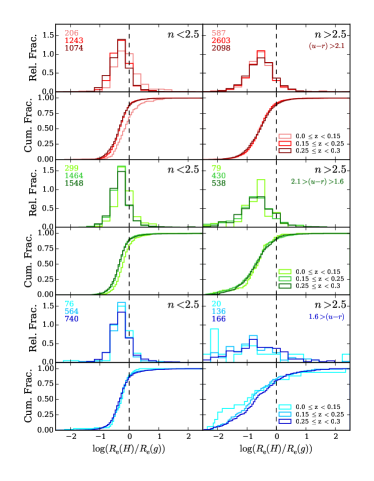
We study in the same manner. In Fig. 4 we show the wavelength dependence of Sérsic index for galaxies split by colour, , and redshift bin. Again, some small trends are visible. Galaxies at lower- tend to display further from unity. This is most significant for low- galaxies, and suggests that V14 may slightly underestimate the wavelength dependence of for these systems. Apart from this small effect (approx. 18.5% offset in median values compared to the width of the distributions, as described previously), we consider our measurements of the wavelength dependence of Sérsic index to be robust out to .
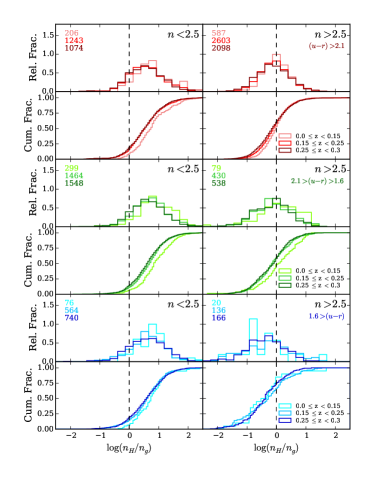
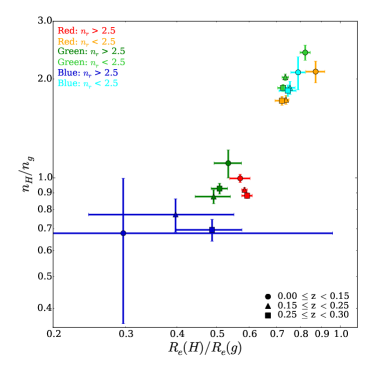
As in Fig. 17 of V14, we summarise the relationship between and for our three redshift bins in Fig. 5. The small trends with redshift, described above, are again evident in this figure. However, for each subsample, the redshift bins lie close to one another. In addition to observational effects, redshift trends may result from real changes in the galaxy population. However, given our volume-limited, colour-selected samples, and the narrow range of redshift, we do not expect evolution of the galaxy population to play a significant role in these trends. The distinctions between subsamples, particularly high- and low- systems, are maintained independent of redshift. The conclusions of V14 are thus robust. With that established, we now move on to examining how the wavelength dependence of galaxy structure varies with luminosity.
3.2 Luminosity-dependence of galaxy structure
V14 specifically chose a volume-limited sample of bright galaxies with . Here we investigate whether the conclusions drawn from their study apply to a wider range of galaxy luminosities.
Our sample is divided into three magnitude bins: , and . These intervals ensure similar numbers of galaxies in each bin, allowing for meaningful comparisons.
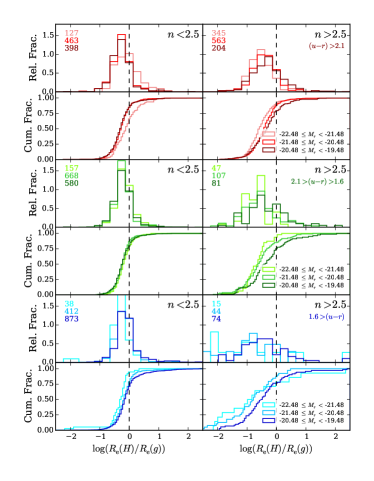
In Fig. 6 we present the wavelength dependence of effective radius for subsamples divided by colour, and luminosity.
For high- galaxies, there appears to be a consistent trend in the distribution of with changing absolute magnitude. Fainter high- galaxies have closer to unity than brighter high- galaxies. Their sizes therefore vary less as a function of wavelength. The most luminous galaxies, such as those studied by V14, display the strongest variation of their sizes with wavelength.
For the low- samples, although K-S tests indicate some differences between the distributions in the luminosity bins, there is little obvious consistent variation. The blue sample displays similar trends to the high- galaxies, while typical green galaxies show no luminosity dependence. Red galaxies hint at an opposing behaviour, such that the most luminous bin displays less variation in size with wavelength.
On average across all samples, the offset of the distributions with respect to the standard deviation of the distributions is 27%, calculated as above, for the redshift distributions.
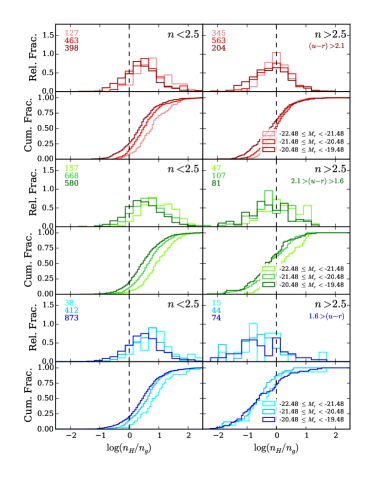
Again we study in the same manner; Fig. 7 shows the wavelength dependence of Sérsic index for the same subsamples as Fig. 6. There appears to be a consistent trend in the distribution of with changing absolute magnitude for both low- and high- galaxies, with a 47% mean offset of the distributions, compared to the width of those distributions. In the high- sample, distributions for all luminosity bins peak around one, supporting the conclusion of V14 that bulge-dominated (and likely one-component) systems show little change in Sérsic index with wavelength. Comparing cumulative distributions for the high- samples, we see that bluer and less luminous samples tend to have slightly lower values of . Typical bright high- galaxies have very close to unity.
The low- samples consistently display values of above one, indicating an increase in Sérsic index with wavelength. This offset from unity strongly increases with luminosity, such that the brightest low- galaxies display the greatest dependence of Sérsic index on wavelength.
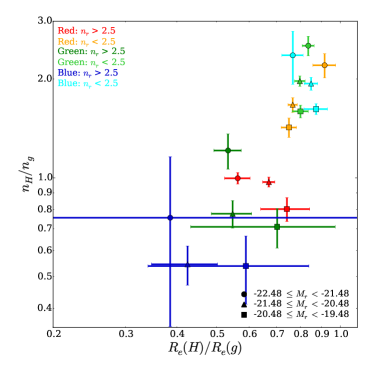
In a similar manner to before, Fig. 8 shows the relationship between and for our three magnitude bins. High Sérsic index galaxies show a clear variation in effective radius with luminosity (brighter galaxies showing a greater decrease in with wavelength). Low Sérsic index galaxies show a change in with wavelength (brighter galaxies showing a greater increase in with wavelength). The overall effect is that the differences between low- and high- galaxies become more pronounced with increasing luminosity.
We have performed all of the analysis in Sec. 3.1 and 3.2 using an optical baseline (–), although using the same fits to the full – dataset. As one would expect, over this narrower wavelength range the differences between the samples narrow, though not in terms of significance, as the scatter shrinks roughly in proportion. All of the behaviour seen in the versus plots is qualitatively the same, and our inferences would be unchanged.
In terms of overall colour, concentration and size, early- and late-type galaxies become more similar with increasing luminosity. However, when one considers the joint distribution of these three properties, as in this paper, one instead finds a divergence which widens with luminosity. The process by which late-type (low-) galaxies grow must promote the variation of profile shape with wavelength. The growth of early-type (high-) galaxies must also maintain a radial segregation of their stellar populations, but crucially in terms of size, not profile shape. Furthermore, any process which transforms late-types to early-types must do so in a manner that erases the wavelength-variation of profile shape, but enhances that of size. Realistic mechanisms for galaxy growth and transformation must reproduce the trends we observe.
3.3 Morphological classifications
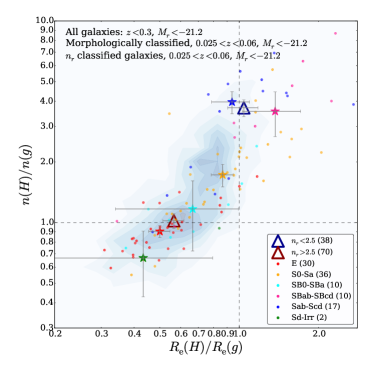
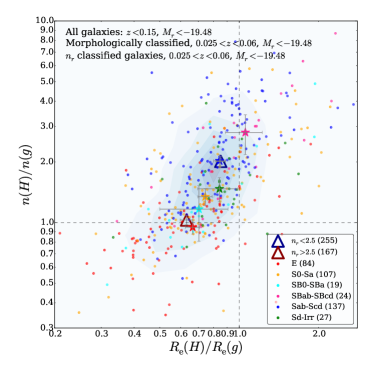
The work of V14 assumes that one can perform a meaningful division of the galaxy population using Sérsic index as a proxy for structure or morphology. Typically galaxies are associated with structures with prominent discs, whilst galaxies are thought to be spheroid-dominated. To verify that our results do not strongly depend on this assumption, we now examine the distributions of and for samples selected by visual morphology. In Figs. 9 and 10 we show the wavelength dependence of and for galaxies separated by Hubble types from the GAMA Visual Morphology catalogue (Kelvin et al., 2014). Note that visual morphologies are only available for galaxies with and . Figure 9 shows only galaxies within the overlapping redshift and magnitude regions, i.e. & (V14 sample) or (low- sample). Also plotted (as triangles) are the median locations of the high- and low- populations, selected within the same redshift and absolute magnitude limits as the morphologically-classified points. Background contours show the distribution of galaxies in each of our volume-limited samples for which we do not have a visual morphological classification.
Despite the severe limitation in sample size that the visual morphological classifications impose, they confirm the behaviour of our high- and low- galaxy samples. In both volume-limited samples we see that the median location of the high- galaxies lies very close to the median point of the elliptical sample, whilst the median of the low- galaxies lies close to that of the Sab-Scd galaxies. Vika et al. (2015) see identical behaviour for a sample of very low-redshift galaxies, and show that this is robust against artificial redshifting, and investigate the use of and as morphological classifiers.
Note that the offset between the late-type/low- points at low-redshift and the contoured distribution at higher redshifts appears to confirm the (small) biases inferred in Section 3.1. At lower-redshift (i.e. in better quality data) we measure slightly higher and for low- galaxies. Our previous results therefore somewhat underestimate the difference between the two galaxy populations. However, even at the contrast between their behaviour is such that our conclusions are unaffected.
The finer distinctions between the Hubble types reveal some further details in the – figures. Ellipticals and Sab-cd galaxies form the opposite extrema of the distributions. S0-Sa galaxies are intermediate between the two, but closer to the ellipticals. Perhaps surprisingly, late-type disks, Sd-Irr, occupy the same intermediate region. This may be a result of their similar one-component natures, with higher values of indicative of system with comparable bulge and disc components. Note that and may be noisier for systems that depart greatly from an elliptical Sérsic, and more difficult to interpret physically. Nevertheless, measuring these properties still gives insight into their structure and allows us to make qualitative comparisons. So, in Fig. 10 we see that, on average, Sd-Irr galaxies display properties similar to late-spirals, but with less peakiness at longer wavelengths. It is also worth noting that the presence of a bar does not appear to greatly alter the measured wavelength dependence of galaxy structure.
3.4 The effect of dust
Late-type galaxies contain significant quantities of dust, which can strongly affect their measured properties (e.g., Popescu et al. 2002; Pierini et al. 2004; Holwerda et al. 2005, 2009; Möllenhoff, Popescu & Tuffs 2006). The effects vary with the amount and distribution of dust within the galaxy, as well as the observed inclination and wavelength.
A wide range of observations, together with detailed modelling (Popescu et al., 2000), have helped to establish a typical geometry for the distribution of dust in the disks of star-forming galaxies (Tuffs et al., 2004). When accounting for attenuation, this dust model can be parametrised by a single dominant parameter: the central face-on optical depth in the -band, , while remaining widely applicable, at least to relatively massive spiral galaxies. It should, however, be noted that in lower-mass galaxies the dust distribution may be significantly different (Holwerda et al., 2012; Hinz et al., 2007). The Tuffs et al. (2004) model has been used to quantify, and potentially correct for, the effect of dust on galaxy structural parameters (Möllenhoff, Popescu & Tuffs, 2006; Pastrav et al., 2013a, b).
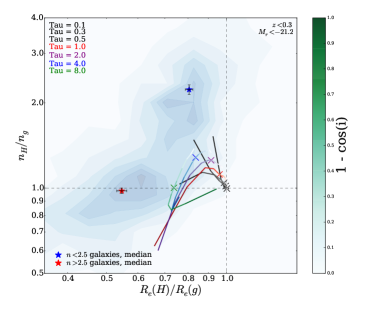
Figure 11 shows the effect of dust on and for pure discs fit with a single-Sérsic profile, as determined by Pastrav et al. (2013a). Their results are shown for a range of inclinations along loci corresponding to a wide variety of central dust opacities. Typical spiral galaxies have – (Keel & White III, 2001; Holwerda et al., 2005; Driver et al., 2007b; Masters et al., 2010). Projection effects, as defined and predicted in Pastrav et al. (2013a, b), are not considered here, as their contribution is minimal compared to dust effects. As the purpose of this figure is illustrative, we have simply taken the published and -band dust effects from Pastrav et al. (2013a), without attempting the small interpolation to the - and -bands. These dust effects are shown as applied to a nominal ‘galaxy’ with (, ) = (1, 1), and for each value we show how & change with inclination. Fig. 11 shows that dust always acts to decrease , i.e. increase apparent size more at shorter wavelengths. It also tends to increase , i.e. raise the Sérsic index with increasing wavelength, except for at high opacities and close to edge-on inclinations.
Note that the stellar disk emitting in the optical bands in the Tuffs et al. (2004) model actually has an intrinsic stellar population gradient, such that the scale length of the old stellar disc decreases by 30 percent from the to bands, corresponding to . Including this intrinsic would make the loci overlap with the observed distribution in Fig. 11. One can see that for a population of pure discs with a variety of opacities and inclinations, a correlation in – would arise from their variation with inclination, while a scatter about that correlation would be associated with variations in opacity. However, as one would expect, dust effects alone cannot account for the full observed – distribution. Late-types extend to substantially greater than can be attributed to dust, presumably as a result of the presence of a central bulge that becomes more dominant at longer wavelengths. However, there remains the possibility that more varied dust models may have more success in reproducing our observed dependence of and . For example, the dust within lower-mass galaxies is more likely to be vertically distributed throughout the stellar disk, rather than concentrated in the central plane (Holwerda et al., 2012). On the other hand, early-types, which generally contain little dust, must have stronger intrinsic stellar population gradients than those in the discs.
4 Discussion
In this paper we have studied how the wavelength dependence (from restframe - to - bands) of galaxy structure varies for samples selected in a variety of ways. As in V14, galaxy properties have been measured using MegaMorph techniques to fit consistent, wavelength-dependent, two-dimensional Sérsic profiles in multiple wavebands simultaneously. Our results are summarized in terms of the fractional variation in Sérsic index and effective radius between the - and -bands, which we denote and .
4.1 The physical meaning of and
Before discussing the implications of our results, and comparing to other studies, we first review the meaning of these quantities in terms of the appearance and physical structure of a galaxy. A value around unity, for either quantity, indicates that that particular aspect of structure does not vary with wavelength. gives the variation in galaxy size () with wavelength. The vast majority of galaxies are found to have , indicating that they are larger in the blue. These galaxies therefore display redder colours in their centres, and become bluer at larger radii. In the rarer case, , galaxies are larger in the red, and hence bluer in the centre, becoming redder with increasing radius.
indicates how a galaxy’s profile shape (), or equivalently its central concentration, depends on wavelength. Galaxies with have a high- profile in redder bands. They are therefore ‘peakier’ in their centres and have more significant surface brightness at large radii. Galaxies with are thus expected to be redder in the centre and in their outskirts, and bluer at intermediate radii (). In practice, the outermost red regions may be too faint to been seen in normal depth imaging, and so the visible outskirts of such a galaxy may appear blue. However, the difference with respect to is that the colour gradient should become shallower with radius. Galaxies with obviously show the opposite trend, appearing more strongly peaked at bluer wavelengths.
Of course, both and may both depart from unity, indicating variations in both size and profile shape with wavelength. In that case, the resulting colour profile is a combination of the two behaviours. These may, to a degree, counteract (if and are correlated) or reinforce (if anti-correlated) one another. Indeed, some of the correlation in the – plane, within subsets of the galaxy population, may be a result of this degeneracy.
We study the effect of redshift on our ability to measure and in Section 3.1. For low- (i.e. typically late-type) galaxies we find a bias of and to lower values ( away from unity, toward unity) at higher redshifts. However, these observed biases are significantly smaller than the differences between our galaxy subsamples, particularly for low- versus high- galaxies. The conclusions of V14 therefore are not significantly affected by the generous redshift limit adopted in that study. The quantitative results of V14 are also relatively robust and may be compared to other studies of comparable galaxy populations in similar quality imaging. However, when comparing to much lower redshift samples of late-types, e.g. in Fig. 10, the redshift bias must be borne in mind.
In Section 3.2, the wavelength-dependence of both and are found to depend on luminosity, with brighter galaxies generally showing stronger trends with increasing wavelength: to smaller sizes (especially for early-type galaxies) and higher- (especially late-type galaxies). The contrast between the behaviour of high- and low- galaxies lessens with decreasing luminosity, suggesting greater structural similarity between (Sérsic index selected) early- and late-type galaxies at lower luminosities.
4.2 Comparison of observed trends of R and N with other studies
Our work is consistent with that of La Barbera et al. (2010b). We find an extremely similar decrease in effective radius for red, galaxies at the same luminosities. Furthermore, we have shown that this is robust to redshift effects and the use of visual morphology, rather than Sérsic index, to select early-types. Our results also agree with those of Kelvin et al. (2012) and Ko & Im (2005), both of which find a nearly 40 per cent decrease in over the corresponding wavelength range.
The existence of negative colour gradients in elliptical galaxies, particularly strong in optical-NIR colours, has been known for a long time (e.g., Peletier, Valentijn & Jameson 1990). La Barbera et al. (2010a) use their Sérsic models, independently fit to each wavelength, to determine colour gradients for their sample of early-type galaxies. They find that more optically-luminous galaxies display stronger (negative) NIR-optical colour gradients. This agrees with our finding that depends on wavelength more strongly for more luminous high- galaxies. However, La Barbera et al. (2010a) see little variation in colour gradients with NIR luminosity or stellar mass. This is consistent with the bluer stellar population being located at larger radii, and this feature being more prominent in more luminous galaxies.
La Barbera et al. (2012) show that, compared to optical-NIR measurements, colour gradients based only on optical bands are weaker. They are nevertheless widely observed (e.g., Gonzalez-Perez, Castander & Kauffmann 2011). Optical gradients also do not show as much variation with luminosity, being strongest for intermediate luminosities (La Barbera et al., 2012; Roche, Bernardi & Hyde, 2010). Using stacked optical (SDSS) images, D’Souza et al. (2014) find strong evidence for the presence of blue (in ) halo components in various galaxy populations. This extended component can account for around half of the light of a galaxy, being more prominent in higher- and more luminous galaxies. Even the majority of massive early-type galaxies at are found to display negative colour gradients (Gargiulo et al., 2012).
A small subset of local early-type galaxies display positive optical colour gradients, due to the presence of blue cores associated with recent star-formation (Suh et al., 2010). These become more prevalent at higher redshifts (Ferreras et al., 2005). Such galaxies correspond to our high-, very blue, selection. These galaxies display , like other early-types, implying they are more compact in the red. However, in contrast to our other subsamples, this is combined with , implying their profiles are more strongly peaked in the blue. The intermediate and outer gradients of these galaxies are therefore apparently like other ellipticals, but they must display a blue excess in their cores.
Typical spirals (Sab-Scd) show less variation with wavelength, compared to early-types, but it is still significant: a per cent decrease from to . This value has little dependence on galaxy luminosity, at least over the range we probe here. However, note that the wavelength variation of for late-types is somewhat susceptible to being overestimated in lower-quality data. Both early-discs (S0-Sa) and very late-types (Sd-Irr) display behaviour intermediate between ellipticals and spirals.
In terms of Sérsic index, we find that early-type (high-) galaxies show little variation in , while late-types substantially increase in with increasing wavelength. Again, early-discs (S0-Sa) and very late-types (Sd-Irr) fall between the two behaviours. Our results for disc galaxies agree well with those of Kelvin et al. (2012), who find that Sérsic indices almost double from to , although most of the change occurs over the optical range.
| ‘Early type’ | ‘Late type’ | Notes | |||
| LB10 | 1* | 28 | - | - | 5080 bright spheroids from SPIDER, - to -band. (La Barbera et al., 2010a) |
| Kel12 | 30 | 38 | 52 | 25 | 167,600 galaxies from GAMA, - to -band. (Kelvin et al., 2012) |
| V14 | 1* | 45 | 38* | 25 | 14,274 galaxies from GAMA-II G09 region, , - to -band. |
| L15: | - | - | - | 16 | 8399 galaxies from GAMA-II, , - to -band. (Lange et al., 2015) |
| L15: | - | 13 | - | 13 | As above. |
| L15: | - | 11 | - | - | As above. |
| K15: | 12 | 23 | 29 | 13 | 5331 galaxies from GAMA-II G09 region, , - to -band (this study). |
| K15: | 5 | 25 | 40 | 15 | As above |
| K15: | 5 | 33 | 55 | 12 | As above |
Various studies have found the Sérsic indices of early-type galaxies to be generally unchanged with wavelength (Kelvin et al., 2012; La Barbera et al., 2010a, 2012), perhaps with a slight increase in with wavelength. The estimated changes in and with wavelength for these, and other, studies are displayed in Table 3. We do not generally see such an increase, rather a small decrease is more common in our early-type samples. However, redshift appears to have an effect, as does luminosity. In our lowest-redshift, brightest samples we find Sérsic indices that are constant, or slightly rising, with wavelength. Our visually-classified ellipticals also have very close to unity. On the other hand, fainter and bluer high- galaxies tend to display Sérsic indices that decrease with wavelength, by several tens of per cent. La Barbera et al. (2012) find that larger (and hence typically more luminous) early-type galaxies show stronger trends of increasing wavelength, matching the form of behaviour we see.
The redshift biases and luminosity trends we have found allow us to, at least partly, reconcile the dramatic wavelength-dependence reported by V14 with the more modest behaviour seen by some other recent studies. Kelvin et al. (2012) find slightly weaker trends than V14, but they use a magnitude-limited sample, dominated by somewhat less luminous galaxies. When we adopt the same selection, our results are in excellent agreement.
Lange et al. (2015) find a substantially weaker dependence of on wavelength, though it is still significant. We have shown that dividing galaxies by visual morphology (as in Kelvin et al. (2014)) confirms the behaviour inferred from selections based on colour and Sérsic index, but severely limits the useable sample size.
For late-type galaxies, our results are actually in good agreement with Lange et al. (2015). If we consider our low redshift sample, we find a similar per cent decrease in size. At higher redshifts we appear to slightly overestimate the strength of the size decrease. However, for early-types, there is a larger discrepancy, although the qualitative behaviour is the same. Redshift (i.e. data-quality) appears to have little effect on our results. Considering our () selection we still find a per cent decrease in the effective radii of red high- galaxies. This is not reduced if we limit our analysis to visually-classified ellipticals. The wavelength-dependence results featured by Lange et al. (2015) are based on linear fits to the – relation, and hence galaxies with relatively low masses, , exert a strong influence. These different analyses may have something to do with our disagreement. However, it may also be that the difference in depth between the UKIDSS LAS and VIKING VISTA NIR imaging is responsible, as suggested by Lange et al. (2015). Many, but not all, of the studies that also find strong trends for early-type galaxies, as mentioned above, are also based on SDSS and UKIDSS LAS data and hence may be similarly affected. In the near future we will have the results of our methodology applied to the same SDSS plus VIKING data set, so will be better placed to evaluate this issue.
4.3 Connection to stellar population gradients
The wavelength dependence of structure that we have measured, i.e. and , must be driven by radial variations in stellar populations and/or dust extinction. For early-type galaxies, many studies have found that colour gradients are caused by negative metallicity gradients. Age is generally fairly constant with radius, or even slightly increasing, and hence acting against the metallicity trend. The outskirts of massive early-type galaxies (ETGs) are therefore typically more metal poor and older than their cores, with weaker gradients for lower mass ETGs. (e.g., La Barbera et al. 2012, and references therein).
Metallicity gradients are expected in models of monolithic collapse (Worthey, Trager & Faber, 1995), and this mechanism may be responsible for the gradients in the centres of today’s galaxies. However, most massive galaxies are expected to have experienced a major merger since their formation, which will have partly erased these initial gradients. It has been discovered that early-type galaxies must at least double in effective radius between and today (e.g., see van der Wel et al. 2014). Although various processes have been proposed, the dominant mechanism appears to be minor mergers (Hopkins et al., 2009; Lackner & Gunn, 2012). The stellar material accreted in such mergers tends to contribute most significantly to the outskirts of the more massive galaxy, building up an outer envelope (Huang et al., 2013). The effect is to increase effective radius over time and produce stellar population gradients.
Our measured increase in effective radius toward shorter wavelengths, which is stronger for more luminous systems, (– from –), is consistent with observations of negative colour gradients and extended blue components (La Barbera et al., 2012). The lack of variation in Sérsic index with wavelength () suggests that the extended profile of the stellar populations seen in the blue is structurally consistent to the profile traced by those stellar populations dominating at red wavelengths, possibly indicative of a similar origin. Together, these observations are consistent with a gradual build-up of massive early-type galaxies through accretion of low-mass galaxies.
Lower-luminosity, and bluer, early-type (high-) galaxies tend to show slightly peakier profiles in the blue, which may be an indication of an additional blue stellar component in their centres, possibly as a result of recent central star-formation.
Dust in early-type galaxies is generally not expected to be present in sufficient quantities to have a significant effect on their observed structure. However, Rowlands et al. (2012) do find that per cent of luminous early-type galaxies are detected in the infrared, implying that they must contain significant fractions of dust (also see Bendo et al. 2006). It is uncertain how this dust impacts upon their measured structural parameters, but it may be responsible for some of the scatter we see in and for our early-type samples.
In late-type galaxies, dust is likely to play a more dominant role. The apparent differences in optical structure in disc galaxies across the Hubble sequence is largely determined by the presence of young stars and dust. The old stellar discs of spiral galaxies, as seen in the NIR, are very similar at all Hubble types (Block et al., 1999).
Modern studies of the opacity of spiral discs find that they suffer from substantial face-on and inclination-dependent extinction (e.g., Holwerda et al. 2005; Masters et al. 2010). Testing the model of Tuffs et al. (2004) with a large galaxy sample, Driver et al. (2007b) find good agreement and infer that bulges and the central regions of discs suffer from substantial attenuation of their optical light. This has a significant impact on measurements of their structural parameters (Möllenhoff, Popescu & Tuffs, 2006; Pastrav et al., 2013a, b). However, as we have shown in Section 3.4, dust alone cannot explain the observed wavelength trends. It seems obvious that the two-component, bulge-disk, nature of late-type galaxies, with their contrasting stellar populations and structures, must have at least some impact on the wavelength-dependence of their overall structure. We will investigate this further in a forthcoming paper.
5 Summary
The variation of galaxy structure with wavelength reveals the connections between the stellar populations within a galaxy and their spatial distributions. Specifically, we consider the change in Sérsic index and effective radius from - to -band, which we denote and . As shown by V14, the majority of early-type (high-) galaxies show little variation in their Sérsic index with wavelength (), but are significantly smaller at longer wavelengths (). This behaviour is suggestive of a structure formed by similar (violent) mechanisms being apparent at all wavelengths, but with a scale that strongly depends on the colour of the stellar population. On the other hand, late-type galaxies (low-) display a substantial increase in Sérsic index with wavelength (), suggesting a variation in the type of structure dominating the light at different wavelengths, but less variation in size (). Very blue, high-, galaxies present an interesting contrast, having significantly higher Sérsic indices in the blue, perhaps indicating the presence of a peaky blue component.
In this paper we have followed V14, using optical-NIR imaging and redshifts from the GAMA survey (Driver et al., 2009), with multi-band single-Sérsic fits performed using tools developed by the MegaMorph project (Bamford et al., 2012), in order to study four further aspects of the wavelength-dependence of galaxy structure. We consider the distributions of and for a variety of volume-limited samples subdivided by colour, Sérsic index and morphology. The main conclusions from our analysis are:
-
•
We have verified that our measurements of and are robust to the effects of redshift, strengthening our earlier results (V14). Early- and and late-type galaxies (selected using Sérsic index) present strongly contrasting behaviour in terms of the wavelength-dependence of their structure. Out to we see no substantial changes in or , particularly when compared to the striking differences between galaxy subsamples. What small biases are present, suggest that at higher redshift (lower S/N and poorer resolution) we may be slightly overestimating the offset of from unity, and underestimating the offset of from unity, for low- galaxies. Both of these effects act to reduce the apparent difference between the high- and low- populations. The estimated contrast is therefore even more pronounced than that determined by V14.
-
•
The strengths of and depend on galaxy luminosity:
-
–
High- galaxies with lower luminosities have closer to unity than their brighter counterparts. Most high- galaxies show a peak in around unity for all luminosities, supporting the suggestion of V14 that these are single-component objects.
-
–
Low- galaxies display weaker, mixed trends in than high- galaxies. There is a striking trend in the distributions of low- galaxies with luminosity: brighter objects display further from unity, for all colour subsamples.
-
–
-
•
The interpretations of V14 are supported by visual morphological classifications of a low-redshift subset of our sample from Kelvin et al. (2014); our low- samples share the same part of the – diagram as Sab/Scd galaxies, whilst the high- samples follow the distribution of elliptical galaxies. Both early- and late- disc galaxies occupy intermediate regions of the – plane, confirming that the extreme values for intermediate types are related to their two-component nature.
-
•
Results from fitting dusty galaxy models (Pastrav et al., 2013a) indicate that some of the wavelength-dependence of disc galaxy structure may be attributable to dust. The natural distribution of disc inclinations may account for the trend seen in the – plane, while varying central dust opacities may account for the scatter in this relation. However, pure dusty discs cannot reach the values of observed for intermediate-type spirals.
Further improving our understanding of the wavelength-dependence of galaxy structure will require more detailed consideration of the two-component nature of galaxies. We are currently exploring this topic using bulge-disc decompositions, and these results will be the subject of Kennedy et al. (in prep.).
6 Acknowledgements
This paper is based on work made possible by NPRP award 08-643-1-112 from the Qatar National Research Fund (a member of The Qatar Foundation).
GAMA is a joint European-Australasian project based around a spectroscopic campaign using the Anglo-Australian Telescope. The GAMA input catalogue is based on data taken from the Sloan Digital Sky Survey and the UKIRT Infrared Deep Sky Survey. Complementary imaging of the GAMA regions is being obtained by a number of independent survey programs including GALEX MIS, VST KiDS, VISTA VIKING, WISE, Herschel-ATLAS, GMRT and ASKAP providing UV to radio coverage. GAMA is funded by the STFC (UK), the ARC (Australia), the AAO, and participating institutions. The GAMA website is http://www.gama-survey.org/.
SPB gratefully acknowledges the receipt of an STFC Advanced Fellowship.
BV acknowledges the financial support from the World Premier International Research Center Initiative (WPI), MEXT, Japan and the Kakenhi Grant-in-Aid for Young Scientists (B)(26870140) from the Japan Society for the Promotion of Science (JSPS)
We thank the anonymous referee for their comments, which helped to improve the presentation of this paper.
References
- Allen et al. (2006) Allen P. D., Driver S. P., Graham A. W., Cameron E., Liske J., De Propris R., 2006, MNRAS, 371, 2
- Andredakis, Peletier & Balcells (1995) Andredakis Y. C., Peletier R. F., Balcells M., 1995, MNRAS, 275, 874
- Bamford et al. (2012) Bamford S. P., Häußler B., Rojas A., Vika M., Cresswell J., 2012, Proceedings of the International Astronomical Union, 7, 301
- Barden et al. (2012) Barden M., Häuß ler B., Peng C. Y., McIntosh D. H., Guo Y., 2012, MNRAS, 422, 449
- Bendo et al. (2006) Bendo G. J. et al., 2006, ApJ, 645, 134
- Block et al. (1999) Block D., Puerari I., Frogel J., Eskridge P., Stockton A., Fuchs B., 1999, Ap&SS, 5
- Caon, Capaccioli & D’Onofrio (1993) Caon N., Capaccioli M., D’Onofrio M., 1993, MNRAS, 265
- Cappellari et al. (2011) Cappellari M. et al., 2011, MNRAS, 416, 1680
- de Souza, Gadotti & dos Anjos (2004) de Souza R. E., Gadotti D. A., dos Anjos S., 2004, ApJS, 153, 411
- de Vaucouleurs (1948) de Vaucouleurs G., 1948, AnAp, 11, 247
- deJong (1996) deJong R., 1996, A&A, 118, 557
- den Brok et al. (2011) den Brok M. et al., 2011, MNRAS, 414, 3052
- Driver et al. (2007a) Driver S. P., Allen P. D., Liske J., Graham A. W., 2007a, ApJ, 657, L85
- Driver et al. (2009) Driver S. P., Norberg P., Baldry I. K., Bamford S. P., Hopkins A. M., Liske J., Loveday J., Peacock J. A., 2009, Astronomy & Geophysics, 50, 5.12
- Driver et al. (2007b) Driver S. P., Popescu C. C., Tuffs R. J., Liske J., Graham A. W., Allen P. D., De Propris R., 2007b, MNRAS, 379, 1022
- D’Souza et al. (2014) D’Souza R., Kauffman G., Wang J., Vegetti S., 2014, MNRAS, 443, 1433
- Edge et al. (2013) Edge A., Sutherland W., Kuijken K., Driver S., McMahon R., Eales S., Emerson J., 2013, The Messenger, 154, 32
- Ferreras et al. (2005) Ferreras I., Lisker T., Carollo C. M., Lilly S. J., Mobasher B., 2005, ApJ, 635, 243
- Gadotti (2011) Gadotti D. A., 2011, MNRAS, 415, 3308
- Gargiulo et al. (2012) Gargiulo A., Saracco P., Longhetti M., La Barbera F., Tamburri S., 2012, MNRAS, 425, 2698
- Gonzalez-Perez, Castander & Kauffmann (2011) Gonzalez-Perez V., Castander F. J., Kauffmann G., 2011, MNRAS, 411, 1151
- Goudfrooij et al. (1994) Goudfrooij P., Hansen L., Jorgensen H., Norgaard-Nielsen H., deJong T., vandenHoek L., 1994, A&A Suppl. 104
- Graham (2013) Graham A. W., 2013, Elliptical and Disk Galaxy Structure and Modern Scaling Laws, Oswalt T. D., Keel W. C., eds., p. 91
- Graham & Driver (2005) Graham A. W., Driver S. P., 2005, PASA, 22, 118
- Graham & Prieto (2001) Graham A. W., Prieto M., 2001, Ap&SSS, 277, 465
- Häußler et al. (2013) Häußler B. et al., 2013, MNRAS, 430, 330
- Hill et al. (2011) Hill D. T. et al., 2011, MNRAS, 412, 765
- Hinz et al. (2007) Hinz J. L., Rieke M. J., Rieke G. H., Willmer C. N. A., Misselt K., Engelbracht C. W., Blaylock M., Pickering T. E., 2007, ApJ, 663, 895
- Hodge (1971) Hodge P. W., 1971, ARA&A, 9, 35
- Holwerda et al. (2012) Holwerda B. W. et al., 2012, A&A, 541, L5
- Holwerda et al. (2005) Holwerda B. W., Gonzalez R. A., Allen R. J., van der Kruit P. C., 2005, AJ, 129, 1396
- Holwerda et al. (2009) Holwerda B. W., Keel W. C., Williams B., Dalcanton J. J., de Jong R. S., 2009, AJ, 137, 3000
- Hopkins et al. (2009) Hopkins P. F., Bundy K., Murray N., Quataert E., Lauer T. R., Ma C.-P., 2009, MNRAS, 398, 898
- Huang et al. (2013) Huang S., Ho L. C., Peng C. Y., Li Z.-Y., Barth A. J., 2013, The Astrophysical Journal, 768, L28
- Keel & White III (2001) Keel W. C., White III R. E., 2001, AJ, 122, 1369
- Kelvin et al. (2014) Kelvin L. S. et al., 2014, MNRAS, 439, 1245
- Kelvin et al. (2012) Kelvin L. S. et al., 2012, MNRAS, 421, 1007
- Ko & Im (2005) Ko J., Im M., 2005, JKAS, 38, 149
- Kormendy (1977) Kormendy J., 1977, ApJ, 217, 406
- Kormendy & Bender (1996) Kormendy J., Bender R., 1996, ApJ, 464, L119
- La Barbera & de Carvalho (2009) La Barbera F., de Carvalho R. R., 2009, ApJ, 699, L76
- La Barbera et al. (2010a) La Barbera F., De Carvalho R. R., De La Rosa I. G., Gal R. R., Swindle R., Lopes P. A. A., 2010a, AJ, 140, 1528
- La Barbera et al. (2010b) La Barbera F., De Carvalho R. R., De La Rosa I. G., Lopes P. A. A., Kohl-Moreira J. L., Capelato H. V., 2010b, MNRAS, 408, 1313
- La Barbera et al. (2012) La Barbera F., Ferreras I., de Carvalho R. R., Bruzual G., Charlot S., Pasquali A., Merlin E., 2012, MNRAS, 426, 2300
- Lackner & Gunn (2012) Lackner C. N., Gunn J. E., 2012, MNRAS, 421, 2277
- Lange et al. (2015) Lange R. et al., 2015, MNRAS, 447, 2603
- Lawrence et al. (2007) Lawrence A. et al., 2007, MNRAS, 379, 1599
- Liske et al. (2015) Liske J. et al., 2015, MNRAS, 452, 2087
- Masters et al. (2010) Masters K. L. et al., 2010, MNRAS, 404, 792
- Möllenhoff, Popescu & Tuffs (2006) Möllenhoff C., Popescu C. C., Tuffs R. J., 2006, A&A, 456, 941
- Pastrav et al. (2013a) Pastrav B. A., Popescu C. C., Tuffs R. J., Sansom A. E., 2013a, A&A, 553, A80
- Pastrav et al. (2013b) Pastrav B. A., Popescu C. C., Tuffs R. J., Sansom A. E., 2013b, A&A, 557, A137
- Peletier, Valentijn & Jameson (1990) Peletier R., Valentijn E., Jameson R., 1990, A&A, 233, 62
- Peng et al. (2002) Peng C. Y., Ho L. C., Impey C. D., Rix H.-W., 2002, AJ, 124, 266
- Peng et al. (2010) Peng C. Y., Ho L. C., Impey C. D., Rix H.-W., 2010, AJ, 139, 2097
- Pierini et al. (2004) Pierini D., Gordon K. D., Witt A. N., Madsen G. J., 2004, ApJ, 617, 1022
- Popescu et al. (2000) Popescu C. C., Misiriotis A., Kylafis N. D., Tuffs R. J., Fischera J., 2000, A&A, 362, 138
- Popescu et al. (2002) Popescu C. C., Tuffs R. J., Völk H. J., Pierini D., Madore B. F., 2002, ApJ, 567, 221
- Roche, Bernardi & Hyde (2010) Roche N., Bernardi M., Hyde J., 2010, MNRAS, 407, 1231
- Rowlands et al. (2012) Rowlands K. et al., 2012, MNRAS, 419, 2545
- Saglia et al. (2000) Saglia R., Maraston C., Greggio L., Bender R., Ziegler B., 2000, A&A, 360
- Sérsic (1963) Sérsic J. L., 1963, Boletin de la Asociacion Argentina de Astronomia, 6
- Suh et al. (2010) Suh H., Jeong H., Oh K., Yi S. K., Ferreras I., Schawinski K., 2010, ApJS, 187, 374
- Taylor et al. (2009) Taylor E. N. et al., 2009, ApJS, 183, 295
- Tuffs et al. (2004) Tuffs R. J., Popescu C. C., V lk H. J., Kylafis N. D., Dopita M. A., 2004, A&A, 419, 821
- van den Bergh (1976) van den Bergh S., 1976, ApJ, 206, 883
- van der Wel et al. (2014) van der Wel A. et al., 2014, ApJ, 788, 28
- Vika et al. (2014) Vika M., Bamford S. P., Haussler B., Rojas A. L., 2014, MNRAS, 444, 3603
- Vika et al. (2013) Vika M., Bamford S. P., Häussler B., Rojas A. L., Borch A., Nichol R. C., 2013, MNRAS, 435, 623
- Vika et al. (2015) Vika M., Vulcani B., Bamford S., Häuß ler B., Rojas A., 2015, eprint arXiv:1502.05627
- Vulcani et al. (2014) Vulcani B. et al., 2014, MNRAS, 441, 1340
- Worthey, Trager & Faber (1995) Worthey G., Trager S., Faber S., 1995, Fresh views of elliptical galaxies. ASP Conf. Ser., 86
- York et al. (2000) York D. G. et al., 2000, AJ, 120, 1579