present address: ]\Mainz present address: ]School of Physics and Astronomy, University of Edinburgh, James Clerk Maxwell Building, Peter Guthrie Tait Road, Edinburgh EH9 3FD, Great Britain present address: ]\PGI, \DUS present address: ]\Bern present address: ]\Aachen present address: ]\Delhi present address: ]\INFN
WASA-at-COSY Collaboration
Measurements of Branching Ratios for Decays into Charged Particles
Abstract
The WASA-at-COSY experiment has collected events with -mesons produced via the reaction at . Using this data set, we evaluate the branching ratios of the decays , , and . The branching ratios are normalized to the decay. In addition an upper limit on a -violating asymmetry in is extracted.
pacs:
13.20.-v, 14.40.AqI Introduction
Studies of the strong interaction at low energies are vital to the understanding of the structure and dynamics of hadrons as well as the nature of confinement. At low energies, the quantum chromodynamics (QCD) coupling becomes large and standard perturbative methods cannot be used. The main theoretical approaches at low energies are lattice QCD and effective field theories, including chiral perturbation theory. Precise measurements at these energies provide valuable inputs and can constrain and test these approaches.
The meson is one of the eight pseudo-Goldstone bosons of the broken chiral symmetry and therefore studies of its decays provide a unique window into low-energy QCD. The meson is a light, neutral pseudoscalar with a mass of Olive et al. (2014). All strong and electromagnetic decays of the are forbidden to first order, resulting in a relatively long lifetime and a correspondingly narrow width of keV. This makes the meson an ideal laboratory for the study of rare processes, since the suppression of many of the more abundant decay modes makes rare decays experimentally accessible.
We report the measurement of the branching ratios of the following four meson decay channels:
collected in proton-deuteron collisions at the WASA-at-COSY experiment using the decay with as the normalization channel.
Using a minimum bias data sample of mesons and the reconstruction capabilities of the WASA detector, most notably the charged particle tracking and particle identification, we are able to isolate pure samples of several decay modes. It is important to note that these are the only current results on decays where the -mesons are produced in hadronic interactions, therefore they feature complementary experimental conditions compared to the results of other experiments which use photoproduction or collisions for meson production.
II The Experiment
The WASA-at-COSY experiment was operated at the Cooler Synchrotron (COSY) at Forschungszentum Jülich from 2006 to 2014 Adam et al. . For the data used in this analysis, a proton beam with was impinged upon a deuterium pellet target. The reaction is used to produce mesons at energies close to the production threshold, where the most favorable ratio between the production cross section and background reactions is found. The cross section of this production reaction is Bilger et al. (2002); Rausmann et al. (2009), meaning that up to 8 events containing mesons are produced per second at the peak luminosity of cm-2s-1.
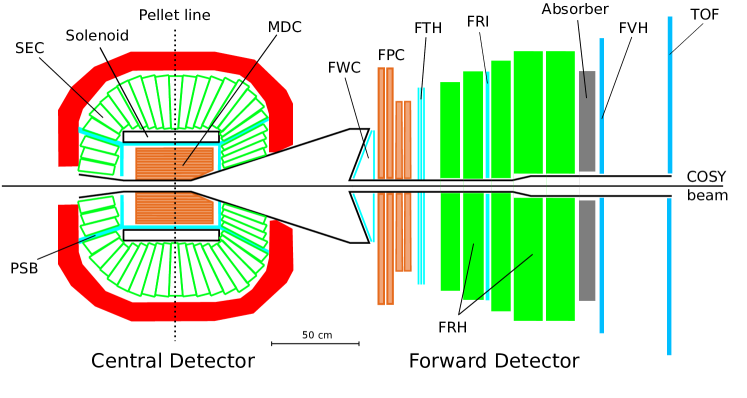
The WASA detector is a fixed-target spectrometer, with a forward detector arranged to measure hadronic ejectiles and a central detector to detect light mesons or their decay products. A cross-sectional view of the detector appears in Fig. 1. The forward detector consists of an arrangement of thin and thick plastic scintillators and drift chambers covering the full azimuthal angle. Thick scintillators in the forward range hodoscope (FRH) are designed to measure energy loss via ionization. Thin scintillator layers in the forward window counter (FWC) and forward trigger hodoscope (FTH) provide precise timing information. The kinetic energy and the particle type can be determined from the pattern of energy deposits in the thin and thick scintillator layers. A proportional chamber system (FPC) consists of 8 layers, each with 260 aluminized Mylar straws. Layers of the forward detector beyond the first layer of the FRH, including the Forward Range Interleaving Hodoscope (FRI) detector and the Forward Veto Hodoscope (FVH), were not used in this analysis due to the kinematics of the reaction.
The central detector is surrounded by a CsI(Na) electromagnetic calorimeter with 1012 elements (SEC). Contained within the calorimeter is a superconducting solenoid providing a uniform 1 T magnetic field to the region directly surrounding the interaction area. Charged particle tracking in this region is provided by the mini drift chamber (MDC), which is surrounded by an 8 mm thick plastic scintillator barrel (PSB) that provides precise timing and particle identification. The MDC consists of 4, 6, and 8 mm diameter straw tubes arranged in 17 layers that are alternatingly axial or skewed by or relative to the beam axis in order to provide three-dimensional tracking. An iron return yoke, shown in red in Fig. 1, surrounds the central detector and protects the photomultplier tubes of the SEC from the magnetic field. A detailed description of the WASA detector can be found in Ref. Bargholtz et al. (2008); Adam et al. .
The data for this experiment were taken over two periods with four weeks in the fall of 2008 and eight weeks in the fall of 2009. Care was taken to provide consistent conditions between the two run periods. The solenoid field setting was 0.85 Tesla. The trigger conditions were based on information from the forward detector only, meaning the trigger was unbiased with respect to a decay mode of the meson. The trigger identified ions by demanding large energy deposits in overlapping azimuthal sectors of the scintillator layers. In the case of the reaction the stops in the first layer of FRH, so the trigger included a veto on the signals from the second layer. Since fusion to a represents only about 1% of the total cross section at this energy, the above conditions were sufficient to bring the trigger rate down to below a thousand events per second, which were recorded. events containing mesons were collected in total, with being collected during the first period in 2008.
III Event Selection
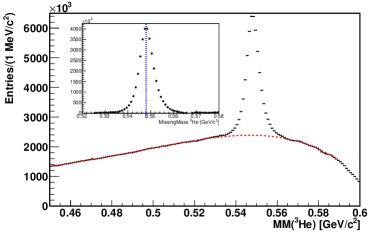
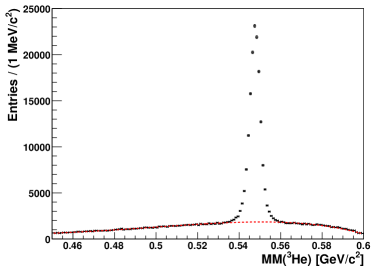
All decay channels are analyzed using a common analysis chain and settings up to the point of channel selection and kinematic fitting. The first step is to identify the ion. Forward-scattered tracks are reconstructed by using hit patterns in the FPC and matching them to signals in the scintillator layers. To separate ions from protons, deuterons, and charged -mesons, the energy deposited in the FWC is correlated with the energy deposited in the stopping layer. Once the ion is identified, the missing mass, MM, can be calculated by determining the invariant mass remaining when the measured four vector is subtracted from the known initial conditions of the beam and target. The resulting distribution is shown in Fig. 2 with a peak at the mass of the meson. This peak is composed of all decay modes of the , since this stage of the analysis does not include any condition on the central detector. This initial sample contains events with mesons.
Particles from meson decays are measured in the central detector. Tracks reconstructed in the MDC are extrapolated to the PSB and to the calorimeter. Clusters in the calorimeter that are not correlated with the tracks are treated as electromagnetic showers caused by photons. A threshold is placed on a cluster energy of 20 MeV to filter out low-energy background signals. The PSB time signals with a time resolution of ns are used to provide a start signal for the drift-time measurement in the MDC. All tracks are required to pass closer than 1 cm from the beam axis.
Event candidates for the decay channels have to include a ion in time coincidence with at least the minimum number of tracks (charged particles) and neutral clusters (photons) for a selected decay mode.
Energy and momentum conservation is imposed by requiring all event candidates to pass through a kinematic fitting routine for a specific decay channel. The kinematic fit takes into account reconstruction uncertainties for the different particle types as a function of angles and energies. A condition on the mass of the decaying or meson is not imposed. Events with a fit probability less than 0.1 are rejected. For certain channels additional conditions are applied, which are described in the later sections.
IV Simulations
Efficiencies used for acceptance correction are calculated using Monte Carlo simulations. Kinematic event generation is performed with the PLUTO software package Frohlich et al. (2007). This contains realistic physical descriptions of all relevant channels. The angular distribution of the produced mesons measured in Ref. Adlarson et al. (2014a) for the production reaction is used.
For , the Dalitz plot parameters from the Crystal Barrel Amsler et al. (1995) measurement are used. The simulation of channels is based on calculations from Ref. Petri . The decays are simulated using form factors calculated assuming the vector meson dominance model with the transition form factor where is the invariant mass squared of the electron pair and parameter Landsberg (1985).
Detector simulations are performed using the WASA Monto Carlo package, WMC, which is based on GEANT3 Brun et al. (1994). Temporal, spatial, and energy resolution of the detector elements is implemented in the WMC using data to fine-tune the parameters. For example, the and decays are used to determine the energy resolution of the calorimeter by analyzing the two photon invariant mass distributions. Additionally, inactive detector channels are continuously monitored and mapped in the simulations. The number of inactive channels is typically less than a few percent.
The WASA-at-COSY experiment uses an internal target with frozen pellets injected at rates of several thousand per second Ekstrom et al. (1996). Though vacuum pumps are positioned as closely as possible to the interaction region, a certain amount of residual gas is present in the region around the target which comes from the evaporation of pellets. This is quantified in data by selecting events and reconstructing the vertex from the tracks. The resulting spectrum has a large spike in the target region (with dimensions determined by the profiles of the beam and the pellet stream) as well as tails along the beam axis due to beam-gas interactions. Monte Carlo simulations of these “rest gas” events were performed by including the shape of the vertex distribution in the direction deduced from the experimental data. Over 90% of all events occur within one centimeter of the center of the interaction region.
V Particle Identification
Three of the final states being studied contain electrons and positrons in the final state. In WASA-at-COSY, above the kinematic threshold for double and production the dominant background contributions stem from meson production. In the case of and , the final states are mimicked by more abundant channels containing charged -mesons. In the case of , pions have to be identified in order to reconstruct the kinematics of the final state. For the two purposes (-meson rejection vs. identification) two slightly different algorithms are used.
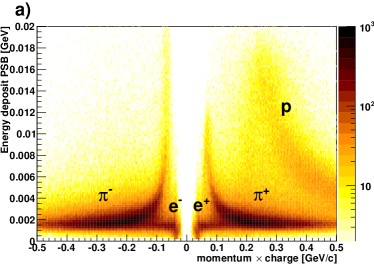
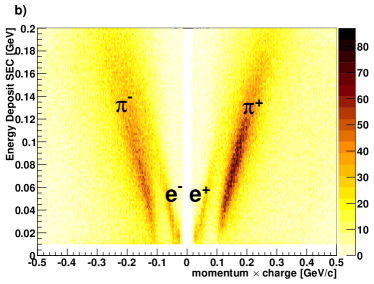
The WASA detector provides an independent measurement of the momentum of a charged particle in the MDC, as well as energy loss in the plastic scintillator barrel and in the electromagnetic calorimeter. Fig. 3 shows the distributions of the deposited energy versus the momentum times the particle’s charge for energies measured in both the PSB and the calorimeter. The energy loss in the plastic scintillator is corrected for the track length of the particle in the detector element. In order to illustrate the discriminating power of this method, these spectra were created for events with four charged particle tracks, since a large number of these events contain electrons. The bands from charged -mesons, electrons, and positrons are labeled.
To utilize this information, a simple Bayesian approach has been developed which allows the discrimination of -mesons from using all pieces of information simultaneously Coderre (2012). Two algorithms exist: a rejection algorithm, which considers two particles at a time and aims at rejecting -meson pairs, and a classification algorithm, which considers four particles at a time and aims at assigning particle types.
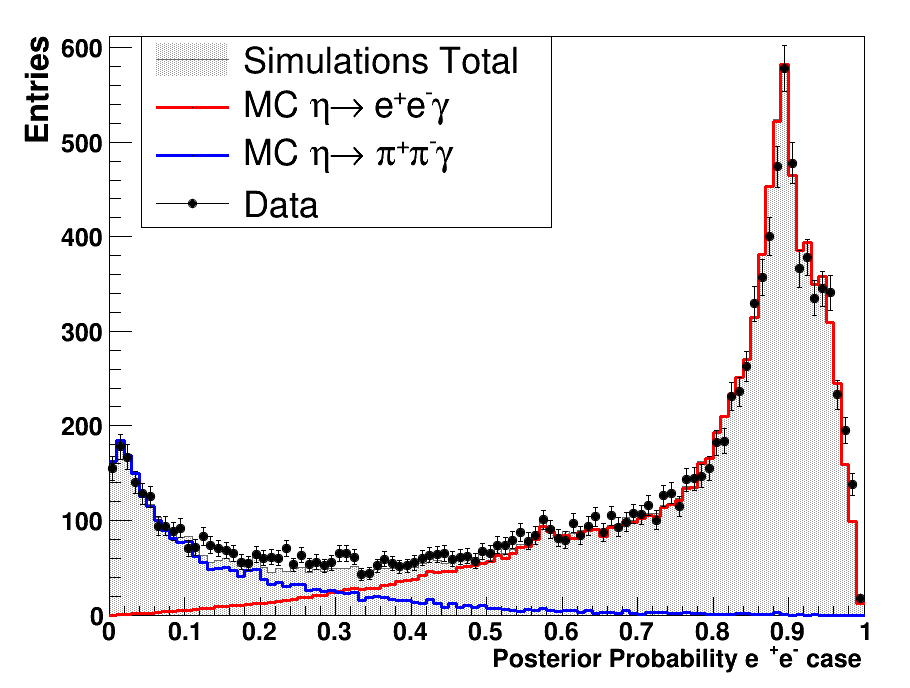
For the rejection algorithm, pairs of oppositely-charged particles are considered: a pair could be either an or a with equal a priori probability. The probability that a single particle is a -meson or a lepton is determined from the momentum and energy losses and added to the posteriors using Bayes’ equation. After considering both particles, the configuration with the highest probability is chosen. A distribution of the posterior probabilities in data and simulation is compared in Fig. 4, where a clear separation between particle types can be seen. The distribution is made for events passing the kinematic fit hypothesis with a missing mass within of the actual meson mass, in order to enhance the electron contribution.
The graphical identification bands shown in Fig. 3 are represented as probabilities using neural networks from the ROOT TMultilayerPerceptron class Brun and Rademakers (1997). The neural networks are trained using simulated -mesons and electrons tracks with isotropic directions and a flat energy distribution as signal and an uncorrelated, randomly-generated data set as background. The likelihood function that is used for Bayes’ equation is statistically determined from an independent set of simulated data. The resolution and position of the identification bands shown in Fig. 3 was tuned in simulations to describe the data before the neural networks were trained.
For the analysis a classification algorithm is used, as described in Section XI.
VI Photon Conversion Suppression
Final state electron-positron pairs originate from virtual photons where the corresponding radiative decay has a branching ratio that is about two orders of magnitude larger. The external conversion of real photons is suppressed by the design of the WASA detector, which uses a thin beryllium beam pipe in the interaction region. However, there is still a 1% chance that a photon will convert in the beam pipe or the inner layers of the drift chamber, producing an electron-positron pair. This means the magnitude of the conversion background is similar to that of the signal.
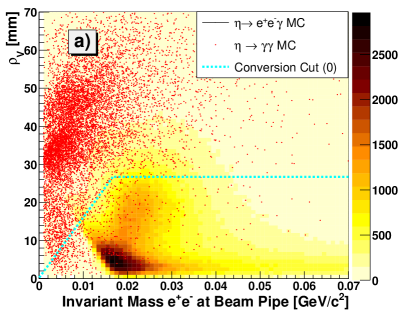
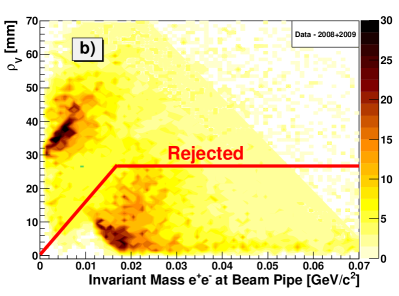
In order to suppress this background, the electron-positron vertex position is determined from the reconstructed MDC tracks. For events where the electron-positron pair originates from the actual meson decay, the vertex is close to the center of the interaction region. For events where the particles are the result of photon conversion in the detector material, the vertex distance will be at least equal to the radius of the beam pipe. The vertex distance in the plane perpendicular to the COSY beam, , is represented on the -axis in Fig. 5 for simulations and data. For simulations the channel is shown in red while the colored spectrum represents . The events are clustered starting at of about 30 mm, which corresponds to the radius of the beam pipe. The events are clustered around zero.
The invariant mass of the pair at the beam pipe location provides additional discriminating power, as inspired by a similar condition used in Ref. Ambrosino et al. (2009). Normally, the direction of the momentum vector of a particle is set to be tangent to the track helix at the closest approach to the origin. For this calculation the momentum vector is recalculated at the point where the helix crosses the beam pipe. This does not change the magnitude of the momentum vector, which is determined by the radius of the helix, or the polar angle, which is determined by the pitch of the helix, but changes the azimuthal angle. The expectation is that the momentum vectors of an electron-positron pair originating from the beam pipe will be parallel at this point and will cause a peak in the invariant mass distribution around . Particles originating from a decay at the origin will have an offset in the azimuthal angle, causing an offset in the invariant mass distribution. This can be seen in Fig. 5, where the conversion events have a distribution starting at zero while the events are offset.
The selection condition used is illustrated in Fig. 5. As part of a consistency check for each studied decay channel the selection condition was varied systematically and the effect on the final result was determined to be negligible. This involved changing both the slope and -intercept of the diagonal component of the demarcation line illustrated in Fig. 5, as well as the height of the horizontal component.
VII Normalization:
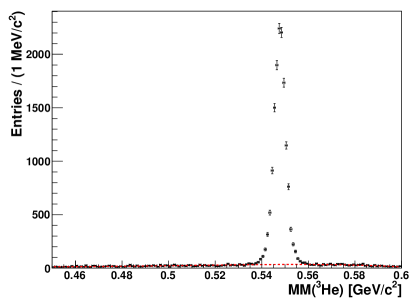
The channel has a branching ratio of , making it the most probable decay of the meson containing charged particles in the final state Olive et al. (2014). Due to the large branching ratio, a data sample with high statistics and low background could be extracted. The decay kinematics of this channel have been the subject of detailed studies using the WASA-at-COSY 2008 data. The results have been recently reported Adlarson et al. (2014b). In the present analysis the decay serves as a normalization channel for the less abundant processes.
The MM distribution for events passing the kinematic fit condition for the hypothesis is shown in Fig. 6. Due to the large signal to background ratio, no additional selection conditions are required. The peak after subtraction of the continuous background is expected to contain only a 2% contribution from with one spurious neutral cluster. The smooth background under the peak in Fig. 6 is composed mostly of events with a small contribution from events. In order to fit the background, the MM spectra of these two processes are determined from Monte Carlo simulations assuming a homogenous phase space distribution. They are multiplied by a fourth-order polynomial to model the acceptance and possible deviations from the phase space distributions. An additional parameter controls the relative scaling of the two- and three-pion continuum spectra. When the fit is performed the region around the peak is excluded. The number of signal events is then determined by subtracting the background function from the experimental spectrum in the signal area around the peak and integrating the resulting spectrum. Using this method and events are found for the 2008 and 2009 data sets, respectively.
The same method of background subtraction is used for the other channels, with the exception of where the selection conditions are stringent enough to reject nearly the entire continuum background. The systematic error of the fitting procedure is determined by varying the method used. One method is identical to that described above but includes the line shape of the peak, determined from simulations, along with an extra scaling parameter. Third and fourth order polynomials are also used to model the background, with both the fit range and exclusion range systematically varied.
VIII
The Dalitz decay proceeds via a real and a virtual photon intermediate state with the virtual photon converting into an pair. According to the vector-meson dominance model, the virtual photon can mix with neutral vector mesons. This mixing is dominated by the -meson ( MeV, MeV) with contributions from the tails of the -meson ( MeV, MeV) and -meson ( MeV, MeV) distributions. The squared four-momentum of the virtual photon corresponds to the squared invariant mass of the pair, the invariant mass distribution of pairs is affected by this mixing and the transition form factor can be extracted (see for example Refs. Berghauser et al. (2011); Aguar-Bartolomé et al. (2014)). In this publication we present only results on the branching ratio while assuming the transition form factor according to the vector meson dominance model.
The branching ratio of this channel given by Ref. Olive et al. (2014) is based on the measurements in Refs. Akhmetshin et al. (2001); Achasov et al. (2001); Berlowski et al. (2008); Berghauser et al. (2011). The largest data samples to date consist of and events Berghauser et al. (2011); Aguar-Bartolomé et al. (2014). This channel was also measured in the reaction by the CELSIUS/WASA collaboration with events collected Berlowski et al. (2008).
The first selection condition is a threshold of 100 MeV for the energy of the photon. The cut does not reduce signal efficiency, but significantly reduces the contribution of the pion background where pairs are combined with a spurious neutral cluster. A neutral low energy cluster in the calorimeter can come from noise or coincidental background that has not been rejected by the standard analysis.
After the cut the fraction of the events in the MM peak is 70% the signal channel, 5% , and 24% , with a small remainder coming from . These numbers are determined by studies of Monte Carlo simulations.
In order to reduce the photon conversion background from the decay, the conversion condition introduced in Section VI is applied. Simulations show that this reduces the contribution of to nearly zero, while reducing the number of signal events by 20%. The background from is rejected by using the particle identification rejection algorithm presented in Section V. This reduces the background contribution to about 1% with about a 10% decrease in the number of the signal events. The final MM peak consists of over 98% events.
After all conditions are applied the number of events is determined from the peak content of the MM distribution (Fig. 7). After subtracting the small remaining background from competing decay channels the peak contains events.
The systematic error was determined by varying the selection conditions and checking if the specific choice for any condition has a systematic effect on the result.
-
identification:
The default condition is a probability of at least 50% that the particles are . This is varied from 30% to 70%.
-
Photon conversion:
Both the slope of the diagonal line and the height of the horizontal line composing the selection demarcation (see Fig. 5) are varied systematically.
-
Kinematic fit probability:
The condition on the probability of the kinematic fit is varied from its default of 10% up to 35% for the signal and normalization channels simultaneously. Conditions below 10% are not useful because the probability distribution is not flat in this region and includes a large amount of background, making extraction of the signal difficult.
-
Instantaneous luminosity:
The instantaneous luminosity is monitored by recording the rates of the elastic scattering trigger and the pellet target every second. The branching ratio is extracted in bins of the elastic scattering trigger normalized to the target rate. The normalization to the target rate is needed to account for the duty factor of the pellet target.
-
Continuous background subtraction:
Several methods of background subtraction are applied as described in Section VII.
-
Calibration and luminosity:
The data sets from 2008 and 2009 differ only by calibration and luminosity profile. These parameters are included in the detector simulation and their systematical uncertainty is estimated by separate analysis of the two data sets. This leads to assignment of 4% systematic uncertainty due to deviations between the two data sets.
The methodology from Ref. Barlow was applied to compare the significance of a proposed systematic effect to the differences in statisical error of the subsets of data used to derive this significance. Using this method on the the first four conditions above, none exhibit a significance exceeding 3 and a systematic error is not assigned. The final test, differences in calibration and luminosity profile between the 2008 and 2009 datasets, shows a 4% deviation common to all channels. This error has been included in the final results.
It is not possible to check the effect of the background subtraction using this method. Therefore, the systematic error on the background subtraction was determined by performing several different fits of the background and taking the standard deviation. The error on the acceptance due to the uncertainties on the transition form factor is determined to be negligible by performing the analysis using simulated data with several different values for the transition form factor.
The branching ratio relative to is obtained after correcting for the respective backgrounds and the final acceptance of 12.0% for the signal channel:
The resulting branching ratio is in reasonable agreement with other experimental values Olive et al. (2014), with a precision limited by the systematic error resulting from the luminosity profile.
IX
The decay is closely related to the decay above and proceeds via two virtual photons. The additional electromagnetic coupling suppresses the branching ratio of the decay by two orders of magnitude compared to . The only measurement where this decay is observed was performed by the KLOE Collaboration. The branching ratio was determined to be based on events Ambrosino et al. (2011).
Event candidates with at least two positively and two negatively charged particles measured in the WASA central detector are passed through a kinematic fitting routine with the hypothesis. Only events fulfilling energy and momentum conservation at greater than 10% probability are further considered.
To suppress the charged-particle background from -mesons the particle identification rejection algorithm introduced in Section V is used. Since the algorithm considers one positively and one negatively charged particle pair at once, an event candidate is accepted if both pairs in the two possible combinations of oppositely charged particles passes the selection condition.
Background from photon conversion in the beam pipe, predominantly from the reaction , is suppressed using the method presented in Section VI. Again an event is accepted if both pairs in the two possible combinations pass the condition.
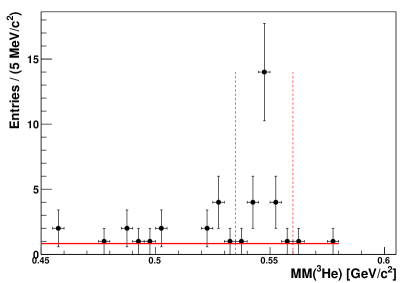
After applying these criteria, the remaining number of events is extracted from the MM spectrum shown in Fig. 8. Due to the limited statistics a simplified method with constant continuous background term is used in the fit. The range from 0.535 to 0.560 GeV/ is excluded from the fit (marked by the two dashed lines in the distribution). The number of remaining events is , which is determined by counting the events in the signal region after subtracting the background fit.
Background from other meson decays is determined from Monte Carlo simulations. The only channel found to contribute with at least one event is . After subtraction of the -decay background, events remain.
Each selection condition was studied to identify possible systematic effects on the branching ratio. The checks for systematic effects include identification, photon conversion and kinematic fit probability as described in Section VIII. None of these checks produces an effect with a significance exceeding 3, so a systematic error is not assigned. The systematic error included in the result comes from the 4% error assigned due to differences in the calibration and luminosity profiles of the two data taking periods, as well as the error determined by using different background fits.
The branching ratio relative to is obtained after correcting for the respective backgrounds and the final 3.3% acceptance for the signal channel:
This is only the second analysis of this channel to reach a finite value of the branching ratio. The result is compatible within errors to the previous analysis Ambrosino et al. (2011).
X
The decays and are driven by the same underlying mechanism, corresponding to anomalous terms in the QCD action. These anomalies are described by the Wess-Zumino-Witten Lagrangian, which contains two terms pertinent for the decays Wess and Zumino (1971); Witten (1983). The so-called “triangle” and “box” anomalies describe respectively the coupling of a pseudoscalar to two vectors and the coupling of a pseudoscalar to two pseudoscalars and one vector. The names are inspired by the shapes of the corresponding Feynman diagrams. The reaction is described at the lowest order of the chiral perturbation theory entirely by the box-anomaly. However, within the framework of the vector-meson dominance model, the triangle anomaly will dominantly contribute since the pair in -wave comes from the meson contribution.
Various theoretical approaches attempt to determine the relative contributions from these diagrams and in particular to predict the contribution of the box diagram for the two observables: the branching ratio and the shape of the invariant mass spectrum Petri ; Bijnens et al. (1990); Picciotto (1992); Benayoun et al. (2003); Venugopal and Holstein (1998); Holstein (2002); Borasoy and Nissler (2004); F. Stollenwerk, C. Hanhart, A. Kupsc, U.-G. Meißner and A. Wirzba (2012). The channel is the second most probable decay channel to charged particles with a branching ratio of Olive et al. (2014). It was studied by few experiments Thaler et al. (1973); Gormley et al. (1970); Lopez et al. (2007); Adlarson et al. (2012); Babusci et al. (2013). The two most recent results: from WASA-at-COSY (using the 2008 data) Adlarson et al. (2012) and from KLOE Babusci et al. (2013), provide the invariant mass spectrum with sufficient precision to see an influence of the box diagram contribution. The branching ratios normalized to the decay from CLEO Lopez et al. (2007) and KLOE Babusci et al. (2013) collaborations are significantly below previous values.
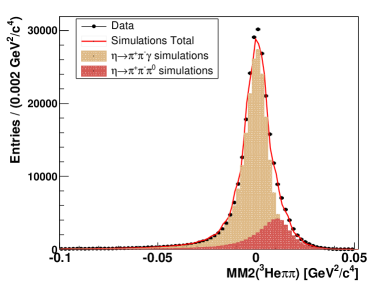
Events are selected with at least two oppositely-charged particles and one neutral particle fulfilling the kinematic fit requirement for the hypothesis. At this point the content of the peak in the MM spectrum is composed of 70% , with the remaining background mostly due to events where one photon is not detected. This contribution can be reduced by placing a condition on the missing mass squared of , , and , MM. For the signal channel the MM distribution peaks at zero, while for it peaks at the squared mass of the . Rejection of the events with MM GeV2/c4 increases the signal content of the peak to 91%. The effect of the cut and the impact of the remaining contribution is illustrated in Fig. 9. The experimental points correspond to the peak content determined from the MM distributions for each MM bin.
The non-resonant background comes predominantly from the reaction where a spurious photon is detected. Reduction of this contribution decreases both systematic error on the background fit and the statistical error of the final result. A major source of the spurious photons comes from so-called hadronic splitoffs. This happens when an interaction or a decay of one of the charged -mesons creates a secondary particle which leaves a signal in an isolated calorimeter module. In this case a spurious neutral cluster is reconstructed.
A condition to reduce the contribution of the splitoffs is applied for the photon candidates with low energy which are close to the expected impact point of the charged pion track in the calorimeter. The condition was optimized to minimize the statistical error of the extracted number of the signal events.

The MM distribution for the final selection is shown in Fig. 10. The background fit is performed using the methods described in Section VII and after subtraction of the contribution to the peak the number of signal events is .
No variation exceeding 3 for the checks due to kinematic fit probability, instantaneous luminosity, described in Section VIII, is observed. The calibration and luminosity comparison of the 2008 and 2009 data sets leads to assignment of 4% systematic uncertainty as in the analysis (see Section VIII). The continuous background subtraction is also investigated as for , with both polynomials and the methods from Section VII.
The two specific conditions are investigated separately:
-
Missing mass squared cut:
The cut was varied in steps in the region between the mass squared and the signal peak at zero.
-
Splitoffs:
The selection condition used to reject splitoffs was removed from the analysis chain and the result remains consistent.
The above two tests show that the conditions do not introduce systematic deviations and therefore overall systematic error is determined by the background subtraction and the difference between the two data sets.
The branching ratio normalized to :
XI
The decay is closely related to and corresponds to the conversion of the virtual photon leading to about a factor of suppression. Therefore the measurement of this branching ratio provides additional information on the mechanism contributing to the parent process, . However, the small decay probability () has made the channel difficult to detect until recently. The process has been observed by several experiments Bargholtz et al. (2007); Ambrosino et al. (2009); Akhmetshin et al. (2001); Grossman et al. (1966), but the only measurement of the branching ratio with statistical significance more than 3 is a recent result from the KLOE collaboration with 1555 events leading to a branching ratio of Ambrosino et al. (2009).
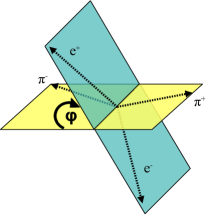
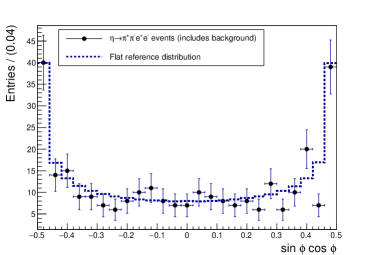
The channel is also interesting due to searches for a possible -violation mechanism outside of the Standard Model Gao (2002); Geng et al. (2002). It has been shown that a contribution to the decay amplitude from the -violating electric transition would result in a linear polarization to the virtual photon. A non-zero polarization of the virtual photon contributes to an asymmetry of the distribution of the angle, (the dihedral angle), between the electron and -meson decay planes in the meson rest frame Gao (2002). The angle is shown in Fig. 11. The asymmetry, , is defined as:
where is the number of the decays fulfilling the corresponding condition.
The theoretical upper limit for is determined by constraints on the strong -violation from neutron electric dipole moment measurements to be about 1% Gao (2002). A previous measurement from the KLOE collaboration of constrains the asymmetry to be less than a few percent Ambrosino et al. (2009).
The analysis follows the steps outlined in Section III using event candidates with at least two positive and two negative reconstructed tracks in the MDC. A unique aspect of this decay channel is that the final state contains both charged -mesons and leptons. The kinematic fitting assumes the hypothesis and all four possible mass assignments are tested. The events with probability above 0.1 for at least one of the combinations are accepted for the further analysis.
All four combinations for the selected events are evaluated according to the particle identification routine described in Section V. Additional information about decay angles between the oppositely-charged pairs is included in the algorithm. The angle between the leptons is expected to be small compared to the angle between the -mesons. This feature was previously used in Ref. Bargholtz et al. (2007). The simulations of the decay with the matrix element from Ref. Petri are used to determine the probabilities for the correct identification of the , , and pairs as a function of the opening angle. The angular information is added to the probabilities, again using Bayes’ equation, and the configuration with the highest probability is accepted. This method has been tested with simulations and the correct configuration is selected in over 90% of events.
A significant background comes from photon conversion in the reactions and . The conversion suppression introduced in Section VIII reduces the contribution of these channels to 5% of the peak in the MM distribution. The largest remaining background is from the decay chain, and constitutes 15% of the peak.
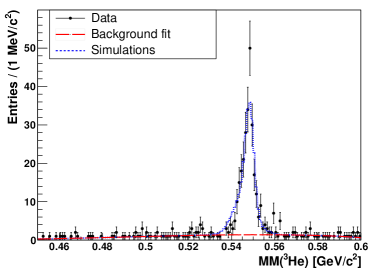
The missing mass distribution for events passing all selection conditions is shown in Fig. 12. After subtraction of all background channels there are signal events found in the combined data set.
Due to the high statistical error all of the systematic effects from the kinematic fit probability and photon conversion selection conditions were determined to be negligible. The 4% error due to differences in the 2008 and 2009 data periods was nevertheless included as determined from the higher statistics decays.
The systematic error on the final result is the same magnitude as the statistical error.
The angle between the and decay planes was determined for each event in the final event sample using a method presented from Ref. Ambrosino et al. (2009). The distribution for the selected data sample is shown in Fig. 13 and compared to a Monte Carlo simulation assuming a flat distribution. The data are divided into and sub-samples leading to the two MM distributions. Due to the low magnitude of the continuous background, the fit of the multi-pion background distribution uses a variety third and fourth order polynomials where the fit range and peak exclusion range are changed systematically. The peak content is obtained as the average value for the fits. The number of signal events in each class is obtained by integrating the peak after background subtraction, further subtracting background from other decay channels determined from simulations, and correcting the result for acceptance.
The same sources of systematic error were considered as for the branching ratio analysis. Only the error on the continuous background fit is included in the final results and it is determined by the standard deviation of the various fits. All other errors were insignificant compared to the statistical error.
The final result for the asymmetry:
XII Conclusion
| Channel | Branching Ratio |
|---|---|
| w.r.t. | |
The obtained results on the relative branching ratios relative to the normalization channel are summarized in Table 1. The deduced value for is . It is in good agreement with the older experiments Gormley et al. (1970); Thaler et al. (1973) but is 2.6 and 2.5 standard deviations above the recent values from CLEO Lopez et al. (2007) and KLOE Babusci et al. (2013) respectively.
The measured relative branching ratios can be translated to absolute branching ratios by using known world averages from Ref. Olive et al. (2014) for the branching ratios of and . The results are presented in Table 2.
The branching ratio for is consistent with the most recent Particle Data Group fit but it is more precise by 20%. The absolute branching ratios for and decays are in good agreement with the values reported by KLOE. Ambrosino et al. (2009, 2011)
The measured dihedral angle asymmetry, for has been determined to be consistent with zero: .
| Channel | Branching Ratio |
|---|---|
After the collection of data presented here, WASA-at-COSY has collected a high statistics data sample of mesons using the proton-proton production reaction. This new data set is particularly important for rare decay studies since an order of magnitude increase in the number of meson decay events is expected. The background to signal ratio and the detector resolution are comparable to the presented data.
Acknowledgements.
This work was supported in part by the EU Integrated Infrastructure Initiative HadronPhysics Project under contract number RII3-CT-2004-506078; by the European Commission under the 7th Framework Programme through the ’Research Infrastructures’ action of the ’Capacities’ Programme, Call: FP7-INFRASTRUCTURES-2008-1, Grant Agreement N. 227431; by the Polish National Science Centre through the Grant No. 0320/B/H03/2011/40, 2013/11/N/ST2/04152, 2011/03/B/ST2/01847, and the Foundation for Polish Science (MPD). We gratefully acknowledge the support given by the Swedish Research Council, the Knut and Alice Wallenberg Foundation, and the Forschungszentrum Jülich FFE Funding Program of the Jülich Center for Hadron Physics. This work is based on the PhD theses of Daniel Coderre, Małgorzata Hodana and Patrick Wurm.References
- Olive et al. (2014) K. Olive et al. (Particle Data Group), Chin.Phys. C38, 090001 (2014).
- (2) H.-H. Adam et al. (WASA-at-COSY Collaboration), arXiv:nucl-ex/0411038 .
- Bilger et al. (2002) R. Bilger et al., Phys.Rev. C 65, 044608 (2002).
- Rausmann et al. (2009) T. Rausmann et al. (ANKE Collaboration), Phys. Rev. C 80, 017001 (2009).
- Bargholtz et al. (2008) C. Bargholtz et al. (CELSIUS/WASA Collaboration), Nucl. Instrum. Methods A 594, 339 (2008).
- Frohlich et al. (2007) I. Frohlich et al., PoS ACAT2007, 076 (2007).
- Adlarson et al. (2014a) P. Adlarson et al. (WASA-at-COSY Collaboration), Eur.Phys.J. A50, 100 (2014a).
- Amsler et al. (1995) C. Amsler et al. (Crystal Barrel Collaboration), Phys. Lett. B 346, 203 (1995).
- (9) T. Petri, arXiv:1010.2378 [nucl-th] .
- Landsberg (1985) L. Landsberg, Physics Reports 128, 301 (1985).
- Brun et al. (1994) R. Brun, F. Carminati, and S. Giani, “GEANT Detector Description and Simulation Tool,” (1994), CERN-W5013.
- Ekstrom et al. (1996) C. Ekstrom et al. (WASA Collaboration), Nucl. Instrum. Meth. A 371, 572 (1996).
- Coderre (2012) D. Coderre, PhD Thesis, Ruhr University Bochum, 2012 (2012).
- Brun and Rademakers (1997) R. Brun and F. Rademakers, Nucl. Instrum. Meth. A 389, 81 (1997).
- Ambrosino et al. (2009) F. Ambrosino et al. (KLOE Collaboration), Phys. Lett. B 675, 283 (2009).
- Adlarson et al. (2014b) P. Adlarson et al. (WASA-at-COSY Collaboration), Phys. Rev. C 90, 045207 (2014b).
- Berghauser et al. (2011) H. Berghauser et al., Phys. Lett. B 701, 562 (2011).
- Aguar-Bartolomé et al. (2014) P. Aguar-Bartolomé et al. (A2 Collaboration at MAMI), Phys. Rev. C 89, 044608 (2014).
- Akhmetshin et al. (2001) R. Akhmetshin et al. (CMD-2 Collaboration), Phys. Lett. B 501, 191 (2001).
- Achasov et al. (2001) M. Achasov et al., Phys. Lett. B 504, 275 (2001).
- Berlowski et al. (2008) M. Berlowski et al. (CELSIUS/WASA Collaboration), Phys.Rev. D 77, 032004 (2008).
- (22) R. Barlow, arXiv:0207026 [hep-ex] .
- Ambrosino et al. (2011) F. Ambrosino et al. (KLOE-2 Collaboration), Phys. Lett. B 702, 324 (2011).
- Wess and Zumino (1971) J. Wess and B. Zumino, Phys. Lett. B 37, 95 (1971).
- Witten (1983) E. Witten, Nucl. Phys. B 223, 422 (1983).
- Bijnens et al. (1990) J. Bijnens, A. Bramon, and F. Cornet, Phys. Lett. B 237, 488 (1990).
- Picciotto (1992) C. Picciotto, Phys. Rev. D 45, 1569 (1992).
- Benayoun et al. (2003) M. Benayoun, P. David, L. DelBuono, P. Leruste, and H. O’Connell, Eur. Phys. J. C 31, 525 (2003).
- Venugopal and Holstein (1998) E. Venugopal and B. Holstein, Phys. Rev. D 57, 4397 (1998).
- Holstein (2002) B. Holstein, Phys. Scr. T 99, 55 (2002).
- Borasoy and Nissler (2004) B. Borasoy and R. Nissler, Nucl. Phys. A 740, 362 (2004).
- F. Stollenwerk, C. Hanhart, A. Kupsc, U.-G. Meißner and A. Wirzba (2012) F. Stollenwerk, C. Hanhart, A. Kupsc, U.-G. Meißner and A. Wirzba, Phys. Lett. B 707, 184 (2012).
- Thaler et al. (1973) J. Thaler, J. Appel, A. Kotlewski, J. Layter, W. Lee, and S. Stein, Phys. Rev. D 7, 2569 (1973).
- Gormley et al. (1970) M. Gormley, E. Hyman, W. Lee, T. Nash, J. Peoples, C. Schultz, and S. Stein, Phys. Rev. D 2, 501 (1970).
- Lopez et al. (2007) A. Lopez et al. (CLEO Collaboration), Phys. Rev. Lett. 99, 122001 (2007).
- Adlarson et al. (2012) P. Adlarson et al., Phys. Lett. B 707, 243 (2012).
- Babusci et al. (2013) D. Babusci et al. (KLOE Collaboration), Phys.Lett. B 718, 910 (2013).
- Bargholtz et al. (2007) C. Bargholtz et al. (CELSIUS/WASA Collaboration), Phys. Lett. B 644, 299 (2007).
- Grossman et al. (1966) R. Grossman, L. Price, and F. Crawford, Phys. Rev. 146, 993 (1966).
- Gao (2002) D. Gao, Mod. Phys. Lett. A 17, 1583 (2002).
- Geng et al. (2002) C. Q. Geng, J. N. Ng, and T. H. Wu, Mod. Phys. Lett. A 17, 1489 (2002).