Vol.0 (200x) No.0, 000–000
22institutetext: Pushkov Institute of Terrestrial Magnetism, Ionosphere and Radio Wave Propagation, Russian Academy of Sciences (IZMIRAN), Troitsk, Moscow region, 142190, Russia
33institutetext: Yunnan Observatories, Chinese Academy of Sciences, Kunming 650011, China
44institutetext: Institute of Solar-Terrestrial Physics, Russian Academy of Sciences, Siberian Branch, Irkutsk 664033, Russia
55institutetext: Astronomical Institute of the Academy of Sciences of the Czech Republic, Ondrejov 15165, Czech Republic
Flare processes evolution and polarization changes of fine structures of solar radio emission in the April 11, 2013 event
Abstract
The measurement of positions and sizes of radio sources in the observations of solar radio spectral fine structures in an M6.5 flare on April 11, 2013 were observed simultaneously by several radio instruments at four different observatories: Chinese Solar Broadband Radio Spectrometers at Huairou (SBRS/Huairou), Ondřejov Radio spectrograph in the Czech Republic (ORSC/Ondřejov), Badary Broadband Microwave spectropolarimeter (BMS/Irkutsk), and spectrograph/IZMIRAN (Moscow, Troitsk). The fine structures include microwave zebra patterns (ZP) fast pulsations, and fibers. They were observed during the flare brightening located at the tops of a loop arcade as shown in images taken by the extreme ultraviolet (EUV) telescope on board NASA’s satellite Solar Dynamics Observatory (SDO) images. The flare occurred at 06:58 - 07:26 UT in solar active region NOAA 11719 located close to the solar disk center. ZP appeared near high frequency boundaries of the pulsations, and their spectra observed in Huairou and Ondřejov agreed with each other in terms of details. At the beginning of the flare impulsive phase, a strong narrowband ZP burst occurred with a moderate left-handed circular polarization. Then a series of pulsations and ZPs were observed almost in an unpolarized emission. After 07:00 UT a ZP appeared with a moderate right-handed polarization. In the flare decay phase (at about of 07:25 UT), ZP and fiber bursts become strongly right-hand polarized. BMS/Irkutsk spectral observations indicated that the background emission showed left-handed circular polarization (similar to SBRS/Huairou spectra around 3 GHz in). However, the fine structure appeared in the right-handed polarization. The dynamics of the polarization was associated with the motion of the flare exciter, which was observed in EUV images at 171 Å and 131 Å by the SDO Atmospheric Imaging Assembly (AIA). Combining magnetograms observed by the SDO Helioseismic and magnetic Imager (SDO/HMI) with the homologous assumption of EUV flare brightenings and ZP bursts, we deduced that the observed ZPs correspond to the ordinary radio emission mode. However, future analysis needs to verify the assumption that zebra radio sources are really related to a closed magnetic loop, and are located at lower heights in the solar atmosphere than the source of pulsations.
keywords:
Sun: activity - Sun: flares - Sun: particle emission - Sun: radio radiation- zebra-pattern1 Introduction
Zebra structure (zebra or zebra pattern - ZP) is the most intriguing fine structure in the dynamic spectra of solar and stellar radio bursts. It consists of several almost parallel stripes in emission and absorption against the background of the solar radio broadband type IV continuum emission. In particular, the microwave ZP supplies original information about the flaring source region where the primary energy is released, such as the magnetic fields, particle acceleration and plasma instabilities. The nature of ZP structures has remained a subject of wide discussion for more than 40 years. More than ten radio emission mechanisms were proposed for its explanation. The statistics and classification of the microwave ZPs were presented recently (Tan et al. 2014a). The history of observations and of theoretical models were assembled in reviews by Chernov (2006), Zlotnik (2009) and Chernov (2011). Most often in the literature, the mechanism based on a double plasma resonance (DPR) is discussed (Kuijpers, 1975; Zheleznykov and Zlotnik, 1975a,b; Kuijpers (1980); Mollwo, 1983; 1988; Winglee and Dulk, 1986). It assumes that the upper hybrid frequency () in the solar corona becomes resonant at a multiple of the electron-cyclotron frequency:
| (1) |
where -electron plasma frequency, - electron cyclotron frequency and s- integer harmonic number. This mechanism experiences a number of problems with the explanation of the dynamics of zebra stripes.
Chernov (1976; 1990) proposed an alternative mechanism for ZP: the coalescence of plasma waves () with whistlers , (Kuijpers, 1975). In this unified model the formation of ZP was attributed to the oblique propagation of whistlers, while the formation of stripes with a stable negative frequency drift (the fiber bursts) was explained by the ducted propagation of whistlers along a magnetic trap. This model explains not only some thin effects (sharp changes in frequency drift, a large number of stripes, frequency splitting of stripes, and superfine millisecond structure) but the occasionally observed transformation of the ZP stripes into fibers and vice versa, and also the synchronous variations in the frequency drift of stripes with the spatial drift of the radio sources. However, a certain boom of new models has been proposed (see more details Chernov (2006; 2014). The most crucial parameter for selecting the theoretical mechanism is the polarization of radio radiation in combination with radio source structure. The polarization mode is only defined when the probable radio source position can be identified on magnetograms. In most cases the ordinary wave mode was found for ZP, fiber bursts and fast radio pulsations. The model of ZP in conditions of the double plasma resonance (DPR) (Zlotnik, 2009) proposes the ordinary wave mode, and radio source must be stationary. In the model with whistlers (Chernov, 2006) the radio emission of ZP and fiber bursts is also related to the ordinary mode but the radio source should be moving. However in an event on 23 January 2003, Altyntsev et al. (2005) found an extraordinary mode using positional observations, therefore they related ZP with the mechanism of Bernstein modes.
So far, solar cycle 24 has shown a lack of major flares. However, small flares presented a number of enigmas in radio emission with fine structures. Among several recent events, the most interesting is the M 6.5 flare that occurred at 06:58 - 07:26 UT on April 11, 2013.
In this event, we observed a very rare case of changes in the polarization of the radio fine structure together with simultaneous observations of the flare dynamic process using SDO/AIA at several EUV lines (Pesnell et al. 2012; Leven et al. 2012), in hard X- ray images from the Ramaty High Energy Solar Spectroscopic Imager (RHESSI) (Hurford et al. 2002; Krucker, Lin, 2002) and SDO/HMI magnetograms (Schou et al. 2012). During this event, the polarization was different in each appearance of the fine structure and even had different signs.
Thus, this event offers a very exceptional possibility to determine the radio emission wave mode of ZPs. We will use the classical definition of the radio emission mode in radio physics and radio astronomy: the rotation of the electric vector of the extraordinary wave mode coincides with the direction of rotation of electrons in the magnetic field on the right spiral (clockwise rotation when viewed along the positive field). Thus, right handed circular polarization above positive (North) magnetic polarity corresponds to the extraordinary wave mode, and is left handed with respect to the ordinary one. So, we could use a simple abbreviation for the emission modes: RoS, LeS, ReN and LoN, where R and L are Right and Left signs of the polarization respectively, S and N are magnetic polarities, and o and e are ordinary and extraordinary wave modes respectively.
2 Observations
2.1 General data
For the first time, there are several radio telescopes at four different observatories that observed the radio bursts of a flare event simultaneously on 2013 April 11 (07:00 – 07:26 UT). These telescopes include: Chinese Solar Broadband Radio Spectrometers at Huairou (SBRS/Huairou), Ondřejov Radio Spectrographs in the Czech Republic (ORSC/Ondřejov), Badary Broadband Microwave Spectropolarimeter (BMS/Irkutsk), and spectrograph/IZMIRAN. SBRS/Huairou, spectrographs/Ondrejov, spectrograph/Badary, and spectrograph/IZMIRAN.
We used broadband spectrograms of: the SBRS/Huairou in the range 2.60 - 3.80 GHz (with an antenna diameter of 3.2 m, cadence of 8 ms, frequency resolution of 10 MHz, Fu et al (1995; 2004)); high frequency part of ORSC/Ondřejov (Jiricka et al, 1993) at frequencies of 2.00 - 5.00 GHz with a frequency resolution of 12 MHz and time resolution of 10 ms in total radio flux; the broadband microwave spectropolarimeters Badary in the range 4.0-7.0 GHz with resolutions 100 MHZ and 20 ms (Zhdanov and Zandanov 2011); spectrograph/IZMIRAN in the meter range 25 - 270 MHz (Gorgutsa et al. 2001).
The whole flare process on April 11, 2013 took place in solar active region NOAA 11719 which was located very close to the center of the solar disk (N09E12). It was a two-ribbon M6.5 flare that started at 06:58 UT, reached its maximum at 07:16 UT, and ended at 07:26 UT.
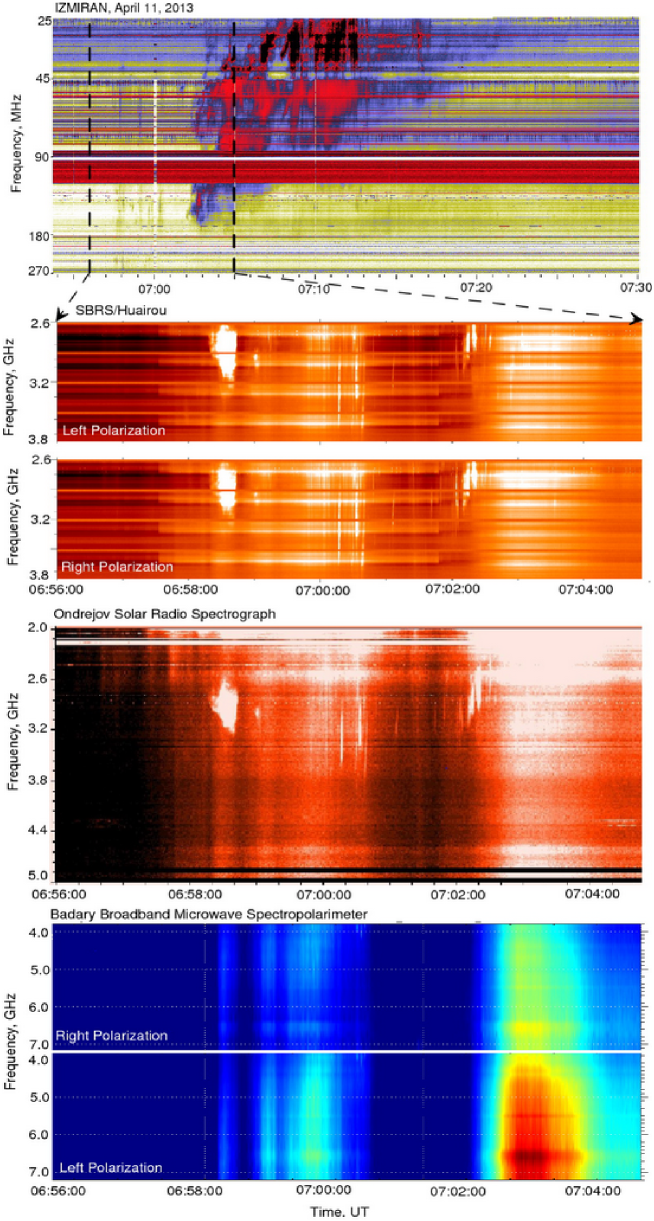
Tan et al. (2014b) reported the first ZP burst which appeared in a strong narrow band burst around 3 GHz at the beginning of the flare (06:58:30 UT) (see middle panels of Figure 1 observed by the SBRS/Huairou and ORSC/Ondrejov). Furthermore, ZP was observed to accompany to all consecutive pulsations. According to the observation data obtained by BMS/Irkutsk in the range 4 - 7 GHz, the continuum radio emission was strongly left-handed polarized (bottom spectrum in Figure 1). The radio burst began almost simultaneously in meter and centimeter ranges: a strong type II burst began at 07:02 UT after a group of type III bursts at 06:57 UT (top IZMIRAN’s spectrum in Figure 1). There was no strong continuum emission with any fine structure in the meter range. It is possible that the magnetic force lines were open (not a magnetic trap) after the observed ejection of CME. According to the catalog data of SOHO/LASCO C2, the extrapolated straight line in the diagram of height- time for this CME (of halo type) notes the beginning of a disturbance at 06:50 UT. Approximately at the same moment it is possible to trace the beginning of ejection in the EUV coronal lines 171 Å and 195 Å. Therefore a corresponding shock wave could be driven by the CME front. The beginning of the event and related instrumentations were described by Tan et al. (2014).
The two top panels in Figure 2 show two images in hard X- ray observed by RHESSI. In the preflare phase, the hard X- ray source had a loop configuration composed of three parts: two footpoint sources and one looptop source. However, near the flare maximum only the looptop source remains, like a loop arcade. Such a change in the source structure is very typical for the magnetic reconnection. The brightest flare kernels indicate the locations of maximal acceleration of fast particles.
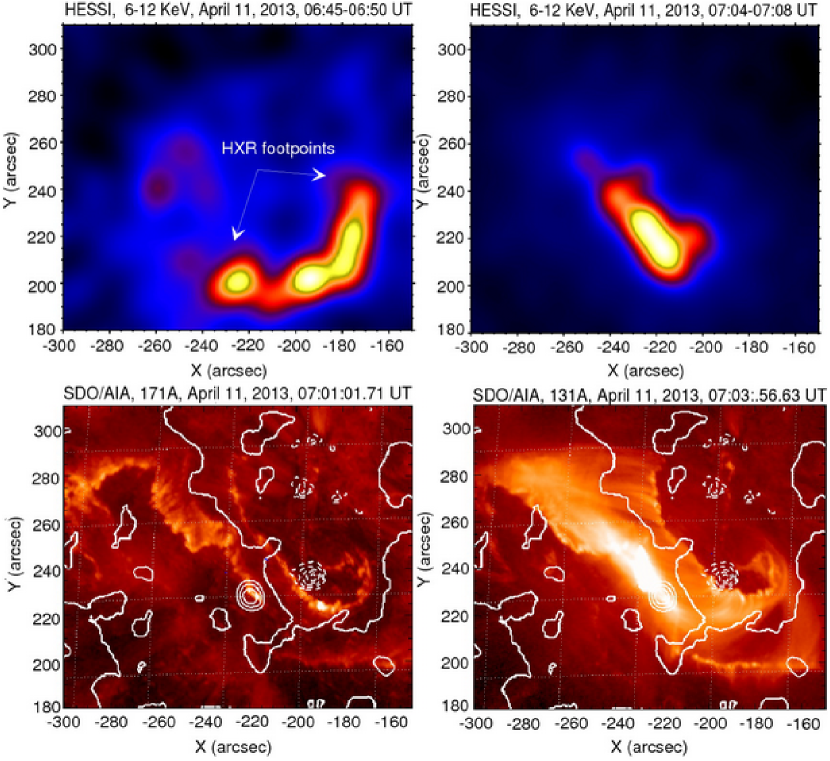
Two bottom panels in Figure 2 show the position of the two flare ribbons visible in two lines of SDO/AIA 171 Å (coronal temperature K) and 131 Å (hot plasma K) against the background of the SDO/ HMI magnetogram in the impulsive phase of the flare (the leading spot with South magnetic polarity is shown by the dotted line). The cadence of HMI data is of 45 s. The main feature of this flare is that flare brightenings arose alternately in both flare ribbons located on opposite sides of the neutral magnetic line (white thick solid line in Figure 2). The right frame in the hot line 131 Å shows that around 07:03:56 UT the maximum energy release taken place in the left flare ribbon in North magnetic polarity.

Radio intensity profiles and the profiles at several EUV lines are shown in Figure 3. According to GOES data the maximum of the event happened in soft X- ray around 07:17 UT but in radio emission at 2.87 GHz was around 07:10 UT. The first strong ZP burst occurred just at the beginning of the flare (Figure 4). Tan et al. (2014) described it and correlated it with a sudden EUV flash observed by SDO/AIA images. However, in several subsequent radio maxima (see profiles in Figure 3) many complex fine structure elements were observed with complex behavior in the polarization, although with less intensity.
The polarization value was very variable and even had different signs. As show RCP and LCP channels of SBRS/Huairou in middle panels in Figure 1, the polarization of the strong burst at the beginning, after 06:58:30 UT was moderate left-handed, but the subsequent pulsations after 07:00 and 07:02 UT had moderate right-handed polarization. In the absence of positional radio data, we use SDO/AIA EUV images at a cadence of 12 s and pixel size of at seven EUV wavelengths, and sometimes they coincided very well with moments of the fine structure. In such cases we propose that the radio source in microwaves could be located above these new flare kernels in EUV images. We could also compare these locations with SDO/HMI magnetograms (Figure 2) to determine the radio wave mode.
2.2 Radio spectral fine structures and dynamics of flare processes
The first ZP (Figure 4) occurs just at the beginning of the flare in the strong narrowband burst around 2.9 GHz shown in the spectrum of ORSC/Ondřejov in Figure 1. Its maximum emission flux at 06:58:30 UT was very strong, it exceeded the background flaring continuum intensity by several times (Figure 3 and 4). Tan et al. (2014) showed that this ZP was simultaneously observed with ORSC/Ondrejov spectrograph and all details (stripe separations, brightness, duration, the arched shapes of each stripe and the spiky super structure) are strictly identical to the spectrogram obtained by SBRS/Huairou. The middle panel in Figure 4 shows moderate left-handed polarization, of . The bottom-left panels in Figure 4 show a strong new flare kennel in the left flare ribbon (marked by an arrow) in the image of the Fe IX line at 171 Å with a coronal temperature around K. From the images of a hot line at 131 Å (right panel in Figure 4) we can also see the appearance of hot plasma (around K) in the same place (marked by an arrow). Profiles in Figure 3b only show rising intensity of this line. Moderate Left polarization can be explained by a bright flare core in the left flare ribbon in the North magnetic polarity (ordinary wave mode).
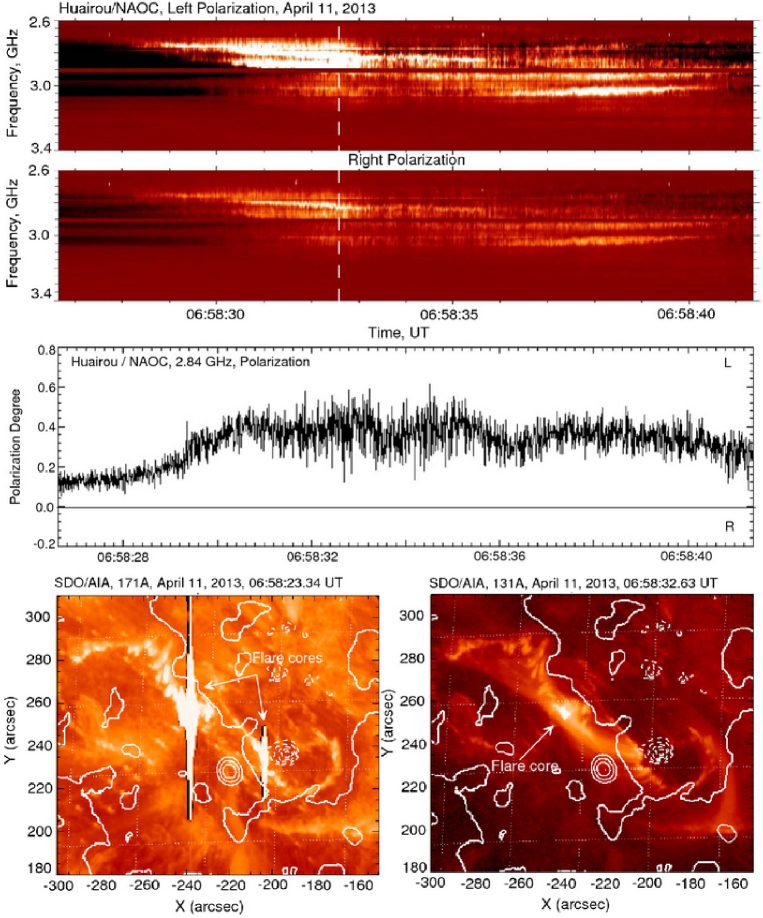
.
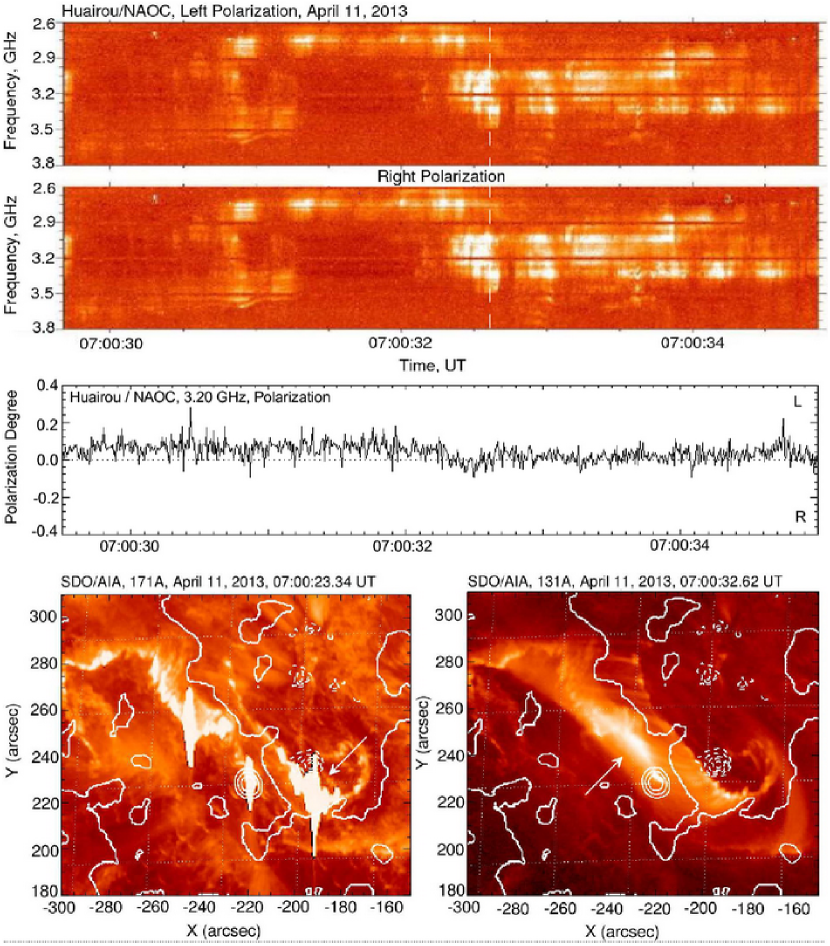
Two minutes after this first ZP, a series of pulsations with ZP of five second duration were observed (Figure 5) but almost five times less intensity (see profiles in Figure 3a). However, the main distinction from the first ZP is changing of the polarization sign at the time of 07:00:32.2 UT (from left- to right-handed) and further small oscillations about zero level of . The level of a continuum is subtracted with the polarization calculation, therefore in the absence of a strong signal the error of polarization calculation increases. Such errors are removed by a digital filter. We can see enough narrow band pulsations with a periodicity of about 0.5 s, which are accompanied by several stripes in the form of ZP at their high frequency edge. ZP stripes (two or five) are absent between pulsations, therefore a relation exists between sources of pulsations and ZP
The bottom left panel of Figure 5 in the passband of 171 Å shows that the flare kernels in the left flare ribbon decreased but increased in the right ribbon (marked by an arrow), and in the hot plasma image at 131 Å (right panel) a new flare feature appeared between the flare ribbons (marked by an arrow). It is evident from the movie frames that at the moment the main flare source appeared, a loop arcade was located at the top between the flare ribbons. Thus, the source was found to be shifted to the leading spot of South magnetic polarity and this explains the weak polarization that even have an opposite Right- handed sign (which corresponds to the ordinary wave mode).
About 40 s after the pulsations with ZP, new clear stripes of ZP appeared (Figure 6). The polarization profile shows very weak Right-handed polarization of 10%. Although several new bright points appeared in both flare ribbon at 171 Å image (i.e. in the footpoints of the loop arcade shown by arrows), the bright tops of the arcade in the hot 131 Å image became broader, which shows the place with maximal energy release. In that case it does not make sense to estimate the wave mode. The frequency separation between ZP stripes grows with frequency from 60 to 90 MHz.
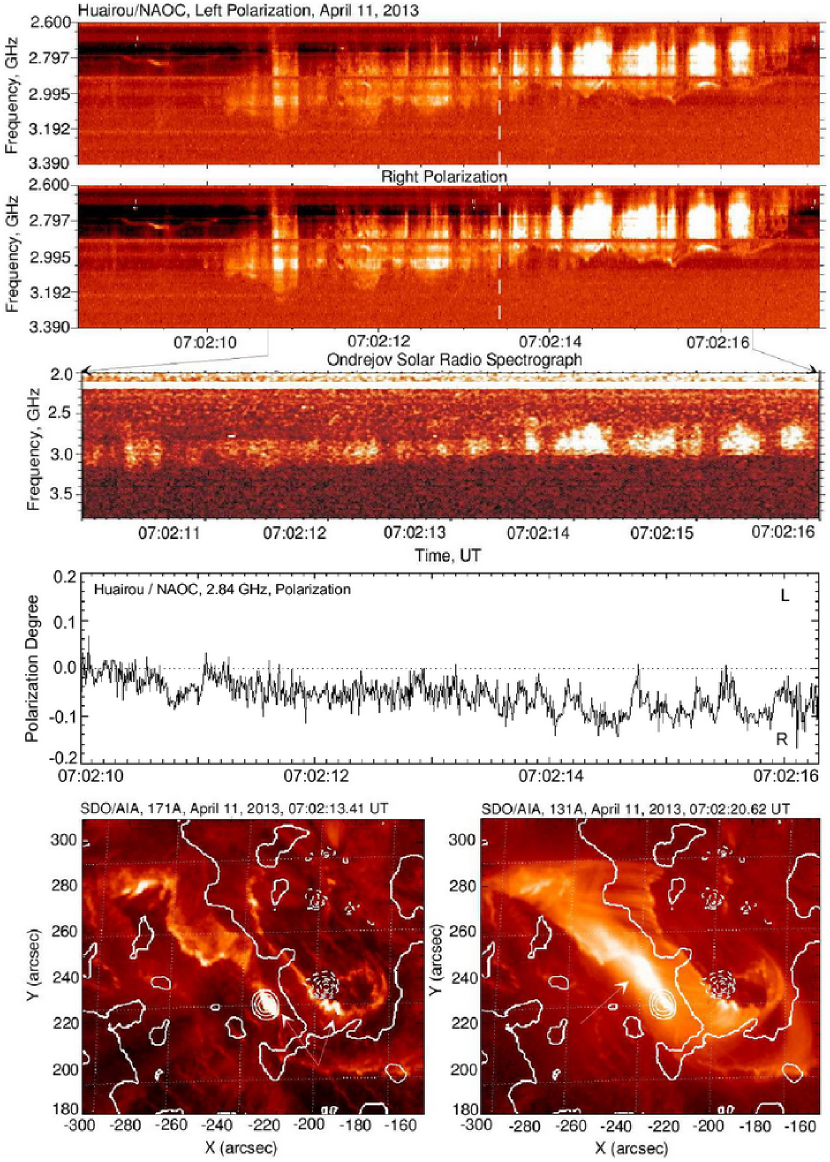
One minute later, at 07:02:10 UT the most significant parts of spectra from this event appear, and once more there are pulsations with ZP in their high frequency edge (Figure 7). The emission is limited to high frequencies by several zebra stripes. As the left panel in 171 Å shows, in the left flare ribbon the flare kernels decreased and we see two bright and approximately identical features in the footpoints of the arcade shown by arrows. The movie in the chromospheric images at 1600 Å shows that a new disturbance began in the right flare ribbon. According to the right frame in 131 Å with hot plasma at the top of the flare arcade, the flare expanded in the south-west direction (marked by an arrow) along both the flare ribbon above the south magnetic polarity. Weak Right polarization above the south magnetic polarity corresponds to the ordinary wave. The radio source of ZP is possibly related to a closed magnetic loop, lower than the source of pulsations as well as for the first similar structure that appears in Figure 5.

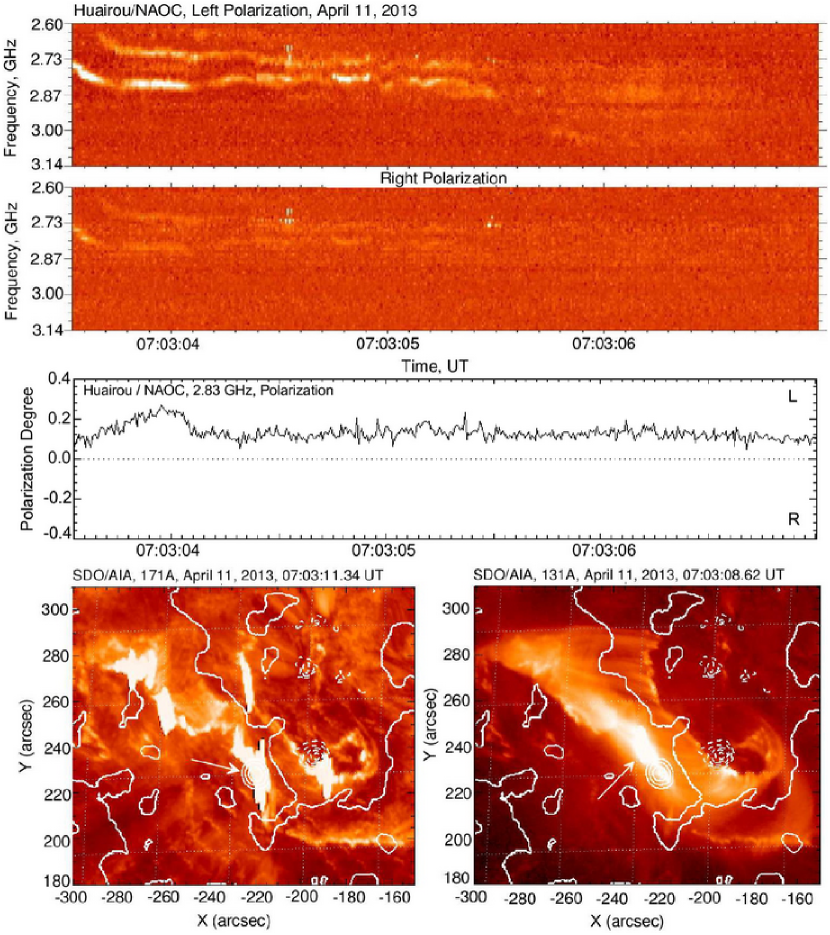
Unlike Figure 5, these pulsations have, in addition to a period of about 0.5 s, an additional short period of about 0.15-0.20 s. The bandwidth of pulsations of about 400 MHz remains more or less the same, but pulsations slightly drift to lower frequencies. All these peculiarities coincide with the fine structures in the Ondřejov spectrum. Figure 7 also shows that the emission is absent at frequencies higher than 3.3 GHz. However, a reduction in the continuum emission at lower frequencies began more than one minute before, at 07:01 UT (see Figure 1). One minute after the pulsation, at 07:03:03 UT a new ZP appeared with strong Left-handed polarization (Figure 8). New flare brightening occurred at 171 Å in the left flare ribbon (marked by an arrow) above the North magnetic polarity, and the bright arcade in 131 Å also shifted to the left ribbon (marked by an arrow). Moderate Left-handed polarization (about of 25%) above the North magnetic polarity corresponds to the ordinary wave mode.
In the decay phase (after 07:16 UT to approximately 07:25 UT), the zebra and fiber bursts appeared with strong right handed polarization (see bottom profiles in Figure 3a). The flare area expanded to the right flare ribbon (to the South magnetic polarity). The ordinary radio emission mode remains. The movie in 131 Å after 07:00 UT with enhanced magnetic loops shows a restructuring of loops throughout the flare ribbons. The reconnection continues in the middle part of the flare ribbons, and the hot plasma () covered the largest part of the flare area around 07:04:20 UT (the maximum of the intensity profile for the 131 Å line in Figure 3b). During this interval, the movie also shows a rain of matter falling downwards, possibly after the first ejection around 06:50 UT.
According to spectral data from Badary, the continuum emission has strong Left handed polarization (see Figure 1). However, sometimes we see the small bursts with Right handed polarization as is shown in Figure 9. Double bursts have a moderate Right-handed polarization (middle panel), and the polarization of the background continuum is at a noisy level because the continuum emission is subtracted with the calculation of polarization. In frame 171 Å (coinciding with the time of the radio bursts) the two bright points appeared in the right flare ribbon. The frame of the chromospheric line at 1600 Å shows that a fast disturbance was really initiated in the same place above the South magnetic polarity, and the radio emission can be related to the ordinary wave mode. Large flare areas in the left ribbons shown by arrows in the bottom panels were more long-lived and they could be responsible for the continuum emission that had Left-handed polarization.
Thus fast changes in the polarization were related to the dynamic motion of the flare cores between flare ribbons. In all possible cases (when the polarization was remarkable), we found that the polarization of the observed radio fine structures corresponds to the ordinary radio emission mode.

3 DISCUSSION
The study of a short radio burst with rich fine structures on 13 April 2013 showed that each new radio maximum was related to a new flare brightening seen in EUV images of SDO/AIA. Each radio maximum has its own fine structures, usually composed of several stripes of ZP or ZP in the high frequency edge of fast pulsations. Such a relation indicates there is a close connection between radio sources of pulsations and ZP. The movie of SDO/AIA in 131 Å showed a flare loop arcade forming between two sigmoid flare ribbons. Therefore the flare dynamics consisted of consecutive magnetic reconnections in different arcade loops.
The polarization changed in accordance with the position of the new flare brightening. The left flare ribbon was located above the North magnetic polarity (tail spot) and the right ribbon above the South magnetic polarity (leading spot). In all cases, the radio emission mode remained the ordinary one. When the brightening took place at the looptops, the polarization was very weak, almost zero.
The magnetic field remained stable during the event. In the same time it was improbable to propose a motion of the radio source from one flare ribbon to another one during several seconds. Similar explanation of a gradual changing of the polarization sign at 17 GHz (Nobeyama data) was proposed by Huang and Lin, 2006.
Only a question arises: why we receive only a partial degree of polarization? If the emission is generated at the fundamental (by some mechanism) as the ordinary mode, it is fully polarized in the source. During propagation of the radio waves the observed polarization degree is changed due to a depolarization effect. The depolarization happens in a layer where the radio emission is propagated exactly across the magnetic field. In the considered event, the source geometry (the flare occurred at the disk centre) allows that this condition is possibly satisfied for a ZP source in a closed magnetic trap (for more details see Chernov, Zlobec (1995)). The emission of fast radio pulsations is probably caused by fast electrons accelerated in the upward direction in a vertical current sheet with the same period during magnetic reconnection. Some of the fast particles that are accelerated downward can be captured in a closed magnetic trap and they could be responsible for the emission of ZP by some single mechanism. The diversity of ZP stripes is probably given by different conditions in different arcade loops. This is natural scheme of flare processes which is in accordance with the standard model of the solar flare as it is shown in Figure 10.

Such an expected position of a microwave ZP source at tops of flare magnetic loops was also confirmed in a new paper by Yasnov and Karlický (2015) in results of estimation of bremsstrahlung and cyclotron absorptions of radiation in the corona.
We do not have any convincing evidence that the mechanism, generated ZP, is the emission of Bernstein modes as this was proposed by Tan et al. (2014) for the first strong ZP. First, an exact definition of the frequency separation between three (and sometimes four) zebra stripes is too problematic. Second, the polarization should be related to the extraordinary emission mode (Zlotnik, 1976; Kuznetsov, 2005). Third, we do not have any information about size of the radio source with height in the corona (distributed or point like). Else, the radio emission defined by Bernstein modes must be weak, much weaker than in other mechanism, i.e., in the double plasma resonance (Zlotnik, 2009) or interaction of Langmuir waves with whistlers (Chernov, 2006). In both of the last models, the radio source should be distributed in heights, but in the double plasma resonance model a source should be stationary and in the whistler model – moving (depending on the group velocity of the whistler wave) (for more details see Chernov, Yan and Fu (2014). Furthemore, the spatial drift of ZP stripes should change synchronously with the changes of frequency drift in the dynamical spectrum.
Recently, more than ten other mechanisms were proposed for ZP, but their significance remains uncertain (Chernov et al. 2014). To choose which mechanism applies, positional observations may be crucial, and it is desirable to observe a limb event. Now, we are expecting progress in the field of solar radio imaging spectroscopy. The first trial observations began on the new Chinese spectral radioheliograph (CSRH) which will be the largest and most advanced radio imaging telescope for the solar corona in the world (Yan et al. 2009; Yan et al. 2013).
4 Conclusions
We have shown that the polarization of ZP corresponds to the ordinary wave mode and it changes in accordance with dynamics of flare processes. Simultaneous or consecutive appearance of zebra-structure in different frequency ranges is obviously connected with the dynamics of flare processes.
A future analysis needs to clarify whether a radio source showing ZP is really related to a closed magnetic loop, and if it is located at lower altitudes than the source of the pulsations, as expressed on the radio spectrum by ZP at the high frequency boundary of pulsations. New solar radio spectral imaging observations should help to compare the source sizes of different fine structures, and the main thing to determine whether the radio source does move.
In the whistler model radio sources of fiber bursts and ZP are moving, and the spatial drift of ZP stripes should change synchronously with changes of the frequency drift in the dynamical spectrum. In the model of double plasma resonance, the ZP source must be rather stationary.
It should be noted that the relative significance of several recent possible mechanisms remains uncertain.
Acknowledgements.
The authors are grateful to the RHESSI, SOHO (LASCO/EIT) and SDO teams for operating the instruments and performing the basic data reduction, and especially, for the open data policy. The research that was carried out by G.P. Chernov at National Astronomical Observatories (NAOC) was supported by the Chinese Academy of Sciences Visiting Professorship for Senior International Scientists, grant No. 2011T1J20. The work of R. Sych was funded by Chinese Academy of Sciences President’s International Fellowship Initiative, grant No. 2015VMA014. This work is supported by the Russian Foundation for Basic Research under Grants: 13-02-00044, 13-02-90472, 14-02-91157 and 14-02-00367; NSFC grants: 11273030, 11103044, 11103039, 11221063, 11373039 and 113111042; MOST grant 2011CB811401; the National Major Scientific Equipment R&D Project ZDYZ2009-3; and grant P209/12/00103 (GA CR).References
- (1) Altyntsev, A.T., Kuznetsov, A.A., Meshalkina, N.S., Rudenko, G.V., Yan Yihua, 2005, A&A., 431, 1037 Aschwanden M.J. 2004, Physics of the Solar corona. An introduction, Springer, Chichester, UK Aschwanden M.J. 2006, The standart model of a flare, ppt presentation at AIA/HMI workshop, Monterey 2006 Chernov, G.P. 1976, Sov. Astron. 20, 582 Chernov, G.P. 1990, SoPh, 130, 75 Chernov, G.P., 2006, Space Sci. Rev. 127, 195 Chernov, G.P., and Zlobec, P., 1995, SoPh, 160, 79 Chernov, G.P., Fomichev, V.V Tan, B,L., Yan, Y.H, Tan, C.M., Fu. Q.J., 2014, SoPh, 290, 95 Chernov, G.P., Yan, Y.H, Fu. Q.J., 2014, Research in A&A, 14, 7, 831. Chernov, G.P. 2011, Fine Structure of Solar Radio Bursts, Springer ASSL375, Springer, Heidelberg Fu, Q.J., Qin, Z.H., Ji, H.R., and Pei, L., 1995, SoPh, 160, 97 Fu, Q.J., Ji, H.R., Qin, Z.H. et al., 2004, SoPh, 222, 167 Gorgutsa R. V., Gnezdilov A. A., Markeev A. K., Sobolev D. E., 2001, Astronomical and Astrophysical Transactions, 20, 547 Huang G., and Lin J. 2006, ApJ, 639, L99 Hurford, G. J., Schmahl, E. J., Schwartz, R. A., Conway, A. J., Aschwanden, M. J. et al. 2002, The RHESSI Imaging Concept, SoPh, 210, 61 Jiricka K., Karlický M., Kepka O., and Tlamicha A., 1993, SoPh, 147, 203 Krucker, S, Lin, R.P. 2002, SoPh, 210, 229 Kuijpers, J. 1975, Collective wave-particle interactions in solar type IV radio source, Ph.D Thesis, Utrecht University Kuijpers, J. 1980, in M.R.Kundu and T.E.Gergely (eds), Theory of type IV dm Bursts, Radio Physics of the Sun, p. 341 Kuznetsov, A. A., 2005, A&A, 438, 341 Lemen J. R., Title, A. M., Akin, D.J., et al. 2012, The Atmospheric Imaging Assembly (AIA) on the Solar Dynamics Observatory (SDO), SoPh, 275,17. Mollwo, L. 1983, SoPh, 83, 305 Mollwo, L. 1988, SoPh, 116, 323 Pesnell, W. D., Thompson, B. J., Chamberlin, P.C.2012, The Solar Dynamics Observatory (SDO) , SoPh, 275, 3 Schou, J., Scherrer, P. H., Bush, R. I., Wachter, R., Couvidat, S. 2012, Design and Ground Calibration of the Helioseismic and Magnetic Imager (HMI) Instrument on the Solar Dynamics Observatory (SDO) , SoPh, 275, 229 Tan, B. L., Tan, C. M., Zhang, Y., Mészárosová, H., Karlický, M., 2014a, ApJ, 780, 129 Tan, B,L., Tan, C.M., Zhang, Y., Huang, J., Mészárosová, H., Karlický, M. , and Yan, Y.H., 2014b, Ap.J. 790, 151 Winglee, R.M. and Dulk G.A. 1986, Ap.J, 307, 808 Yan, Y. H., Zhang, J., Wang, W., et al., 2009, Earth Moon and Planets, 104, 97. Yan, Y., Wang, W., Liu, F., et al., 2013, in IAU Symposium, 294, eds. A. G. Kosovichev, E. de Gouveia Dal Pino, and Y. Yan, 489 Yasnov, L.V., and Karlický, M. 2015, SoPh, 290, 2001 Zhdanov D.A., Zandanov V.G., 2011, Central European Astrophys. Bul., 35, 223 Zheleznykov, V.V., and Zlotnik, E.Ya. 1975a, SoPh, 44, 447 Zheleznykov, V.V., and Zlotnik, E.Ya. 1975b, SoPh, 44, 461 Zlotnik, E.Ya., 1976, Izv. VUZov Radiofizika, 19, 481 Zlotnik, E.Ya., 2009, Cent. Eur. Astrophys. Bull. 33, 281