The Formation of Submillimetre-Bright Galaxies from Gas Infall over a Billion Years
Abstract
Submillimetre-luminous galaxies at high-redshift are the most luminous, heavily star-forming galaxies in the Universe[1], and are characterised by prodigious emission in the far-infrared at 850 microns ( mJy). They reside in halos [2], have low gas fractions compared to main sequence disks at a comparable redshift[3], trace complex environments[4, 5], and are not easily observable at optical wavelengths[6]. Their physical origin remains unclear. Simulations have been able to form galaxies with the requisite luminosities, but have otherwise been unable to simultaneously match the stellar masses, star formation rates, gas fractions and environments[7, 8, 9, 10]. Here we report a cosmological hydrodynamic galaxy formation simulation that is able to form a submillimetre galaxy which simultaneously satisfies the broad range of observed physical constraints. We find that groups of galaxies residing in massive dark matter halos have rising star formation histories that peak at collective rates at , by which time the interstellar medium is sufficiently enriched with metals that the region may be observed as a submillimetre-selected system. The intense star formation rates are fueled in part by a reservoir gas supply enabled by stellar feedback at earlier times, not through major mergers. With a duty cycle of nearly a gigayear, our simulations show that the submillimetre-luminous phase of high-z galaxies is a drawn-out one that is associated with significant mass buildup in early Universe proto-clusters, and that many submillimetre-luminous galaxies are actually composed of numerous unresolved components (for which there is some observational evidence[11]).
We have conducted our cosmological hydrodynamic zoom galaxy formation simulations utilising the new hydrodynamic code gizmo[12], and include a model for the impact of radiative and thermal pressure from stars on the multiphase interstellar medium. This feedback both regulates the star formation rate, and shapes the structure in the interstellar medium. Informed by clustering measurements of observed SMGs[2], we focus on a massive ( M⊙ at ) halo with baryonic particle mass as the host of our “main galaxy”, and run the simulation to . The only condition of the tracked galaxy pre-selected to match the physical properties of observed SMGs is the chosen halo mass. We combine this with a new dust radiation transport package, powderday, that simulates the traverse of stellar photons through the dusty ISM of the galaxy, allowing us to robustly translate our hydrodynamic simulation into observable measures. We simulate the radiative transfer from a 200 kpc region around the main galaxy. This simulation represents the first cosmological model of a galaxy this massive to be explicitly coupled with dust radiative transfer calculations. The details of both codes and the simulation setup are fully described in the Methods section.
We define two distinct regions in the simulations. The “submillimetre emission region” is the 200 kpc region surrounding the central galaxy in the halo of interest. This is the region where all of the modeled m emission comes from, and is what relates most directly to observations. The “submillimetre galaxy” refers to the central galaxy in the halo. Physical quantities from the submillimetre galaxy are most applicable to high-resolution observations, as well as placing these models in the context of other theoretical galaxy formation models. As we will show, the submillimetre emission from the region is generally dominated by the central submillimetre galaxy, though the contribution from lower mass galaxies is often non-negligible.
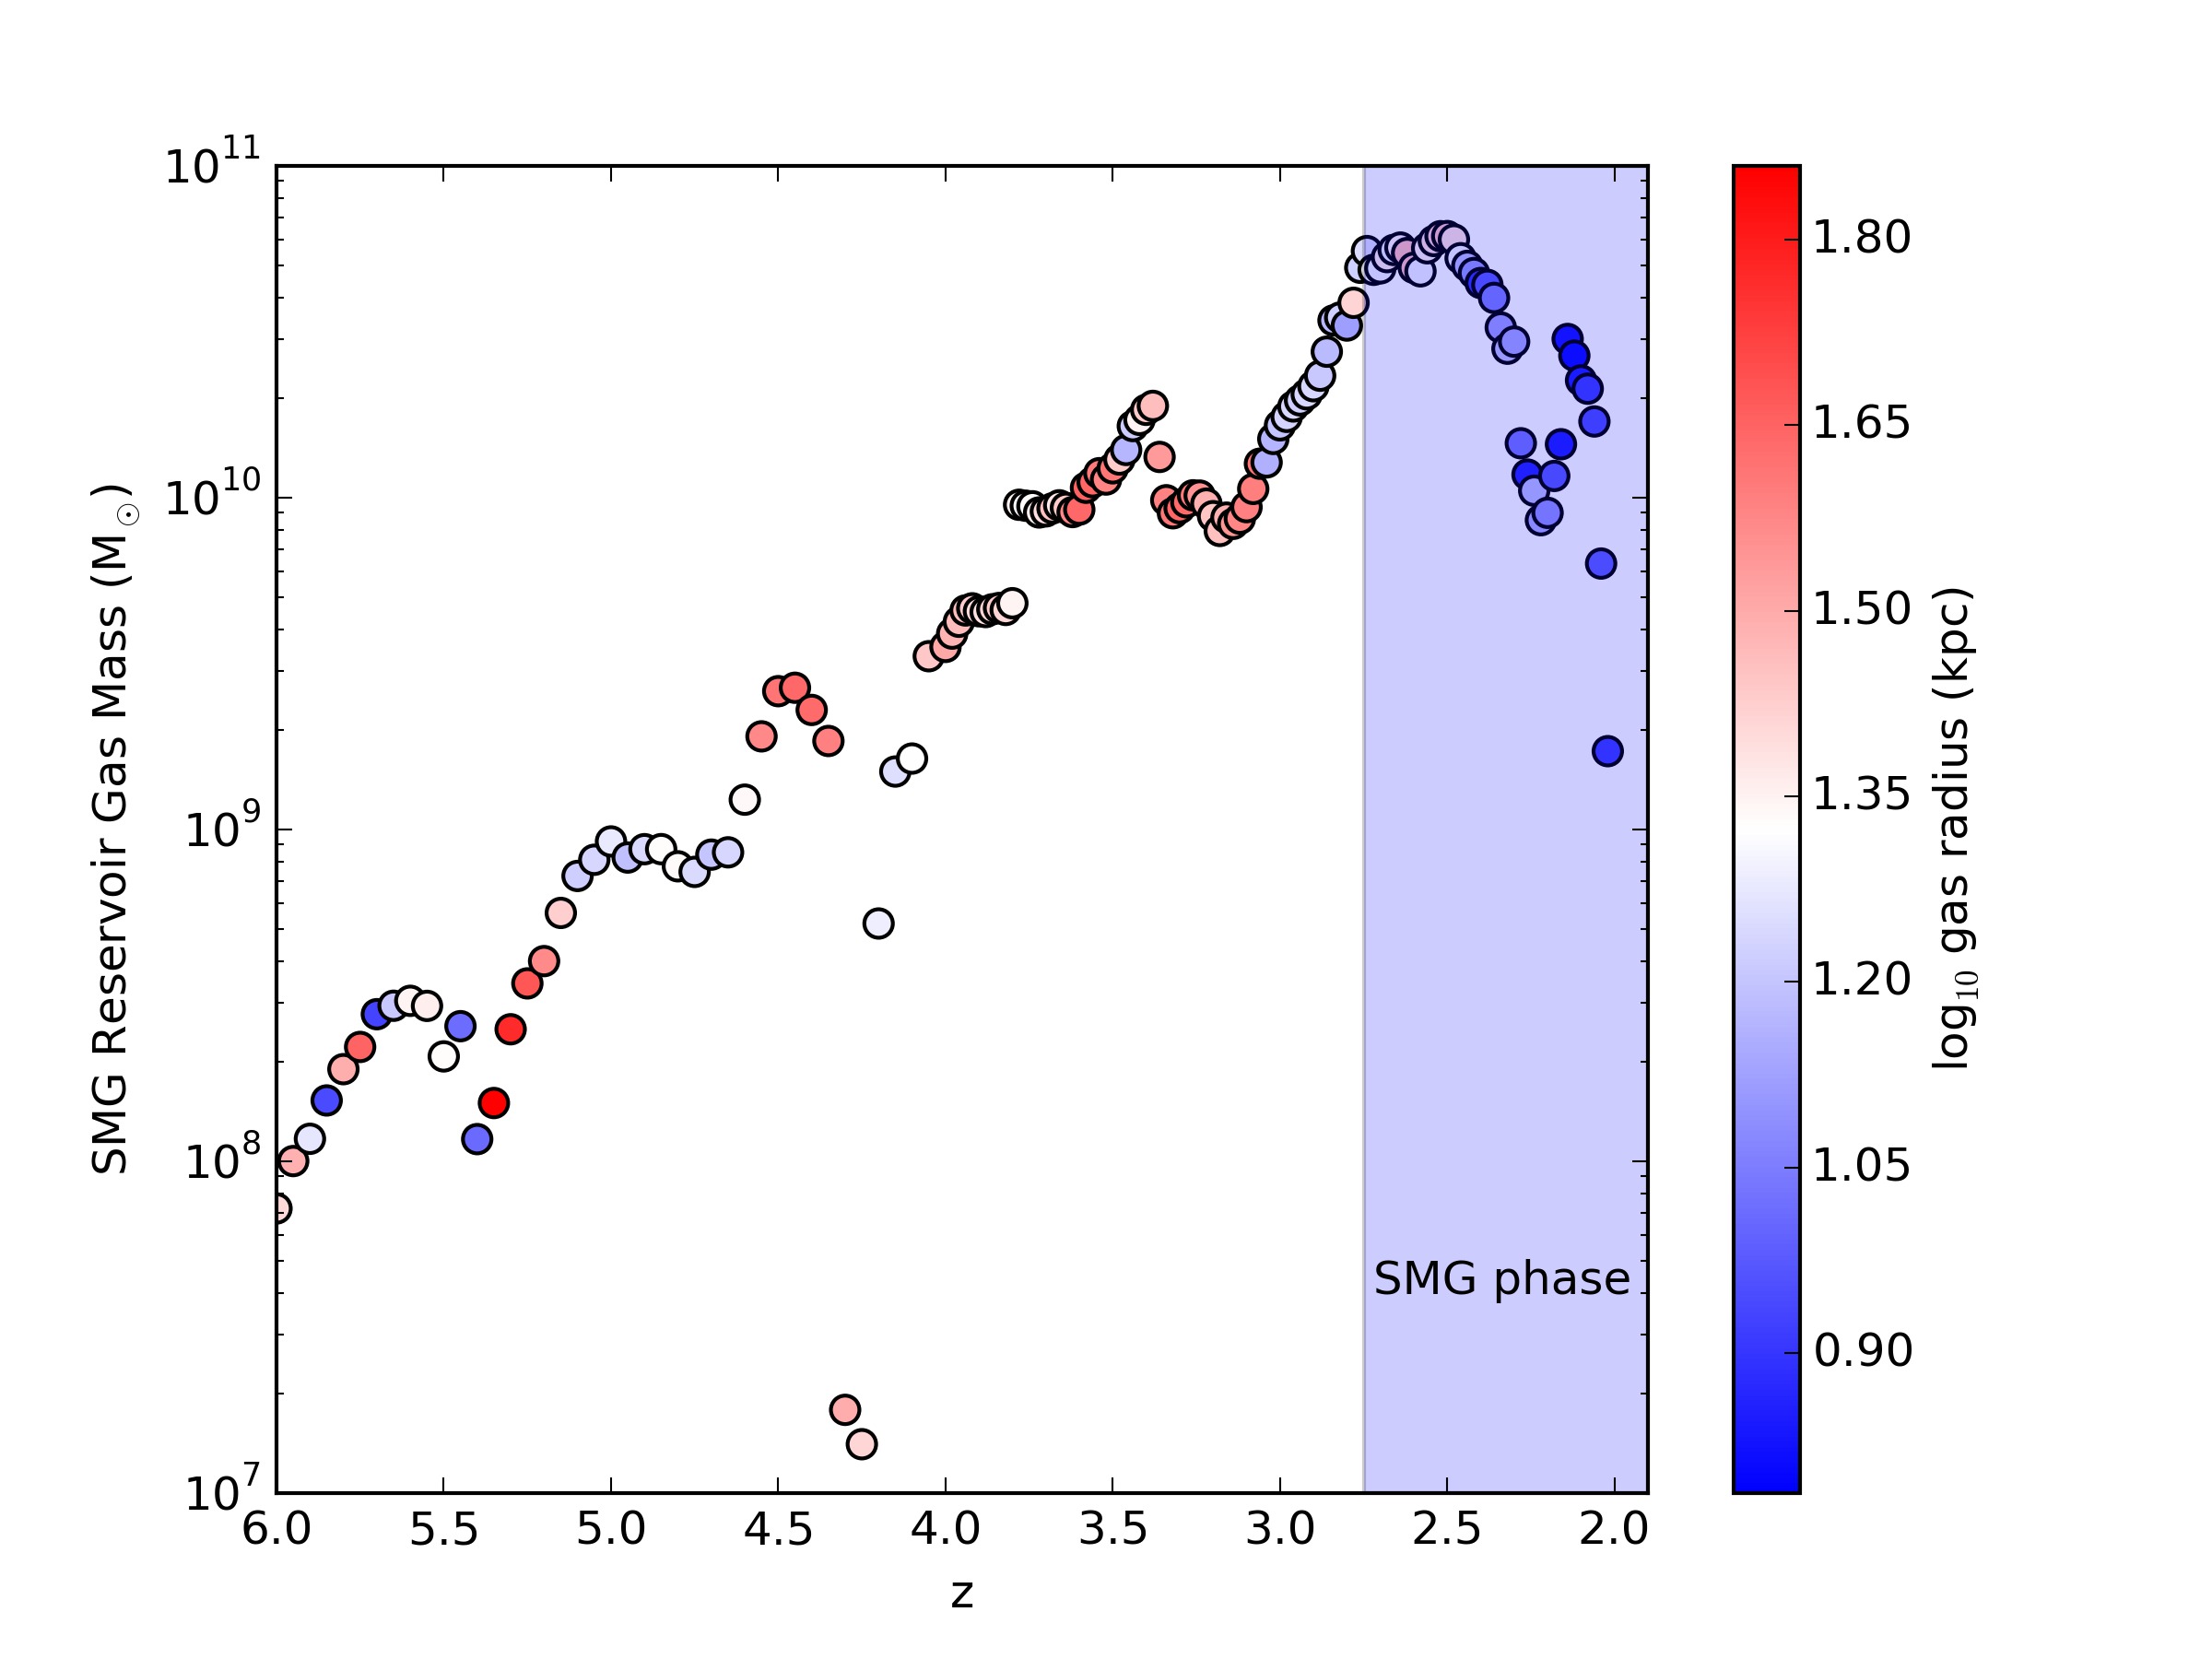
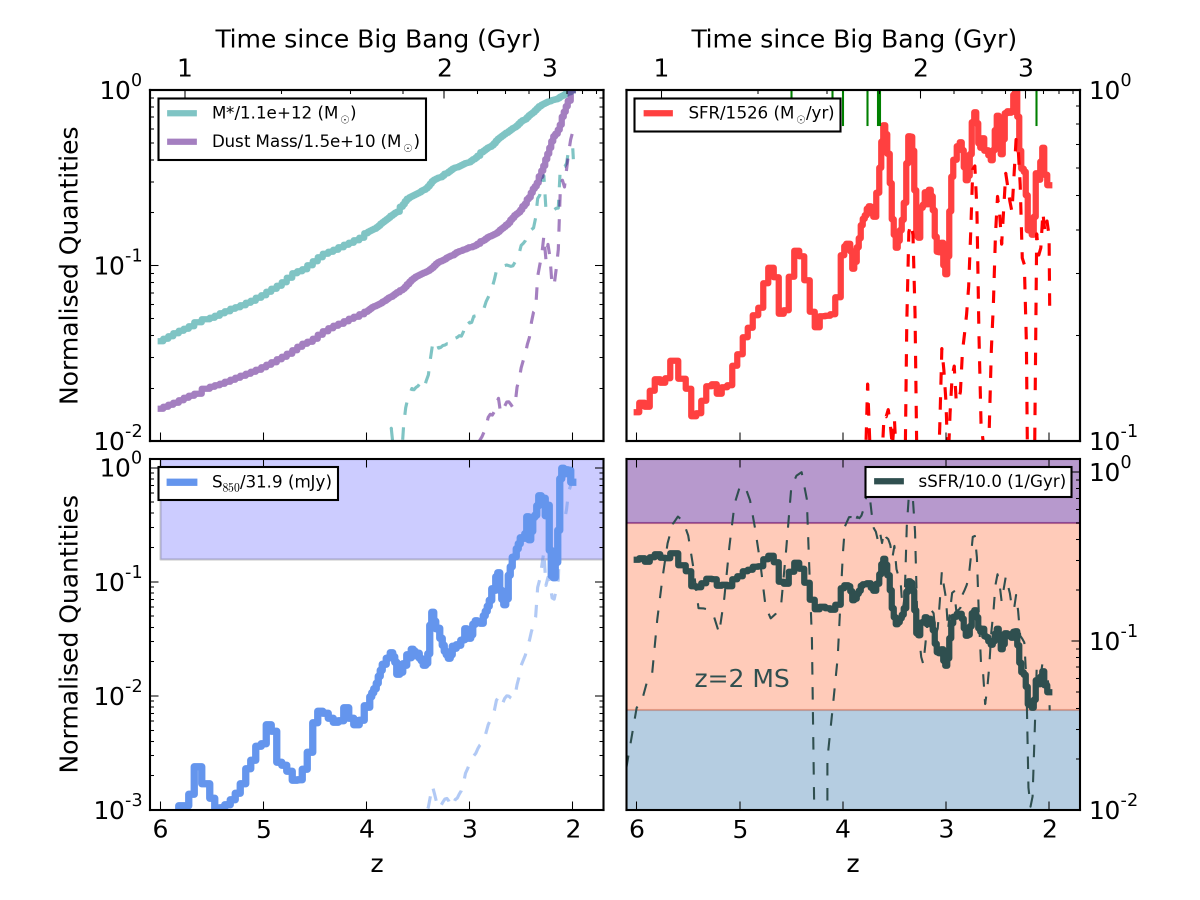
We track the submillimetre properties of the galaxies within the region from . The star formation rates of galaxies in the region rise from this redshift toward later times , owing to accretion of gas from the intergalactic medium (Figure 1). As stars form, stellar feedback-driven galactic winds generate outflows and fountains allowing recycled gas to be available for star formation at later times (ED Fig 1). This phenomena shapes a star formation history that is still rising at , in contrast to galaxy formation models with more traditional implementations of subresolution feedback, which peak at for galaxies of this mass[13, 14, 15]. Mergers and global instabilities drive short-term variability in the global SFR, while outflows and infall driven by the feedback model can impact features in the star formation history with a somewhat cyclical ’saw-tooth’ pattern.
At its earliest stages (), the integrated SFR from the galaxies in the region varies from yr-1, with a significant stellar mass () in place, comparable to some high-redshift detections[16]. Feedback from massive stars enrich the interstellar medium with metals, and the dust content simultaneously rises. By , the combination of gas accumulation with substantial metal enrichment drives a factor of increase in the dust mass, with masses approaching . Radiation from the delayed peak in the star formation rate interacting with this substantive dust reservoir drives the observed m flux density to detectable values of mJy. The galaxies associated with the main halo enter a long-lived submillimetre-luminous phase, with a duty cycle of Gyr. While our main model is only run to owing to computational restrictions for models of this resolution, tests with lower-resolution models reveal that at later times (), a declining star formation rate due to inefficient accretion as well as exhausted gas supply drives a drop in the submillimetre flux density (for more details, see the Methods section). The star formation history of galaxies residing in () M⊙ halos as controlled by the underlying stellar feedback provides a physical explanation for the peak in the observed SMG redshift distribution at [17].
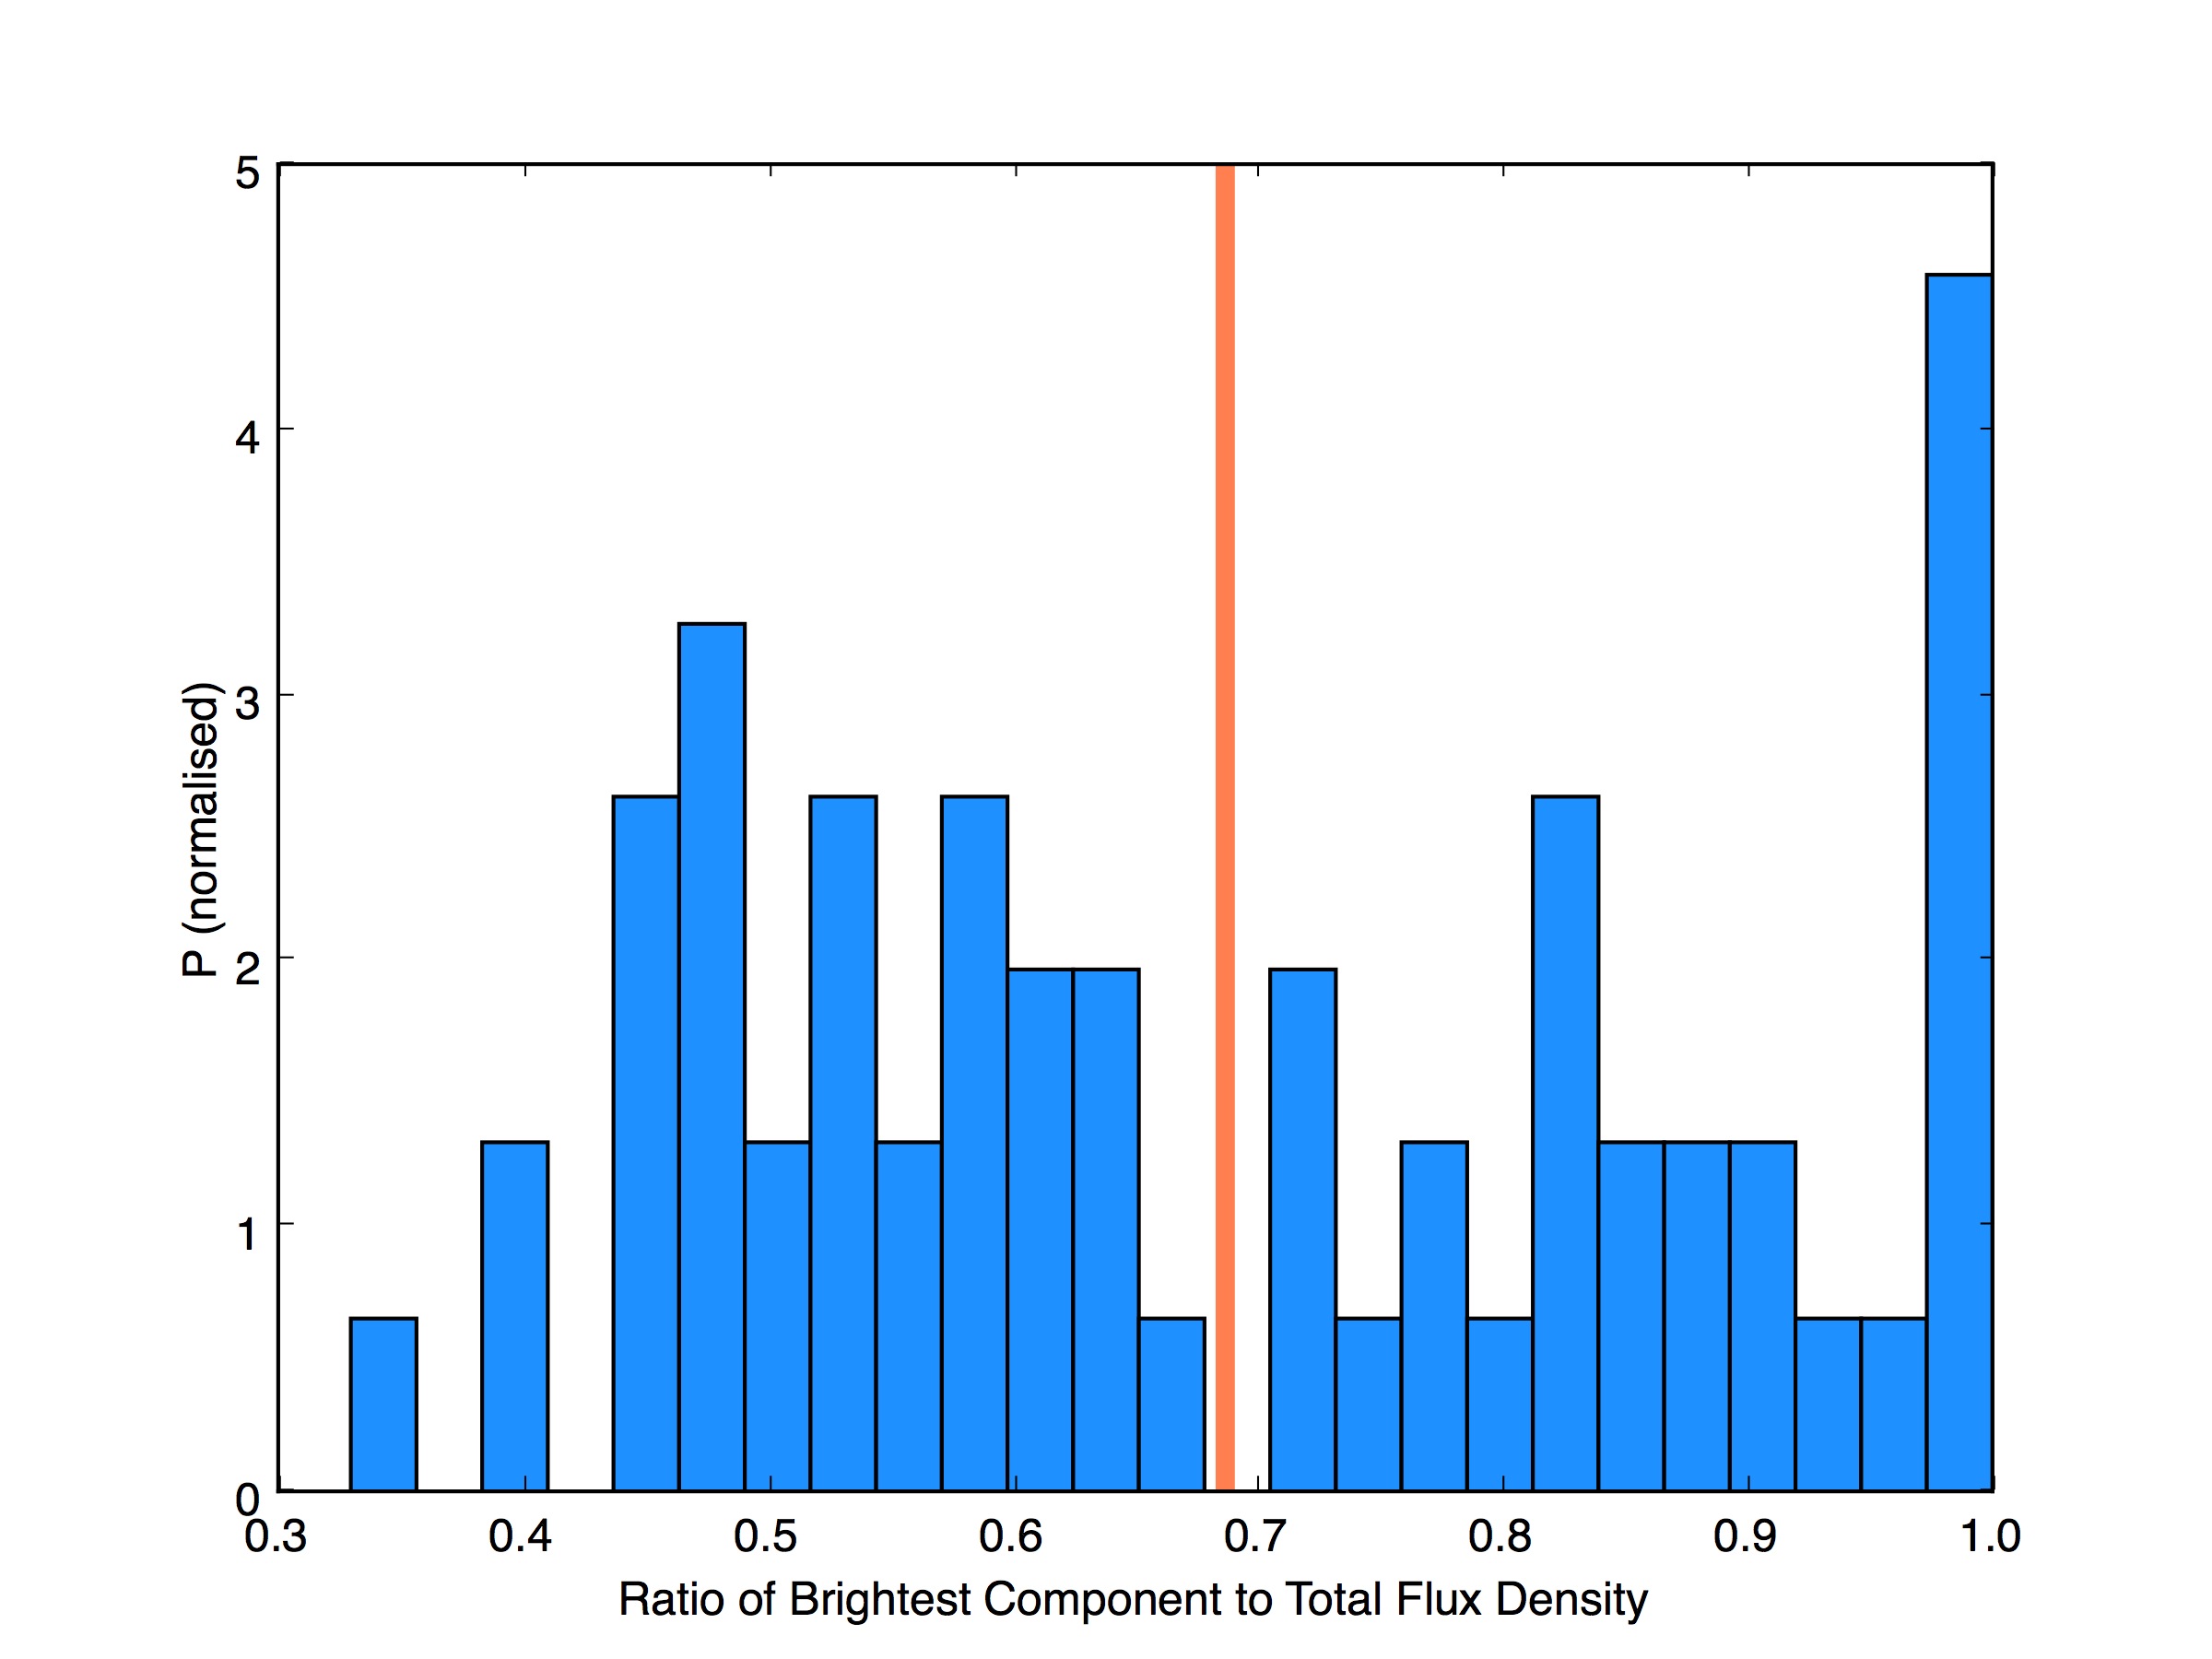
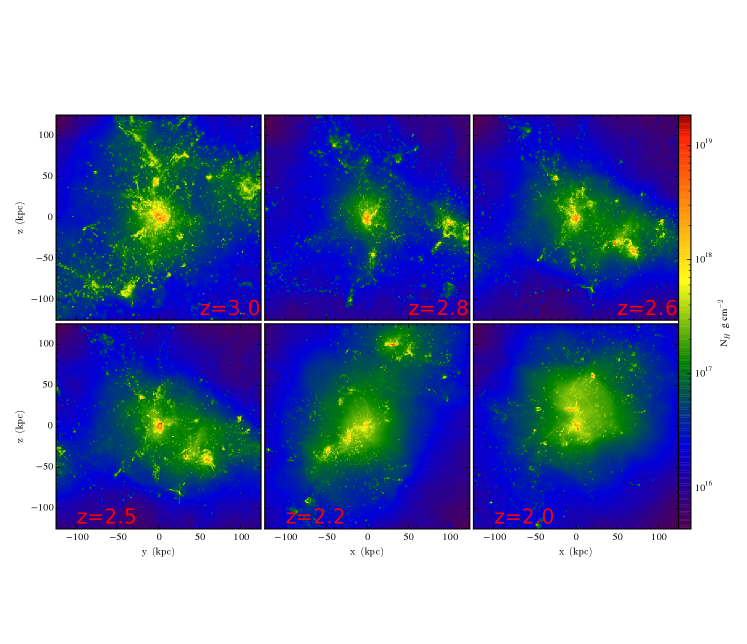
During the submillimetre-luminous phase, the emitting region is almost always occupied by multiple detectable galaxies. In Figure 2, we present gas surface density projections of six arbitrarily chosen snapshots during the evolution of the submillimetre-luminous phase (). The panels are kpc on a side; for reference, the full width at half maximum (FWHM) of the Submillimetre Common-user Bolometer Array (SCUBA) on the James Clerk Maxwell Telescope (JCMT), the first instrument to detect SMGs, is kpc at . Multiple clumps of gas falling into the central are nearly always present. The observed flux density from the region is typically dominated by the central, with (on average) arising from emission from subhalos (ED Fig 2). The submillimetre flux density of the central galaxy rises dramatically between , reaching a peak value of mJy. Owing to contributions from subhalos surrounding the central, the flux from the overall kpc region can exceed this, peaking at mJy. Similarly extreme systems have recently been detected with the Herschel Space Observatory and South Pole Telescope[18, 4, 19].
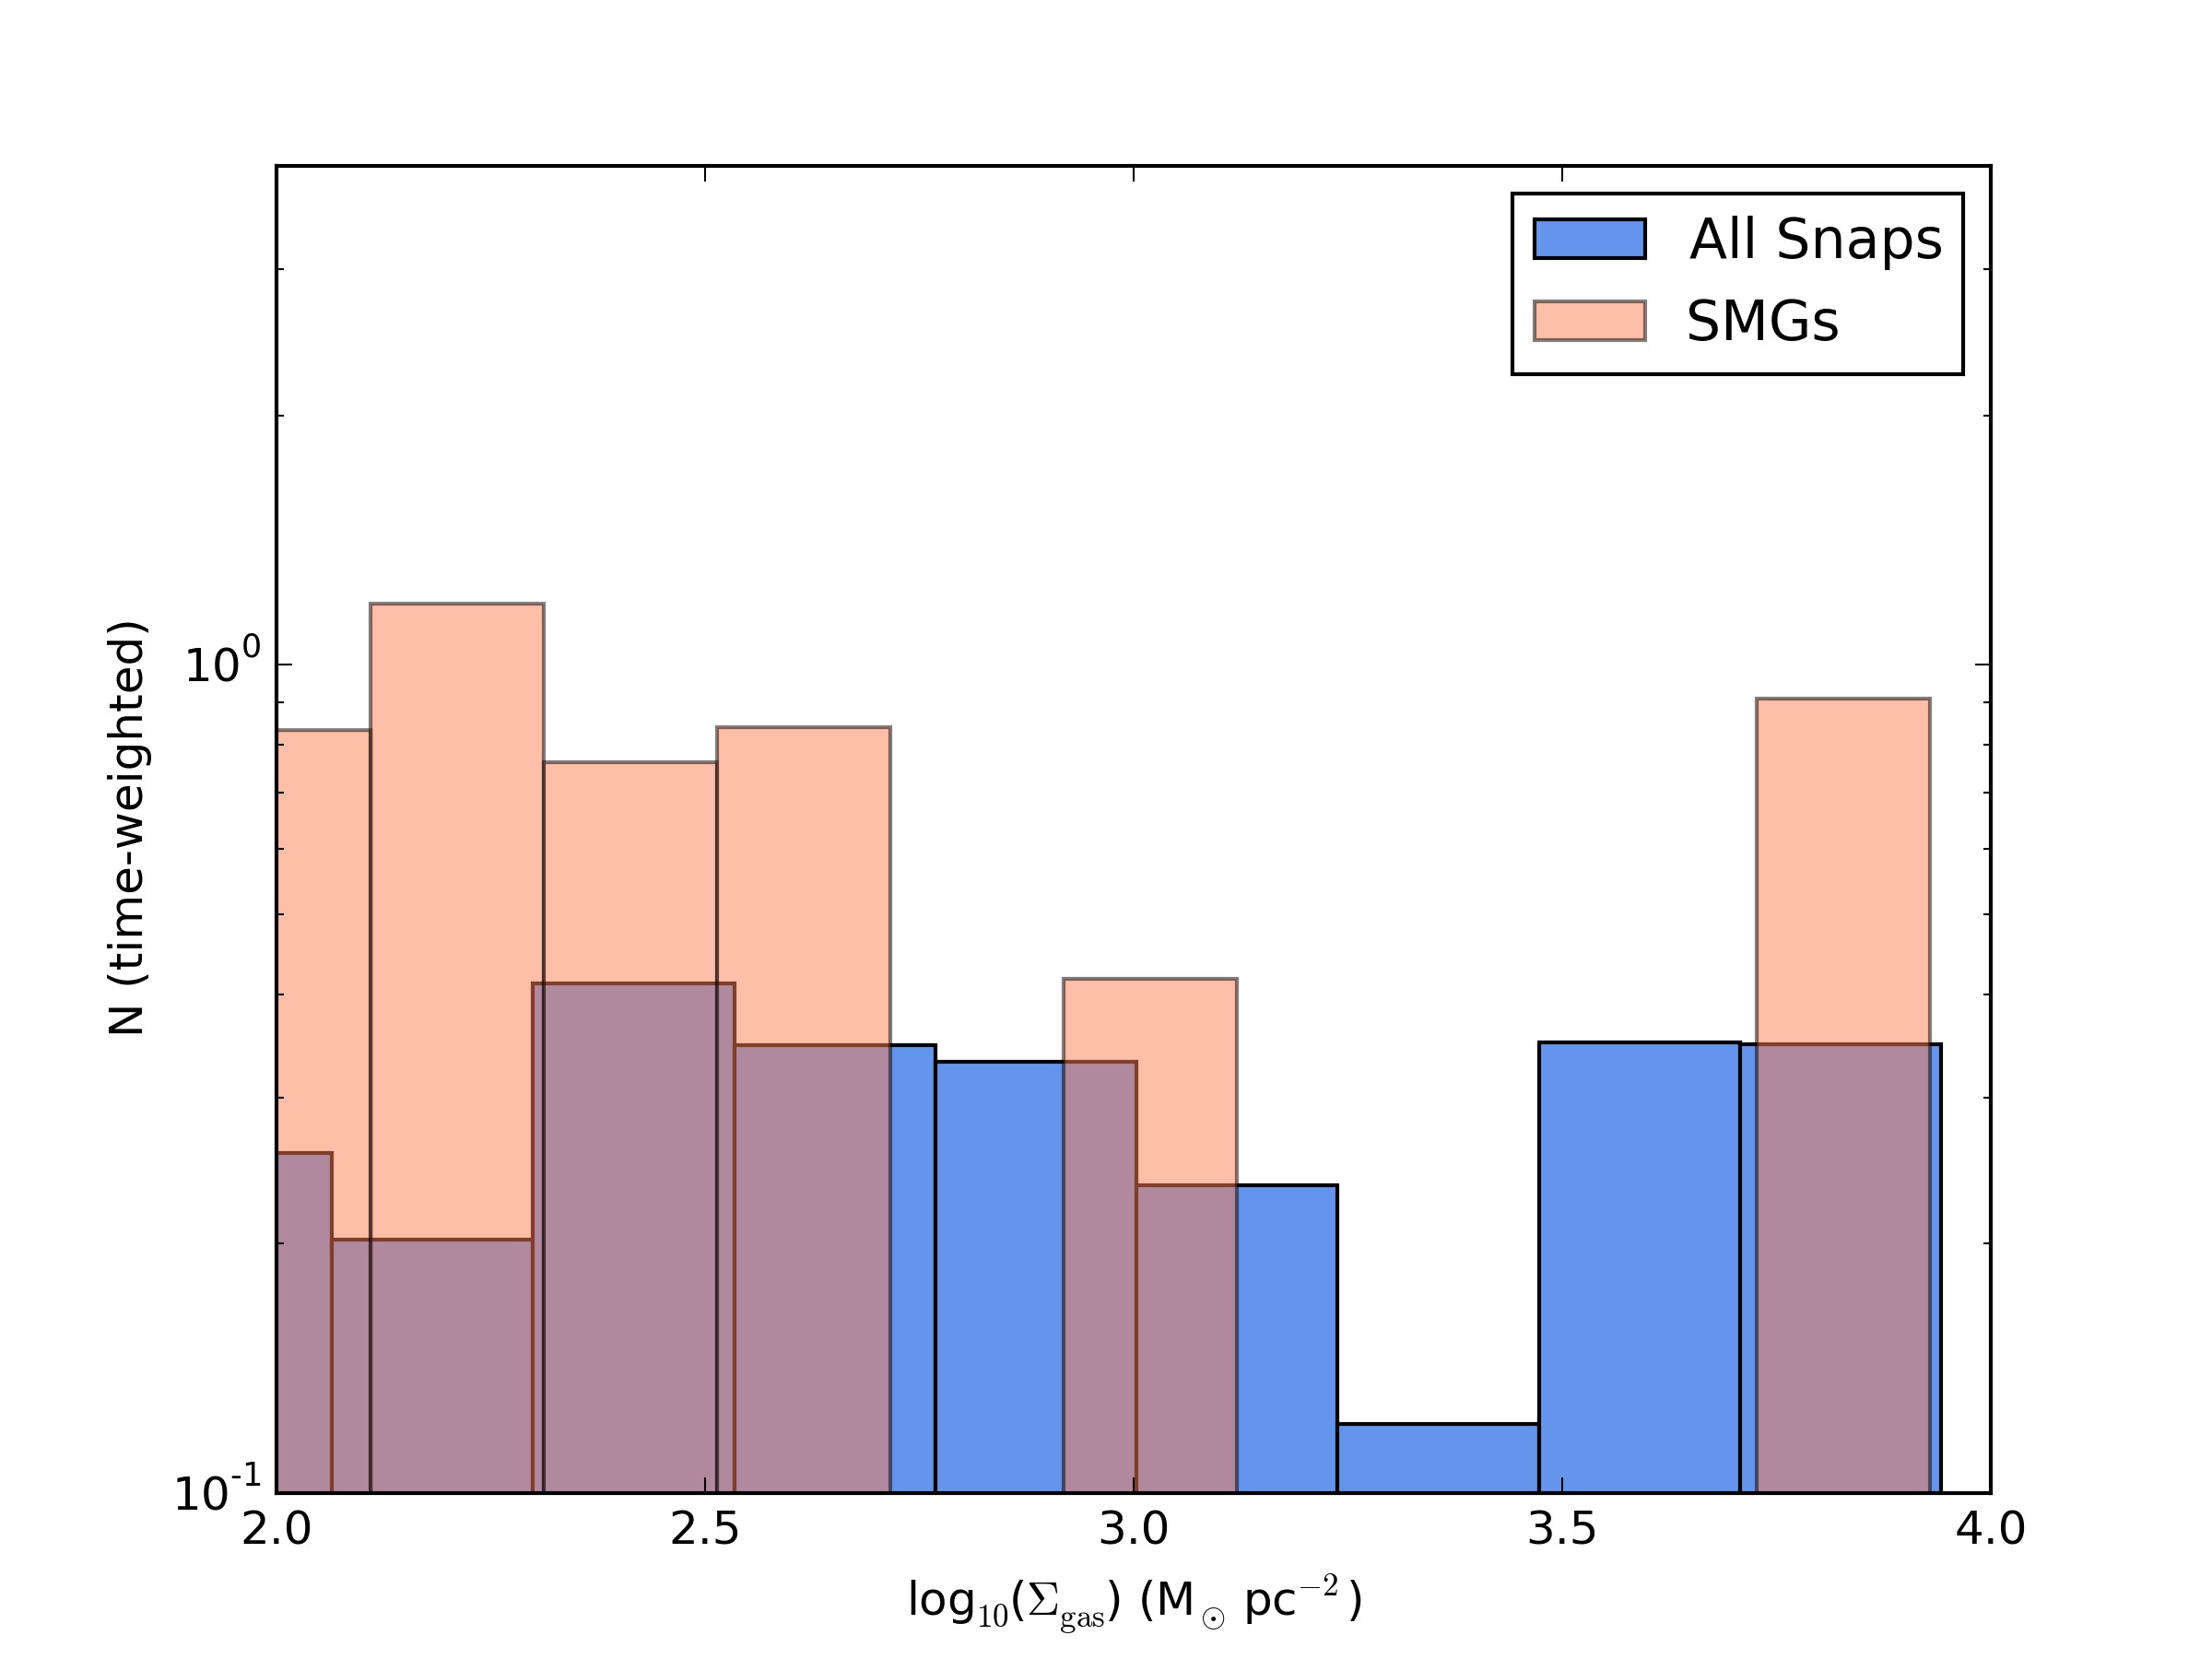
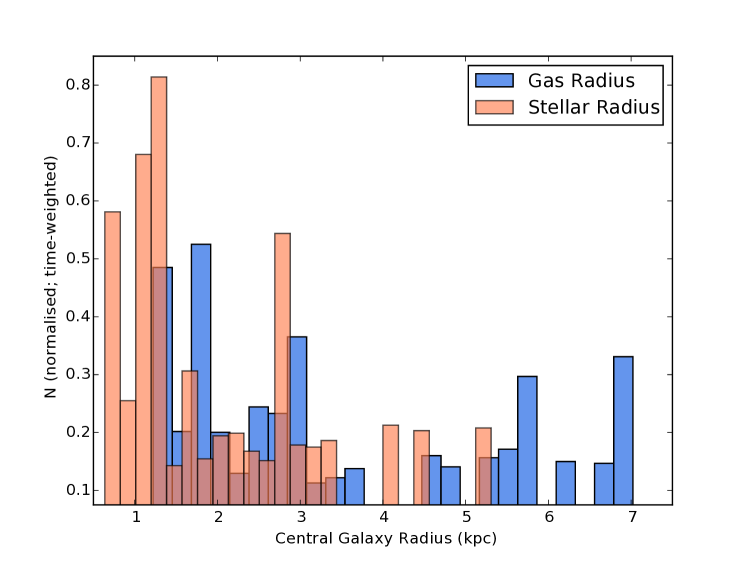
While the central is being bombarded by subhalos over a range of mass ratios during the submillimetre-luminous phase, major galaxy mergers akin to local prototypical analogues such as Arp 220 or NGC 6240 do not drive the onset of the long-lived submillimetre-luminous phase in the central galaxy. In Figure 1, we highlight when the galaxy undergoes a major merger with mass ratio . While major mergers are common at early times (and indeed drive some short-lived bursts in star formation), the bulk of the submillimetre-luminous phase at later times () occurs nearly a gigayear after the last major merger. The ratio of the SFR to its integral over cosmic time (the specific SFR) of the overall emitting region is generally on the main sequence of galaxy formation at (defined as the main locus of points on the SFR- relation), though the central can have values comparable both to main sequence galaxies between , as well as outliers. One consequence of a model in which SMGs typically lie on the main sequence of star formation is that the gas surface densities show a broad range, from (ED Fig 3), as well as diverse gas spatial extents (Figure 3). This is manifested observationally in the broad swath occupied by SMGs in the Kennicutt-Schmidt star formation relation[1]. The gaseous spatial extent and surface densities is to be contrasted, however, with local merger-driven ultraluminous infrared galaxies (ULIRGs), which exhibit typical full width at half maximum radii of pc[20]. Idealised galaxy merger simulations with initial conditions designed to form SMGs further underscore this contrast, as they also result in compact morphologies during final coalescence, and can be inefficient producers of submillimetre radiation owing to increased dust temperatures[8].
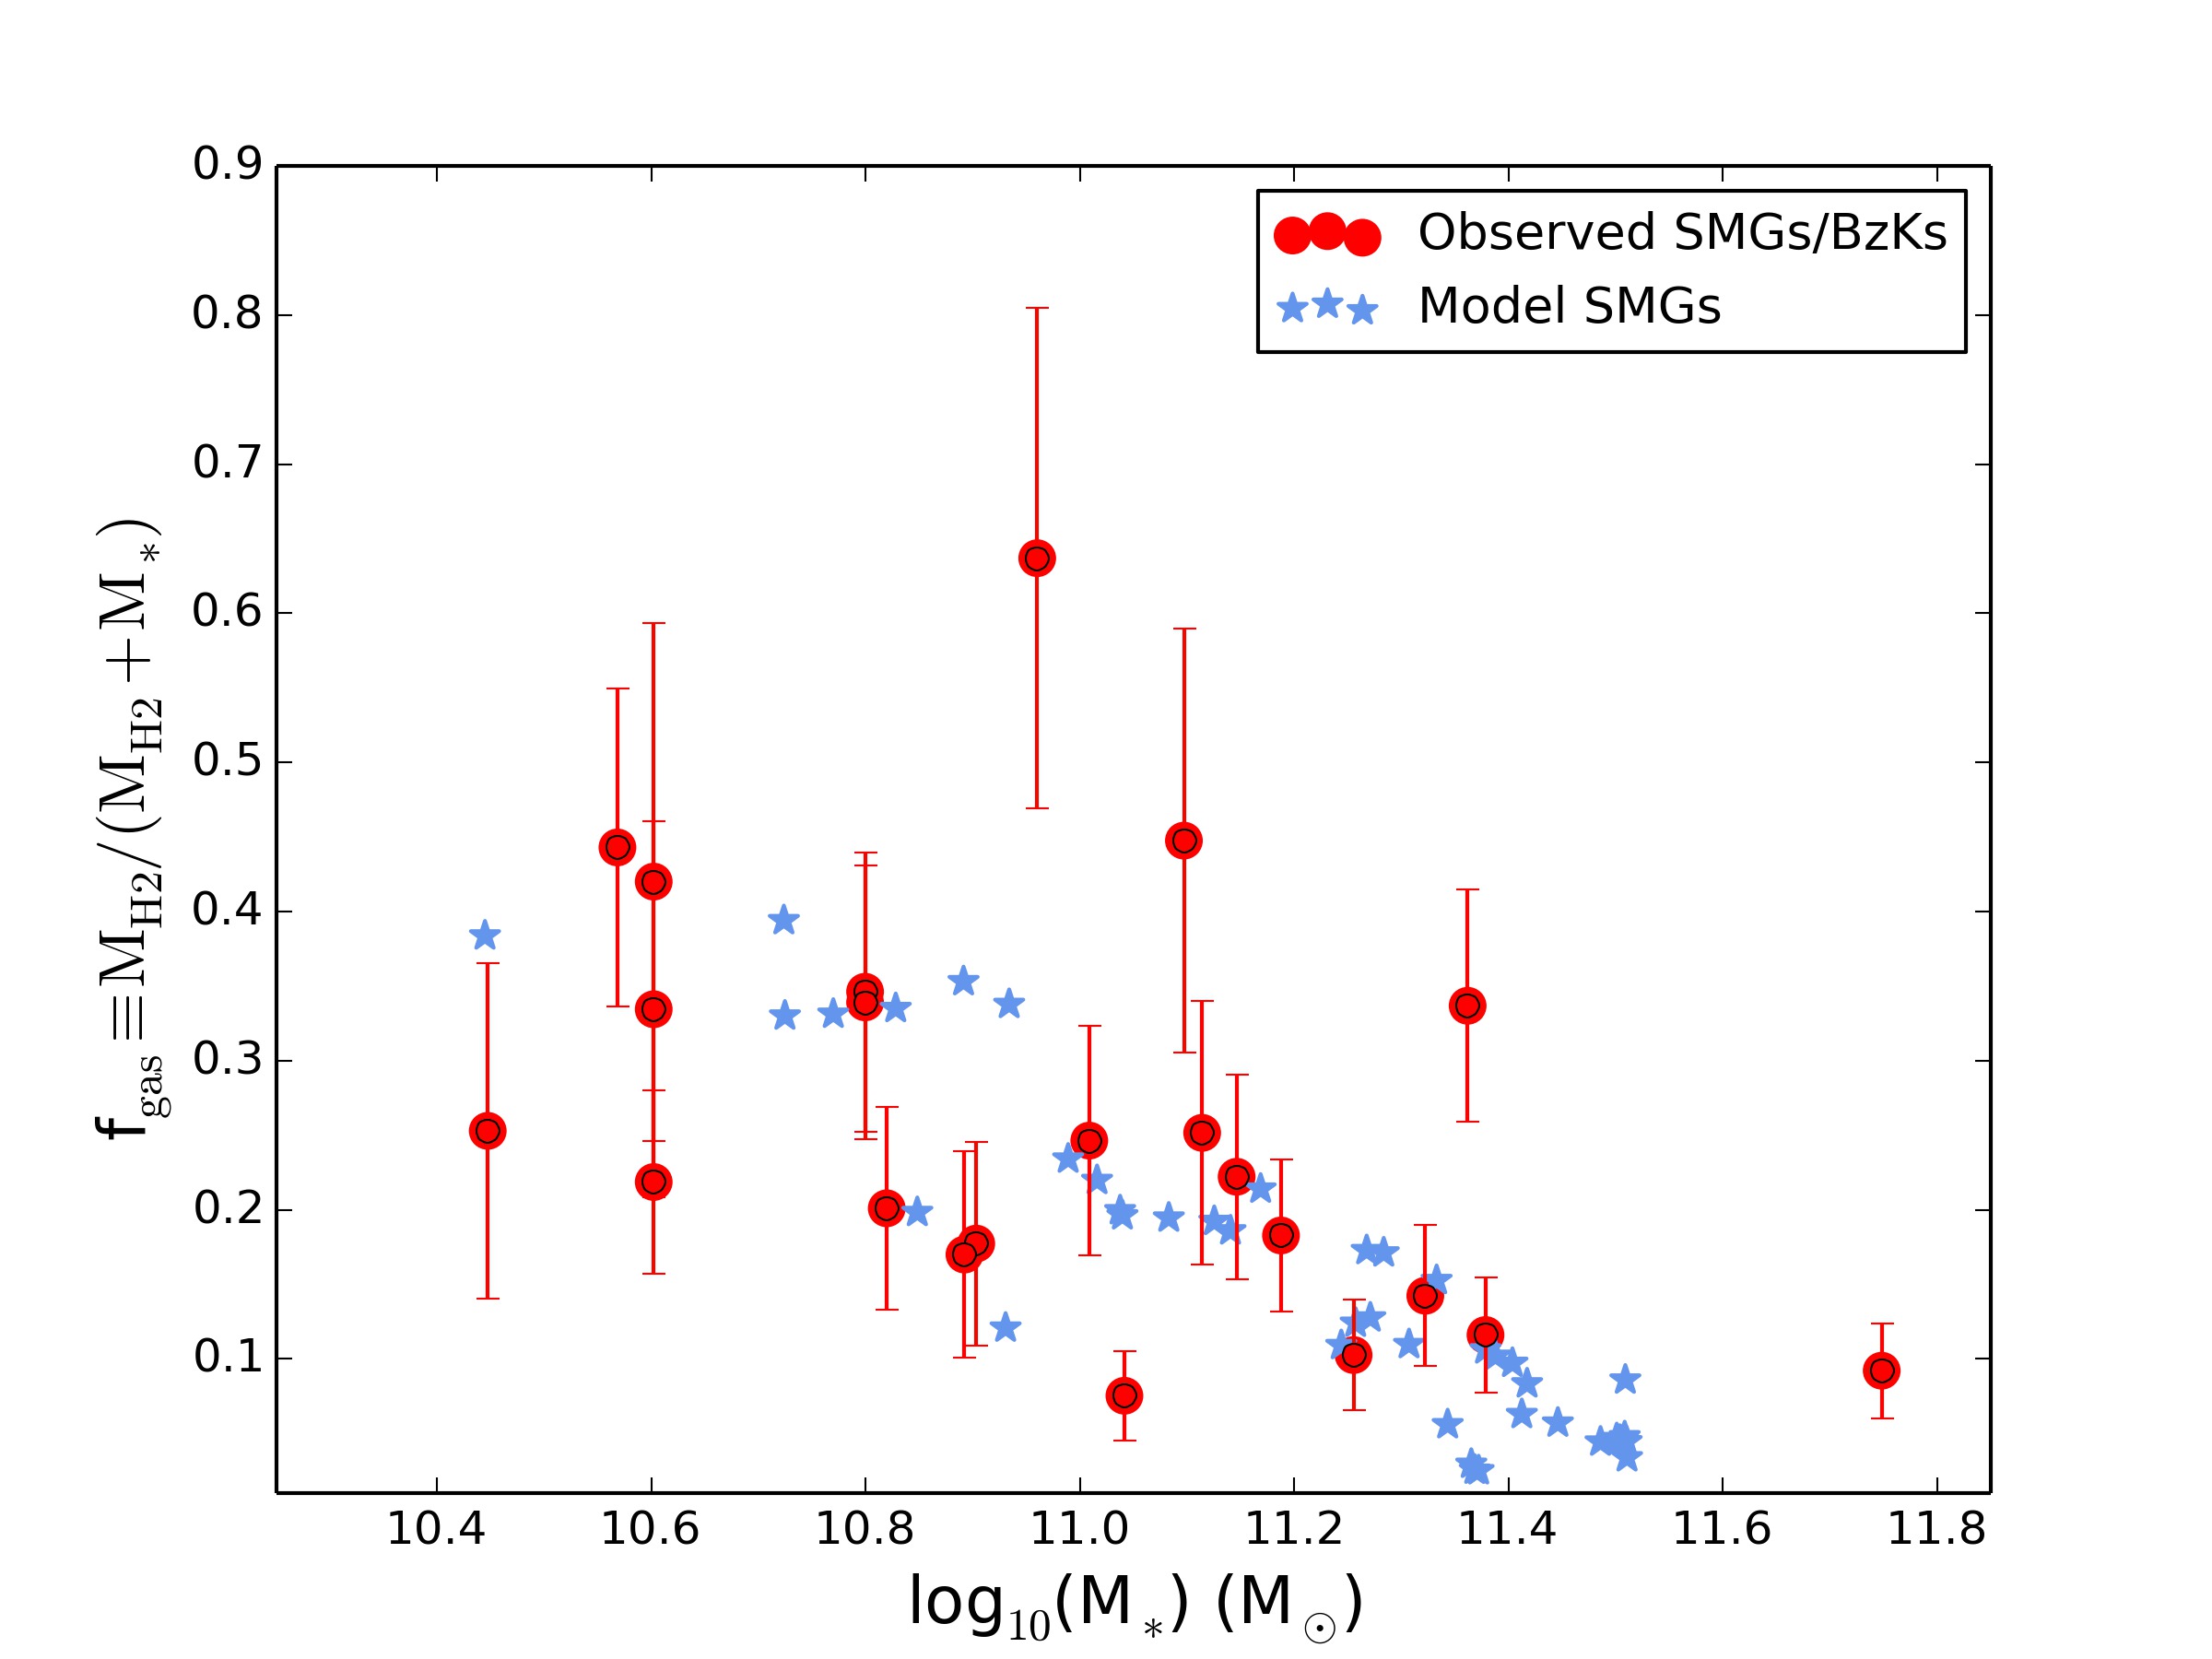
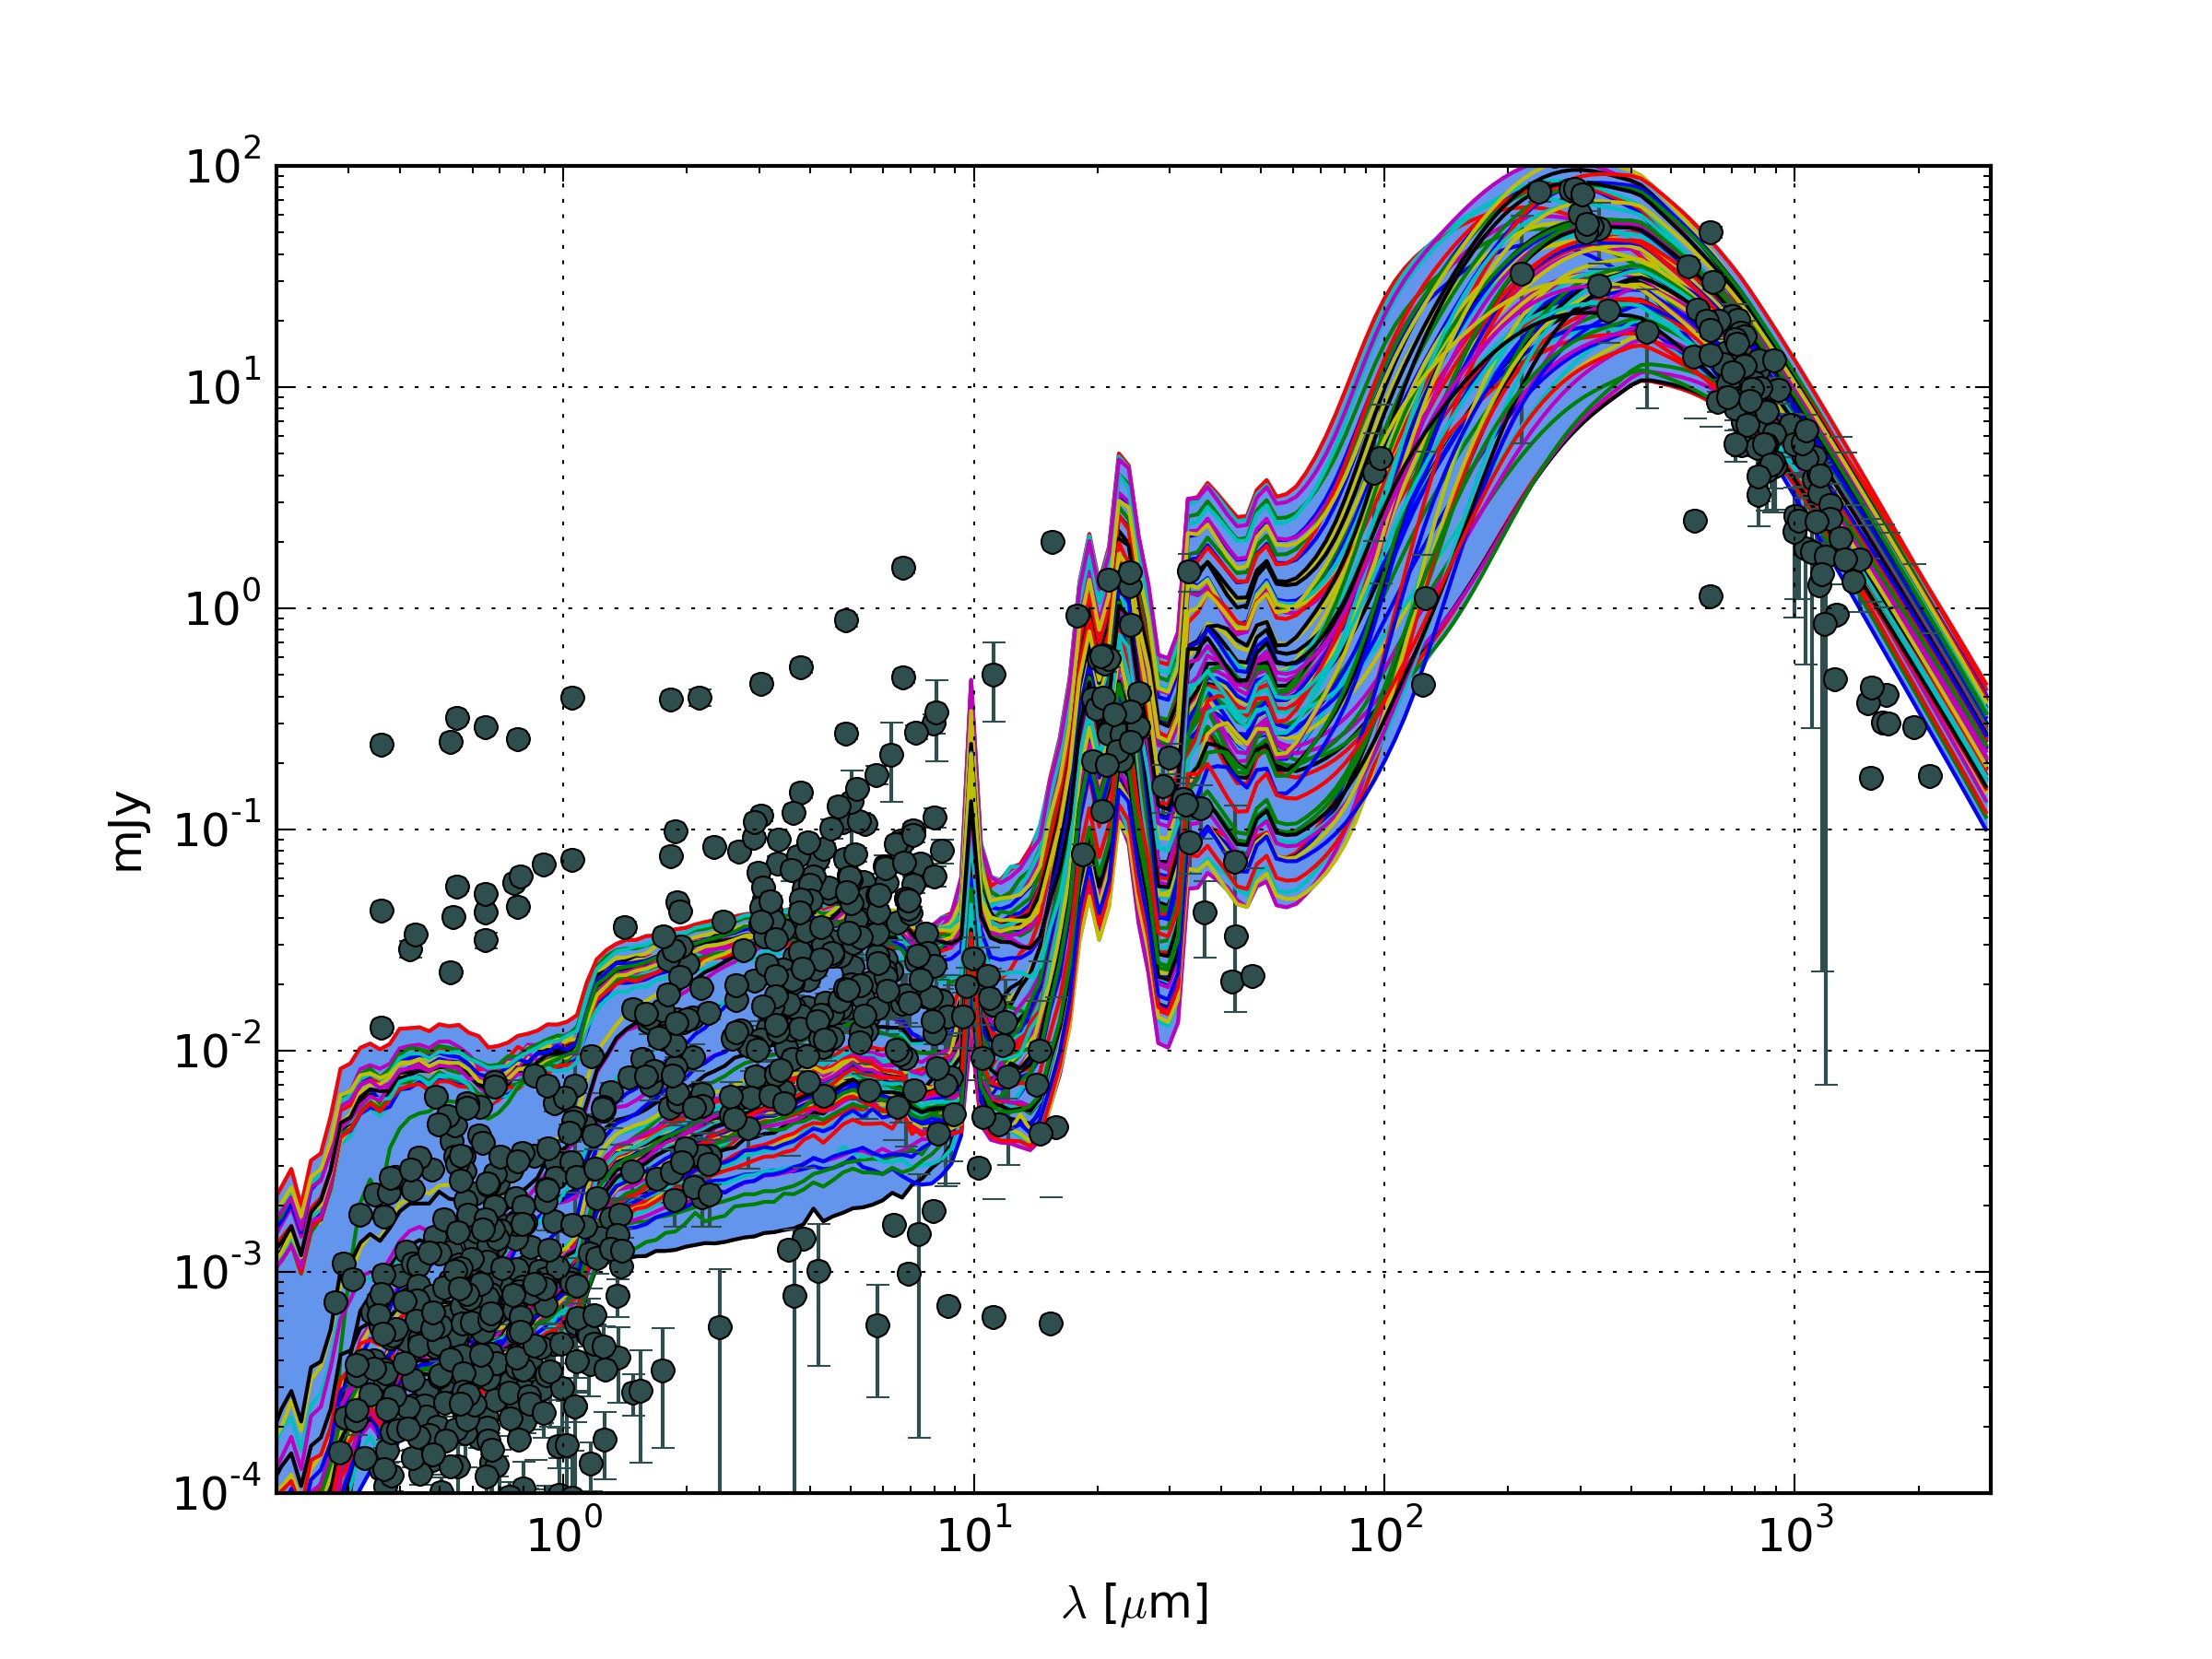
The central submillimetre galaxy is amongst the most massive and highly star-forming of galaxies at this epoch. The stellar masses are diverse, and range from M⊙, comparable to recent measurements of this population[21], as well as constraints from abundance matching techniques[22]. The molecular gas fractions of the central galaxy () decline with stellar mass, and range from at lower stellar masses to at the highest masses. This is in agreement with observations[23], though is dependent on the conversion from carbon monoxide (12CO) luminosity to H2 gas mass. We note that these predictions are quantitatively different from those produced by previous cosmological efforts in this field, with some predicted gas fractions exceeding [7, 9] and median stellar masses as low as M⊙[7]. We present the plots highlighting the gas fractions, and calculated SEDs of our model SMG in the context of observations in ED Figs 4-5. The gas distributions within the central galaxy, which range from kpc, compare well with recent observed dust maps with the Atacama Large Millimetre Array[24].
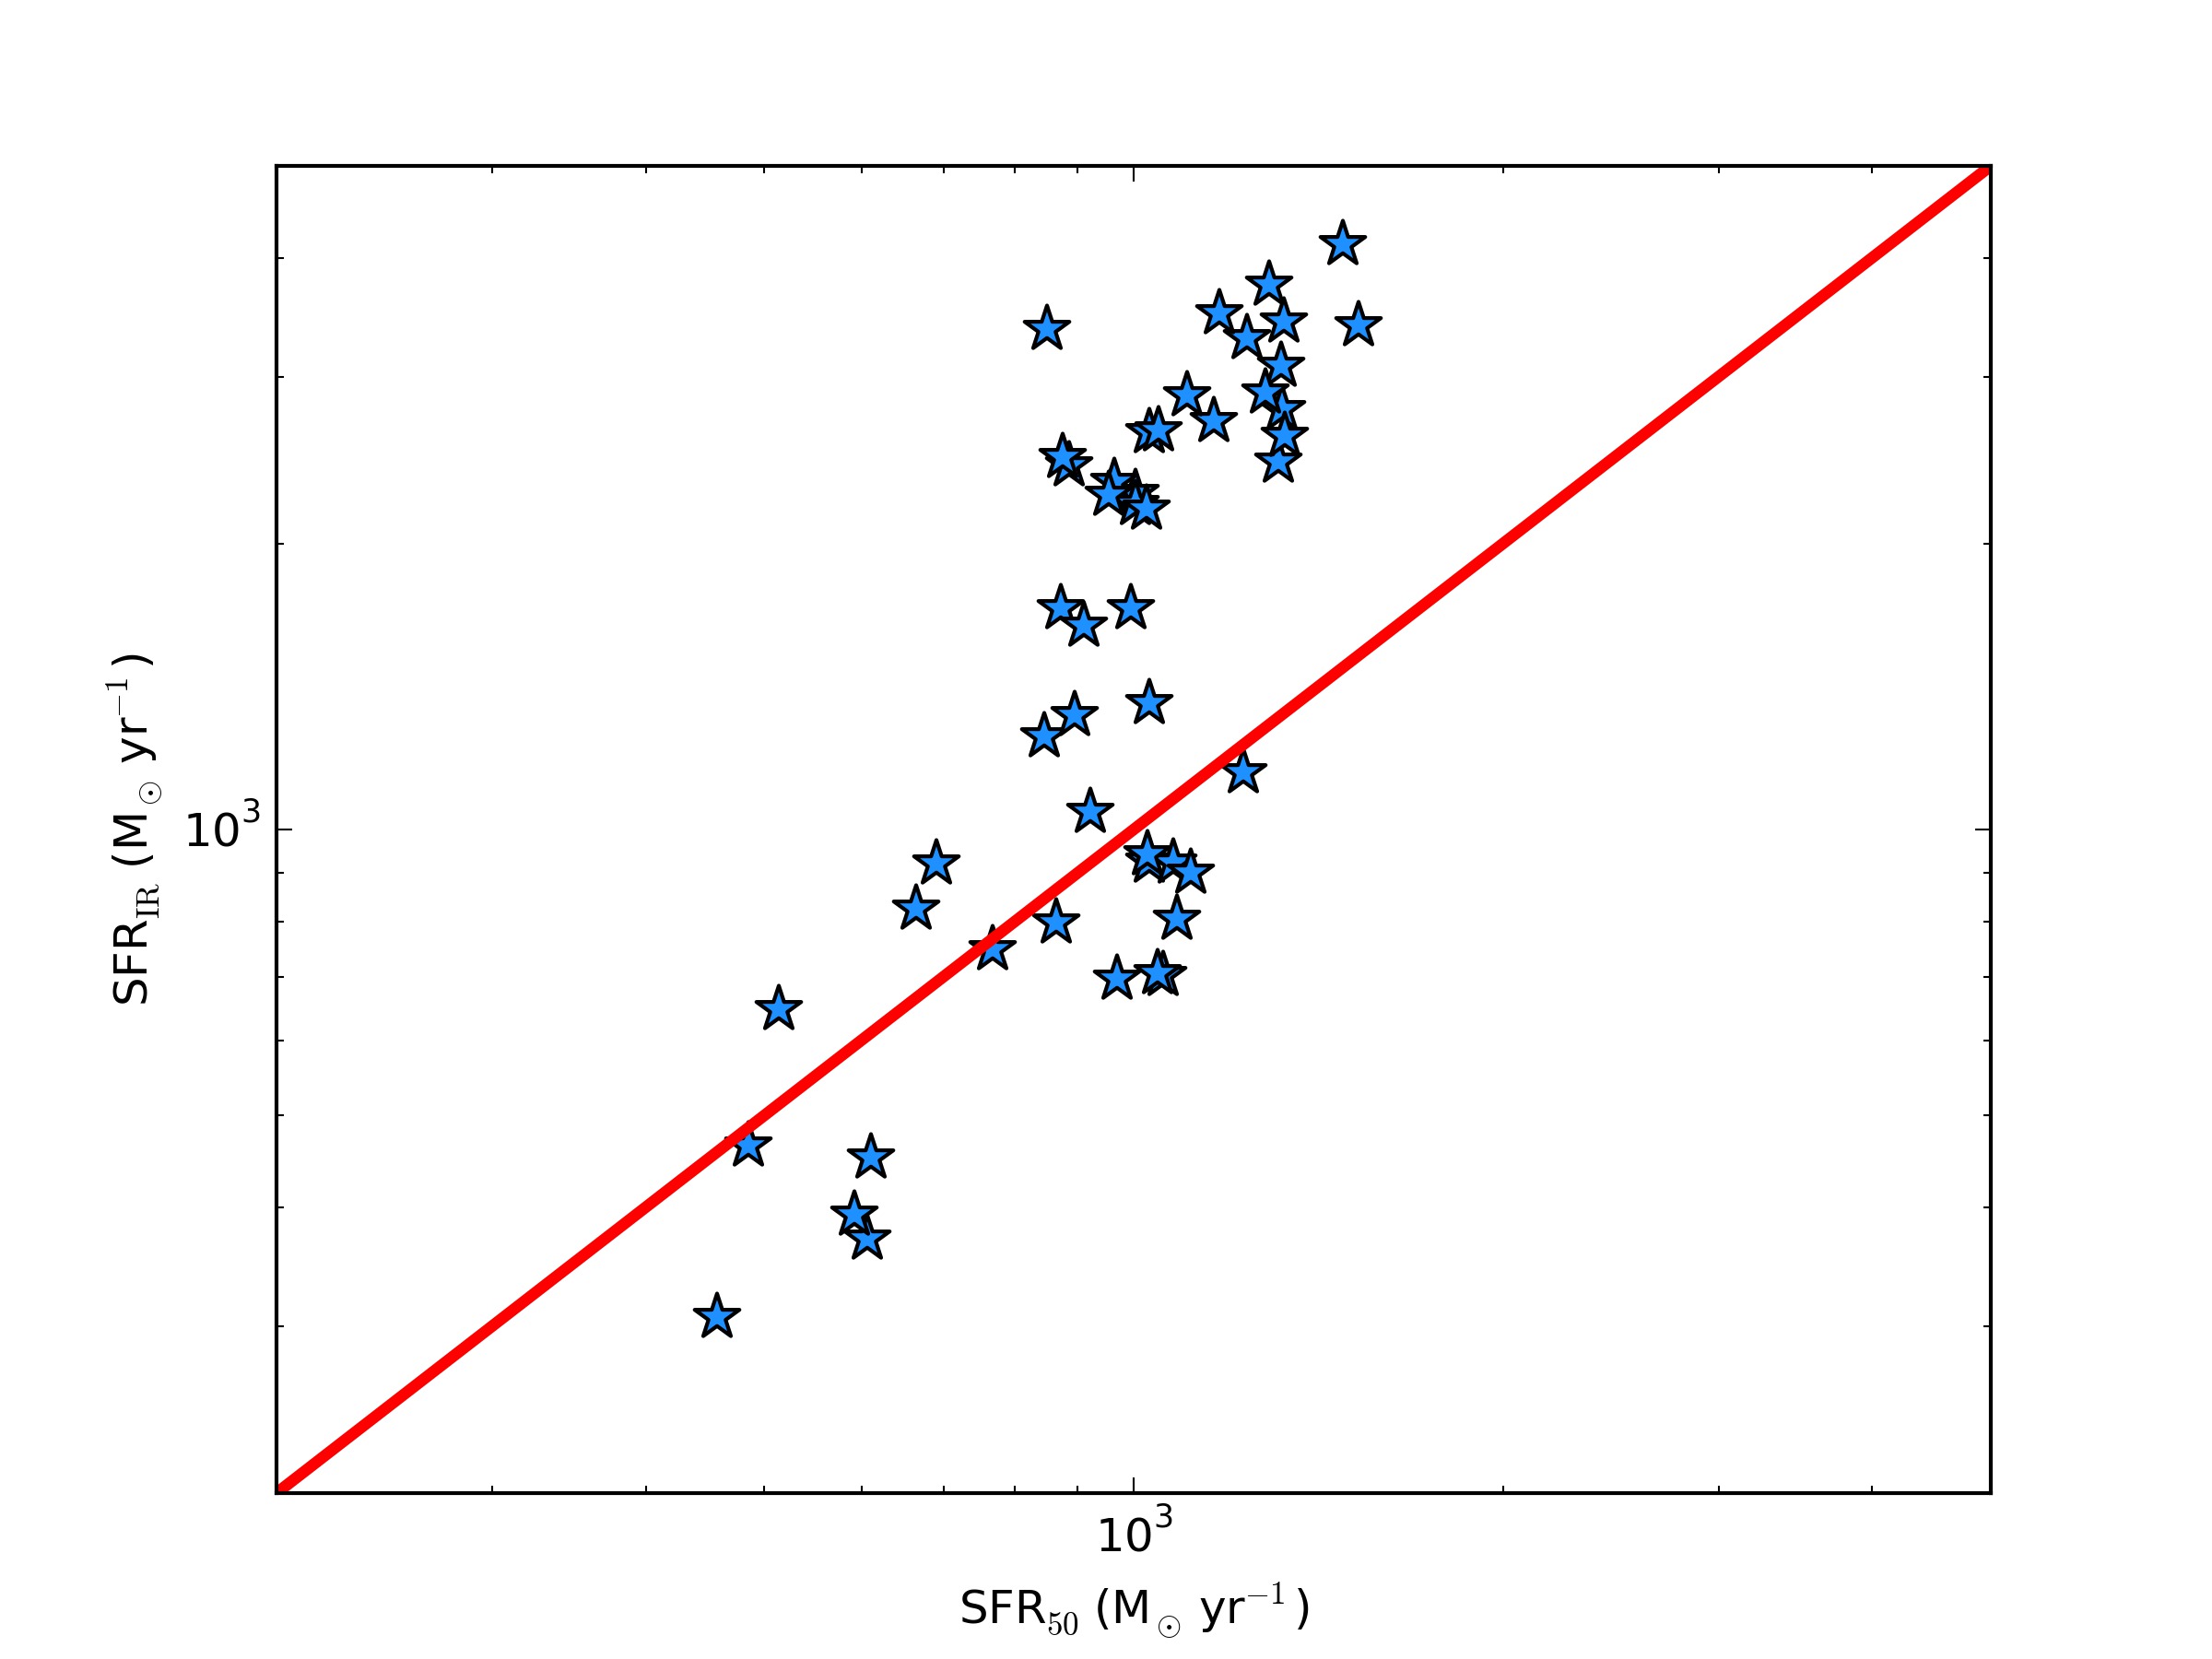
The stellar masses, gas fractions and duty cycles are in agreement with previous lower-resolution cosmological efforts[10], though the predicted SFR and luminosity from this model are substantially larger. The star formation rate of the group of galaxies in the region peaks at yr-1. Importantly, up to half of the total infrared luminosity can come from older stars with ages Gyr. Utilising standard conversions[25], the estimated star formation rate from the integrated infrared SED (m) can exceed yr-1 (ED Fig 6), and hence infrared-based star formation rate derivations of dusty galaxies at high- may over-estimate the true SFR by a factor . Indeed, the contribution of satellite galaxies to the global SFR, alongside the contribution of old stars to the infrared luminosity may relieve some tensions between the inferred star formation rates from submillimetre galaxies and massive galaxies modeled in cosmological hydrodynamic simulations[10].
The end-product of the central submillimetre galaxy at is a galaxy with a stellar mass of , distributed over a similarly compact region of kpc as the gas (Figure 3). This is similar in extent and mass to the compact quiescent galaxy population, an observed population with mean half-light radius of kpc, stellar mass , and ages Gyr[26], suggesting a plausible connection between the galaxy populations. Indeed, a calculation of the stellar velocity dispersion along three orthogonal sightlines of the central during the submillimetre-luminous phase results in km s-1, comparable to measurements of high- compact quiescents. A large sample of simulated SMGs will allow for a robust analysis of expected abundances of SMGs and compact quiescents at .
Our picture for SMG formation suggests that they are not transient events, but rather natural long-lived phases in the evolution of massive halos. The Gyr duty cycle combined with the comoving abundance[27] of dark matter halos of this mass results in an expected abundance of our model SMGs of Mpc-3, comparable to the Mpc-3 observed for SMGs[28]. While modeling the full number counts involves convolving the typical duty cycle as a function of halo mass with halo mass functions over a range of redshifts, the approximate abundances implied by this model are encouraging.
This model suggests that galaxies that form in halos of mass at will represent typical SMGs near the peak of their redshift distribution. Lower mass models show that they do not achieve the requisite star formation rate and metal enrichment to generate submillimetre-luminous galaxies (see Methods section). More extreme SMGs being detected between [29, 30] may form in even more massive (and rare) halos than those considered here.
References
- [1] Casey, C. M., Narayanan, D. & Cooray, A. Dusty star-forming galaxies at high redshift. Physics Reports 541, 45–161 (2014).
- [2] Hickox, R. C. et al. The LABOCA survey of the Extended Chandra Deep Field-South: clustering of submillimetre galaxies. MNRAS 421, 284–295 (2012).
- [3] Geach, J. E. et al. On the Evolution of the Molecular Gas Fraction of Star-Forming Galaxies. ApJ 730, L19 (2011).
- [4] Fu, H. et al. The rapid assembly of an elliptical galaxy of 400 billion solar masses at a redshift of 2.3. Nature 498, 338–341 (2013).
- [5] Daddi, E. et al. Two Bright Submillimeter Galaxies in a z = 4.05 Protocluster in Goods-North, and Accurate Radio-Infrared Photometric Redshifts. ApJ 694, 1517–1538 (2009).
- [6] Swinbank, A. M. et al. The Rest-Frame Optical Spectra of SCUBA Galaxies. ApJ 617, 64–80 (2004).
- [7] Baugh, C. M. et al. Can the faint submillimetre galaxies be explained in the cold dark matter model? MNRAS 356, 1191–1200 (2005).
- [8] Hayward, C. C. et al. Submillimetre galaxies in a hierarchical universe: number counts, redshift distribution and implications for the IMF. MNRAS 428, 2529–2547 (2013).
- [9] Shimizu, I., Yoshida, N. & Okamoto, T. Submillimetre galaxies in cosmological hydrodynamic simulations: source number counts and the spatial clustering. MNRAS 427, 2866–2875 (2012).
- [10] Davé, R. et al. The nature of submillimetre galaxies in cosmological hydrodynamic simulations. MNRAS 404, 1355–1368 (2010).
- [11] Hodge, J. A. et al. An ALMA Survey of Submillimeter Galaxies in the Extended Chandra Deep Field South: Source Catalog and Multiplicity. ApJ 768, 91 (2013).
- [12] Hopkins, P. F. GIZMO: A New Class of Accurate, Mesh-Free Hydrodynamic Simulation Methods. arXiv/1409.7395 (2014).
- [13] Davé, R., Finlator, K. & Oppenheimer, B. D. An analytic model for the evolution of the stellar, gas and metal content of galaxies. MNRAS 421, 98–107 (2012).
- [14] Hopkins, P. F. et al. Galaxies on FIRE (Feedback In Realistic Environments): stellar feedback explains cosmologically inefficient star formation. MNRAS 445, 581–603 (2014).
- [15] Feldmann, R. & Mayer, L. The Argo Simulation: I. Quenching of Massive Galaxies at High Redshift as a Result of Cosmological Starvation. arXiv/1404.3212 (2014).
- [16] Finkelstein, S. L. et al. A galaxy rapidly forming stars 700 million years after the Big Bang at redshift 7.51. Nature 502, 524–527 (2013).
- [17] Weiß, A. et al. ALMA Redshifts of Millimeter-selected Galaxies from the SPT Survey: The Redshift Distribution of Dusty Star-forming Galaxies. ApJ 767, 88 (2013).
- [18] Ivison, R. J. et al. Herschel-ATLAS: A Binary HyLIRG Pinpointing a Cluster of Starbursting Protoellipticals. ApJ 772, 137 (2013).
- [19] Hezaveh, Y. D. et al. ALMA Observations of SPT-discovered, Strongly Lensed, Dusty, Star-forming Galaxies. ApJ 767, 132 (2013).
- [20] Downes, D. & Solomon, P. M. Rotating Nuclear Rings and Extreme Starbursts in Ultraluminous Galaxies. ApJ 507, 615–654 (1998).
- [21] Michałowski, M. J. et al. The stellar masses and specific star-formation rates of submillimetre galaxies. A&A 541, A85 (2012).
- [22] Behroozi, P. S., Wechsler, R. H. & Conroy, C. The Average Star Formation Histories of Galaxies in Dark Matter Halos from z=0-8. arXiv/1207.6105 (2012).
- [23] Tacconi, L. J. et al. Phibss: Molecular Gas Content and Scaling Relations in z ~ 1-3 Massive, Main-sequence Star-forming Galaxies. ApJ 768, 74 (2013).
- [24] Simpson, J. M. et al. The SCUBA-2 Cosmology Legacy Survey: ALMA Resolves the Rest-frame Far-infrared Emission of Sub-millimeter Galaxies. ApJ 799, 81 (2015).
- [25] Kennicutt, R. C. & Evans, N. J. Star Formation in the Milky Way and Nearby Galaxies. ARA&A 50, 531–608 (2012).
- [26] van Dokkum, P. G. et al. Confirmation of the Remarkable Compactness of Massive Quiescent Galaxies at z ~ 2.3: Early-Type Galaxies Did not Form in a Simple Monolithic Collapse. ApJ 677, L5–L8 (2008).
- [27] Murray, S. G., Power, C. & Robotham, A. S. G. HMFcalc: An online tool for calculating dark matter halo mass functions. Astronomy and Computing 3, 23–34 (2013).
- [28] Chapman, S. C., Blain, A. W., Smail, I. & Ivison, R. J. A Redshift Survey of the Submillimeter Galaxy Population. ApJ 622, 772–796 (2005).
- [29] Riechers, D. A. et al. A dust-obscured massive maximum-starburst galaxy at a redshift of 6.34. Nature 496, 329–333 (2013).
- [30] Vieira, J. D. et al. Dusty starburst galaxies in the early Universe as revealed by gravitational lensing. Nature 495, 344–347 (2013).
The authours thank Michał J. Michałowski for providing observational data. Partial support for DN was provided by NSF AST-1009452, AST-1442650, NASA HST AR-13906.001, and a Cottrell College Science Award. PFH, CCH, MT and RT were funded by the Gordon and Betty Moore Foundation (GBMF4561 and Grant #776). PFH acknowledges the Alfred P. Sloan Foundation for support. CAFG was supported by NASA awards PF3-140106, NNX15AB22G, and NSF AST-1412836. DK was supported by NSF AST-1412153. RF was supported by NASA HF-51304.01-A . The simulations here were run on Stampede at TACC through NSF XSEDE allocations #TG- AST120025, TG-AST130039, and TG-AST140023, NASA Pleiades, and the Haverford College cluster.
D.N. wrote the text, and led the radiative transfer simulations and analysis. D.N., M.T., T.R. and R.T. wrote the Powderday software. R.T., C.C.H. and D.B. contributed to simulation analysis, and R.F., P.H., C-A.F-G and D.K. performed the cosmological simulations
Reprints and permissions information is available at www.nature.com/reprints. The authors declare no competing financial interests. Readers are welcome to comment on the online version of the paper. Correspondence and requests for materials should be addressed to D.N. (dnarayan@haverford.edu).
METHODS
1 Cosmological Hydrodynamic Zoom Simulations
We utilise a newly-developed version of TreeSPH that employs a pressure-entropy formulation of smoothed particle hydrodynamics (SPH)[2] that obviates many of the potential discrepancies noted between grid-based codes, traditional SPH codes, and moving-mesh algorithms[3, 4, 5]. In particular, we employ the hydrodynamic code gizmo[12] in P-SPH mode which conserves momentum, energy, angular momentum and entropy, and includes newly developed algorithms to treat the artificial viscosity, entropy diffusion and time-stepping[2, 6]. The gravity solver is a modified version of the gadget-3 solver[7], and an updated softening kernel to better represent the potential of the SPH smoothing kernel is included[8].
The simulations are fully cosmological zoom-in calculations of the evolution of individual galaxies. A 144 Mpc3 cosmological volume was simulated at low resolution down to redshift with dark matter only. The halo of interest was identified, and re-simulated at much higher resolution with baryons included. The initial conditions were generated with the music code[9]. We simulate four zoom galaxies – one is our main galaxy, and the other three are at varying resolutions and masses for the purposes of testing. The main galaxy of interest to this study resides in a dark matter halo mass of M⊙ at . The initial baryonic particle masses in the high-resolution region were , and the minimum baryonic/stars/dark matter force softening lengths were proper pc at . The physical properties of all of the modeled galaxies are presented in ED Table 1 in the Extended Data.
The baryonic physics implemented into gizmo are developed based on extensive tests studying idealised simulations of both isolated disks and galaxy mergers[10, 11, 12, 13, 14, 15]. The gas cools utilising an updated cooling curve to standard[16] implementations in SPH codes which includes both atomic and molecular line emission[17]. The modeled interstellar medium is multiphase. The neutral ISM is broken into an atomic and molecular component following algorithms that scale the molecular fraction with column density and gas phase metallicity[18, 19]. Star formation occurs in molecular gas above a threshold density (here, this is set to cm-3). Star formation is further restricted to gas that is locally self-gravitating, where:
| (1) |
This follows from studies[20] that show that the predicted spatial distribution of star formation in galaxies is more realistic when utilising a gas self-gravitating criterion compared to a variety of other algorithms (including a fixed density threshold, a pure molecular-gas law, a temperature threshold, a Jeans criterion, a cooling-time criterion and a converging flow criterion). The star formation rate follows a volumetric relation:
| (2) |
That is, stars are allowed to form with 100% efficiency per free fall time. The star formation is subsequently self-regulated by stellar feedback, resulting in a time-averaged efficiency on galaxy scales of of [10].
Once stars have formed, they can impact the ISM via various feedback mechanisms. Assuming a Kroupa[21] stellar initial mass function, and utilising starburst99[22] for luminosity, mass-return and supernova rate calculations as a function of stellar age and metallicity, we include the following forms of stellar feedback:
-
1.
Radiation Momentum Deposition: At each timestep, the gas near young stars is impacted by a momentum flux given by
(3) Where is calculated directly from the simulation, as , and = 5(Z/Z⊙) g-1 cm2.
-
2.
Supernovae and Stellar Winds: We utilise tabulated Type-1 and Type-II supernovae rates[23, 22]; if a supernova occurs during a timestep, thermal energy and radial momentum are injected within a smoothing length of the star. Gas and metal return is included as well. Stellar winds are similarly included with energy, wind momentum, mass and metals deposited within a smoothing length.
-
3.
Photoheating of HII regions: The production rate of ionising radiation from stars determines the extent of HII regions (allowing for overlapping regions). These regions are heated to K if the gas is below that threshold.
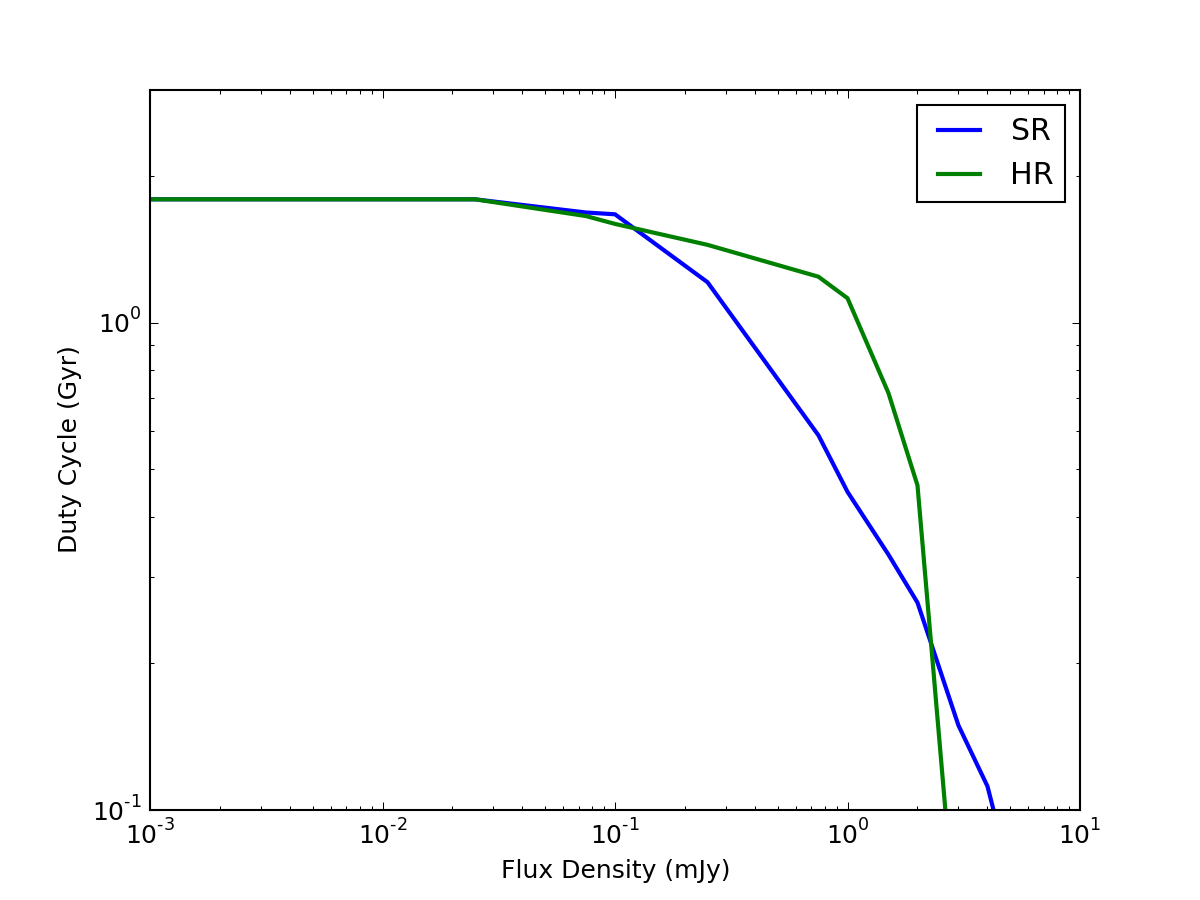
We utilise the second and third models in the Table to test the convergence properties of our simulations. One model is run with the same mass baryonic resolution as our main model (standard resolution; SR), and one a factor of higher resolution (high resolution; HR). In ED Fig 7, we show the modeled duty cycle above a given flux density as a function of flux density for these two models. We see that the shortest lived ( Myr) emission spikes present in the standard resolution model may not be converged in the highest resolution model. Notably, emission with longer duty cycles are either converged, or underpredicted in our standard resolution model, suggesting that the relatively long-lived submillimetre-luminous phase is robust.
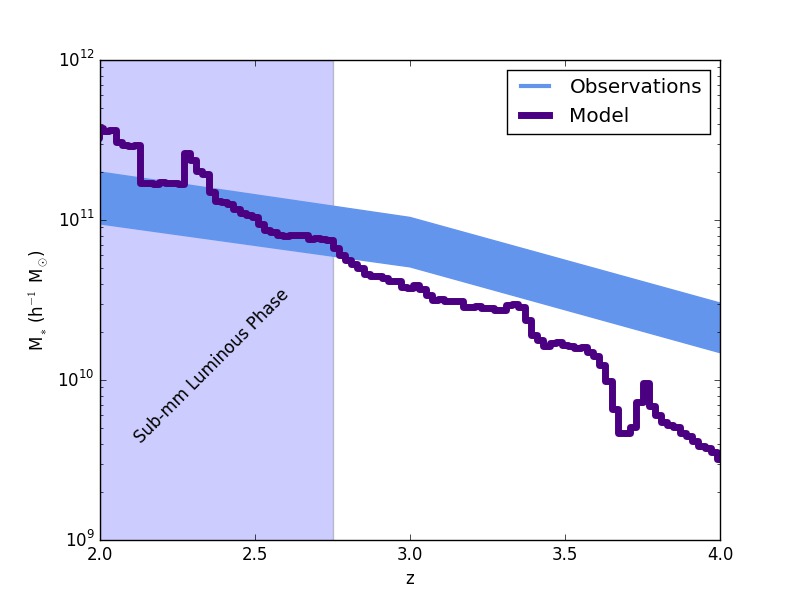
We show the relation for the central in ED Fig 8 as compared to observational constraints[22]. The central galaxy has a stellar mass a factor greater than the observed median stellar mass for comparable mass halos at this epoch. The model galaxy may represent an outlier in the relation at these redshifts. Indeed, the thickness of the observational constraints shows the uncertainty, not range in possible values. Alternatively, it is possible that the inclusion of feedback from an active galactic nucleus (AGN) could impact the stellar mass buildup in the galaxy, though the level to which black hole growth can impact star formation near the submillimetre-luminous phase is unclear. Some models have shown that AGN can grow efficiently in the absence of major mergers[24, 25], while other models and observations suggest that mergers may be necessary to grow massive holes[26, 27, 28]. The last major merger before the submillimetre-luminous phase is Gyr prior. Tests with our low resolution model (m13m14) show that without AGN feedback, residual star formation drives a factor increase in stellar mass at late times (). Finally, we note that a higher mass resolution model could potentially also result in decreased final stellar masses. In our convergence tests, the final (at ) of the HR run is that of the SR run.
2 Dust Radiative Transfer Calculations
To calculate the inferred observational properties of our simulated galaxies, we have developed a dust radiative transfer package, powderday. In short, powderday takes hydrodynamic simulations of galaxies in evolution, projects the gas properties onto an adaptive mesh, and calculates the radiative transfer from the stellar sources through the dusty interstellar medium until an equilibrium dust temperature is achieved.
In detail, we identify galaxies utilising SKID to locate bound groups of baryonic particles[29, 30], and track their progenitors back in time[31, 32]. Galaxies and halos are required to contain at least particles each in order to be identified. We cut out a kpc (side length) region around the galaxy of interest, and subdivide the domain into an adaptive grid with an octree memory structure. Formally, we begin with one cell encompassing the entire kpc3 radiative transfer region. The cells then recursively subdivide into octs until there are a threshold maximum number of gas particles in the cell (we employ , though experiments with show converged results). The physical properties of the gas particles are projected onto the octree using a spline smoothing kernel[33].
The spectral energy distribution of stars are calculated on the fly with the Flexible Stellar Population Synthesis code, fsps[34, 35] through python-fsps, a set of python hooks for fsps (https://github.com/dfm/python-fsps). The SEDs are calculated as simple stellar populations with ages and metallicities determined by the hydrodynamic simulation, and assuming a Kroupa IMF.
The radiative transfer happens in a Monte Carlo fashion utilising the three-dimensional dust radiative transfer solver, hyperion[36]. The code uses an iterative methodology to determine the radiative equilibrium temperature[37], and we determine convergence when the energy absorbed by of the cells has changed by less than between iterations. We assume a dust grain-size distribution comparable to that of the Milky Way[38], with . The dust emissivities are updated to include an approximation for polycyclic aromatic hydrocarbons (PAHs) alongside thermal emission[39]. We assume a constant dust to metals ratio of , motivated by both Milky Way and extragalactic observational constraints[40, 41, 42].
3 Parameter Choices
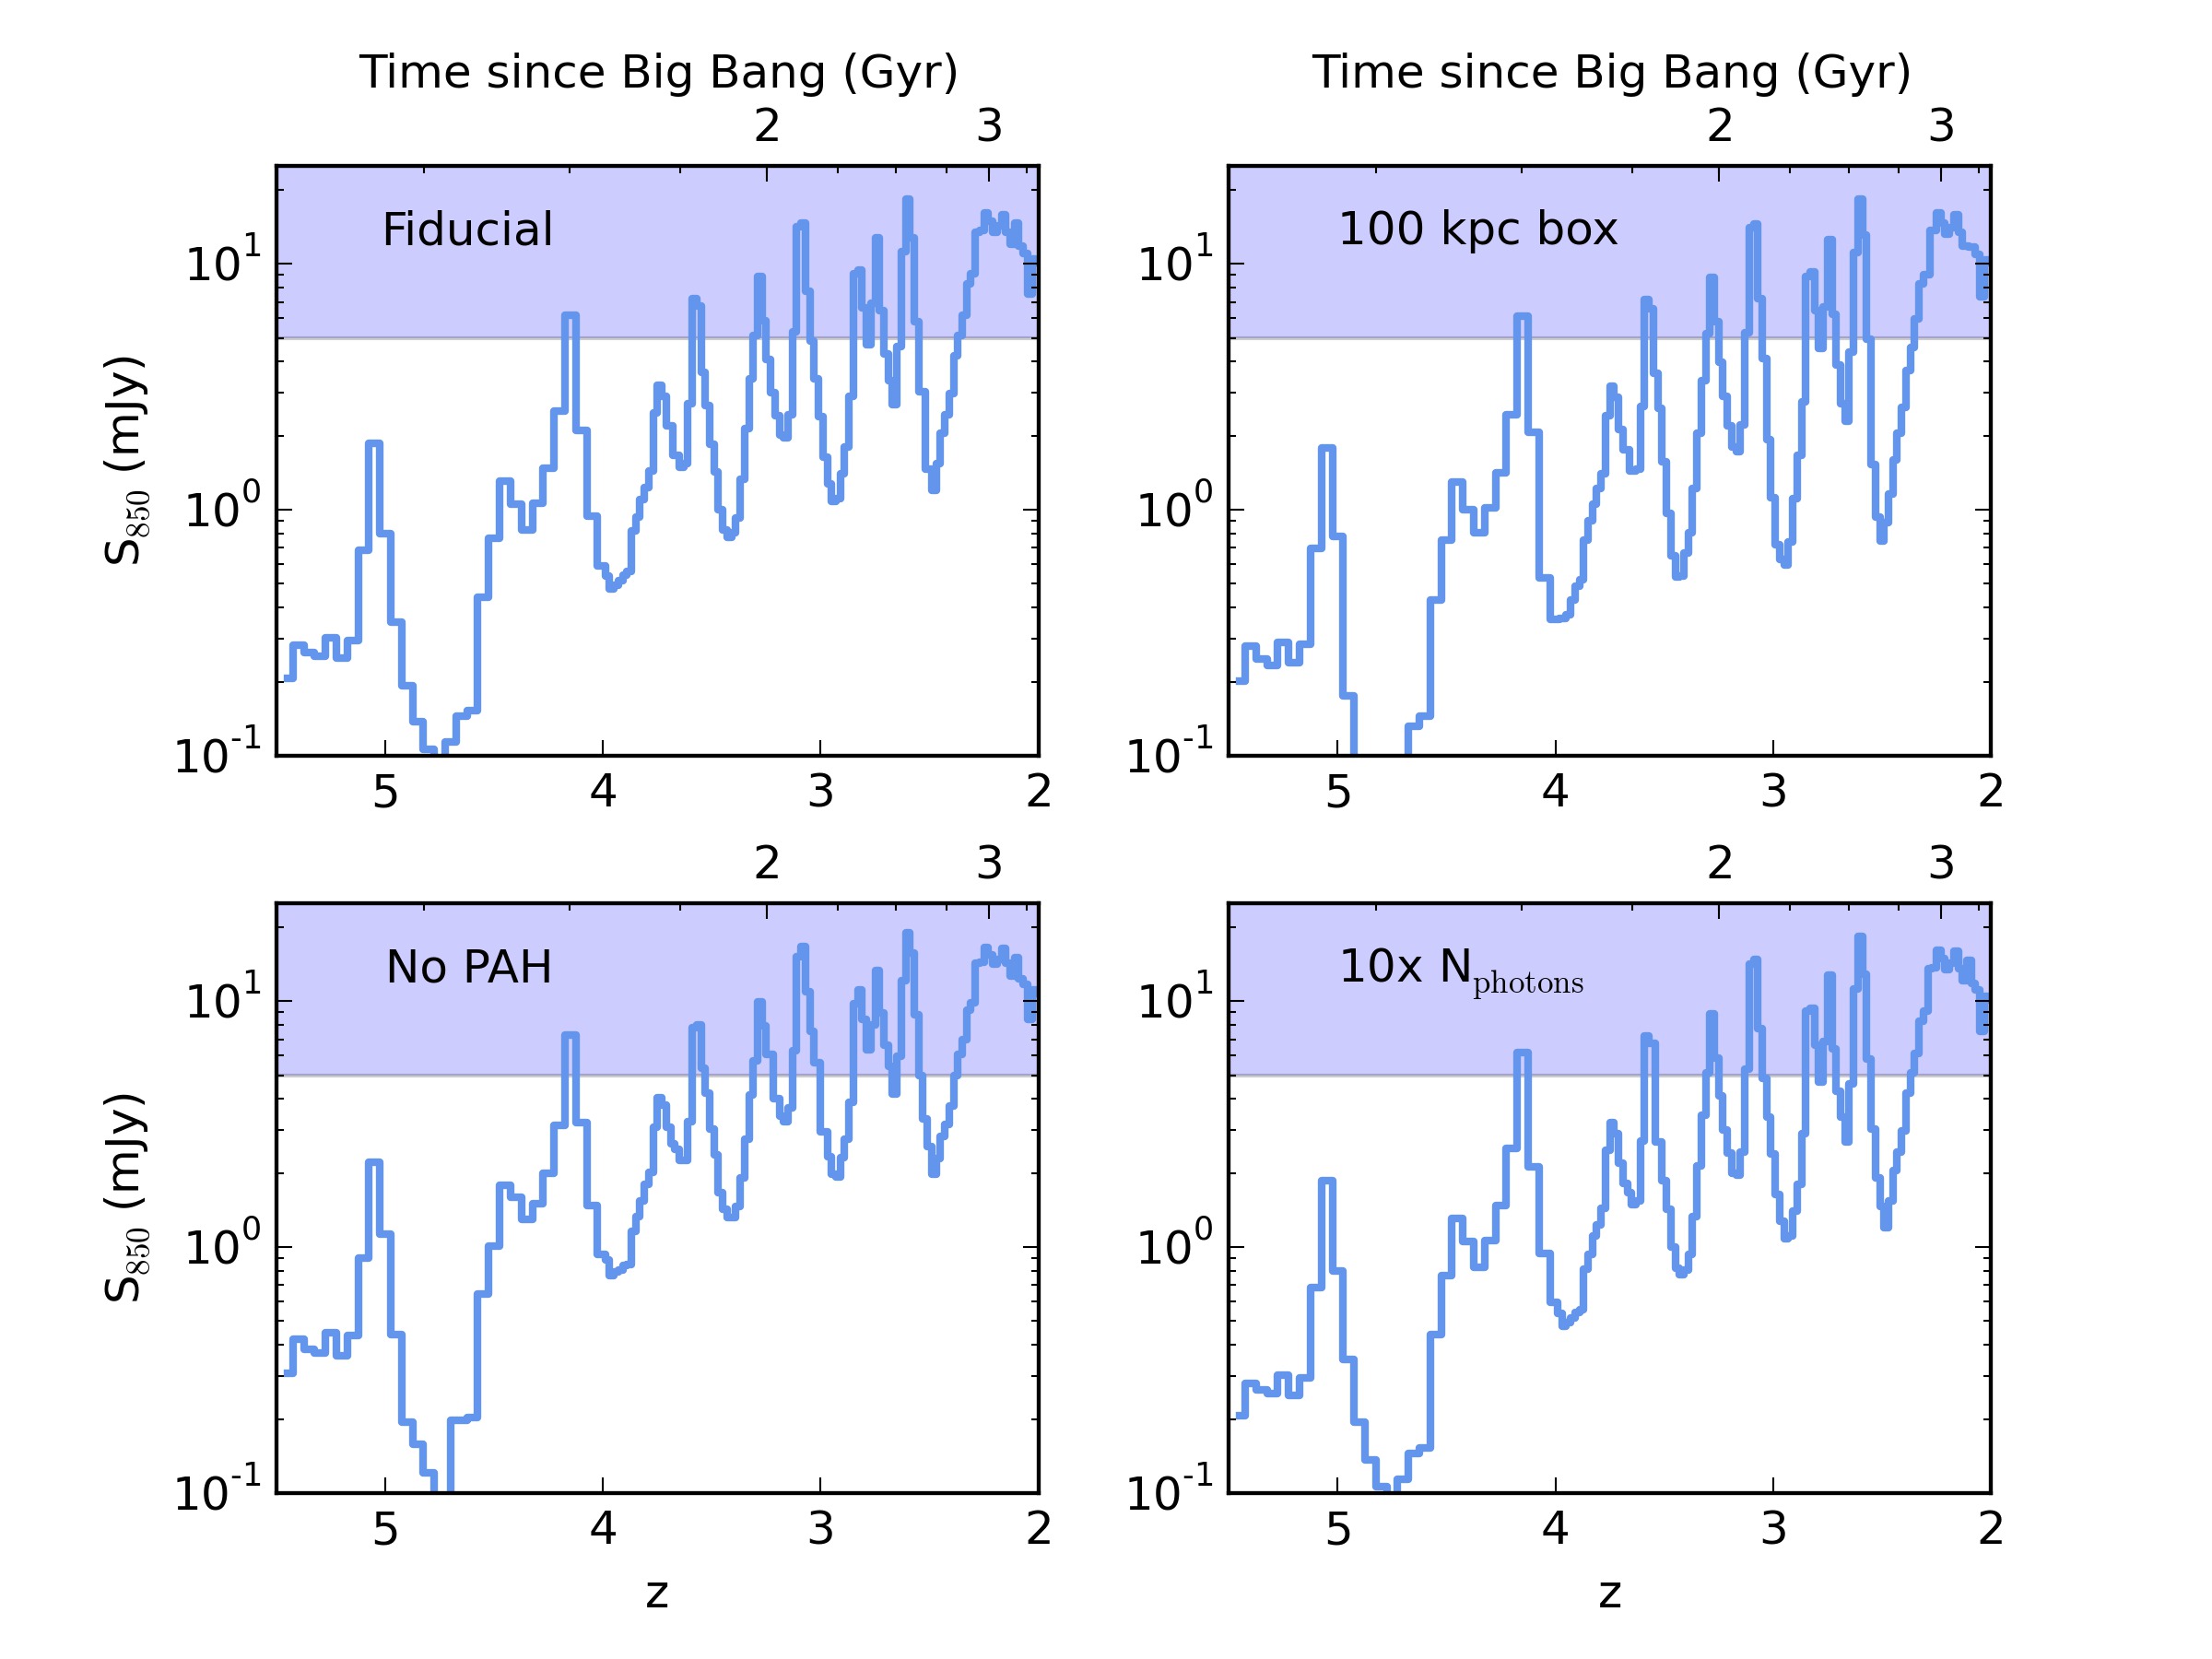
In ED Fig 9, we present a number of tests of our parameter choices for the radiative transfer calculations. We show the predicted m light curve from our lowest resolution model (m13m14) utilising both fiducial parameters, as well as three parameter choice variations.
We first ask whether our chosen radiative transfer grid size affects our principle results. Our fiducial model is a kpc (on a side) box cut out of the global cosmological simulation centred on the halo of interest. This size was chosen to reflect a rough average of the typical (sub)millimetre beam sizes typically used to detect SMGs. For example, assuming Planck 2013 cosmological parameters[47], the Submillimetre Common-Use Bolometer Array (SCUBA) on the James Clerk Maxwell Telescope (JCMT) has a full width at half maximum (FWHM) beam at m. At this corresponds to kpc. At the same redshift, the beam of AzTEC and LABOCA at 1 mm on the JCMT corresponds to kpc (); The South Pole Telescope (SPT) has a beamsize of kpc at 1.4 mm (); and Herschel’s SPIRE instrument ranges from kpc (m; ).
Because a few notable beam sizes (of particular relevance, the SCUBA beam) are smaller than our assumed box size of kpc, we have run an additional model with box length kpc (all other parameters exactly the same). We highlight the resultant 850 m light curve from this model in the top right panel of ED Fig 9. When comparing to our fiducial model, it is apparent that our results are robust to the highest resolution beams that have been used for SMG surveys at single dish facilities to date.
We additionally investigate whether our inclusion of PAHs in our model makes any difference to the calculated submillimetre-wave flux density of our model galaxy. This is presented in the bottom left panel of ED Fig 9. Again, we note minimal impact on the submillimetre SED of our model.
Finally, we ensure that our results are converged with the number of photons emitted. We fiducially run photons per grid (roughly 100 per cell). In the bottom-right, we show the results from a run with photons per grid, and show that the results are robust against this parameter choice.
4 Relation to other Models
Historically, the methods used, and physical models for SMG formation in numerical simulations are quite varied. Here, we summarise these methods and results, and place our own model into this context. Broadly, there are three classes of SMG formation models: cosmological semi-analytic models (SAMs), idealised non-cosmological simulations, and cosmological hydrodynamic models. The present model falls into the latter category. Our presented model is the first self-consistent cosmological simulation with baryons and bona fide radiative transfer to form a submillimetre galaxy with physical properties comparable to those observed.
The initial forays into this field were typically with SAMs. This owes to the fact that SAMs are computationally inexpensive, and allow for a large search in physical parameter space relatively easily. SAMs either utilise analytic halo merger trees, or directly simulate them, and then employ analytic prescriptions to describe the central galaxies. The Durham SAM[7, 48] couples galaxies formed in a semi-analytic model with dust radiative transfer. These simulations model galaxies that have axisymmetric geometries that consist of a disc and a bulge. Young stellar populations are assumed to still be enveloped in their birth clouds, and thus experience additional attenuation. This model suggests that SMGs typically owe to major mergers, the remainder as minor mergers, and that the stellar initial mass function is flat during the starburst. The typical duty cycle for the submillimetre-luminous phase is Myr (a factor lower than found in our work), galaxies extremely gas rich (), and stellar masses a factor lower than our model (). While the stellar masses of SMGs are debated[49, 21, 50], the gas fractions appear to be uniformly lower in observations[51, 52, 4, 18, 23], and a flat stellar initial mass function likely ruled out by CO dynamical mass measurements[53].
As an alternative to cosmological simulations, a number of works have explored SMG formation in idealised simulations[54, 55, 56, 57, 8]. These works evolve hydrodynamic models of idealised discs and mergers over a range of merger mass ratios, and combine these with dust radiative transfer simulations[45]. These models infer halo masses and stellar masses for SMGs comparable to those modeled here. This said, in the idealised galaxy models, of the SMGs (flux dependent) owe to merger-driven starbursts, substantially higher than what is found for our model. Some works[8] have noted that binary mergers that cause SMGs may break up into multiples at high-resolution owing to the contribution to the total flux of individual inspiralling discs. Because idealised simulations are non-cosmological in nature, comparing the multiplicity inferred from these to our models is difficult: the major merger multiplicity can only be 2 when considering galaxies at the same redshift. On the other hand ED Fig 2 suggests potentially larger multiplicity can be observed for physically associated clumps.
To fully capture the cosmic environment of SMGs in formation, as well as their baryonic structure and morphology, cosmological hydrodynamic simulations are likely the best tool. Thusfar, cosmological hydrodynamic simulations used to simulate SMGs have not employed direct radiative transfer models[10]. As such, inferring when a galaxy is an SMG in cosmological simulations has necessitated the use of parameterised emission models, such as assumed grey-body emission laws[9], or star formation rate thresholds[10]. The physical properties for SMGs derived from the most extensive of these works[10] (i.e. , , and ) are similar to the model presented here, though with roughly a factor difference in SFR.
5 Code Availability
We have made powderday available at https://bitbucket.org/desika/powderday, and GIZMO available at https://bitbucket.org/phopkins/gizmo
References
- [1]
- [2] Hopkins, P. F. A general class of Lagrangian smoothed particle hydrodynamics methods and implications for fluid mixing problems. MNRAS 428, 2840–2856 (2013).
- [3] Agertz, O. et al. Fundamental differences between SPH and grid methods. MNRAS 380, 963–978 (2007).
- [4] Sijacki, D., Vogelsberger, M., Kereš, D., Springel, V. & Hernquist, L. Moving mesh cosmology: the hydrodynamics of galaxy formation. MNRAS 424, 2999–3027 (2012).
- [5] Hayward, C. C., Torrey, P., Springel, V., Hernquist, L. & Vogelsberger, M. Galaxy mergers on a moving mesh: a comparison with smoothed-particle hydrodynamics. arXiv/1309.2942 (2013).
- [6] Faucher-Giguere, C.-A. et al. Neutral hydrogen in galaxy halos at the peak of the cosmic star formation history. arXiv/1409.1919 (2014).
- [7] Springel, V., Di Matteo, T. & Hernquist, L. Modelling feedback from stars and black holes in galaxy mergers. MNRAS 361, 776–794 (2005).
- [8] Barnes, J. E. Gravitational softening as a smoothing operation. MNRAS 425, 1104–1120 (2012).
- [9] Hahn, O. & Abel, T. Multi-scale initial conditions for cosmological simulations. MNRAS 415, 2101–2121 (2011).
- [10] Hopkins, P. F., Quataert, E. & Murray, N. Self-regulated star formation in galaxies via momentum input from massive stars. MNRAS 417, 950–973 (2011).
- [11] Hopkins, P. F., Quataert, E. & Murray, N. The structure of the interstellar medium of star-forming galaxies. MNRAS 421, 3488–3521 (2012).
- [12] Hopkins, P. F., Narayanan, D., Murray, N. & Quataert, E. Dense molecular gas: a sensitive probe of stellar feedback models. MNRAS 433, 69–77 (2013).
- [13] Hopkins, P. F. et al. Star formation in galaxy mergers with realistic models of stellar feedback and the interstellar medium. MNRAS 430, 1901–1927 (2013).
- [14] Hopkins, P. F. et al. Resolving the generation of starburst winds in Galaxy mergers. MNRAS 433, 78–97 (2013).
- [15] Narayanan, D. & Hopkins, P. F. Why is the Milky Way X-factor constant? MNRAS (2013).
- [16] Katz, N., Weinberg, D. H. & Hernquist, L. Cosmological Simulations with TreeSPH. ApJS 105, 19–+ (1996).
- [17] Ferland, G. J. et al. The 2013 Release of Cloudy. RMXAA 49, 137–163 (2013).
- [18] Krumholz, M. R., McKee, C. F. & Tumlinson, J. The Atomic-to-Molecular Transition in Galaxies. I. An Analytic Approximation for Photodissociation Fronts in Finite Clouds. ApJ 689, 865–882 (2008).
- [19] Krumholz, M. R. & Gnedin, N. Y. A Comparison of Methods for Determining the Molecular Content of Model Galaxies. ApJ 729, 36–+ (2011).
- [20] Hopkins, P. F., Narayanan, D. & Murray, N. The meaning and consequences of star formation criteria in galaxy models with resolved stellar feedback. MNRAS 432, 2647–2653 (2013).
- [21] Kroupa, P. The Initial Mass Function of Stars: Evidence for Uniformity in Variable Systems. Science 295, 82–91 (2002).
- [22] Leitherer, C. et al. Starburst99: Synthesis Models for Galaxies with Active Star Formation. ApJS 123, 3–40 (1999).
- [23] Mannucci, F., Della Valle, M. & Panagia, N. Two populations of progenitors for Type Ia supernovae? MNRAS 370, 773–783 (2006).
- [24] Bellovary, J. et al. The Relative Role of Galaxy Mergers and Cosmic Flows in Feeding Black Holes. ApJ 779, 136 (2013).
- [25] Anglés-Alcázar, D. et al. Torque-limited Growth of Massive Black Holes in Galaxies across Cosmic Time. ApJ 800, 127 (2015).
- [26] Hopkins, P. F., Kocevski, D. D. & Bundy, K. Do we expect most AGN to live in discs? MNRAS 445, 823–834 (2014).
- [27] Kocevski, D. D. et al. CANDELS: Constraining the AGN-Merger Connection with Host Morphologies at z ~ 2. ApJ 744, 148 (2012).
- [28] Treister, E., Schawinski, K., Urry, C. M. & Simmons, B. D. Major Galaxy Mergers Only Trigger the Most Luminous Active Galactic Nuclei. ApJ 758, L39 (2012).
- [29] Governato, F. et al. The Local Group as a test of cosmological models. New A 2, 91–106 (1997).
- [30] Stadel, J. G. Cosmological N-body simulations and their analysis. Ph.D. thesis, UNIVERSITY OF WASHINGTON (2001).
- [31] Thompson, R. pyGadgetReader: GADGET snapshot reader for python. Astrophysics Source Code Library (2014). 1411.001.
- [32] Thompson, R. SPHGR: Smoothed-Particle Hydrodynamics Galaxy Reduction. Astrophysics Source Code Library (2015). 1502.012.
- [33] Turk, M. J. et al. yt: A Multi-code Analysis Toolkit for Astrophysical Simulation Data. ApJS 192, 9 (2011).
- [34] Conroy, C., Gunn, J. E. & White, M. The Propagation of Uncertainties in Stellar Population Synthesis Modeling. I. The Relevance of Uncertain Aspects of Stellar Evolution and the Initial Mass Function to the Derived Physical Properties of Galaxies. ApJ 699, 486–506 (2009).
- [35] Conroy, C. & Gunn, J. E. The Propagation of Uncertainties in Stellar Population Synthesis Modeling. III. Model Calibration, Comparison, and Evaluation. ApJ 712, 833–857 (2010).
- [36] Robitaille, T. P. HYPERION: an open-source parallelized three-dimensional dust continuum radiative transfer code. A&A 536, A79 (2011).
- [37] Lucy, L. B. Computing radiative equilibria with Monte Carlo techniques. A&A 344, 282–288 (1999).
- [38] Weingartner, J. C. & Draine, B. T. Dust Grain-Size Distributions and Extinction in the Milky Way, Large Magellanic Cloud, and Small Magellanic Cloud. ApJ 548, 296–309 (2001).
- [39] Robitaille, T. P. et al. A self-consistent model of Galactic stellar and dust infrared emission and the abundance of polycyclic aromatic hydrocarbons. A&A 545, A39 (2012).
- [40] Dwek, E. The Evolution of the Elemental Abundances in the Gas and Dust Phases of the Galaxy. ApJ 501, 643–+ (1998).
- [41] Vladilo, G. Dust and Elemental Abundances in Damped Ly alpha Absorbers. ApJ 493, 583–+ (1998).
- [42] Watson, D. The Galactic dust-to-metals ratio and metallicity using gamma-ray bursts. A&A 533, A16 (2011).
- [43] Pascucci, I. et al. The 2D continuum radiative transfer problem. Benchmark results for disk configurations. A&A 417, 793–805 (2004).
- [44] Jonsson, P. SUNRISE: polychromatic dust radiative transfer in arbitrary geometries. MNRAS 372, 2–20 (2006).
- [45] Jonsson, P., Groves, B. A. & Cox, T. J. High-resolution panchromatic spectral models of galaxies including photoionization and dust. MNRAS 186–+ (2010).
- [46] Torrey, P. et al. Synthetic galaxy images and spectra from the Illustris simulation. MNRAS 447, 2753–2771 (2015).
- [47] Planck Collaboration et al. Planck 2013 results. XVI. Cosmological parameters. A&A 571, A16 (2014).
- [48] González, J. E., Lacey, C. G., Baugh, C. M. & Frenk, C. S. The role of submillimetre galaxies in hierarchical galaxy formation. MNRAS 413, 749–762 (2011).
- [49] Hainline, L. J. et al. The Stellar Mass Content of Submillimeter-selected Galaxies. ApJ 740, 96 (2011).
- [50] Michałowski, M. J. et al. Determining the stellar masses of submillimetre galaxies: the critical importance of star formation histories. A&A 571, A75 (2014).
- [51] Bothwell, M. S. et al. A survey of molecular gas in luminous sub-millimetre galaxies. MNRAS 429, 3047–3067 (2013).
- [52] Narayanan, D., Bothwell, M. & Davé, R. Galaxy gas fractions at high redshift: the tension between observations and cosmological simulations. MNRAS 426, 1178–1184 (2012).
- [53] Tacconi, L. J. et al. Submillimeter Galaxies at z ~ 2: Evidence for Major Mergers and Constraints on Lifetimes, IMF, and CO-H2 Conversion Factor. ApJ 680, 246–262 (2008).
- [54] Chakrabarti, S., Fenner, Y., Cox, T. J., Hernquist, L. & Whitney, B. A. An Evolutionary Model For Submillimeter Galaxies. ApJ 688, 972–989 (2008).
- [55] Narayanan, D., Cox, T. J., Hayward, C. C., Younger, J. D. & Hernquist, L. The star-forming molecular gas in high-redshift Submillimetre Galaxies. MNRAS 400, 1919–1935 (2009).
- [56] Narayanan, D. et al. The formation of high-redshift submillimetre galaxies. MNRAS 401, 1613–1619 (2010).
- [57] Hayward, C. C. et al. What Does a Submillimeter Galaxy Selection Actually Select? The Dependence of Submillimeter Flux Density on Star Formation Rate and Dust Mass. ApJ 743, 159 (2011).
- [58] Narayanan, D., Krumholz, M. R., Ostriker, E. C. & Hernquist, L. A general model for the CO-H2 conversion factor in galaxies with applications to the star formation law. MNRAS 421, 3127–3146 (2012).
| Model Name | Model Purpose | (z=2) | (z=2) | Final Redshift | ||||
|---|---|---|---|---|---|---|---|---|
| pc | pc | |||||||
| B100 | Main Model | 9 | 142 | 2 | ||||
| TL37 SR | Resolution Test | 9 | 142 | 2 | ||||
| TL37 HR | Resolution Test | 9 | 142 | 2 | ||||
| m13m14 | RT Parameter Survey | 70 | 700 | 0.2 |