From Nanopores to Macropores: Fractal Morphology of Graphite
Abstract
We present a comprehensive structural characterization of two different highly pure nuclear graphites that compasses all relevant length scales from nanometers to sub-mm. This has been achieved by combining several experiments and neutron techniques: Small Angle Neutron Scattering (SANS), high-resolution Spin Echo SANS (SESANS) and neutron imaging. In this way it is possible to probe an extraordinary broad range of 6 orders of magnitude in length from microscopic to macroscopic length scales. The results reveal a fractal structure that extends from nm to 0.6 mm and has surface and mass fractal dimensions both very close to 2.5, a value found for percolating clusters and fractured ranked surfaces in 3D.
1 Introduction
Graphite has been used as a neutron moderator in several types of nuclear reactors from the Chicago Pile 1 in 1942 to the more recent Very High Temperature Reactor (VHTR) and High Temperature Gas-cooled Reactors (HTGR). This synthetic polygranular material has a very high chemical purity and a complex microstructure, which affects the mechanical properties under extreme conditions and irradiation damage [1].
The crystallite structure and disorder of graphite at the atomic level can be investigated by neutron or X-ray diffraction [2], and the microstructure by TEM, SEM or optical microscopy [3, 4, 5, 6, 7].
On the other hand, the bulk mesoscopic structure of the pores can be explored by small angle scattering of X-rays (SAXS) or neutrons (SANS) [8]. Very first SANS measurements on non-irradiated and irradiated nuclear graphites were performed in the 1960’s [9] and 1970’s [10, 11, 12]. These results have been reinterpreted recently [13] to
disclose a surface fractal structure from to 300 nm, i.e. over three orders of magnitude in length. However, the graphite inhomogeneities can be seen with an optical microscope or even with naked eye. Therefore an exploration over a larger range of length scales is necessary and for this purpose we have combined three neutron-based techniques: SANS, Spin Echo SANS (SESANS) and imaging to cover lengths from nm to mm. We investigated two different highly pure nuclear graphites, and the results show a fractal structure over an extraordinary large scale of lengths that spans 6 orders of magnitude and has fractal dimensions close to 2.5. This value is expected for several cases of percolating clusters [14, 15] and in the most general case of fractured ranked surfaces [16] in three dimensions.
2 Methods
2.1 Sample
The samples were disk-shape specimens with a thickness of 0.5 mm and a diameter of 16 mm cut from two types of nuclear graphite, designated as RID and PGA. The RID graphite was manufactured by Pechiney SA in the 1960’s by baking a paste made of oil coke and pitch, graphitized by electrical heating, and was used at the research reactor of the Reactor Institute Delft. The PGA (Pile Grade A) graphite was manufactured by British Acheson Electrodes, Ltd. and Anglo Great Lakes, from needle shaped coke particles derived from the petroleum industry. It was used in the early gas-cooled reactors in UK and has been object of several investigations [17, 4, 7]. PGA was manufactured by extrusion, which leads to aligned coke particles along a direction and thus to the anisotropic properties. For this reason we produced two series of samples: PGA1 cut perpendicular to , and thus isotropic; and PGA2 cut along and thus anisotropic. For the sake of simplicity in the following we will focus on PGA1 and the results from PGA2 are averaged over the whole sample as for the other two samples. In this work, the supplement gives a detailed analysis of the results from the PGA2 sample and the anisotropy effect, which is weak but nevertheless visible.
2.2 Neutron-matter interaction
Since neutrons are electrically neutral, they can penetrate into matter deeply, only interacting with the nucleii, and are valuable probes of the structure in the bulk. When a beam of thermal neutrons interacts with a sample it may be scattered or absorbed with a respective probability that is given by the scattering lengths and the absorption cross sections of the specific elements and isotopes in the sample (for a comprehensive introduction to neutron scattering see [20]). These transmitted and scattered neutrons deliver structural information from the sample. In the following we will introduce the techniques used in our work.
2.3 Small Angle Neutron Scattering (SANS)
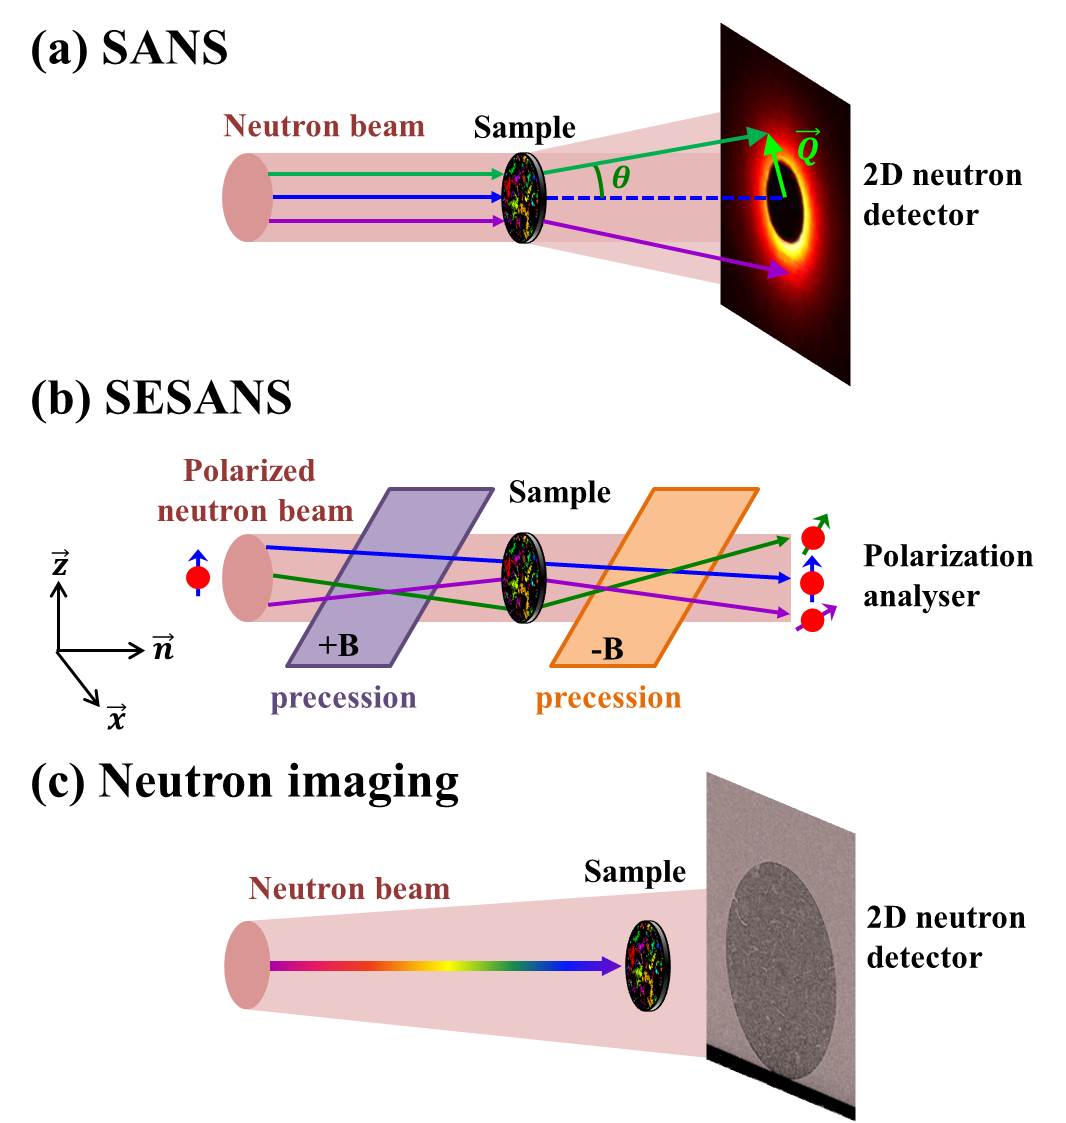
Fig. 1a shows a schematic diagram of a SANS experiment. A neutron beam with a wavelength is scattered by the structural inhomogeneities (pores/carbon matrix in the case of graphite) and recorded by a 2D position-sensitive neutron detector. The transmitted beam is captured by a beam-stop made of neutron-absorbing material, illustrated by the black circular area in the resulting scattering pattern in Fig. 1a.
SANS measures the intensity of scattered beam , i.e. the scattering cross section, as a function of the scattering vector that is related to the scattering angle
through . can be factorized as [20]:
| (1) |
Here is a pre-factor given by the neutron scattering length density contrast, in our case between the carbon matrix and the pores. is the form factor characterizing the morphology/shape of the pores, and is the structure factor corresponding to the correlations between pores.
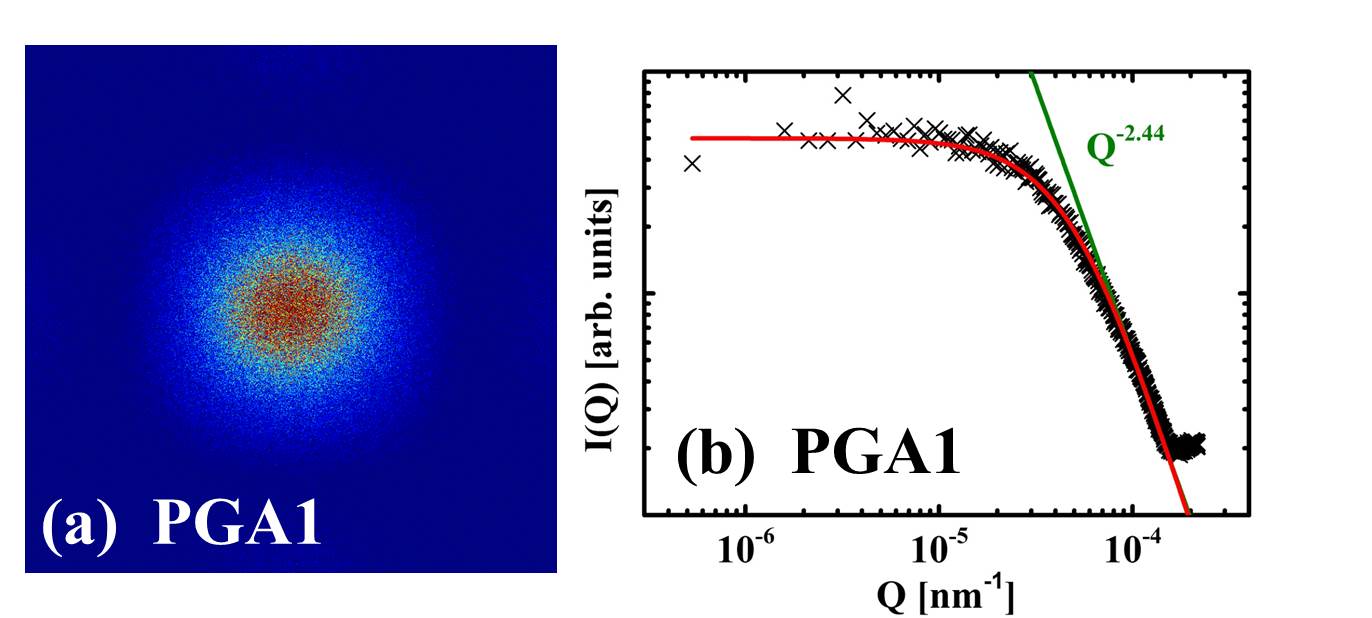
In this work SANS measurements were performed at two instruments, the medium resolution PAXE and the high resolution TPA [21] of the Laboratoire Léon Brillouin (LLB), CEA Saclay, France. On both instruments the neutron beam had a monochromatization of . The experiments on TPA were done at =0.6 nm, covering the Q range nm-1, and on PAXE at =0.37, 0.6, and 1.7 nm, respectively, covering the Q range . The PAXE data for =0.6 nm were brought to absolute units by normalization to the incident beam and were then used to normalise all other data using the large overlap in the Q-ranges illustrated by Fig. 2a for the case of PGA1.
2.4 Spin Echo Small Angle Neutron Scattering (SESANS)
The basic principles of SESANS can be found in [22], and Fig. 1b represents schematically this technique. In contrast to conventional SANS, SESANS reaches high resolution accessing structural information on micrometres length scales by using a polarized neutron beam. Larmor precessions are induced in two regions with opposite magnetic fields, and if the setup is symmetric, the beam recovers its initial state, leading to a maximum spin echo polarization. Scattering from the sample breaks the symmetry and reduces the echo polarization. SESANS measures the spin echo polarization as a function of the spin echo length [23], the direction of which is determined by the geometry of the setup and it is always perpendicular to the propagation direction of the neutron beam (see Fig. 1b). measures the projected scattering length density correlation function :
| (2) |
and is the Hankel transformation of the SANS cross section:
| (3) |
where is the wavelength of the neutron beam, is the sample thickness, and is a zeroth-order Bessel function of the first kind.
The high-resolution neutron Spin Echo SANS experiments were performed on the dedicated instrument of the Reactor Institute Delft [22] at =0.205 nm, with and covered length scales from 30 nm to 20 m.
2.5 Neutron imaging
Fig. 1c shows a schematic view of a neutron imaging experiment. The incident polychromatic neutron beam passes through a sample. The intensity is attenuated due to absorption and/or scattering and is recorded by a 2D camera-type neutron detector. Since different phases in the sample have different attenuation coefficients, the resulting image visualizes the structural inhomogeneities of the sample.
Neutron imaging was performed on the cold neutron facility, ICON, of the Paul Scherrer Institute, Switzerland [24]. The samples were placed as close as possible to the detector and a resolution of 30 m was obtained. The transmission images were normalized to the empty beam and treated to obtain 8-bit digital images. These were further analysed with the DIPimage Matlab toolbox (http://www.diplib.org/) as described in the supplement.
3 Results
3.1 SANS
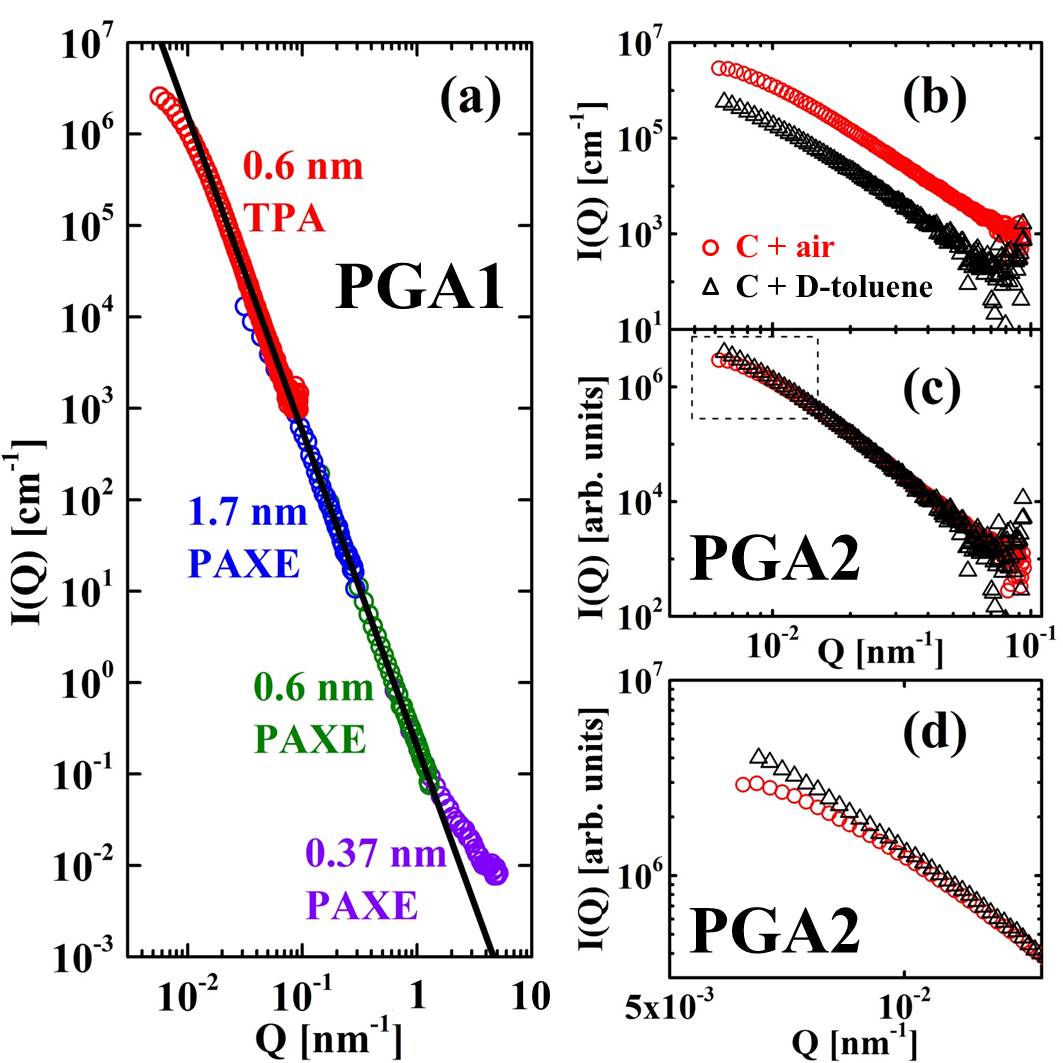
The absolute scattering cross section of PGA1, shown in Fig. 2a, follows a power law with . Similar results have been obtained for the other samples and the values of are given in Table 1. Deviations at high-Q’s are mainly due to (spin-incoherent) background, whereas at low Q’s to multiple scattering. Graphite is a strong neutron scatterer, a property used for nuclear applications, and multiple scattering is not negligible even for the thin samples used in this study, as illustrated by the transmission values given in the supplement. For this reason SANS was also measured by embedding one sample (PGA2) in deuterated toluene, which reduces the scattering contrast. As a consequence the transmission increased and the scattered neutron intensity decreased by almost an order of magnitude as shown in Fig. 2b. However, the shape stays unchanged with the exception of the very low-Q range illustrated by Fig. 2c, where the two curves are shifted on the log-log scale. In the enlarged view of Fig. 2d, it is clear that the bending characteristic for multiple scattering [25] is less pronounced for the sample in deuterated toluene. Thus multiple scattering has an influence on the SANS patterns but does not affect the power law, which is the same for both cases and reflects the genuine structural properties of the sample. Similar behaviour has been found in expanded graphite [18] and sedimentary rocks samples [26].
3.2 SESANS
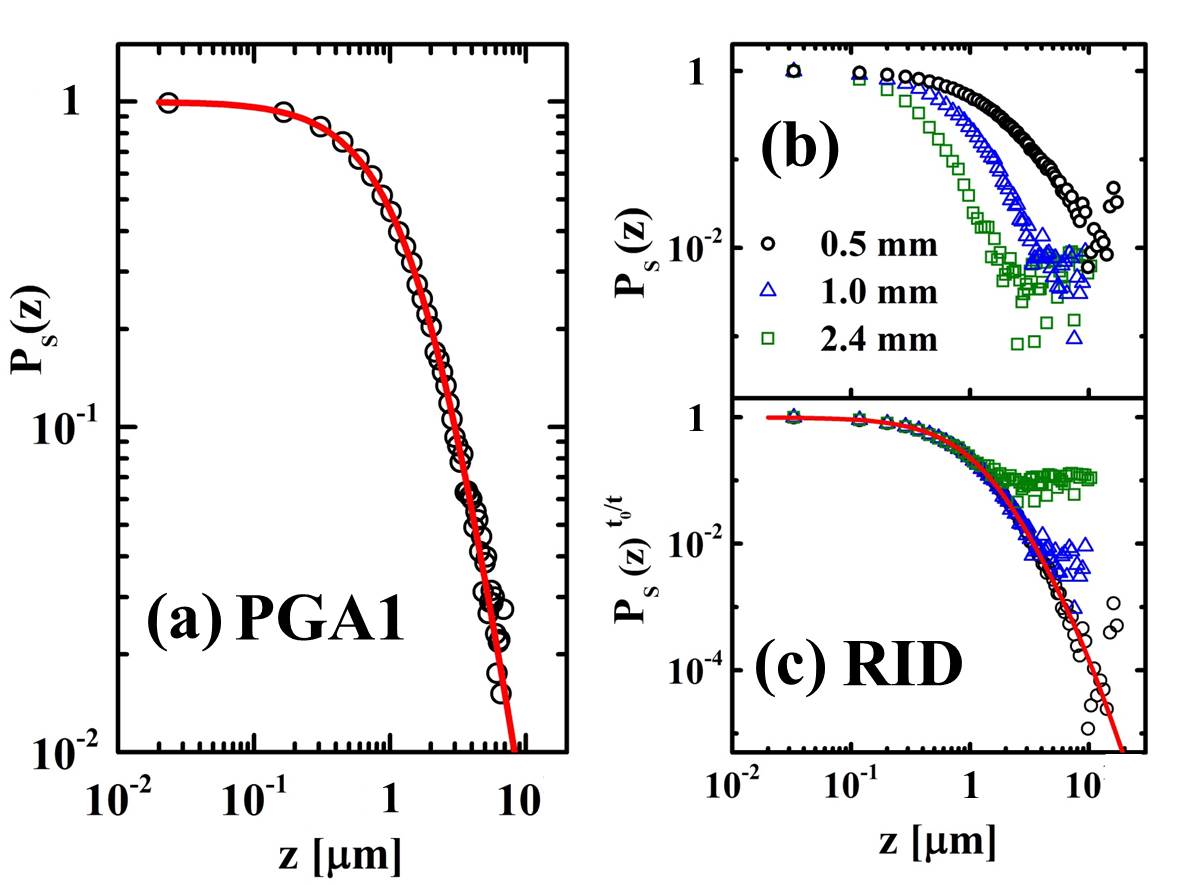
Fig. 3a shows the SESANS pattern of PGA1. As already mentioned, SESANS measures the Hankel transformation of in the form of normalised (to the direct beam) SESANS polarization , which is a function of the spin echo length [23]. It probes length ranges from 30 nm to 20 m, and thus ”sees” very large objects, which scatter a large fraction of the incoming beam. This is also the case in Fig. 3a, where even for the 0.5 mm PGA1 sample at large spin echo lengths , the entire beam is scattered and . However, even in this extreme case multiple scattering does not alter the results. This effect can indeed be accounted in a way similar to the Beer-Lambert’s law in optics and if is the SESANS signal for a reference sample thickness , the SESANS signal for any other thickness is given by: [27]. This property was tested on three RID samples with thicknesses of 0.5, 1 and 2.4 mm respectively. As shown in Fig. 3b, decreases much faster for the thicker samples. However, when plotting , with =1 mm, all data follow on the same generic curve shown in Fig. 3c, with deviations when is smaller than the experimental error of . More importantly, these results show that the porous structure extends up to macroscopic length scales, which can be investigated by direct imaging.
3.3 Neutron imaging
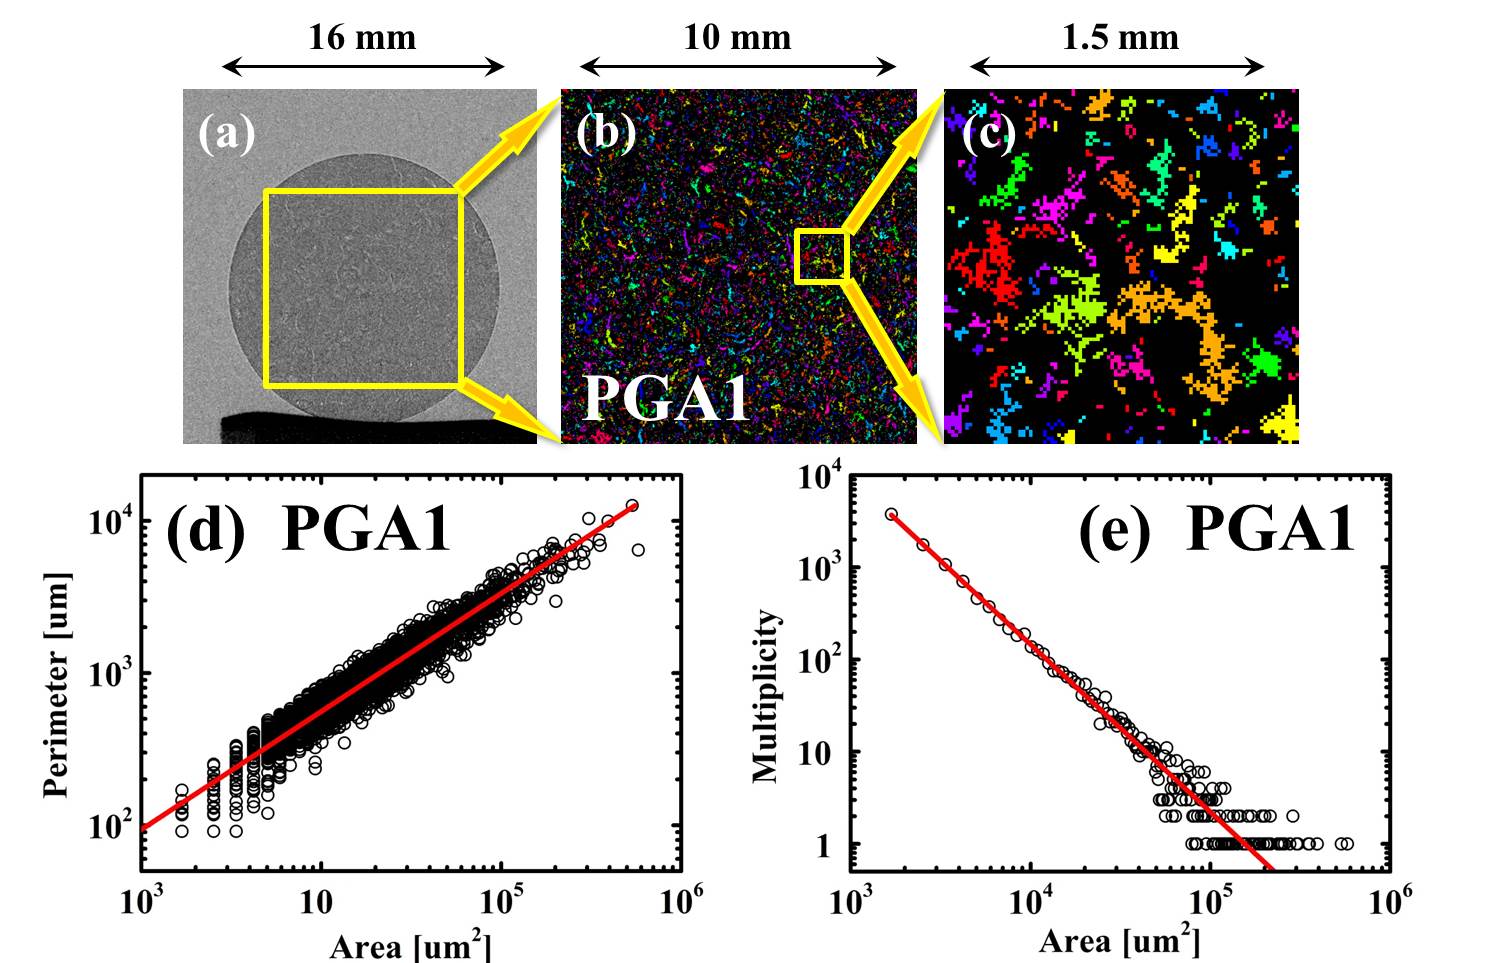
Fig. 4a shows the neutron transmission image of the PGA1 sample (the images for the other samples are in the supplement). The treatment of this image (see supplement) leads to a binary image, where the pores are distinguishable from the carbon matrix. Consequently the pores within the selected yellow square (of size pixel) are labelled with different colours according to their sizes and shapes. This leads to Fig. 4b, and a selected region enlarged in (c) reveals a strongly ramified, fractal structure. This structure may be brought in relation with the reported micropores [3, 4, 5, 7], that result from calcination and gas evolution during the manufacturing process and have sizes from several micrometres to hundreds of micrometres without preferred orientations. The binary images also lead to an estimation of the porosity , which is about 82-85% of the porosity determined from density measurements, considering 2.25 g/cm3 as the density of single crystalline graphite. Thus pores smaller than the 30 m (resolution limit of the images) contribute only by 15-18% to the total porosity.
The plot of the pore perimeter against area for PGA1 (the plots for other samples are given in the supplement), shown in Fig. 4d, reveals a power law with (red line in the figure). This value is higher than 0.5, the value expected for Euclidian geometry, and is thus a signature of fractality. We note that in this figure the points have different multiplicities. The pore size multiplicity is plotted against in Fig. 4e, where with , illustrated by the red line in the figure, and the values of for other samples are listed in Table 1. Thus the total volume of pores with specific area size is given by: . The low value of the exponent indicates that the pores with different sizes have almost the same total volume.
A quantitative analysis of the transmission images involves a 2D-Fourier transform of the region inside the yellow square of Fig. 4a, which leads to the 2D scattering pattern of Fig. 5a. By radially averaging this intensity, following the same procedure as for the SANS data, the scattering curve of Fig. 5b is obtained, with Q calculated as given in the supplement. The resulting levels off at low-Q region and crosses over to a power law at higher ’s.
4 Discussion
These results disclose power laws, which are characteristics of fractal topology: fractal surfaces (of pores or particles) with a surface fractal dimension or mass fractals with a mass fractal dimension [28, 29]. The most direct signature of fractality is the power law of the SANS intensity shown in Fig. 2. It is indeed expected that [30, 31]:
| (4) | ||||
| (5) |
where the values of both and are smaller than 3, the dimensionality of the Euclidian space. Expressing the power laws as , corresponds to a surface fractal and to a mass fractal. All graphites showed leading to the surface fractal dimensions listed in Table 1.
| SANS | Imaging | Porosity | |||||
|---|---|---|---|---|---|---|---|
| Sample | |||||||
| PGA1 | 3.45 (1) | 2.55 (1) | 2.54 (2) | 2.44 (9) | -1.82 (3) | 22.7(5)% | 18.6% |
| PGA2 | 3.43 (1) | 2.57 (1) | 2.50 (2) | 2.54 (9) | -1.80 (4) | 22.7(5)% | 17.8% |
| RID | 3.45 (1) | 2.55 (1) | 2.56 (2) | 2.45 (9) | -1.74 (3) | 27.1(5)% | 23.0% |
Additional confirmation of these results comes from the Perimeter-Area power law of Fig. 4d, where the exponent is directly related to the surface fractal dimension through [32, 33, 34], leading to for PGA1. Similar results were obtained for the samples and all deduced values of are listed in Table 1 and are consistent with those obtained from SANS. Therefore imaging and SANS ”see” the same surface self-similar fractal structure although they probe length scales more than 3 orders of magnitude apart.
On the other hand, the power law of derived from the Fourier transformed images leads to an exponent significantly smaller than 3 (Fig. 5b), which is in line with a mass fractal and not surprising at this very low Q-limit. The deduced values of are given in Table 1, and for all samples .
The experimental results indicate that the pores of the graphite samples have a fractal (i.e. rough) surface while their assembly forms a mass fractal. To be specific, one can consider that the pore structure consists of many pore-building blocks, which characterize the network of the pore clusters with a mass fractal property at the length scale above the size of the primary block. Moreover, the pore building block itself is bounded by a rough surface with fractal morphology. In this case the scattering function reflects both mass and surface fractal properties and Eq. 1 can be factorized as [31, 35]:
| (6a) | ||||
| (6b) | ||||
| (6c) | ||||
where (= for carbon-air) is the scattering length density contrast, the volume of a primary pore building block, the associated length, the form factor, characteristic of the surface fractal morphology of the pores, the structure factor corresponding to the mass fractal structure
and the gamma function. Besides the fractal dimensions and , two characteristic lengths are introduced: an upper cut-off length and the length of the primary pore-building block , which marks the cross-over between mass and surface fractal scattering.
In order to fit all experimental results with this model in the most reliable way we adopted the following strategy : (1) the values of were fixed to those of Table 1, derived from SANS; (2) the values of and were derived from the scattering patterns of the Fourier transformed images. These are given in Table 1, which shows that . For the sake of simplicity we assumed in the following. (3) With , and fixed, was determined by fitting the SESANS data, that fill the gap between SANS and imaging and probe the cross-over between mass and surface fractal scattering. For this purpose the Hankel transform was performed numerically on Eq. 1 (combined with Eq. 6) through Eq. 3; then the data were fitted using Eq. 2 with only two floating parameters: length and the prefactor , and the resulting values are given in Table 2. The fits are illustrated by the solid lines in Fig. 3 and describe excellently the experimental findings.
| SANS | Imaging | SESANS | Global | ||||
|---|---|---|---|---|---|---|---|
| Sample | (m) | (m) | (cm | (cm | (cm | ||
| (fixed) | (fitted) | (fitted) | (fitted) | (calculated) | (fitted) | (calculated) | |
| PGA1 | 2.55 | 18.9 (4) | 2.27 (10) | 134(15) | |||
| PGA2 | 2.57 | 17.0 (5) | 2.64 (25) | 74(5) | |||
| RID | 2.55 | 18.7 (4) | 1.87 (6) | 214(17) | |||
The final step is to combine SANS, SESANS and imaging, which is done in Fig. 6. In this figure the lines correspond to the best fit of Eq. 6 with the parameters of Table 2. The values for which and are also indicated. We stress that the model provides excellent quantitative description of the experimental findings. Indeed the prefactors given in Table 2, which are deduced from fitting all data (global) are in excellent agreement with the calculated values from the fitted values of through Eq. 6a. Therefore, a consistent picture of the fractal microstructure of graphite is obtained over an extraordinary large range of length scales of 6 orders of magnitude (0.6 nm 0.6 mm).
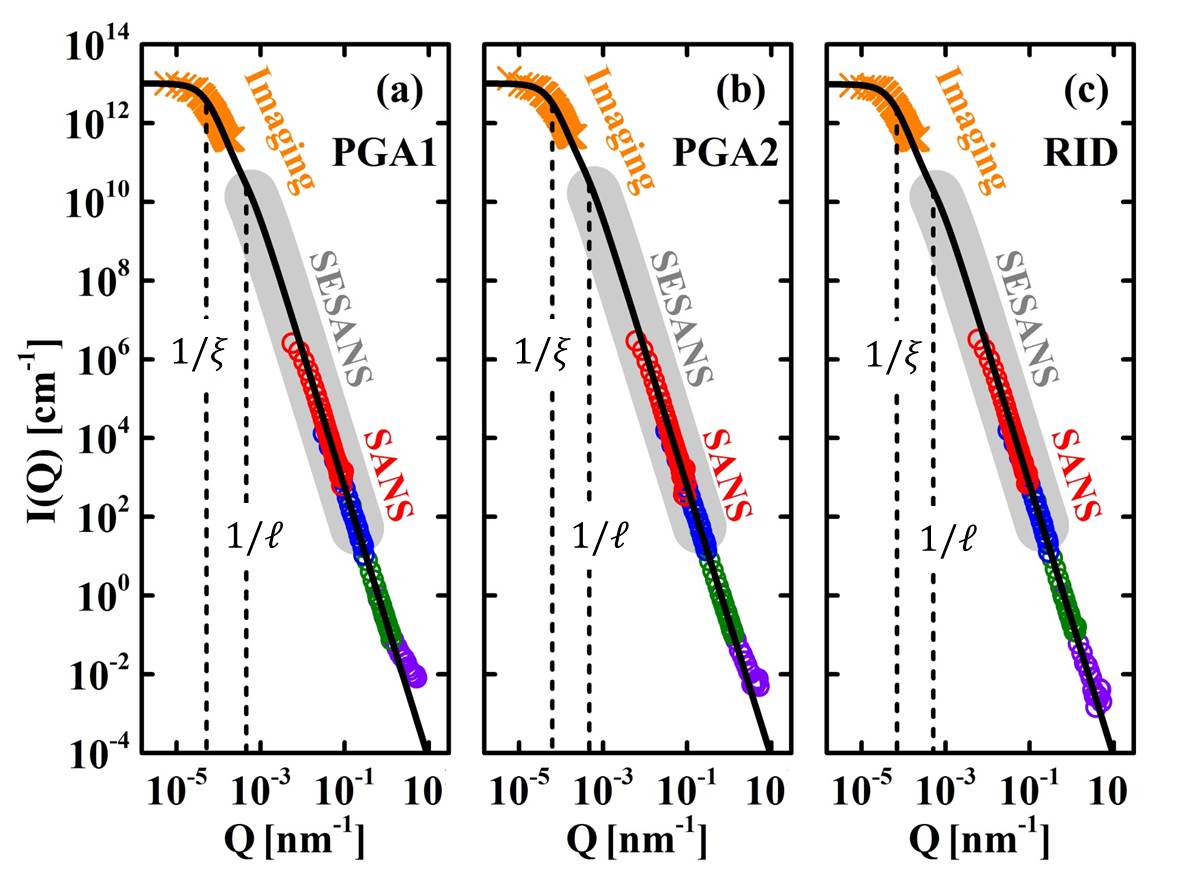
Table 2 shows that the fractal dimensions and cut-off lengths are almost the same for all samples, which might be because both PGA and RID are made out of petroleum coke [11]. A trend is only seen in the values of , which is the parameter that reflects the particularities of the microstructure and also the anisotropy of PGA2 (see supplement). It has been shown that the fractal anisotropy can be found in graphite at low densities (expanded graphite) and that in fact under densification such anisotropy is lost [18, 19].
In the literature besides the micropores mentioned above, so-called Mrozowski cracks have been reported [3, 4, 6], that result from the anisotropic thermal shrinkage of the layered graphite structure during cooling from graphitization temperatures. These have lengths from nm to m that are in the range probed by
SESANS and SANS. It is therefore tempting to attribute the surface fractal scattering to these cracks, as suggested recently [13], and to the cross-over between cracks and micropores.
In contrast to optical or electron microscopy, the scattering techniques used in this work cannot distinguish between cracks and pores. However, they provide a statistical average of the correlations over the (macroscopic) samples and reveal the most generic features of the structure. In this way it is possible to describe the complex and poly-disperse patterns of Fig. 4 with the scattering law of Eq. 6 involving a restricted number of parameters, which enables quantitative comparisons between different samples and systems.
Besides the extraordinary large length scales over which fractality has been observed, the fractal dimensions found in this work are comparable to those expected for percolating clusters [36, 14], for which heuristic arguments suggest that mass fractals should be bounded by their own natural fractal surface and [14]. The porosity values of Table 1 indicate indeed a topology close to that of a percolating cluster [36].
Similar fractal exponents have been deduced for fracturing ranked surfaces in 3D [16], that could serve as a model for Mrozowski cracks. Therefore the identity is not coincidence but the consequence of the high degree of disorder, ramification and connectivity of the pore structure. Under neutron irradiation surface fractality disappears [13], and similar behaviour may be expected for the oxidised samples. The methodology developed in this work thus can be applied to further investigate the effect of irradiation damage and/or oxidation on the structural properties of graphite.
Fractal scattering has also been reported for carbon nanopores [37, 38], rocks [26] or cement [39]. The particularity of this work is in the extraordinarily broad length scale of six orders of magnitude over which fractal scaling is quantitatively valid. The combination of several techniques, from imaging to scattering and the methods can be applied to the investigation of other complex systems with a hierarchy of length scales such as biological materials, concrete and rocks, materials for CO2 sequestration, Li batteries, fuel cells or solar cells.
Acknowledgments
We thank Annie Brulet, Chris Duif, Lucas J. van Vliet, Lambert van Eijck, Niels van Dijk, Ad van Well and Zhengcao Li for enlightening discussions and experimental support. We thank Paul Mummery for providing the PGA samples. Funding is acknowledged from the European Union Seventh Framework Programme [FP7/2007- 2013] under grant agreement Nr. 283883 and from the Royal Netherlands Academy of Arts and Sciences China Exchange Program grant Nr. 12CDP011.
References
References
- Haag [2005] Haag G. Tech. Rep. Jülich-4183; 2005.
- Zhou et al. [2014] Zhou Z, Bouwman WG, Schut H, Pappas C. Interpretation of x-ray diffraction patterns of (nuclear) graphite. Carbon 2014;69:17–24.
- Wen et al. [2008] Wen KY, Marrow TJ, Marsden BJ. The microstructure of nuclear graphite binders. Carbon 2008;46(1):62–71.
- Jones et al. [2008] Jones AN, Hall GN, Joyce M, Hodgkins A, Wen K, Marrow TJ, et al. Microstructural characterisation of nuclear grade graphite. J Nucl Mater 2008;381(1-2):152–7.
- Kane et al. [2011] Kane J, Karthik C, Butt DP, Windes WE, Ubic R. Microstructural characterization and pore structure analysis of nuclear graphite. J Nucl Mater 2011;415(2):189–97.
- Karthik et al. [2012] Karthik C, Kane J, Butt DP, Windes WE, Ubic R. Microstructural characterization of next generation nuclear graphites. Microsc Microanal 2012;18(2):272–8.
- Hacker et al. [2000] Hacker PJ, Neighbour GB, McEnaney B. The coefficient of thermal expansion of nuclear graphite with increasing thermal oxidation. J Phys D: Appl Phys 2000;33(8):991–8.
- Hoinkis [1996] Hoinkis E. Small angle scattering of neutrons and x-rays from carbons and graphites. In: Thrower PA, editor. Chemistry & Physics of Carbon; vol. 25. CRC Press; 1996, p. 71.
- Martin and Henson [1964] Martin DG, Henson RW. Scattering of long wavelength neutrons by defects in neutron-irradiated graphite. Phil Mag 1964;9(100):659–72.
- Martin and Caisley [1977a] Martin DG, Caisley J. Some studies of effect of irradiation on neutron small-angle scattering from graphite. Carbon 1977a;15(4):251–5.
- Martin and Caisley [1977b] Martin DG, Caisley J. Inference of coke source of nuclear graphites from neutron small-angle scattering measurements. J Nucl Mater 1977b;67(3):318–9.
- Martin and Caisley [1978] Martin DG, Caisley J. Some studies of effect of thermal and radiolytic oxidation on neutron small-angle scattering from nuclear graphites. Carbon 1978;16(3):199–203.
- Mileeva et al. [2013] Mileeva Z, Ross DK, King SM. A study of the porosity of nuclear graphite using small-angle neutron scattering. Carbon 2013;64:20–6.
- Bradley et al. [1991] Bradley RM, Strenski PN, Debierre JM. Surfaces of percolation clusters in three dimensions. Phys Rev B 1991;44(1):76–84.
- Saleur and Duplantier [1987] Saleur H, Duplantier B. Exact determination of the percolation hull exponent in two dimensions. Phys Rev Lett 1987;58(22):2325–8.
- Schrenk et al. [2012] Schrenk KJ, Araujo NAM, Andrade JS, Herrmann HJ. Fracturing ranked surfaces. Scientific Reports 2012;2.
- Marsden and Wickham [2006] Marsden B, Wickham AJ. Characterization, treatment and conditioning of radioactive graphite from decommissioning of nuclear reactors. 2006.
- Balima et al. [2013] Balima F, Pischedda V, Le Floch S, Brulet A, Lindner P, Duclaux L, et al. An in situ small angle neutron scattering study of expanded graphite under a uniaxial stress. Carbon 2013;57:460–9.
- Balima et al. [2014] Balima F, Le Floch S, San-Miguel A, Lindner P, Brulet A, Duclaux L, et al. Shear effects on expanded graphite under uniaxial pressure: An in situ small angle neutron scattering study. Carbon 2014;74:54–62.
- Willis and Carlile [2009] Willis BTM, Carlile CJ. Experimental neutron scattering. Oxford Univ. Press; 2009.
- Desert et al. [2007] Desert S, Thevenot V, Oberdisse J, Brulet A. The new very-small-angle neutron scattering spectrometer at laboratoire leon brillouin. J Appl Crystallogr 2007;40:S471–3.
- Rekveldt et al. [2005] Rekveldt MT, Plomp J, Bouwman WG, Kraan WH, Grigoriev S, Blaauw M. Spin-echo small angle neutron scattering in delft. Rev Sci Instrum 2005;76(3).
- Andersson et al. [2008] Andersson R, van Heijkamp LF, de Schepper IM, Bouwman WG. Analysis of spin-echo small-angle neutron scattering measurements. J Appl Crystallogr 2008;41:868–85.
- Kaestner et al. [2011] Kaestner AP, Hartmann S, Kuhne G, Frei G, Grunzweig C, Josic L, et al. The icon beamline - a facility for cold neutron imaging at sinq. NIMA 2011;659(1):387–93.
- Schelten and Schmatz [1980] Schelten J, Schmatz W. Multiple-scattering treatment for small-angle scattering problems. J Appl Crystallogr 1980;13:385–90.
- Radlinski et al. [1999] Radlinski AP, Radlinska EZ, Agamalian M, Wignall GD, Lindner P, Randl OG. Fractal geometry of rocks. Phys Rev Lett 1999;82(15):3078–81.
- Rekveldt et al. [2003] Rekveldt MT, Bouwman WG, Kraan WH, Uca O, Grigoriev SV, Habicht K, et al. Elastic neutron scattering measurements using larmor precession of polarized neutrons. Neutron Spin Echo Spectroscopy: Basics, Trends and Applications 2003;601:87–99.
- Mildner and Hall [1986] Mildner DFR, Hall PL. Small-angle scattering from porous solids with fractal geometry. J Phys D: Appl Phys 1986;19(8):1535–45.
- Schmidt [1991] Schmidt PW. Small-angle scattering studies of disordered, porous and fractal systems. J Appl Crystallogr 1991;24:414–35.
- Bale and Schmidt [1984] Bale HD, Schmidt PW. Small-angle x-ray-scattering investigation of submicroscopic porosity with fractal properties. Phys Rev Lett 1984;53(6):596–9.
- Teixeira [1988] Teixeira J. Small-angle scattering by fractal systems. J Appl Crystallogr 1988;21:781–5.
- Mandelbrot [1983] Mandelbrot BB. The fractal geometry of nature. New York: Freeman; 1983.
- Pentland [1984] Pentland AP. Fractal-based description of natural scenes. IEEE Transactions on Pattern Analysis and Machine Intelligence 1984;6(6):661–74.
- Beech [1992] Beech M. The projection of fractal objects. Astrophys Space Sci 1992;192(1):103–11.
- Wang et al. [2013] Wang HW, Anovitz LM, Burg A, Cole DR, Allard LF, Jackson AJ, et al. Multi-scale characterization of pore evolution in a combustion metamorphic complex, hatrurim basin, israel: Combining (ultra) small-angle neutron scattering and image analysis. Geochim Cosmochim Acta 2013;121:339–62.
- van der Marck [1997] van der Marck SC. Percolation thresholds and universal formulas. Phys Rev E 1997;55(2):1514–7.
- Pfeifer et al. [2002] Pfeifer P, Ehrburger-Dolle F, Rieker TP, Gonzalez MT, Hoffman WP, Molina-Sabio M, et al. Nearly space-filling fractal networks of carbon nanopores. Phys Rev Lett 2002;88(11).
- Mileeva et al. [2012] Mileeva Z, Ross DK, Wilkinson D, King SM, Ryan TA, Sharrock H. The use of small angle neutron scattering with contrast matching and variable adsorbate partial pressures in the study of porosity in activated carbons. Carbon 2012;50(14):5062–75.
- Allen et al. [2007] Allen AJ, Thomas JJ, Jennings HM. Composition and density of nanoscale calcium-silicate-hydrate in cement. Nature Mat 2007;6(4):311–6.