Prediction of galaxy ellipticities and reduction of shape noise in cosmic shear measurements
Abstract
The intrinsic scatter in the ellipticities of galaxies about the mean shape, known as “shape noise,” is the most important source of noise in weak lensing shear measurements. Several approaches to reducing shape noise have recently been put forward, using information beyond photometry, such as radio polarization and optical spectroscopy. Here we investigate how well the intrinsic ellipticities of galaxies can be predicted using other, exclusively photometric parameters. These parameters (such as galaxy colours) are already available in the data and do not necessitate additional, often expensive observations. We apply two regression techniques, generalized additive models (GAM) and projection pursuit regression (PPR) to the publicly released data catalog of galaxy properties from CFHTLenS. In our simple analysis we find that the individual galaxy ellipticities can indeed be predicted from other photometric parameters to better precision than the scatter about the mean ellipticity. This means that without additional observations beyond photometry the ellipticity contribution to the shear can be measured to higher precision, comparable to using a larger sample of galaxies. Our best-fit model, achieved using PPR, yields a gain equivalent to having 114.3% more galaxies. Using only parameters unaffected by lensing (e.g. surface brightness, colour), the gain is only .
keywords:
methods: data analysis – methods: statistical – surveys – galaxies: statistics – galaxies:structure – cosmology: observations1 Introduction
Weak gravitational lensing of galaxies is the distortion of galaxy shapes and sizes viewed behind a distribution of gravitating matter (see e.g. Bartelmann & Schneider 2001 or Massey, Kitching & Richard 2010 for reviews). The change in galaxy shapes, known as cosmic shear, has become one of the main probes of cosmology due to its dependence on the total matter distribution and cosmic geometry (e.g. Kaiser 1998). It is a driver for many ambitious upcoming instruments, including LSST,111http://www.lsst.org Euclid,222http://sci.esa.int/euclid and WFIRST (Spergel et al. 2015). On an individual galaxy basis, cosmic shear induces changes in the ellipticity and position angle at the few percent level. Determination of cosmic shear therefore relies on measuring coherent distortions, averaging over large numbers of galaxies. The dominant source of noise in this measurement is so-called “shape noise,” which is due to the fact that the unlensed galaxies have an intrinsic distribution of ellipticities and position angles. This distribution must be averaged over to reveal the cosmic shear contribution. If the shapes and position angles of the unlensed galaxies were known, then this shape noise could be eliminated, and consequently many fewer galaxies would be needed to achieve a given precision in cosmic shear.
This realization has given rise to several proposed techniques to determine the unlensed shapes of individual galaxies, using additional observables beyond photometry. The most prominent idea is to use spectroscopic information to do this. Early work on this subject involved spatially resolved kinematic maps of galaxies (Blain 2002, Morales 2006). Recently, Huff et al. (2013) have shown than the disk galaxy line width-luminosity relationship (Tully & Fisher 1977) can in principle be used to elminate shape-noise as an important source of noise altogether. This is extremely promising, and these authors have shown that spectroscopic lensing survey concepts can be conceived which are significantly smaller in scale than LSST but which are highly competitive in terms of predicted dark energy constraints. Other recent work by Brown & Battye (2011) has shown how polarization angles measured from radio observations can yield intrinsic galaxy positions angles. Again these techniques require the use of additional information beyond galaxy photometry.
There is information in photometry itself however on the intrinsic shapes of galaxies. For example, there are well-known relationships between the inclination angles of galaxy disks and their surface brightnesses (e.g. Giovanelli et al. 1994). One could imagine measuring the surface brightness (which is unaffected by lensing) from images and then using this relationship to infer something about the unlensed shape. In this paper, we will extend this idea to all photometrically measurable information, and apply it to a published observational dataset, the Canada-France-Hawaii Telescope Lensing Survey (CFHTLenS; Heymans et al. 2012). The question we will try to answer is: is it possible to reduce the shape noise in weak lensing shear without resorting to extra observables beyond photometry (which are often expensive to obtain)?
There are many photometric variables which can be measured from galaxy images (which often includes colour information from different filters). Some of these variables are affected by lensing (for example the size or the apparent magnitude of galaxies) and others not (such as the surface brightness or the photometric redshift). There will be correlations between these variables and the intrinsic ellipticity of galaxies, and in this paper we will investigate how these correlations can be used to predict the intrinsic ellipticity. We will be using a set of 16 parameters for each galaxy taken from those measured and published by the CFHTLenS team (see Section 3 for details). Because there are a large number of parameters, we will not look at correlations of each individually with galaxy ellipticity, but instead use two regression techniques, generalized additive models (GAM) and projection pursuit regression (PPR), to optmize ellipticity prediction in the multidimensional parameter space.
The outline of this paper is as follows: in Section 2 we briefly outline how galaxy ellipticities are defined and can be used to infer the shear due to weak lensing. In Section 3 we introduce the data from CFHTLenS, and in Section 4 we describe our method for predicting ellipticities from other photometric parameters. In Section 5 we present our results for how well the ellipticities can be predicted, using observational data. We summarise and discuss our findings in Section 6.
2 Weak lensing shear and ellipticity measurements
We note that the intrinsic ellipticities of galaxies are of course not available in the CFHTLenS dataset, and so when making predictions for them, we will compare the predictions to the actual measured ellipticities. Because the effects of weak lensing shear on the ellipticities are galaxies are much smaller (around the percent level) than the error on the predicted ellipticities, this will be a good approximation to comparison to the intrinsic ellipticities.
The weak gravitational lensing shear can be decomposed into the two usual components, sometimes denoted as and , which distort the position angle and ellipticity of the galaxy image. The ellipticity , of a galaxy image is given by
| (1) |
where , the ratio of minor to major axis. The distortion caused by the shear means that the observed value of for a galaxy is given by
| (2) |
with the position angle, , changing as follows:
| (3) |
where and are galaxy parameters before lensing distortion. It follows that an estimator for the shear component could be
| (4) |
which would necessitate knowledge of the unlensed galaxy shape, . In this paper, we will see whether the unlensed ellipticity can be inferred from other parameters. We leave the determination of a shear estimator that makes best use of this information to future work.
We note that in our work we will not be able to infer the unlensed position angles. There will therefore be no reduction of shape noise for one of the two shear components, . This is likely to be a significant limitation, as for example Whittaker et al. (2014) have shown that shear estimators can be constructed using galaxy position angles only, and which appear to contain most of the shear signal.
3 Data
We use the publicly available data333http://www.cfhtlens.org/astronomers/data-store from CFHTLenS in our analysis. CFHLenS is a 154 square-degree multi-colour optical survey in ugriz incorporating all five years worth of data from the Wide, Deep and Pre-survey components of the CFHT Legacy Survey.444http://www.cfht.hawaii.edu/Science/CFHTLS/ The CFHTLenS was optimised for weak lensing analysis with the deep -band data taken in optimal sub-arcsecond seeing conditions. For a general overview of the survey see Erben et al. (2013) and Heymans et al. (2012), as well as information about the photometry in Hildebrant et al. (2012).
The online datastore3 contains 107 photometrically derived parameters for each of 8.05 million galaxies, ranging from the number of exposures, through galaxy angular positions and photometric redshifts, image ellipticity components and point spread functions. The algorithm lensfit (Miller et al. 2007) was used by Miller et al. (2013) to carry out the Baysian estimation of the galaxy shapes. The lensfit shapes require a multiplicative (Miller et al. 2012) and an additive (Heymans et al. 2012) correction to be properly calibrated. Corrections were made (specifically to the measurement e2) prior to the start of our analysis (M. Simet, private communication). From the possible pool of predictor variables, we concentrate on a particular subset of 16, which we list in Table 1. The reader is referred to the CFHTLens publications and catalogue documentation (both listed above) for detailed definitions of these parameters and explanations of how they were measured. Note that we do not a priori expect two of these parameters (t_ml and t_b) to have any predictive power in estimating galaxy ellipticity; in a sense, these are control variables added to ensure proper performance of our analysis software/algorithm.
For computational efficiency, we select data spanning 100,000 contiguous rows of the catalog, then exclude those whose measurements include the values 99 or -99, those classified as stars with high probability (class_star 0.95), and those for which (fitclass | star_flag) 0. The final sample size is 89,990, which is sufficiently large to probe the space spanned by the predictor variables. We compare galaxy ellipticties that we predict from other photometric parameters to the observed values from lensfit (i.e. ellip in Table 1). The mean value of ellip in our 89,990-galaxy sample is , while the root-mean-square (RMS) deviation from the mean is
| (5) |
4 Analysis
Our interest lies in predicting ellipticities as a function of the predictor variables in Table 1. There are many fitting techniques available from the realms of statistics and machine learning that may be applied to this problem; we find that a combination of two regression techniques, generalized additive models (GAM; see e.g. Chapter 7 of James et al. 2013) and projection pursuit projection (PPR; Friedman & Stuetzle 1981), yields encouraging results. In short, we use GAM to select a set of predictors from the pool of possibilities in Table 1, without testing for interactions (which adds undue computational complexity within the GAM framework), and then apply PPR, which works with linear combinations of predictors, to generalize the GAM model.
The GAM model is
| (6) |
where is the number of predictors and is a nonparametrically smoothed version of the predictor . (In our analysis, we use the gam.fit function of the R package mgcv, and apply smoothing splines to each predictor individually.)
To avoid overfitting, we apply a forward-stepwise search, wherein we test add each predictor from the pool individually to the baseline model, and see which achieves the greatest reduction in mean squared error (MSE):
| (7) |
where and are the measured and predicted ellipticities respectively of galaxy and is that galaxy’s weight as estimated by lensfit (Miller et al. 2012).
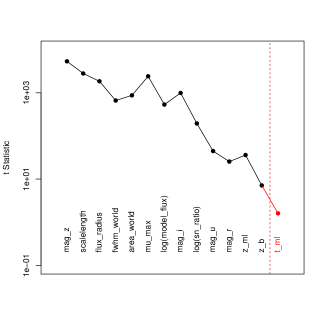
To generate predictions , we apply five-fold cross-validation, i.e. we randomly partition the data into five groups, and at any one time fit our GAM model to four of them to generate predictions for the fifth group (repeating the process until predictions are generated for all data). To determine whether the reduction in MSE is statistically significant, we repeat each fit of each predictor variable ten times (i.e. we randomly partition the data into five groups ten separate times) to generate a distribution of MSEs. Given the MSE distributions for the baseline and baseline-plus-new-predictor models (which we assume are normal), it is trivial to apply the two-sample test to assess the null hypothesis that the distributions have the same mean. If the test results in a value 0.05, we reject the null and incorporate the new predictor into our baseline model. We then repeat the search over the remaining predictors. Note that as part of this process we check to see if logarithmic or exponential transformations of the predictors lead to heightened reductions in MSE. We show our results in Figure 1; the final GAM model, which includes 13 predictors, reduces the MSE from 0.03424 (the value for a constant model) to 0.01791.
Given the set of predictor variables produced in the GAM step, we test for interactions among them via PPR. The PPR model is
| (8) |
where is the “ridge function” and where the number of ridge functions is selected via the same MSE-reduction test outlined above. In our analysis, we apply the base R function ppr, and we choose the “supersmoother” function of Friedman (1984) as the smoothing function . The final MSE is 0.01622 for ; this reduction in ellipticity error relative to a constant model (MSE = 0.03424) is equivalent to that achieved using the constant model and a dataset
| (9) |
times larger, i.e. 111.1% larger.
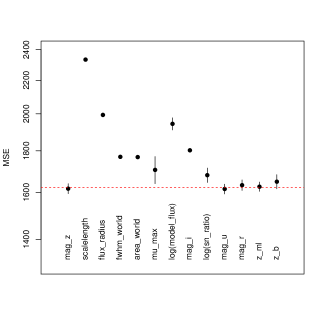
In Figure 3 we examine the effect of removing each of the predictors in turn on the MSE of the best-fit PPR model. (Note that we do not attempt to optimize the number of terms in each case but rather assume .) The predictors are shown left-to-right in the order in which they were admitted to the no-interaction GAM model. The effect on MSE of each parameter largely mimics the statistics associated with those parameters in Figure 1, with the suprising exception that mag_z, the first predictor chosen in the GAM step, can be excluded from the predictor pool made available in the PPR step with no loss in predictive accuracy. Similarly, the last four predictors adopted in the GAM step (mag_u, mag_r, z_ml, and z_b), can similarly be dropped from the pool. This serves to highlight the complexity of statistical model selection: the GAM step, designed to reduce the number of possible predictors from 100 available in general (or from the 16 that we pre-selected for this particular exercise) to a more manageable pool, still ends up selecting more than is ultimately necessary because it does not take predictor interactions into account.
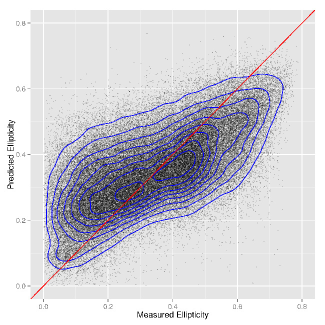
We thus perform the one additional step of removing the five predictors listed above from the pool of predictors made available to the PPR model and re-running the PPR analysis. We achieve an MSE of 0.01598 for = 8, which is equivalent to applying the constant model to a dataset that is 2.143 times, or 114.3%, larger. In Figure 2 we show the relationship between predicted and measured ellipticity; the Pearson sample correlation coefficient between the two is .
| Variable | Description |
|---|---|
| Predictor Variables: | |
| area_world | Galaxy area in world coordinates (= a_world b_world; |
| the latter two quantities are estimated via SExtractor) | |
| flux_radius | Galaxy half-light radius, estimated via SExtractor |
| fwhm_world | Galaxy FWHM assuming a Gaussian profile, estimated via SExtractor |
| mag_[u,g,r,i,z] | Galaxy magnitudes, estimated via SExtractor |
| model_flux | Galaxy flux, estimated via lensfit |
| mu_max | Galaxy peak surface brightness, estimated via SExtractor |
| scalelength | Galaxy scalelength, estimated via lensfit |
| snratio | Galaxy signal-to-noise ratio, estimated via lensfit |
| t_[b,ml] | Spectral type, estimated via BPZ |
| z_[b,ml] | Galaxy peak-posterior/maximum likelihood photometric redshifts, estimated via BPZ |
| Response Variable: | |
| ellip | Galaxy ellipticity, estimated via lensfit (= ) |
| (e2 corrected by M. Simet, private communication) | |
| Fit Weight: | |
| weight | Galaxy weight in fitting, estimated via lensfit; |
| see Section 3.6 and Equation 8 of Miller et al. (2012) |
To illustrate the difference between choosing from all predictors versus only those not affected by lensing, we apply the PPR framework to only the set of parameters area_world, mu_max, mag_(u,r,i,z), and z_(b,ml). We test various combinations of these parameters. First, we test models with area_world and mag_r and models that keep information on surface brightness only by combining the two as mag_r/area_world. Second, we test models incorporating colours as opposed to magnitudes. Regardless of model, the result is qualitatively similar: the reductions in MSE relative to that of the constant model are equivalent to using datasets that are 11.2%-12.5% larger, a far smaller improvement than the 114.3% gained from examining all predictors.
5 Summary and discussion
5.1 Summary
We utilize a statistical framework based on generalized additive model (GAM) regression and projection pursuit regression (PPR) to predict galaxy ellipticities from other photometric parameters, and apply it 89,990 galaxies taken from a value-added version of the public CFHTLenS catalog. Our findings are as follows:
-
1.
Using a set of 13 parameters which include quantities which are affected by lensing such as galaxy size and apparent magnitude, we find that the ellipticity of individual galaxies can be predicted with an rms error . This is less than the rms standard deviation of galaxy ellipticities about the mean. The gain in predictive accuracy relative to a constant model is equivalent to utilizing a constant model with a dataset 114.3% larger than our 89,990-galaxy CFHTLenS-based dataset. This result conclusively demonstrates that our statistical framework can reduce shape noise in weak lensing measurements.
-
2.
Using a reduced set of photometric parameters, those unaffected by lensing (such as colour and surface brightness), we find that the ellipticity of galaxies can be predicted with an rms error of , less than the rms standard deviation of galaxy ellipticities about the mean; the gain in predictive accuracy relative to a constant model is equivalent to utilizing a constant model with a dataset 12% larger.
5.2 Discussion
Although we have shown that photometric information can be used to predict galaxy ellipticities, the scatter compared to the true values is still large, so that on a galaxy by galaxy basis, photometric information alone is not a viable to competitor to other methods which use additional osbervables. For example, Huff et al. (2013) have shown that spectroscopic information can in principle reduce the effect of shape noise on both components of shear by an order of magnitude, rendering it negible, whereas we have only shown reduction by a few tens of percent. On the other hand, the photometric information will be present in catalogues without additional effort, so that using it should at least be considered.
In our work there are two main distinctions between parameters, whether they are affected by lensing (e.g. size), or are unaffected (e.g. colour). A prediction of ellipticities from the latter parameters has the advantage that the predicted ellipticity should not be affected by lensing. There should therefore be no correlation between the weak lensing shear that is eventually measured after using the predicted ellipticity, and the predicted ellipticity itself. This purity, as we have seen, does come at significant cost to the predictive power, and so it becomes necessary to consider the more inclusive set of parameters, which does not exclude those affected by lensing. In this case, because one can regard our prediction of ellipticities as being to first order, one might expect the effect of weak lensing on the parameters that enter into the prediction to modify the resulting predicted ellipticities only at second order. We therefore expect that the effect of lensing on the prediction should be small. We defer the developments of techniques to address this further to the future.
In this paper, we have also left to future work to explore how best the predicted ellipticity information can be incorporated into an estimator of the weak lensing shear. When this is done, the fact that ellipticity predictions from photometry only extend to galaxy shapes and not position angles, thus restricting any benefits to only one component of the shear should also be taken into account. It is possible that the predictions are also better for certain subsets of the data (e.g. bright galaxies) and this could also be explored.
One potential complication which could conceivably affect the reliability of the techniques in this paper is that there may be environmental effects on the relationship between photometric parameters and predicted ellipticities. This would manifest itself as spatial clustering in the residuals of the relationship, and could cause systematic errors in the inferred shear. The magnitude of such effects could perhaps be gauged using measures of the environment (e.g. th nearest neighbour distance). Spatial correlations in residuals from the Fundamental Plane (FP) relationship between photometric and spectroscopic parameters of early-type galaxies have recently been detected (Joachimi et al. 2015), showing that such effects are present in related data.
Acknowledgments
We thank Eric Huff, Melanie Simet and Rachel Mandelbaum for useful discussions. This work is based on observations obtained with MegaPrime/MegaCam, a joint project of CFHT and CEA/DAPNIA, at the Canada-France-Hawaii Telescope (CFHT) which is operated by the National Research Council (NRC) of Canada, the Institut National des Sciences de l’Univers of the Centre National de la Recherche Scientifique (CNRS) of France, and the University of Hawaii. This research used the facilities of the Canadian Astronomy Data Centre operated by the National Research Council of Canada with the support of the Canadian Space Agency. CFHTLenS data processing was made possible thanks to significant computing support from the NSERC Research Tools and Instruments grant program.
References
- [] Ahn, C. P. et al., 2012, ApJS, 203, 21
- [] Altman, N. S., 1992, Am. Stat., 46, 175
- [] Bartlemann, M., Schneider, P., 2001, Phys. Rep., 340, 291
- [] Blain, A. W., 2002, ApJ, 570, L51
- [] Brown, M. L., Battye, R. A., 2011, ApJ, 735, L23
- [] Erben, T. et al., 2013, MNRAS, 433, 2545
- [] Friedman, J. H., 1984, Laboratory for Computational Statistics, Stanford University Technical Report #5.
- [] Friedman, J. H., Stuetzle, W., 1981, JASA, 76, 817
- [] Giovanelli, R. et al., 2012, MNRAS, 427, 146
- [] Hildebrandt, H. et al., 2012, MNRAS, 421, 2355
- [] Huff, E. M., Krause, E., Eifler, T., George, M. R., Schlegel, D., 2013, arXiv:1311.1489
- [] James, G., Witten, D., Hastie, T., Tibshirani, R., 2013, An Introduction to Statistical Learning, Springer, New York
- [] Joachmi, B., Singh, S., Mandelbaum, R., 2015, arXiv:1504.02662
- [] Kaiser, N., 1998, ApJ, 498, 26
- [] Massey, R., Kitching, T., Richard, J., 2010, Rep. Progr. Phys., 73, 086901
- [] Miller, L., Kitching, T. D., Heymans, C., Heavens, A. F., van Waerbeke, L., 2007, MNRAS, 382, 315
- [] Miller, L. et al., 2013, MNRAS429, 2858
- [] Morales, M. F., 2006, ApJ, 650, L21
- [] Spergel, D. et al., 2015, arXiv:1503.03757
- [] Tully, R. B., Fisher, J. R., 1977, å, 54, 661
- [] Weinberg, D. H., 1992, MNRAS, 254, 315
- [] Whittaker, L., Brown, M. L., Battye, R. A., 2014, MNRAS, 445, 1836