Distributed Estimation and Inference with Statistical Guarantees
Abstract
This paper studies hypothesis testing and parameter estimation in the context of the divide and conquer algorithm. In a unified likelihood based framework, we propose new test statistics and point estimators obtained by aggregating various statistics from subsamples of size , where is the sample size. In both low dimensional and high dimensional settings, we address the important question of how to choose as grows large, providing a theoretical upper bound on such that the information loss due to the divide and conquer algorithm is negligible. In other words, the resulting estimators have the same inferential efficiencies and estimation rates as a practically infeasible oracle with access to the full sample. Thorough numerical results are provided to back up the theory.
Abstract
This document contains the supplementary material to the paper “Distributed Estimation and Inference with Statistical Guarantees”. In Appendix A, we provide the proofs of technical results required for the analysis of divide and conquer inference. Appendix B collects the proofs of lemmas for the estimation part.
1 Introduction
In recent years, the field of statistics has developed apace in response to the opportunities and challenges spawned from the ‘data revolution’, which marked the dawn of an era characterized by the availability of enormous datasets. An extensive toolkit of methodology is now in place for addressing a wide range of high dimensional problems, whereby the number of unknown parameters, , is much larger than the number of observations, . However, many modern datasets are instead characterized by and both large. The latter presents intimidating practical challenges resulting from storage and computational limitations, as well as numerous statistical challenges (Fan et al., 2014). It is important that statistical methodology targeting modern application areas does not lose sight of the practical burdens associated with manipulating such large scale datasets. In this vein, incisive new algorithms have been developed for exploiting modern computing architectures and recent advances in distributed computing. These algorithms enjoy computational efficiency and facilitate data handling and storage, but come with a statistical overhead if inappropriately tuned.
With increased mindfulness of the algorithmic difficulties associated with large datasets, the statistical community has witnessed a surge in recent activity in the statistical analysis of various divide and conquer (DC) algorithms, which randomly partition the observations into subsamples of size , construct statistics based on each subsample, and aggregate them in a suitable way. In splitting the dataset, a single, very large scale estimation or inference problem with computational complexity , for a given function that depends on the underlying problem, is transformed into high dimensional (large smaller ) problems each with computational complexity on each machine. What gets lost in this process is the interactions of split subsamples in each machine. They are not recoverable. However, the information got lost is not much statistically, as the spilt subsamples are supposed to be independent. It is thus of significant practical interest to derive a theoretical upper bound on the number of subsamples that delivers the same statistical performance as the computationally infeasible “oracle” procedure based on the full sample. We develop communication efficient generalizations of the Wald and Rao score tests for the high dimensional scheme, as well as communication efficient estimators for the parameters of the high dimensional and low dimensional linear and generalized linear models. In all cases we give the upper bound on for preserving the statistical error of the analogous full sample procedure.
While hypothesis testing in a low dimensional context is straightforward, in the high dimensional setting, nuisance parameters introduce a non-negligable bias, causing classical low dimensional theory to break down. In our high dimensional Wald construction, the phenomenon is remedied through a debiasing of the estimator, which gives rise to a test statistic with tractable limiting distribution, as documented in the (no sample split) setting in Zhang and Zhang (2014) and van de Geer et al. (2014). For the high dimensional analogue of Rao’s score statistic, the incorporation of a correction factor increases the convergence rate of higher order terms, thereby vanquishing the effect of the nuisance parameters. The approach is introduced in the setting in Ning and Liu (2014), where the test statistic is shown to possess a tractable limit distribution. However, the computation complexity for the debiased estimators increases by an order of magnitude, due to solving high-dimensional regularization problems. This motivates us to appeal to the divide and conquer strategy.
We develop the theory and methodology for DC versions of these tests. In the case , each of the above test statistics can be decomposed into a dominant term with tractable limit distribution and a negligible remainder term. The DC extension requires delicate control of these remainder terms to ensure the error accumulation remains sufficiently small so as not to materially contaminate the leading term. In obtaining the upper bound on the number of permitted subsamples, , we provide an upper bound on subject to a statistical guarantee. We find that the theoretical upper bound on the number of subsamples guaranteeing the same inferential or estimation efficiency as the procedure without DC is in the linear model, where is the sparsity of the parameter vector. In the generalized linear model the scaling is , where is the sparsity of the inverse information matrix.
For high dimensional estimation problems, we use the same debiasing trick introduced in the high dimensional testing problems to obtain a thresholded divide and conquer estimator that achieves the full sample minimax rate. The appropriate scaling is found to be for the linear model and for the generalized linear model. Moreover, we find that the loss incurred by the divide and conquer strategy, as quantified by the distance between the DC estimator and the full sample estimator, is negligible in comparison to the statistical error of the full sample estimator provided that is not too large. In the context of estimation, the optimal scaling of with and is also developed for the low dimensional linear and generalized linear model. This theory is of independent interest. It also allows us to study a refitted estimation procedure under a minimal signal strength assumption.
A partial list of references covering DC algorithms from a statistical perspective is Chen and Xie (2012), Zhang et al. (2013), Kleiner et al. (2014), and Zhao et al. (2014a). For the high dimensional estimation setting, the same debiasing approach of van de Geer et al. (2014) is proposed independently by Lee et al. (2015) for divide-and-conquer estimation. Our paper differs from that of Lee et al. (2015) in that we additionally cover high dimensional hypothesis testing and refitted estimation in the DC setting. Our results on hypothesis testing reveals a different phenomenon to that found in estimation, as we observe through the different requirements on the scaling of . On the estimation side, our results also differ from those of Lee et al. (2015) in that the additional refitting step allows us to achieve the oracle rate under the same scaling of .
The rest of the paper is organized as follows. Section 2 collects notation and details of a generic likelihood based framework. Section 3 covers testing, providing high dimensional DC analogues of the Wald test (Section 3.1) and Rao score test (Section 3.2), in each case deriving a tractable limit distribution for the corresponding test statistic under standard assumptions. Section 4 covers distributed estimation, proposing an aggregated estimator of for low dimensional and high dimensional linear and generalized linear models, as well as a refitting procedure that improves the estimation rate, with the same scaling, under a minimal signal strength assumption. Section 5 provides numerical experiments to back up the developed theory. In Section 6 we discuss our results together with remaining future challenges. Proofs of our main results are collected in Section 7, while the statement and proofs of a number of technical lemmas are deferred to the appendix.
2 Background and Notation
We first collect the general notation, before providing a formal statement of our statistical problems. More specialized notation is introduced in context.
2.1 Generic Notation
We adopt the common convention of using boldface letters for vectors only, while regular font is used for both matrices and scalars, with the context ensuring no ambiguity. denotes both absolute value and cardinality of a set, with the context ensuring no ambiguity. For , and , we define , , where and is the cardinality of the set . Write , while for a matrix , let , . For any matrix we use to index the transposed row of and to index the column. The sub-Gaussian norm of a scalar random variable is defined as . For a random vector , its sub-Gaussian norm is defined as , where denotes the unit sphere in . Let denote the identity matrix; when the dimension is clear from the context, we omit the subscript. We also denote the Hadamard product of two matrices as and for any . denotes the canonical basis for . For a vector and a set of indices , is the vector of length whose components are . Additionally, for a vector with element , we use the notation to denote the remaining vector when the element is removed. With slight abuse of notation, we write when we wish to emphasize the dependence of on and individually. The gradient of a function is denoted by , while denotes the gradient of with respect to , and denotes the matrix of cross partial derivatives with respect to the elements of and . For a scalar , we simply write and . For a random variable and a sequence of random variables, , we write when converges weakly to . If is a random variable with standard distribution, say , we simply write . Given , let and denote the maximum and minimum of and . We also make use of the notation () if is less than (greater than) up to a constant, and if is the same order as . Finally, for an arbitrary function , we use to denote the solution to .
2.2 General Likelihood based Framework
Let be i.i.d. copies of the random vector , whose realizations take values in . Write the collection of these i.i.d. random couples as with and . Conditional on , we assume is distributed as for all , where has a density or mass function . We thus define the negative log-likelihood function, , as
| (2.1) |
We use to denote the information matrix and to denote , where .
For testing problems, our goal is to test for any . We partition as , where is a vector of nuisance parameters and is the parameter of interest. To handle the curse of dimensionality, we exploit a penalized M-estimator defined as,
| (2.2) |
with a sparsity inducing penalty function with a regularization parameter . Examples of include the convex penalty, which, in the context of the linear model, gives rise to the LASSO estimator (Tibshirani, 1996),
| (2.3) |
Other penalties include folded concave penalties such as the smoothly clipped absolute deviation (SCAD) penalty (Fan and Li, 2001) and minimax concave MCP penalty (Zhang, 2010), which eliminate the estimation bias and attain the oracle rates of convergence (Loh and Wainwright, 2013; Wang et al., 2014a). The SCAD penalty is defined as
| (2.4) |
for a given parameter and MCP penalty is given by
| (2.5) |
where is a fixed parameter. The only requirement we have on is that it induces an estimator satisfying the following condition.
Condition 2.1 .
For any , if ,
| (2.6) |
where is the sparsity of , i.e., .
Condition 2.1 holds for the LASSO, SCAD and MCP. See Bühlmann and van de Geer (2011); Fan and Li (2001); Zhang (2010) respectively and Zhang and Zhang (2012).
The DC algorithm randomly and evenly partitions into disjoint subsets , so that , for all , and , where it is implicitly assumed that can be divided evenly. Let be the index set corresponding to the elements of . Then for an arbitrary matrix , . For an arbitrary estimator , we write when the estimator is constructed based only on . What information gets lost in this process is the interactions of data across subsamples . Taking the oridinary least-squares regression, for example, the cross-covariances of the subsamples will not be able to get recovered. However, they do not contain much information about the unknown parameters, as the subsamples are nearly independent. Finally, we write to denote the negative log-likelihood function of equation (2.1) based on .
While the results of this paper hold in a general likelihood based framework, for simplicity we state conditions at the population level for the generalized linear model (GLM) with canonical link. A much more general set of statements appear in the auxiliary lemmas upon which our main results are based. Under GLM with the canonical link, the response follows the distribution,
| (2.7) |
where . The negative log-likelihood corresponding to (2.7) is given, up to an affine transformation, by
| (2.8) |
and the gradient and Hessian of are respectively
where and . In this setting, and .
3 Divide and Conquer Hypothesis Tests
In the context of the two classical testing frameworks, the Wald and Rao score tests, our objective is to construct a test statistic with low communication cost and a tractable limiting distribution . Let be the component of . From this statistic we define a test of size of the null hypothesis, , against the alternative, , as a partition of the sample space described by
| (3.1) |
for a two sided test.
3.1 Two Divide and Conquer Wald Type Constructions
For the high dimensional linear model, Zhang and Zhang (2014), van de Geer et al. (2014) and Javanmard and Montanari (2014) propose methods for debiasing the LASSO estimator with a view to constructing high dimensional analogues of Wald statistics and confidence intervals for low-dimensional coordinates. As pointed out by Zhang and Zhang (2014), the debiased estimator does not impose the minimum signal condition used in establishing oracle properties of regularized estimators (Fan and Li, 2001; Fan and Lv, 2011; Loh and Wainwright, 2015; Wang et al., 2014b; Zhang and Zhang, 2012) and hence has wider applicability than those inferences based on the oracle properties. The method of van de Geer et al. (2014) is appealing in that it accommodates a general penalized likelihood based framework, while the Javanmard and Montanari (2014) approach is appealing in that it optimizes asymptotic variance and requires a weaker condition than van de Geer et al. (2014) in the specific case of the linear model. We consider the DC analogues of Javanmard and Montanari (2014) and van de Geer et al. (2014) in Sections 3.1.1 and 3.1.2 respectively.
3.1.1 LASSO based Wald Test for the Linear Model
The linear model assumes
| (3.2) |
where are i.i.d. with mean zero and variance . For concreteness, we focus on a LASSO based method, but our procedure is also valid when other pilot estimators are used. We describe a modification of the bias correction method introduced in Javanmard and Montanari (2014) as a means to testing hypotheses on low dimensional coordinates of via pivotal test statistics.
On each subset , we compute the debiased estimator of as in Javanmard and Montanari (2014) as
| (3.3) |
where the superscript is used to indicate the debiased version of the estimator, and is the solution of
| s.t. | ||||
where the choice of tuning parameters and is discussed in Javanmard and Montanari (2014) and Zhao et al. (2014a). Above, is the sample covariance based on , whose population counterpart is and is its regurlized inverse. The second term in (3.3) is a bias correction term, while is shown in Javanmard and Montanari (2014) to be the variance of the component of . The parameter , which tends to zero, controls the bias of the debiased estimator (3.3) and the optimization in (3.1.1) minimizes the variance of the resulting estimator.
Solving optimization problems in (3.1.1) increase an order of magnitude of computation complexity even for . Thus, it is necessary to appeal to the divide and conquer strategy to reduce the computation burden. This gives rise to the question how large can be in order to maintain the same statistical properties as the whole sample one ().
Because our DC procedure gives rise to smaller samples, we overcome the singularity in through a change of variables. More specifically, noting that is not required explicitly, but rather the product , we propose
| s.t. | ||||
from which we construct , where .
The following conditions on the data generating process and the tail behavior of the design vectors are imposed in Javanmard and Montanari (2014). Both conditions are used to derive the theoretical properties of the DC Wald test statistic based on the aggregated debiased estimator, .
Condition 3.1 .
are i.i.d. and satisfies .
Condition 3.2 .
The rows of are sub-Gaussian with , .
Note that under the two conditions above, there exists a constant such that . Without loss of generality, we can set . Our first main theorem provides the relative scaling of the various tuning parameters involved in the construction of .
Theorem 3.3.
Theorem 3.3 entertains the prospect of a divide and conquer Wald statistic of the form
| (3.6) |
for , where is an estimator for based on the subsamples. On the left hand side of equation (3.6) we suppress the dependence on to simplify notation. As an estimator for , a simple suggestion with the same computational complexity is where
| (3.7) |
One can use the refitted cross-validation procedure of Fan et al. (2012) to reduce the bias of the estimate. In Lemma 3.4 we show that with the scaling of and required for the weak convergence results of Theorem 3.3, consistency of is also achieved.
Lemma 3.4.
Suppose for all . Then with and , .
3.1.2 Wald Test in the Likelihood Based Framework
An alternative route to debiasing the LASSO estimator of is the one proposed in van de Geer et al. (2014). Their so called desparsified estimator of is more general than the debiased estimator of Javanmard and Montanari (2014) in that it accommodates generic estimators of the form (2.2) as pilot estimators, but the latter optimizes the variance of the resulting estimator. The desparsified estimator for subsample is
| (3.9) |
where is a regularized inverse of the Hessian matrix of second order derivatives of at , denoted by . We will make this explicit in due course. The estimator resembles the classical one-step estimator (Bickel, 1975), but now in the high-dimensional setting via regularized inverse of the Hessian matrix , which reduces to the empirical covariance of the design matrix in the case of the linear model. From equation (3.9), the aggregated debiased estimator over the subsamples is defined as .
We now use the nodewise LASSO (Meinshausen and Bühlmann, 2006) to approximately invert via -regularization. The basic idea is to find the regularized invert row by row via a penalized -regression, which is the same as regressing the variable on but expressed in the sample covariance form. For each row , consider the optimization
| (3.10) |
where denotes the row of without the diagonal element, and is the principal submatrix without the row and column. Introduce
Theorem 3.8 establishes the limit distribution of the term,
| (3.13) |
for any under the null hypothesis . This provides the basis for the statistical inference based on divide-and-conquer. We need the following condition. Recall that and consider the generalized linear model (2.7).
Condition 3.6 .
(i) are i.i.d., , , . (ii) For some constant , and . (iii) There exist finite constants such that and for all .
The same assumptions appear in van de Geer et al. (2014). In the case of the Gaussian GLM, the condition on reduces to the requirement that the covariance of the design has minimal eigenvalue bounded away from zero, which is a standard assumption. We require to control the estimation error of different functionals of . The restriction in (ii) on the covariates and the projection of the covariates are imposed for technical simplicity; it can be extended to the case of exponential tails (see Fan and Song, 2010). Note that where is the dispersion parameter in (2.7), so essentially implies an upper bound on the variance of the response. In fact, Lemma A.2 shows that can guarantee that the response is sub-gaussian. is used to derive the Lipschitz property of with respect to as shown in Lemma A.5. We emphasize that no requirement in Condition 3.6 is specific to the divide and conquer framework.
The assumption of bounded design in (ii) can be relaxed to the sub-gaussian design. However, the price to pay is that the allowable number of subsets is smaller than the bounded case, which means we need a larger sub-sample size. To be more precise, the order of maximum for the sub-gaussian design has an extra factor, which is a polynomial of , compared to the order for the bounded design. This logrithmic factor comes from different Lipschitz properties of in the two designs, which is fully explained in Lemma A.5 of the appendix. In the following theorems, we only present results for the case of bounded design for technical simplicity.
In addition, recalling that , where , we impose Condition 3.7 on and its estimator .
Condition 3.7 .
Part (i) of Corollary 3.7 ensures that the variances of each component of the debiased estimator exist, guaranteeing the existence of the Wald statistic. Parts (ii) and (iii) are imposed directly for technical simplicity. Results of this nature have been established under a similar set of assumptions in van de Geer et al. (2014) and Negahban et al. (2009) for convex penalties and in Wang et al. (2014a) and Loh and Wainwright (2015) for folded concave penalties.
As a step towards deriving the limit distribution of the proposed divide and conquer Wald statistic in the GLM framework, we establish the asymptotic behavior of the aggregated debiased estimator for every given .
Theorem 3.8.
A corollary of Theorem 3.8 provides the asymptotic distribution of the Wald statistic in equation (3.13) under the null hypothesis.
Corollary 3.9.
Remark 3.10.
3.2 Divide and Conquer Score Test
In this section, we use and to denote, respectively, the partial derivative of with respect to and the partial derivative vector of with respect to . , , and are analogously defined.
In the low dimensional setting (where is fixed), Rao’s score test of against is based on , where is a constrained maximum likelihood estimator of , constructed as . If is false, imposing the constraint postulated by significantly violates the first order conditions from M-estimation with high probability; this is the principle underpinning the classical score test. Under regularity conditions, it can be shown (e.g. Cox and Hinkley, 1974) that
where is given by , with , , and the partitions of the information matrix ,
| (3.15) |
The problems associated with the use of the classical score statistic in the presence of a high dimensional nuisance parameter are brought to light by Ning and Liu (2014), who propose a remedy via the decorrelated score. The problem stems from the inversion of the matrix in high dimensions. The decorrelated score is defined as
| (3.16) |
For a regularized estimator of , to be defined below, a mean value expansion of
| (3.17) |
around gives
| (3.18) | |||||
where for . The key to understanding how the decorrelated score remedies the problems faced by the classical score test is the observation that
where . Hence, provided is sufficiently sparse to avoid excessive noise accumulation, we are able to achieve rate acceleration in equation (3.18), ultimately giving rise to a tractable limit distribution of a suitable rescaling of . Since is restricted under the null hypothesis, , the statistic in equation (3.17) is accessible once is imposed. As Ning and Liu (2014) point out, is the solution to
under . We thus see that the population analogue of the decorrelation device is the linear combination that best approximates in a least squares sense.
Our divide and conquer score statistic under is
| (3.20) |
where and
| (3.21) |
Equation (3.21) is the Dantzig selector of Candes and Tao (2007).
Theorem 3.11.
Remark 3.12.
Remark 3.13.
To maintain the same computational complexity, an estimator of the conditional information needs to be constructed using a DC procedure. For this, we propose to use
where , and . By Lemma 3.14, this estimator is asymptotically consistent.
4 Accuracy of Distributed Estimation
As explained in Section 2.2, the information got lost in the divide-and-conquer process is not very much. This motivates us to consider , the loss incurred by the divide and conquer strategy in comparison with the computationally infeasible full sample debiased estimator . Indeed, it turns out that, for not too large, appears only as a higher order term in the decomposition of and thus is negligible compared to the statistical error, . In other words, the divide-and-conquer errors are statistically negligible.
When the minimum signal strength is sufficiently strong, thresholding achieves exact support recovery, motivating a refitting procedure based on the low dimensional selected variables. As a means to understanding the theoretical properties of this refitting procedure, as well as for independent interest, this section develops new theory and methodology for the low dimensional () linear and generalized linear models in addition to their high dimensional () counterparts. It turns out that simple averaging of low dimensional OLS or GLM estimators (denoted uniformly as , without superscript as debias is not necessary) suffices to preserve the statistical error, i.e., achieving the same statistical accuracy as the estimator based on the whole data set. This is because, in contrast to the high dimensional setting, parameters are not penalized in the low dimensional case. With the average of over the machines and the full sample counterpart (), we derive the rate of convergence of . Refitted estimation using only the selected covariates allows us to eliminate a term in the statistical rate of convergence of the estimator. We present the high dimensional and low dimensional results separately, with the analysis of the refitting procedures appearing as corollaries to the low dimensional analysis.
4.1 The High-Dimensional Linear Model
Recall that the high dimensional DC estimator is , where for is the debiased estimator defined in (3.3). We also denote the debiased LASSO estimator using the entire dataset as . The following lemma shows that not only is asymptotically normal, it approximates the full sample estimator so well that it has the same statistical error as provided the number of subsamples is not too large.
Lemma 4.1.
Remark 4.2.
The term in (4.1) is the estimation error of . Lemma 4.1 does not rely on any specific choice of , however, in order for the aggregated estimator to attain the same norm estimation error as the full sample LASSO estimator, , the required scaling is . This is a weaker scaling requirement than that of Theorem 3.3 because the latter entails a guarantee of asymptotic normality, which is a stronger result. It is for the same reason that our estimation results only require scaling whilst those for testing require scaling.
Although achieves the same rate as the LASSO estimator under the infinity norm, it cannot achieve the minimax rate in norm since it is not a sparse estimator. To obtain an estimator with the minimax rate, we sparsify by hard thresholding. For any , define the hard thresholding operator such that the -th entry of is
| (4.2) |
According to (4.1), if , we have with high probability. The following theorem characterizes the estimation rate of the thresholded estimator .
Theorem 4.3.
Remark 4.4.
In fact, in the proof of Theorem 4.3, we show that if the thresholding parameter satisfies , we have ; it is for this reason that we choose . Unfortunately, the constant is difficult to choose in practice. In the following paragraphs we propose a practical method to select the tuning parameter .
Let denote the transposed row of . Inspection of the proof of Theorem 3.3 reveals that the leading term of term of satisfies
Chernozhukov et al. (2013) propose the Gaussian multiplier bootstrap to estimate the quantile of . Let be i.i.d. standard normal random variable independent of . Consider the statistic
where is an estimator of such that for any , , and is a subvector of with indices in . Recall that “” denotes the Hadamard product. The -quantile of conditioning on is defined as . We can estimate by Monte-Carlo and thus choose . This choice ensures
which coincides with the convergence rate of the LASSO.
Remark 4.5.
Lemma 4.1 and Theorem 4.3 show that if the number of subsamples satisfies , and , and thus the error incurred by the divide and conquer procedure is negligible compared to the statistical minimax rate. The reason for this contraction phenomenon is that and share the same leading term in their Taylor expansions around . The difference between them is only the difference of two remainder terms which is smaller order than the leading term. We uncover a similar phenomenon in the low dimensional case covered in Section 4.3. However, in the low dimensional case norm consistency is automatic while the high dimensional case requires an additional thresholding step to guarantee sparsity and, consequently, norm consistency.
4.2 The High-Dimensional Generalized Linear Model
We can generalize the DC estimation of the linear model to GLM. Recall that is the de-biased estimator defined in (3.9) and the aggregated estimator is . We still denote . The next lemma bounds the error incurred by splitting the sample and the statistical rate of convergence of in terms of the infinity norm.
Applying a similar thresholding step as in the linear model, we obtain the following estimation rate in norm.
Theorem 4.7.
Remark 4.8.
As in the case of the linear model, Theorem 4.7 reveals that the loss incurred by the divide and conquer procedure is negligible compared to the statistical minimax estimation error provided .
A similar proof strategy to that of Theorem 4.7 allows us to construct an estimator of that achieves the required consistency with the scaling of Corollary 3.9. Our estimator is , where and is the thresholding operator defined in equation (4.2) with for some sufficiently large constant .
Corollary 4.9.
Under the conditions and scaling of Theorem 3.8, .
Substituting this estimator in Corollary 3.9 delivers a practically implementable test statistic based on subsamples.
4.3 The Low-Dimensional Linear Model
As mentioned earlier, the infinity norm bound derived in Lemma 4.1 can be used to do model selection, after which the selected support can be shared across all the local agents, significantly reducing the dimension of the problem as we only need to refit the data on the selected model. The remaining challenge is to implement the divide and conquer strategy in the low dimensional setting, which is also of independent interest. Here we focus on the linear model, while the generalized linear model is covered in Section 4.4.
In this section still stands for dimension, but in contrast with the rest of this paper in which , here we consider . More specifically, we consider the linear model (3.2) with and i.i.d sub-gaussian noise . It is well known that the ordinary least square (OLS) estimator of is defined as . In the massive data setting, the communication cost of estimating and inverting covariance matrices is very high (order ). However, as pointed out by Chen and Xie (2012), this estimator exactly coincides with the DC estimator,
In this section, we study the DC strategy to approximate with the communication cost only , which implies that we can only communicate dimensional vectors.
The OLS estimator based on the subsample is defined as . In order to estimate , a simple and natural idea is to take the average of , which we denote by . The question is whether this estimator preserves the statistical error as . The following theorem gives an upper bound of the gap between and , and shows that this gap is negligible compared with the statistical error of as long as is not large.
Theorem 4.10.
Remark 4.11.
By taking , the loss incurred by the divide and conquer procedure, i.e., , converges at a faster rate than the statistical error of the full sample estimator .
We now take a different viewpoint by returning to the high dimensional setting of Section 4.1 () and applying Theorem 4.10 in the context of a refitting estimator. In this refitting setting, the sparsity of Lemma 4.1 becomes the dimension of a low dimensional parameter estimation problem on the selected support. Our refitting estimator is defined as
| (4.7) |
where and is the same constant as in (4.1).
Corollary 4.12.
Suppose , where and is the same constant as in (4.1). Define the full sample oracle estimator as , where is the true support of . If , then for sufficiently large and we have
| (4.8) |
We see from Corollary 4.12 that achieves the oracle rate when the minimum signal strength is not too weak and the number of subsamples is not too large.
4.4 The Low-Dimensional Generalized Linear Model
The next theorem quantifies the gap between and , where is the average of subsambled GLM estimators and is the full sample GLM estimator.
Theorem 4.13.
Under Condition 3.6, if , then we have for sufficiently large and ,
| (4.9) |
Remark 4.14.
In analogy to Theorem 4.10, by constraining the growth rate of the number of subsamples according to , the error incurred by the divide and conquer procedure, i.e., decays at a faster rate than that of the statistical error of the full sample estimator .
As in the linear model, Lemma 4.6 together with Theorem 4.13 allow us to study the theoretical properties of a refitting estimator for the high dimensional GLM. Estimation on the estimated support set is again a low dimensional problem, thus the of Theorem 4.13 corresponds to the of Lemma 4.6 in this refitting setting. The refitted GLM estimator is defined as
| (4.10) |
where and . The following corollary quantifies the statistical rate of .
Corollary 4.15.
Suppose , where and is the same constant as in (4.4). Define the full sample oracle estimator as , where is the true support of . If , then for sufficiently large and we have
| (4.11) |
We thus see that achieves the oracle rate when the minimum signal strength is not too weak and the number of subsamples is not too large.
5 Numerical Analysis
In this section, we illustrate and validate our theoretical findings through simulations. For inference, we use QQ plots to compare the distribution of p-values for divide and conquer test statistics to their theoretical uniform distribution. We also investigate the estimated type I error and power of the divide and conquer tests. For estimation, we validate our claim of Sections 4.3 and 4.4 that the loss incurred by the divide and conquer strategy is negligible compared to the statistical error of the corresponding full sample estimator in the low dimensional case. An analogous empirical verification of the theory is performed for the high dimensional case, where we also compare the performance of the divide and conquer thresholding estimator of Section 4.1 to the full sample LASSO and the average LASSO over subsamples.
5.1 Results on Inference
We explore the probability of rejection of a null hypothesis of the form when data are generated according to the linear model,
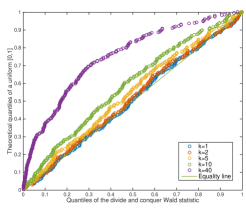
for and an sparse dimensional vector with and . In each Monte Carlo replication, we split the initial sample of size into subsamples of size . In particular we choose because it has a large number of factors . The number of simulations is 250. Using as a preliminary estimator of , we construct Wald and Rao score test statistics as described in Sections 3.1.2 and 3.2 respectively.
| (A) Wald test | (B) Score test |
 |
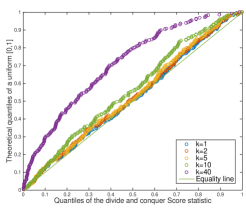 |
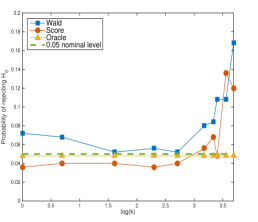
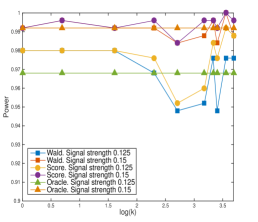
Panels (A) and (B) of Figure 1 are QQ plots of the p-values of the divide and conquer Wald and score test statistics under the null hypothesis against the theoretical quantiles of of the uniform [0,1] distribution for four different values of . For both test constructions, the distributions of the p-values are close to uniform and remain so as we split the data set. When , the distribution of the corresponding p-values is visibly non-uniform, as expected from the theory developed in Sections 3.1.2 and 3.2. Panel (A) of Figure 2 also supports our theoretical findings, showing that, for both test constructions, the empirical level of the test is close to both the nominal level and the level of the full sample oracle OLS estimator which knows the true support of . Moreover, it remains at this level as long as we do not split the data set too many times. Panel (B) of Figure 2 displays the power of the test for two different signal strengths, and . We see that the power is also comparable with that of the full sample oracle OLS estimator which knows the true support of .
| (A) Type I error | (B) Power |
|
|
5.2 Results on Estimation
In this section, we turn our attention to experimental validation of our divide and conquer estimation theory, focusing first on the low dimensional case and then on the high dimensional case.
5.2.1 The Low-Dimensional Linear Model
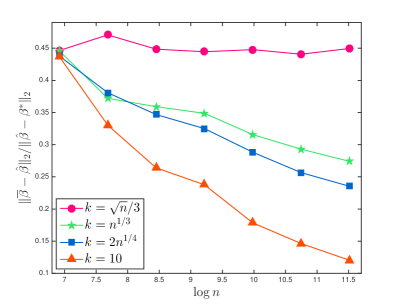
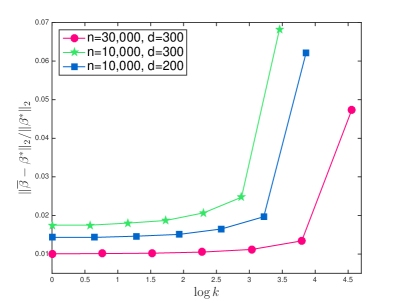
All entries of the design matrix are generated as i.i.d. standard normal random variables and the errors are i.i.d. standard normal as well. The true regression vector satisfies for and for , which guarantees that . Then we generate the response variable according to the model (3.2). Denote the full sample ordinary least-squares estimator and the divide and conquer estimator by and respectively. Figure 3(A) illustrates the change in the ratio as the sample size increases, where assumes three different growth rates and . Figure 3(B) focuses on the relationship between the statistical error of and under three different scalings of and . All the data points are obtained based on average over 100 Monte Carlo replications.
| (A) | (B) |
 |
 |
As Figure 3(A) demonstrates, when , or , the ratio decreases with ever faster rates, which is consistent with the argument of Remark 4.11 that the ratio goes to zero when . When , however, we observe that the ratio is essentially constant, which suggests the rate we derived in Theorem 4.10 is sharp.
From Figure 3(B), we see that when is not large, the statistical error of is very small because the loss incurred by the divide and conquer procedure is negligible compared to the statistical error of . However, when is larger than a threshold, there is a surge in the statistical error, since the loss of the divide and conquer begins to dominate the statistical error of . We also notice that the larger the ratio , the larger the threshold of , which is again consistent with Remark 4.11.
5.2.2 The Low-Dimensional Logistic Regression
In logistic regression, given covariates , the response , where denotes the Bernoulli distribution with expectation and
We see that is in exponential dispersion family canonical form (2.7) with , and . The use of the canonical link,
leads to the simplification .
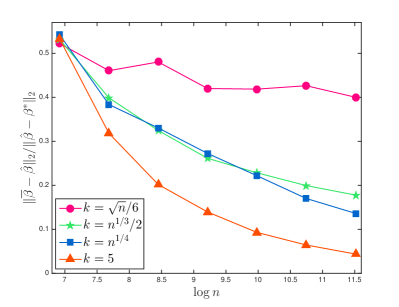
In our Monte Carlo experiments, all entries of the design matrix are generated as i.i.d. standard normal random variables. The true regression vector satisfies for and for , which guarantees that . Finally, we generate the response variables according to . Figure 4(A) illustrates the change of the ratio as the sample size increases, where assumes three different growths rates and . Figure 4(B) focuses on the relationship between the statistical error of and under three different scalings of and . All the data points are obtained based on an average over 100 Monte Carlo replications.
| (A) | (B) |
 |
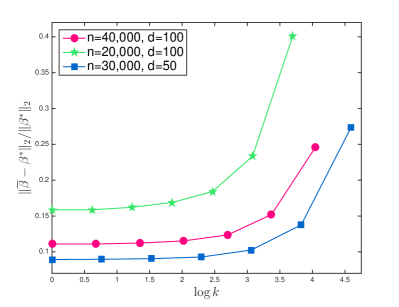 |
Figure 4 reveals similar phenomena to those revealed in Figure 3 of the previous subsection. More specifically, Figure 4(A) shows that when , or , the ratio decreases with even faster rates, which is consistent with the argument of Remark 4.14 that the ratio converges to zero when . When , however, we observe that the ratio remains essentially constant when is large, which suggests the rate we derived in Theorem 4.10 is sharp.
As for Figure 4(B), we again observe that the statistical error of is very small when is sufficiently small, but grows fast when becomes large. The reasoning is the same as in the linear model, i.e. when is large, the loss incurred by the divide and conquer procedure is non-negligible as compared with the statistical error of . In addition, as Figure 4(B) reveals, the larger is , the larger the threshold of , which is again consistent with the threshold rate pointed out in Remark 4.14.
5.2.3 The High Dimensional Linear Model
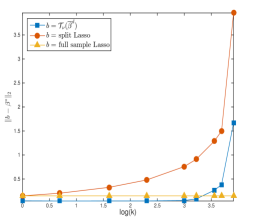
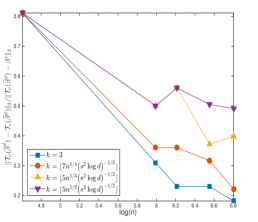
We now consider the same setting of Section 5.1 with , and for all in the support of . In this context, we analyze the performance of the thresholded averaged debiased estimator of Section 4.1. Figure 5(A) depicts the average over 100 Monte Carlo replications of for three different estimators: debiased divide-and-conquer , the LASSO estimator based on the whole sample and the estimator obtained by naïvely averaging the LASSO estimators from the subsamples . The parameter is taken as in the specification of . As expected, the performance of deteriorates sharply as increases. outperforms as long as is not too large. This is expected because, for sufficiently large signal strength, both and recover the correct support, however is unbiased for those in the support of , whilst is biased. Figure 5(B) shows the error incurred by the divide and conquer procedure relative to the statistical error of the full sample estimator, , for four different scalings of . We observe that, with and not too small, the relative error incurred by the divide and conquer procedure is essentially constant across , demonstrating the theory developed in Theorem 4.3.
| (A) Estimation error | (B) DC error |
 |
 |
6 Discussion
With the advent of the data revolution comes the need to modernize the classical statistical toolkit. For very large scale datasets, distribution of data across multiple machines is the only practical way to overcome storage and computational limitations. It is thus essential to build aggregation procedures for conducting inference based on the combined output of multiple machines. We successfully achieve this objective, deriving divide and conquer analogues of the Wald and score statistics and providing statistical guarantees on their performance as the number of sample splits grows to infinity with the full sample size. Tractable limit distributions of each DC test statistic are derived. These distributions are valid as long as the number of subsamples, , does not grow too quickly. In particular, is required in a general likelihood based framework. If grows faster than , remainder terms become non-negligible and contaminate the tractable limit distribution of the leading term. When attention is restricted to the linear model, a faster growth rate of is allowed.
The divide and conquer strategy is also successfully applied to estimation of regression parameters. We obtain the rate of the loss incurred by the divide and conquer strategy. Based on this result, we derive an upper bound on the number of subsamples for preserving the statistical error. For low-dimensional models, simple averaging is shown to be effective in preserving the statistical error, so long as for the linear model and for the generalized linear model. For high-dimensional models, the debiased estimator used in the Wald construction is also successfully employed, achieving the same statistical error as the LASSO based on the full sample, so long as .
Our contribution advances the understanding of distributed inference and estimation in the presence of large scale and distributed data, but there is still a great deal of work to be done in the area. We focus here on the fundamentals of statistical inference and estimation in the divide and conquer setting. Beyond this, there is a whole toolkit of statistical methodology designed for the single sample setting, whose split sample asymptotic properties are yet to be understood.
7 Proofs
In this section, we present the proofs of the main theorems appearing in Sections 3.1-4. The statements and proofs of several auxiliary lemmas appear in the Supplementary Material. To simplify notation, we take without loss of generality.
7.1 Proofs for Section 3.1
The proof of Theorem 3.3, relies on the following lemma, which bounds the probability that optimization problems in (3.1.1) are feasible.
Lemma 7.1.
Assume satisfies as well as , then we have
Proof.
The proof is an application of the union bound in Lemma 6.2 of Javanmard and Montanari (2014). ∎
Using Lemma 7.1 we now prove Theorem 7.2, from which Theorem 3.3 easily follows. The term in the decomposition of in Theorem 7.2 is responsible for the asymptotic normality of the proposed DC Wald statistic in Theorem 3.3, while the upper bound on ensures is asymptotically negligible.
Proof.
For notational convenience, we write simply as . Decompose as
hence , where
Defining , we have
by Hölder’s inequality, where by the definition of and, for ,
| (7.1) |
by Bühlmann and van de Geer (2011). We thus bound the expectation of the loss by
| (7.2) |
Define the event for . where
Consider , and in turn. By Hoeffding’s inequality, we have for any ,
| (7.3) |
By Markov’s inequality,
| (7.4) |
where the penultimate inequality follows from Jensen’s inequality. Finally, by Jensen’s inequality again,
| (7.5) | |||||
Combining (7.3), (7.4) and (7.5),
| (7.6) |
and taking delivers . ∎
Proof of Theorem 3.3..
We verify the requirements of the Lindeberg-Feller central limit theorem (e.g. Kallenberg, 1997, Theorem 4.12). Write
By the fact that is independent of for all and ,
By independence of and the definition of , we also have
It only remains to verify the Lindeberg condition, i.e.,
| (7.7) |
By Lemma A.1, , where , hence the event is contained in the event and we have
Let . Then, for any ,
| (7.8) |
Since by the statement of the theorem, the choice delivers
| (7.9) | |||||
by the bounded forth moment assumption. By the law of iterated expectations, all conditional results hold in unconditional form as well. Hence, by the Lindeberg-Feller central limit theorem. ∎
Proof of Corollary 3.5.
Proof of Lemma 3.4.
We first show that, for any , . To this end, letting
we write
by Theorem 6.1 of Bühlmann and van de Geer (2011). Hence, with , for , a fortiori for . Letting
We obtain the bound
By the statement of the Lemma, , hence , while by the central limit theorem and Theorem 6.1 of Bühlmann and van de Geer (2011),
We conclude , and with , with , a fortiori for . Finally, noting that , by the central limit theorem. Combining the bounds, we obtain for any and therefore . ∎
The proofs of Theorem 3.8 and Corollary 3.9 are stated as an application of Lemmas A.7 and A.8, which apply under a more general set of requirements.
Proof of Theorem 3.8.
We verify (A1)-(A4) of Lemma A.7. For (A1), decompose the object of interest as
where can be further decomposed and bounded by
We have
and by Condition 3.7, for any , a fortiori for a constant. Since is sub-Gaussian, a matching probability bound can easily be obtained for , thus we obtain for . (A2) and (A3) of Lemma A.7 are applications of Lemmas A.3 and A.4 respectively. To establish (A4), observe that , where , and . We thus consider for .
by Lemma A.4, thus for . Invoking Hölder’s inequality, Hoeffding’s inequality and Condition 2.1, we also obtain, for ,
Therefore . Finally, with ,
hence . This follows because by Lemma A.4 and
by Lemma C.4 of Ning and Liu (2014). ∎
Proof of Corollary 3.9.
We verify (A5)-(A9) of Lemma A.8. (A5) is satisfied because is consistent under the required scaling by the statement of the corollary. (A6) is satisfied by Condition 3.7. To verify (A7), first note that . According to Lemma A.2, we know that conditional on , is a sub-gaussian random variable. Therefore Lemma B.5 delivers
which implies that with probability ,
| (7.10) |
It only remains to verify (A8). Let . By the definition of the log likelihood,
and by independence of ,
By Condition 3.6, , the event coincides with the event . Furthermore, since by Condition 3.7, this event is contained in the event , where . By an analogous calculation to that of equation (7.8), we have
Hence, setting and noting that by Lemma A.2, it follows that
| (7.11) | |||||
where the last inequality follows because by Condition 3.6. Similarly, we have for any ,
Applying the self-normalized Berry-Essen inequality, we complete the proof of this corollary. ∎
7.2 Proofs for Section 3.2
The proof of Theorem 3.11 relies on several preliminary lemmas, collected in the Supplementary Material. Without loss of generality we set to ease notation.
Proof of Theorem 3.11.
7.3 Proofs for Section 4
Recall from Section 2 that for an arbitrary matrix , denotes the transposed row of and denotes the column of .
Proof of Lemma 4.1.
According to Theorem 7.2, we have , where . In (7.1), we prove that with probability larger than for some constant . Since is a special case of when , we also have , where (7.1) gives . Therefore, we have with high probability.
It only remains to bound the rate of . By Condition 3.2, conditioning on , we have for any ,
| (7.12) |
where is the variance proxy of defined in Condition 3.2 and
Let . Applying the union bound to (7.12), we have
Let , then with conditional probability ,
| (7.13) |
The last step is to bound . By the definition of , we have
| (7.14) |
where . The inequality is due to the fact that is the minimizer in (3.1.1). By condition (3.2) and the connection between subgaussian and subexponential distributions, the random variable satisfies
Therefore, by Bernstein’s inequality for subexponential random variables, we have
Applying the union bound again, we have
Therefore, with probability , there exist a constant such that
where the last inequality is due to Condition 3.1. By (7.13), we have with probability , . Combining this with the result on delivers the rate in the lemma. ∎
Proof of Theorem 4.3.
By Lemma 4.1 and , there exists a sufficiently large such that for the event we have . We choose , which implies that, under , we have .
Let be the support of . The derivations in the remainder of the proof hold on the event . Observe as . For , if , we have and thus . While if , . Therefore, on the event ,
The statement of the theorem follows because and . Following the same reasoning, on the event , we have
As Lemma 4.1 also gives , the proof is complete. ∎
Proof of Lemma 4.6.
The strategy of proving this lemma is similar to the proof of Lemma 4.1. In the proof of Lemma A.7 and Theorem 3.8, we have shown that
where the remainder term for each is
and for some . We bound by decomposing it into three terms:
By Hoeffding’s inequality and Condition 3.3, the first term is bounded by
| (7.15) |
with probability . By Condition 3.6 (iii), Condition 3.7 (iv) and Lemma A.4, we have with probability ,
| (7.16) |
Finally, we bound by with probability ,
| (7.17) | |||||
where the last inequality is due to Lemma A.4 and Lemma C.4 of Ning and Liu (2014).
Combining (7.15) - (7.17) and applying the union bound, we have
Therefore, we only need to bound the infinity norm of the leading term . By Condition 3.7 and equation (7.10), we have with probability ,
| (7.18) |
This, together with Condition 3.6 and Condition 3.7 give the bound,
with probability . Since is a special case of when , the proof of the lemma is complete. ∎
Proof of Corollary 4.9.
By an analogous proof strategy to that of Theorem 4.7, under the conditions of the Corollary provided . ∎
Proof of Theorem 4.10.
| (7.19) | ||||
For simplicity, denote by , by , by and by . For any , define an event for all , where , and an event , where . Note that by Lemma B.1 and B.4, the probability of both and are very small. In particular
Then, letting , an application of the union bound and Lemma B.8 delivers
When and , choose and . Then there exists a constant such that
Otherwise choose and . Then there exists a constant such that
Overall, we have
which leads to the final conclusion. ∎
Proof of Corollary 4.12.
Define an event , then by the condition on the minimal signal strength and Lemma 4.1, for some constant we have
where , which is the average of the oracle estimators on the subsamples. Then the conclusion can be easily validated. ∎
Proof of Theorem 4.13.
The following notation is used throughout the proof.
For any , satisfies
Through a Taylor expansion of the left hand side at the point , we have
where the remainder term is a dimensional vector with component
where is in a line segment between and . It therefore follows that
A similar equation holds for the global MLE :
where for ,
Therefore we have
where . We next derive stochastic bounds for and respectively, but to study the appropriate threshold, we introduce the following events with probability that approaches one under appropriate scaling. For and ,
where and . Denote the intersection of all the above events by . Note that Condition 3.6 implies that are i.i.d. sub-gaussian vectors, so by Lemmas B.1, B.4, B.3 and B.10, we have
We first consider the bounded design, i.e., Condition 3.6 (ii). In order to bound , we first derive an upper bound for . Under the event , by Lemma A.5 we have
It follows that, under ,
| (7.20) |
Note that is very similar to the RHS of Equation (7.19). Now we use essentially the same proof strategy as in the OLS part to bound . Following similar notations as in OLS, we denote by , by , by and by . For concision, we relegate the details of the proof to Lemma B.9, which delivers the following stochastic bound on .
| (7.21) |
Proof of Corollary 4.15.
Acknowledgements: The authors thank Weichen Wang, Jason Lee and Yuekai Sun for helpful comments.
References
- Bickel (1975) Bickel, P. J. (1975). One-step huber estimates in the linear model. Journal of the American Statistical Association 70 428–434.
- Bühlmann and van de Geer (2011) Bühlmann, P. and van de Geer, S. (2011). Statistics for high-dimensional data: methods, theory and applications. Springer.
- Candes and Tao (2007) Candes, E. and Tao, T. (2007). The Dantzig selector: statistical estimation when is much larger than . Ann. Statist. 35 2313–2351.
- Chen and Xie (2012) Chen, X. and Xie, M. (2012). A split and conquer approach for analysis of extraordinarily large data. Tech. Rep. 2012-01, Department of Statistics, Rutgers University.
- Chernozhukov et al. (2013) Chernozhukov, V., Chetverikov, D. and Kato, K. (2013). Gaussian approximations and multiplier bootstrap for maxima of sums of high-dimensional random vectors. Ann. Statist. 41 2786–2819.
- Cox and Hinkley (1974) Cox, D. R. and Hinkley, D. V. (1974). Theoretical statistics. Chapman and Hall, London.
- de la Peña et al. (2009) de la Peña, V. H., Lai, T. L. and Shao, Q.-M. (2009). Self-normalized processes. Probability and its Applications (New York), Springer-Verlag, Berlin. Limit theory and statistical applications.
- Fan et al. (2012) Fan, J., Guo, S. and Hao, N. (2012). Variance estimation using refitted cross-validation in ultrahigh dimensional regression. J. R. Stat. Soc. Ser. B. Stat. Methodol. 74 37–65.
- Fan et al. (2014) Fan, J., Han, F. and Liu, H. (2014). Challenges of big data analysis. National Sci. Rev. 1 293–314.
- Fan and Li (2001) Fan, J. and Li, R. (2001). Variable selection via nonconcave penalized likelihood and its oracle properties. J. Amer. Statist. Assoc. 96 1348–1360.
- Fan and Lv (2011) Fan, J. and Lv, J. (2011). Nonconcave penalized likelihood with np-dimensionality. Information Theory, IEEE Transactions on 57 5467–5484.
- Fan and Song (2010) Fan, J. and Song, R. (2010). Sure independence screening in generalized linear models with NP-dimensionality. Ann. Statist. 38 3567–3604.
- Javanmard and Montanari (2014) Javanmard, A. and Montanari, A. (2014). Confidence intervals and hypothesis testing for high-dimensional regression. Journal of Machine Learning Research 15 2869–2909.
- Kallenberg (1997) Kallenberg, O. (1997). Foundations of modern probability. Probability and its Applications (New York), Springer-Verlag, New York.
- Kleiner et al. (2014) Kleiner, A., Talwalkar, A., Sarkar, P. and Jordan, M. I. (2014). A scalable bootstrap for massive data. J. R. Stat. Soc. Ser. B. Stat. Methodol. 76 795–816.
- Lee et al. (2015) Lee, J. D., Sun, Y., Liu, Q. and Taylor, J. E. (2015). Communication-efficient sparse regression: a one-shot approach. ArXiv 1503.04337 .
- Loh and Wainwright (2013) Loh, P.-L. and Wainwright, M. J. (2013). Regularized m-estimators with nonconvexity: Statistical and algorithmic theory for local optima. In Advances in Neural Information Processing Systems 26 (C. Burges, L. Bottou, M. Welling, Z. Ghahramani and K. Weinberger, eds.). 476–484.
- Loh and Wainwright (2015) Loh, P.-L. and Wainwright, M. J. (2015). Regularized -estimators with nonconvexity: statistical and algorithmic theory for local optima. J. Mach. Learn. Res. 16 559–616.
- Meinshausen and Bühlmann (2006) Meinshausen, N. and Bühlmann, P. (2006). High-dimensional graphs and variable selection with the lasso. Ann. Statist. 34 1436–1462.
- Negahban et al. (2009) Negahban, S., Yu, B., Wainwright, M. J. and Ravikumar, P. K. (2009). A unified framework for high-dimensional analysis of -estimators with decomposable regularizers. In Advances in Neural Information Processing Systems.
- Ning and Liu (2014) Ning, Y. and Liu, H. (2014). A General Theory of Hypothesis Tests and Confidence Regions for Sparse High Dimensional Models. ArXiv 1412.8765 .
- Tibshirani (1996) Tibshirani, R. (1996). Regression shrinkage and selection via the lasso. J. Roy. Statist. Soc. Ser. B 58 267–288.
- van de Geer et al. (2014) van de Geer, S., Bühlmann, P., Ritov, Y. and Dezeure, R. (2014). On asymptotically optimal confidence regions and tests for high-dimensional models. Ann. Statist. 42 1166–1202.
- Vershynin (2010) Vershynin, R. (2010). Introduction to the non-asymptotic analysis of random matrices. arXiv preprint arXiv:1011.3027 .
- Wang et al. (2014a) Wang, Z., Liu, H. and Zhang, T. (2014a). Optimal computational and statistical rates of convergence for sparse nonconvex learning problems. Ann. Statist. 42 2164–2201.
- Wang et al. (2014b) Wang, Z., Liu, H. and Zhang, T. (2014b). Optimal computational and statistical rates of convergence for sparse nonconvex learning problems. Ann. Statist. 42 2164–2201.
- Zhang (2010) Zhang, C.-H. (2010). Nearly unbiased variable selection under minimax concave penalty. Ann. Statist. 38 894–942.
- Zhang and Zhang (2014) Zhang, C.-H. and Zhang, S. S. (2014). Confidence intervals for low dimensional parameters in high dimensional linear models. J. R. Stat. Soc. Ser. B. Stat. Methodol. 76 217–242.
- Zhang and Zhang (2012) Zhang, C.-H. and Zhang, T. (2012). A general theory of concave regularization for high-dimensional sparse estimation problems. Statistical Science 27 576–593.
- Zhang et al. (2013) Zhang, Y., Duchi, J. C. and Wainwright, M. J. (2013). Divide and Conquer Kernel Ridge Regression: A Distributed Algorithm with Minimax Optimal Rates. ArXiv e-prints .
- Zhao et al. (2014a) Zhao, T., Cheng, G. and Liu, H. (2014a). A Partially Linear Framework for Massive Heterogeneous Data. ArXiv 1410.8570 .
- Zhao et al. (2014b) Zhao, T., Kolar, M. and Liu, H. (2014b). A General Framework for Robust Testing and Confidence Regions in High-Dimensional Quantile Regression. ArXiv 1412.8724 .
Supplementary material to
Distributed Estimation and Inference with Statistical Guarantees Heather Battey∗† Jianqing Fan∗ Han Liu∗ Junwei Lu∗ Ziwei Zhu∗
†Department of Mathematics, Imperial College London, London, SW7 2AZ; Email: h.battey@imperial.ac.uk
Appendix A Auxiliary Lemmas for Inference
In this section, we provide the proofs of the technical lemmas for the divide and conquer inference.
Lemma A.1.
Under Condition 3.2, for any and for any , where satisfies .
Proof.
The proof appears in the proof of Lemma B1 of Zhao et al. (2014b). ∎
Lemma A.2.
Under the GLM (2.7), we have
and typically when there exists such that for all , we will have
which implies that is a sub-Gaussian random variable with variance proxy .
Proof.
When . the mean value theorem gives
∎
Lemma A.3.
Under Condition 3.6, we have for any and any , , where .
Proof.
Proof.
Decompose the object of interest as
This gives rise to the tail probability bound
| (A.1) |
Let . Since is bounded, it is sub-Gaussian as well. Suppose , then by Lemma B.2 we have,
where is a constant. Hence taking ,
and the right hand side is less than for . Thus by Condition 2.1, the first term on the right hand side of equation (A.1) is
Furthermore, by Condition 3.6 (i), the second term on the right hand side of equation (A.1) is
Taking as the dominant term, , yields the result. ∎
Lemma A.5.
Proof.
For the bounded design, by Condition 3.6 (iii), we have
For the sub-Gaussian design, denote the event by , where is a positive constant. Then it follows that,
where is a constant. Since on the event , , we reach the conclusion. ∎
Remark A.6.
For the sub-Gaussian design, in order to let the tail probability go to zero, .
Lemma A.7.
Suppose, for any satisfying , the following conditions are satisfied. (A1) , where is a constant and . (A2) For any and for any , with for and . (A3) . (A4) . Then
for any .
Proof of Lemma A.7.
. By the definition of ,
Consider a mean value expansion of around :
where , . So
and where
By (A4) of the lemma, for ,
Substituting in the expression for and noting that , we obtain for . By (A2),
therefore by (A1) and (A3) of the lemma, for ,
Substituting in the expression for and noting that , we obtain for , i.e. for . Combining these two results delivers for . ∎
Lemma A.8.
Proof.
Rewrite equation (3.13) as
| (A.3) | |||||
Further decomposing the first term, we have
and by the Lindeberg-Feller central limit theorem. Then by Hölder’s inequality, Condition 3.7 and Assumption (A6) and (A7),
where the last equation holds with the choice of . Letting we have
Since , . Similarly
yielding and consequently, by assumption (A5),
Invoking (A9) and the Lindeberg-Feller CLT, . Similarly
Combining all terms in the decomposition (A.3) delivers the result. ∎
(B1)-(B5) of Condition A.9 are used in the proofs of subsequent lemmas.
Condition A.9 .
(B1) , and for any ,
(B2) For any ,
(B3) Suppose satisfies (B1). Then for and for any ,
(B4) There exists a constant such that , and for , it holds that
(B5) For any , if there exists an estimator satisfying with probability , then
The proof of Theorem 3.11 is an application of Lemma A.13. To apply this Lemma, we must first verify (B1) to (B4) of Condition A.9. We do this in Lemma A.10.
Proof.
Verification of (B1).
As stated in Theorem 3.11, and by part (i) of Condition 3.6. The rest of (B1) follows from the proof of Lemma C.3 of Ning and Liu (2014).
Verification of (B2). Let . Since , since the product of a subgaussian random variable and a bounded random variable is subgaussian, and since , we have by Condition 3.6, Bernstein’s inequality and the union bound
Setting and solving for delivers the result.
Verification of (B3) Let and decompose the object of interest as
| (A.4) |
where the terms - are given by ,
We have the following bounds
, ,
and . Let . Then by Condition 3.6 and Lemma A.4
Noting the itself satisfies the requirements on in (B5), Lemma A.11 and Condition 2.1 together give
By (B1) verified above and noting that
the proof of Lemma A.11 delivers . Combining the bounds, we finally have
Verification of (B4). See Ning and Liu (2014), proof of Lemma C.2. ∎
In the following lemma, we verify (B5) under the same conditions.
Proof.
We obtain a tail probability bound for and in the decomposition
For the control over , note that by Condition 3.6 (ii) and (iii),
Hence Hoeffding’s inequality and the union bound deliver
| (A.5) |
For the control over , we have by Lemma A.5,
with probability . Hoeffding’s inequality and the union bound again deliver
| (A.6) |
Combining the bounds from equations (A.5) and (A.6) we have
Setting each term equal to , solving for and ignoring the relative magnitude of constants, we have , thus verifying (B5). ∎
Lemma A.12.
Proof.
By Hölder’s inequality,
hence, for any ,
Taking where and , we have
by (B1) and (B2) of Condition A.9. Hence the union bound delivers
for . Taking for arbitrarily small in the definition of and , the requirement is and for arbitrarily small. Since , with . Next, consider
By (B3) of Condition A.9, for , hence, proceeding in an analogous fashion to in the control over , we obtain
for . Hence with . Since , requires . ∎
Lemma A.13.
Under (B1) - (B4) of Condition A.9, with chosen to satisfy the scaling ,
Proof.
Lemma A.14.
Under Condition (B1), for any ,
Proof.
Set and note
by the union bound. Then by Condition (B1), . The proof of the second bound is analogous, setting . ∎
Lemma A.15.
Suppose (B5) of Condition A.9 is satisfied. For any , if there exists an estimator satisfying with probability , then
Proof.
Lemma A.16.
Suppose (B1)-(B5) of Condition A.9 are fulfilled. Then for any satisfying , .
Appendix B Auxiliary Lemmas for Estimation
In this section, we provide the proofs of the technical lemmas for the divide and conquer estimation.
Lemma B.1.
Suppose is a matrix that has independent sub-gaussian rows . Denote by , then we have
where , and and are both constants depending only on .
Proof.
See Vershynin (2010). ∎
Lemma B.2.
(Bernstein-type inequality) Let be independent centered sub-exponential random variables, and . Then for every and every , we have
Proof.
See Vershynin (2010). ∎
Lemma B.3.
Suppose is a matrix that has independent sub-gaussian rows . If and , then for all , there exists a constant such that when and are sufficiently large,
Proof.
Lemma B.4.
Suppose is a matrix that has independent sub-gaussian rows . , and . For all , there exists a constant such that when and are sufficiently large,
Proof.
It is easy to check the following inequality. For any two symmetric and semi-definite matrices and , we have
because for any vector satisfying , we have . Then it follows that
where satisfies and the last inequality is an application of Lemma B.1 with . ∎
Lemma B.5.
(Hoeffding-type Inequality). Let ,…, be independent centered sub-gaussian random variables, and let . Then for every and every , we have
Lemma B.6.
(Sub-exponential is sub-gaussian squared). A random variable is a sub-gaussian if and only if is sub-exponential. Moreover,
Lemma B.7.
Let ,…, be independent centered sub-gaussian random variables. Let and . Suppose , then we have
Lemma B.8.
Proof.
| (B.1) | ||||
| (B.2) | ||||
where we write and in place of and respectively is an absolute constant, and the last inequality holds because are sub-gaussian. Next we provide an upper bound on and . Note that
and similarly,
For any , define the event for all , where , and the event , where . On and , we have respectively
Therefore from Equation (B.1) and (B.2) we obtain
and
In addition, according to Lemma B.1 and B.4, the probability of both and are very small. More specifically,
Let . An application of the Chernoff bound trick leads us to the following inequality.
Minimize the right hand side by , then we have
Consider the net of , denoted by . Again it is known that . Using the maximal inequality, we have
Proceeding in an analogous fashion, we obtain
∎
Lemma B.9.
Following the same notation as in the proof of Theorem 4.13,
Proof.
By Lemma A.2, for any and such that , we have
and
where we write and in place of and respectively. Next we give a upper bound on and . Note that
Similarly,
On and , we have respectively
Then it follows that
and
Now we follow exactly the same steps as in the OLS part. Denote by . An application of the Chernoff bound technique and the maximal inequality leads us to the following inequality.
and
We have thus derived an upper bound for that holds with high probability. Specifically,
∎
Lemma B.10.
Under Condition 3.6, for and sufficiently large and we have
Proof.
The notation is that introduced in the proof of Theorem 4.13. We further define as well as the event , where . Note that as long as the event holds, the MLE falls in , therefore the proof strategy involves showing that approaches 1 at certain rate. By the Taylor expansion,
where , is some vector between and , , and .
Define the event , where is the same constant in Condition 3.6. Note that by Condition 3.6 (ii), is a sub-gaussian random vector. Then by Condition 3.6 (iii) and Lemma B.4, for sufficiently large and we have . Therefore on the event ,
We next show that, under an appropriate choice of , with high probability. We first consider Condition 3.6 (ii). Define . By Lemma B.3, we have . By Lemma A.5, on the event , we have
where the last inequality holds if we choose . Now we obtain the following probabilistic upper bound on , which we later prove to be negligible.
| (B.3) | ||||
Since each component of is a weighted average of i.i.d. random variables, the effect of concentration tends to make very small with large probability, which inspires us to study the moment generating function and apply the Chernoff bound technique. By Lemma A.2, for any constant , and let , then we have for any ,
It follows that
By the Chernoff bound technique, we obtain
Consider a net of , denoted by . Since
it follows that
Finally combining the result above with Equation (B.3) delivers the conclusion. ∎
Remark B.11.
Simple calculation shows that when , . When is a fixed constant, .