Decomposition Products of Phosphine Under Pressure: PH2 Stable and Superconducting?
Abstract
Evolutionary algorithms (EA) coupled with Density Functional Theory (DFT) calculations have been used to predict the most stable hydrides of phosphorous (PHn, ) at 100, 150 and 200 GPa. At these pressures phosphine is unstable with respect to decomposition into the elemental phases, as well as PH2 and H2. Three metallic PH2 phases were found to be dynamically stable and superconducting between 100-200 GPa. One of these contains five formula units in the primitive cell and has symmetry (5FU-). It is comprised of 1D periodic PH3-PH-PH2-PH-PH3 oligomers. Two structurally related phases consisting of phosphorous atoms that are octahedrally coordinated by four phosphorous atoms in the equatorial positions and two hydrogen atoms in the axial positions ( and 2FU-) were the most stable phases between 160-200 GPa. Their superconducting critical temperatures () were computed as being 70 and 76 K, respectively, via the Allen-Dynes modified McMillan formula and using a value of 0.1 for the Coulomb pseudopotential, . Our results suggest that the superconductivity recently observed by Drozdov, Eremets and Troyan when phosphine was subject to pressures of 207 GPa in a diamond anvil cell may result from these, and other, decomposition products of phosphine.
I Introduction
The pressure variable can be used to synthesize materials with unique stoichiometries, and properties that would not be accessible otherwise Grochala et al. (2007); Zurek and Grochala (2015); Hermann and Schwerdtfeger (2014); Hermann et al. (2012); Peng et al. (2012, 2015) resulting in chemically different bonding motifs that are not observed at ambient conditionsLu et al. (2013); Yao and Hoffmann (2011). Recent experimental work by Drozdov, Eremets and Troyan has shown that hydrides of the -element sulfur are superconducting with a critical temperature, , of 203 K at 150 GPa Drozdov A. P. et al. (2015). This work was inspired by first-principles calculations suggesting that at 130 GPa H2S would transform to a phase that has a of 80 K above 160 GPa Li et al. (2014). The much higher critical temperature observed experimentally led to the suggestion that under pressure hydrogen sulfide decomposes into a hydride with a stoichiometry that is not stable at 1 atm, and this new phase is responsible for the remarkably high Drozdov A. P. et al. (2015). Indeed, first principles-calculations Duan et al. (2014) confirmed that the (computed using the Allen-Dynes modified McMillan equation) of a novel -H3S phase matched exceedingly well with what was observed by Drozdov and co-workers. A plethora of theoretical calculations have verified that the H3S stoichiometry is indeed the most stable at these pressures, analyzed the factors contributing to , examined anharmonicity as well as the isotope effect, and computed for the related compounds selenium hydride and tellurium hydride Flores-Livas et al. ; Papaconstantopoulos et al. (2015); Bernstein et al. (2015); Duan et al. (2015); Errea et al. (2015); Akashi et al. (2015); Zhong et al. (2015); Li et al. (2015). These studies highlight that new hydrogen-rich materials can be attained under pressure, some of which may have a higher than those previously thought possible for Bardeen-Cooper-Schrieffer (BCS)-type superconductors Ashcroft (2004), and have invigorated the search for high-temperature superconductivity in high-pressure hydrides. For example, recently the stability of hydrides with novel stoichiometries containing a group 15 element such as P, As, and Sb have been studied computationally, and the superconducting properties of select systems were examined. Fu et al. .
Recently, new exciting experiments have revealed that pressure-induced high-temperature superconductivity may be found in other hydrides of a -block element. Drozdov, Eremets and Troyan measured superconductivity in phosphine, PH3, which was liquefied in a diamond anvil cell and subsequently compressed Drozdov et al. . Resistance measurements revealed a of 30 K and 103 K at 83 GPa and 207 GPa, respectively. Structural information on the superconducting phases was not provided. The possible existence of a high temperature superconductor containing phosphorus and hydrogen motivated us to examine the structural landscape of these elements combined under pressure using the evolutionary algorithm XtalOpt. Similar to what was found for HnS under pressure, it is likely that the observed superconducting properties do not arise from the hydride with the “classic” 1 atm stoichiometry, but instead decomposition products of phosphine, such as PH2. Between the pressures of 100-200 GPa phosphine is thermodynamically less stable than PH2 and H2, and several superconducting PH2 phases are metastable with respect to solid hydrogen and phosphorous. The computed for the PH2 structures via the Allen-Dynes modified McMillan equation are significantly larger than those expected for pure phosphorus, approaching the experimental values measured in “phosphine”. Our findings therefore suggest that PH2 may be another hydrogen-rich BCS-type superconductor.
II Computational Details
A priori crystal structure prediction calculations were carried out using the open-source evolutionary algorithm (EA) XtalOpt Release 8 and 9 Lonie and Zurek (2011, 2011) that has previously been used to predict the structures of a variety of binary hydrogen-rich phases under pressure Baettig and Zurek (2011); Hooper and Zurek (2012, 2012); Shamp et al. (2012); Hooper et al. (2014). EA runs were carried out on the PH3 stoichiometry at 100, 150, and 200 GPa employing simulation cells with 1-6 formula units (FU) at 100 GPa and 2-3 FU at 150 and 200 GPa. In addition, structure searches were performed on the PHn, = (1,2,4-6), systems at 100, 150, and 200 GPa using cells with 2-3 formula units, unless otherwise noted in Tables S1-S6 in the Supplementary Information (SI). Duplicate structures were detected via the XtalComp Lonie and Zurek (2012) algorithm. The lowest enthalpy structures from each search were relaxed in a pressure range from 100-200 GPa.
Geometry optimizations and electronic structure calculations were performed by using density functional theory as implemented in the Vienna Ab-Initio Simulation Package (VASP) versions 5.2 and 5.4.1 Kresse and Hafner (1993), with the gradient-corrected exchange and correlation functional of Perdew-Burke-Ernzerhof (PBE) Perdew et al. (1996). The projector augmented wave (PAW) method Blöchl (1994) was used to treat the core states, and a plane-wave basis set with an energy cutoff of 700 eV was employed. The H 1 and P 3/3 electrons were treated explicitly in all of the calculations, using the POTCARs for PAW-PBE H and PAW-PBE P available in the potpaw-PBE.52.tar.gz file from the VASP repository. The -point grids were generated using the -centered Monkhorst-Pack scheme, and the number of divisions along each reciprocal lattice vector was chosen such that the product of this number with the real lattice constant was 30 Å in the structure searches, and 40-50 Å otherwise. The -meshes and energy cutoffs used resulted in enthalpies that were converged to within 1 meV/atom. It is likely important to employ density functionals approximating the effects of van der Waals (vdW) interactions for molecular solids containing -block elements near ambient pressure. However, it has been shown that at higher pressures the effect of vdW interactions for these types of systems becomes negligible. For example, by 40 GPa dispersion forces were expected to have a minimal effect on the structural parameters, and as a result the properties, of CO2 S. et al. (2013). For this reason we expect the effect of vdW interactions on the results presented herein, which were obtained between 100 and 200 GPa, to be small. The Nudged Elastic Band (NEB) method Sheppard et al. (2012) was used to construct a reaction pathway between the and PH2 phases at 200 GPa.
Phonon calculations were performed using the Quantum Espresso (QE) Giannozzi et al. (2009) program to obtain the dynamical matrix and electron-phonon coupling (EPC) parameters. In the QE calculations, the H and P pseudopotentials, obtained from the QE pseudopotential library, were generated by the method of Trouiller-Martins with 1 and 33 valence configurations, respectively, along with the PBE generalized gradient approximation. Plane-wave basis set cutoff energies were set to 80 Ry for all systems. The Brillouin-zone sampling scheme of Methfessel-Paxton using a smearing of 0.02 Ry and k-point grids were used for all 100 GPa calculations of the PH2 2FU- and structures. At 150 and 200 GPa we used k-point grids of and for the PH2 2FU- and structures, respectively. For the PH2 5FU- structure a k-point grid was used. Density functional perturbation theory as implemented in QE was employed for the phonon calculations. The EPC matrix elements were calculated using q-meshes for all of the structures at 100 GPa, as well as for PH2 5FU- at 150 GPa, and the phosphorus structures at all pressures. At 150 and 200 GPa and q-meshes were used for the PH2 2FU- and structures, respectively. The EPC parameter, , was calculated using a set of Gaussian broadenings in steps of 0.005 Ry from 0-0.300 Ry. The broadening for which was converged to within 0.05 was between 0.015 and 0.040 Ry for all structures. The critical superconducting temperature, , has been estimated using the Allen-Dynes modified McMillan equation Allen and Dynes (1975) as,
| (1) |
where is the logarithmic average frequency and is the renormalized Coulomb potential, often assumed to be between 0.1 and 0.2.
III Results and Discussion
III.1 PHn: Pressure Induced Decomposition of PH3
Because the phases that PH3 adopts under pressure are unknown, we have carried out evolutionary searches to predict the global minima configurations up to 200 GPa. A detailed analysis will be published elsewhere, but the coordinates for the most stable structures found at GPa are provided in the SI. Briefly, the 100 GPa phase is made up of layers of PH and hydrogen, whereas the 150 and 200 GPa structures consist of 1-dimensional (1D) PH3-PH3 networks that resemble those present in the most stable PH2 structure at 100 GPa discussed below. The computed enthalpies of formation, , of PH3 with respect to the most stable structures of solid hydrogen Pickard and Needs (2007); Pickard et al. (2012) and phosphorus Kikegawa and Iwasaki (1983); Clark and Zaug (2010); Akahama et al. (1999, 2000); Jamieson (1963) showed that the classic 1 atm stoichiometry is not thermodynamically stable at the pressures considered herein, and potentially even at lower pressures. The for the reaction were computed to be 58.0, 45.2, and 42.6 meV/atom at 100, 150, and 200 GPa, respectively.
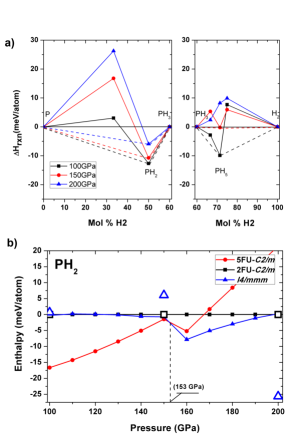
Nonetheless, it is convenient to plot the of the hydrides of phosphorous, PHn with , identified via our evolutionary searches for the reaction (where ) and (where ), as shown in the left and right hand sides of Fig. 1(a), respectively. For each of these plots a convex hull can be drawn, and the structures whose lie on the hull correspond to the most stable decomposition products of phosphine, or the most stable products arising from the reaction of phosphine with hydrogen. At 100, 150 and 200 GPa only PH2 is thermodynamically preferred over P/PH3, and the reaction PHPHH2 is exothermic. At 100 and 150 GPa the reaction PHHPH5 is exothermic. Because PH5 becomes unstable by 200 GPa we focused our analysis on PH2 (the coordinates for PH5 are provided in the SI).
Evolutionary searches at 100, 150 and 200 GPa identified three unique low-enthalpy PH2 phases, whose relative enthalpies are provided in Fig. 1(b). A symmetry system whose primitive cell contained five formula units, 5FU-, had the lowest enthalpy excluding zero point energy (ZPE) contributions below 153 GPa. A two formula unit cell with symmetry (2FU-) and an structure became preferred at higher pressures. Even though these species are thermodynamically unstable relative to solid phosphorous and H2 (by at least 38.7, 29.4, and 31.9 meV/atom at 100, 150 and 200 GPa), they are all dynamically stable at 100, 150 and 200 GPa. Moreover, the formation of PHn with from PH2 and H2 at 100, 150 and 200 GPa, and the decomposition of PH2 into H2 and PH at 100 and 150 GPa is computed as being endothermic.
The coordination and arrangement of the phosphorus atoms in 5FU- is quite different than in the 2FU- and phases. The former consists of PH3-PH-PH2-PH-PH3 oligomers extending along the -axis, which are 1D periodic along the -axis, [PH3-PH-PH2-PH-PH3], see Fig. 2(a,b). The PH3-PH-PH2-PH-PH3 unit possesses an inversion center of symmetry, with the H3P-PH and HP-PH2 distances measuring 2.191 and 2.167 Å, respectively, at 100 GPa. The phosphorous atoms comprising the PH and PH2 units are coordinated to four other phosphorous atoms forming a square net. Such structural motifs are not uncommon for compressed phosphorous, particularly in the pressure range between 100-200 GPa. For example, a number of the high pressure phases of elemental phosphorus, such as the A17 and A7 phases, have been described as Peierls distortions of a simple cubic lattice Seo and Hoffmann (1999); Clark and Zaug (2010); Boulfelfel et al. (2012). Beyond the A7 phase of black phosphorus, a simple cubic lattice is adopted at 11.1 GPa that is stable up to 137 GPa Jamieson (1963); Kikegawa and Iwasaki (1983); Akahama et al. (1999). After a relatively brief transition through a suspected incommensurate phase Ehlers and Christensen (2004); Hausserman (2003), simple cubic phosphorus transitions into a simple hexagonal phase Akahama et al. (1999) followed by a body centered cubic phase adopted at pressures above 262 GPa Akahama et al. (2000).
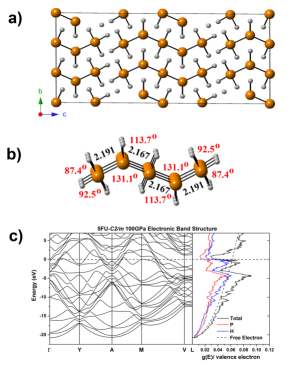
The phosphorous atoms in the -PH3 units at the end of the oligomer are nearly perfectly octahedrally coordinated to three hydrogen and three phosphorous atoms, with the H-P-H angles measuring 87.4 and 92.5∘ and the P-P-P angles measuring 90∘ at 100 GPa. Similarly, the phosphorous atoms comprising the -PH2- units at the center of the motif also assume octahedral coordination with four phosphorous atoms on the equatorial and two hydrogen atoms on the axial positions. The phosphorous atoms within the -PH- segment of the oligomer, on the other hand, are nearly trigonal bipyramidal. The axial positions are occupied by two phosphorous atoms, and the equatorial positions are filled by two phosphorous and one hydrogen atom (PPP = 131.1∘, PPH = 113.7 and 115.2∘). At this pressure all of the P-H distances fall between 1.430-1.444 Å, which is close to the typical experimental P-H bond length of 1.437 Å Kaye and Laby (1995) at 1 atm. The P-P distances fall in the range of 2.167-2.191 Å within the oligomer, and measure 2.151 Å between oligomers, which is comparable to the distance we calculate for elemental phosphorous at this pressure, 2.149 Å.
Fig. 2(c) shows that at 100 GPa 5FU--PH2 is metallic. The occupied density of states (DOS) is nearly free electron like. But because the Fermi level, , falls near a pseudogap the DOS at , = 0.045 eV-1/valence electron, is lower than the value computed for a free electron gas with the same bandwidth, 0.063 eV-1/valence electron. The metallicity is due primarily to hydrogen states with -character and also phosphorous states with -character. The occupied hydrogen and phosphorous states hybridize, indicative of covalent bonding. The electron localization function (ELF), provided in the SI, shows regions of high ELF along the P-P and P-H bonds, and no lone pairs are observed, as would be expected based upon valence-shell electron-pair repulsion (VSEPR) theory, which assumes that the geometry a molecule assumes minimizes the repulsion between valence shell electron pairs. A Bader analysis revealed electron transfer from phosphorous to hydrogen, with the average charge on the hydrogen atoms being -0.34 at 100 GPa. The charges on the phosphorous atoms in the -PH3, -PH2-, and -PH- units were computed as being +1.12, +0.70 and +0.25, respectively. At 150 GPa the average Bader charges become -0.37 (H), +1.15 (P in -PH3), +0.75 (P in -PH2-) and +0.30 (P in -PH-). Phonon calculations showed that this phase is dynamically stable at 150 GPa.
| System | Pressure | P-H(1) | P-H(2) | P-P | H-H(1) | H | P | Volume |
|---|---|---|---|---|---|---|---|---|
| (GPa) | (Å) | (Å) | (Å) | (Å) | () | () | (Å3/FU) | |
| 2FU- | 100 | 1.449 | 2.165 | 2.159 | 1.527 | -0.26 | 0.53 | 13.885 |
| 150 | 1.436 | 2.013 | 2.111 | 1.497 | -0.29 | 0.57 | 12.398 | |
| 160 | 1.445 | 1.760 | 2.127 | 1.510 | -0.27 | 0.55 | 12.025 | |
| 200 | 1.439 | 1.693 | 2.093 | 1.500 | -0.26 | 0.52 | 11.288 | |
| 100 | 1.449 | 2.163 | 2.157 | 1.528 | -0.30 | 0.60 | 13.882 | |
| 150 | 1.437 | 2.012 | 2.109 | 1.494 | -0.28 | 0.56 | 12.401 | |
| 160 | 1.435 | 1.989 | 2.101 | 1.490 | -0.28 | 0.56 | 12.170 | |
| 200 | 1.434 | 1.896 | 2.077 | 1.487 | -0.26 | 0.52 | 11.359 |
Above 160 GPa two structurally related PH2 phases, 2FU- (Fig. 3) and (Fig. 4), become more stable than 5FU-. The differences in the enthalpies of these two compounds at 150 and 200 GPa are less than 1 meV/atom, but in between these pressures the non-ZPE corrected enthalpy of the phase is slightly lower than that of 2FU-. The existence of nearly isoenthalpic hydrogen-rich phases under pressure in the DFT calculations is not unprecedented. We have previously found nearly isoenthalpic but distinct structures in our theoretical studies of hydrides containing an alkali metal or alkaline earth metal under pressure. This includes two Li5H phases that were computed as being more stable than Li and LiH above 50 GPa Hooper and Zurek (2012), five unique CsH3 structures that were preferred over CsH and H2 between 30-150 GPa Shamp et al. (2012) and three BaH6 phases that had nearly the same enthalpies around 100 GPa Hooper, Altintas, Shamp, and Zurek (2012).
In both the and phases of PH2 each phosphorous is octahedrally coordinated by four phosphorous atoms in the equatorial positions, and two hydrogen atoms in the axial positions. The difference between the two structures is that whereas in all of the atoms assume the ideal octahedral angles, in 2FU- the hydrogens are canted with respect to a line that lies normal to the phosphorous square net. At 100 GPa the canting angle is negligible (0.1∘), and the P-P and P-H bond lengths in the two structures are nearly identical (Table 1). At 160 and 200 GPa, however, the canting angle increases to 9.8 and 10.1∘, respectively. Even though the nearest neighbor P-P/P-H distances in are slightly smaller than in 2FU- at 160 and 200 GPa, the volume of the former is somewhat larger than that of the latter due to the tilting of the octahedra. The more efficient packing of the octahedra between the layers, which is a consequence of the canting, can most easily be seen by comparing the P-P distances between the phosphorous atoms comprising different layers. At 100 GPa the separation is identical, 2.983 Å, resulting in comparable volumes. By 160 GPa, however, this distance becomes 2.757 and 2.695 Å for and 2FU-, respectively, giving rise to the sudden difference in volume of 1.2% between the two phases. The contribution to the enthalpy is smaller in the more compact 2FU- phase, but the electronic contribution more strongly favors the more symmetric structure (see the SI), such that is preferred by a few meV/atom for 155-195 GPa. By 200 GPa, however, the two phases become isoenthalpic.
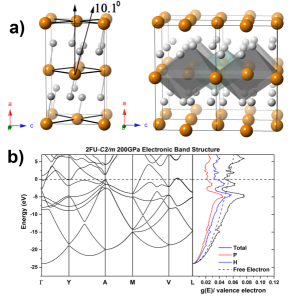
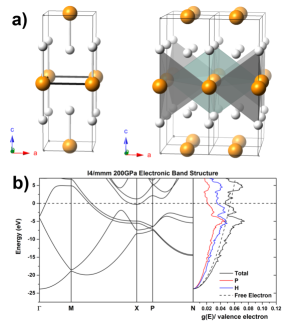
Similar to 5FU-, regions of high ELF in 2FU- and are found only along the P-P and P-H bonds and the Bader charges in Table 1 are indicative of charge transfer from phosphorous to hydrogen. Both of these phases are good metals with = 0.045-0.048 eV-1/valence electron at 200 GPa, which is close to the value computed for a free electron gas with the same bandwidth, 0.054 eV-1/valence electron. Their DOS plots display many features in common with the DOS calculated for 5FU-: they are indicative of H/P hybridization and the character at the Fermi level is primarily hydrogen -like, with substantial contributions from phosphorous -states. Phonon calculations revealed that these two structures are dynamically stable at 100, 150, and 200 GPa.
Because of the structural similarity between the 2FU- and phases, we wondered if they may be connected via a low energy pathway. The NEB method was employed to find the barrier and transition state between the two structures. The computed barrier was 270 meV/atom at 200 GPa, implying that these phases likely lie within two distinct wells on the potential energy surface. The transition state (whose coordinates are given in the SI) can best be described as the average of the two PH2 phases. Within the NEB method, the positions of the individual atoms within the starting and ending structures must match as closely as possible to avoid large geometric changes that may result in unrealistic barriers. In order to do this the structure has to be reduced down to its primitive triclinic cell and then a 2 FU supercell in the crystallographic -direction direction must be constructed. In the transition state structure the perfect 90∘ square phosphorus nets described above have been distorted to diamonds with internal angles of 67 and 113∘ resulting in nearest and second nearest neighbor P-P distances of 1.885 and 2.581 Å (c.f. Table 1), and the distance separating the P-P layers is 2.941 Å, which can be compared to 3.017 and 2.963 Å for the and phases, respectively. Each phosphorus is [2+4] coordinate to hydrogen. Similar to the two end point structures, the shortest two P-H distances fall between 1.45 and 1.50 Å, which is slightly longer than the distance of a P-H bond in phosphine at ambient conditions, 1.42 Å Weast and Selby (1966). The remaining four P-H distances fall within 1.7-1.8 Å, and are different for each phosphorous atom in the P1 symmetry 2FU transition state.
We also wondered if tilting the octahedra to different angles would yield other structures not found in our evolutionary runs whose enthalpies were similar to and . In order to test this hypothesis we relaxed structures constructed to have canting angles of 45∘, as well as geometries where hydrogen atoms were placed at random positions within the phosphorous lattice at 200 GPa. No unique low enthalpy structures were found. In addition, a closer inspection of the evolutionary runs showed that structures similar to those we constructed by hand had been generated and optimized during the EA searches, but their enthalpies were significantly higher than 5FU-, 2FU- and PH2.
Because the ZPE may be large for extended systems containing light elements, we computed the enthalpic differences between these three PH2 phases including the ZPE corrections at pressures where they were dynamically stable. The open symbols in Fig. 1(c) show that the inclusion of the ZPE makes the and 2FU- structures significantly more stable than 5FU- at 150 GPa, with the being preferred by 6 meV/atom. Because the 2FU- and phases are structurally similar, so is their phonon DOS, and their ZPE at 150 GPa is nearly identical. The phonon DOS of the 5FU- phase, on the other hand, shows that the frequencies associated with the hydrogen vibrations above 2000 cm-1 are larger in comparison to these two phases, resulting in a significantly larger ZPE at 150 GPa, which leads to the destabilization of this phase when compared to the other two structures. At 200 GPa the ZPE corrections favor the phase such that its zero-point corrected enthalpy is 25 meV/atom lower than that of 2FU-. The reason for this is that the structure has more high frequency modes above 1500 cm-1 (see Fig. 5). Thus, our results present another example of how the ZPE of phases with light elements can affect their relative enthalpies. It is beyond the scope of this work to consider anharmonic effects to the (free) energies (and ), but it may be that these also influence the order of stability of the phases studied herein. To determine if these three PH2 structures could potentially contribute to the superconductivity observed by Drozdov and co-workers in their compression of phosphine up to 207 GPa, their superconducting properties were investigated in further detail, as described in the following section.
III.2 Superconducting Phases of PH2
Above 5 GPa superconductivity has been observed in black phosphorous, the most stable allotrope at ambient conditions. The experimentally measured depends on the path taken in the pressure/temperature phase diagram. Recent experiments, and DFT calculations using the Allen-Dynes modified McMillan equation, both showed that for the simple cubic phase of phosphorous decreases with increasing pressure Karuzawa et al. (2002); Chan et al. (2013). Computations revealed that the decrease in above 30 GPa could be explained by the increase in the phonon frequencies, and a of 0.18 yielded a of 5.8 K at 70 GPa Chan et al. (2013), which agrees well with the experimentally measured of 4.3 K at 100 GPa Karuzawa et al. (2002). At higher pressures, up to 160 GPa, experiments suggested that decreased below 4 K Karuzawa et al. (2002). In comparison, the computational methodology used herein coupled with a of 0.18 resulted in a of 6.4 K for simple cubic phosphorous at 100 GPa, and slightly higher temperatures for smaller values of the Coulomb pseudopotential, see Table 2. We have also computed the parameters entering the Allen-Dynes modified McMillan equation for simple hexagonal phosphorous at 150 and 200 GPa, so that they may be compared with those calculated for the aforementioned PH2 phases. As Table 2 shows, the average logarithmic frequency, , of phosphorous increases with pressure and the electron-phonon coupling, , decreases quenching the superconductivity within the simple hexagonal phase.
How would the incorporation of H atoms within the phosphorus lattices, in the most stable PH2 geometries, affect the , and ? To answer this question we computed the superconducting properties of the previously discussed PH2 phases, at pressures where they were found to be dynamically stable, and the results are given in Table 2. Fig. 5 provides the phonon band structure and linewidths, Eliashberg spectral function, and plots the dependence of on the frequencies for the 2FU- and phases at 200 GPa (analogous plots can be found in the SI for all of the other values computed herein). In pure compressed hydrogen it has been proposed that can range from 0.08 to 0.089Richardson et al. (1997); McMahon et al. (2011), whereas values of 0.18Chan et al. (2013) have been employed for simple cubic phosphorus at 100 GPa. We therefore list critical temperatures computed for of 0.1 and 0.18 in Table 2. However, because the generally accepted value for the Coulomb pseudopotential is within 0.1 to 0.13, the text quotes values computed for a of 0.1.
| System | Pressure (GPa) | (K) | (K) | (K) | |
|---|---|---|---|---|---|
| S.C. P | 100 | 0.66 | 521.7 | 15.9 | 6.4 |
| S.H. P | 150 | 0.21 | 575.6 | 0.00 | 0.00 |
| S.H. P | 200 | 0.13 | 671.8 | 0.00 | 0.00 |
| 5FU- | 100 | 1.05 | 655.1 | 49.0 | 32.1 |
| 5FU- | 150 | 1.00 | 798.1 | 55.5 | 35.2 |
| 2FU- | 200 | 1.04 | 1026.5 | 75.6 | 49.2 |
| 150 | 0.86 | 946.2 | 50.6 | 28.3 | |
| 200 | 1.13 | 851.6 | 70.4 | 48.0 |
Because of the structural similarities between and at 150 GPa, their critical temperatures should be nearly identical, and was calculated as being 51 K for the structure. The aforementioned canting of the octahedra results in geometric changes between these two structures at higher pressures, which could potentially affect the superconducting properties. Indeed, at 200 GPa the electron phonon coupling of was calculated as being somewhat larger than for , but was nearly 175 K larger for because the vibrational modes arising primarily from hydrogen atoms are, on average, found at higher frequencies in this phase. The canting results in a larger number of hydrogen atoms that are found within a distance of 2 Å of a given hydrogen in , thereby increasing the frequencies associated with their vibrations. For example, whereas has four H-H distances at 1.486 Å, in the H-H measures are 11.497 Å, 11.507 Å, 21.585 Å, and 21.775 Å. Because of the opposing effects of and on the critical temperature, the values computed for the (76 K) and (70 K) phases at 200 K are very similar despite their structural differences.
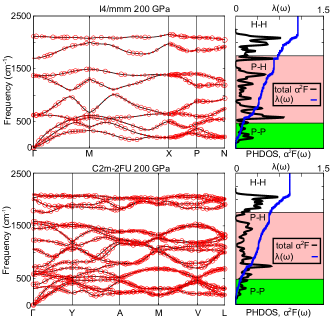
At 200 GPa the most significant contribution to in the 2FU- and PH2 systems stems from vibrational modes between 500-1750 cm-1 that involve hydrogen and phosphorus motions. The electron phonon coupling arising from modes above 1750 cm-1, which consist primarily of the motion of hydrogen atoms with a small share from the phosphorous atoms, are also substantial components of the total . Vibrations below 500 cm-1, which are the result of phosphorus motions, play a small, but non-negligible role in the electron-phonon coupling. The computed of the PH2 phases are significantly larger than for monoatomic phosphorus because hydrogen increases both and . The electron phonon coupling is in-line with the values typically computed for compressed hydrogen-rich phases, 0.5-1.6Flores-Livas et al. (2012); Gao et al. (2008); Tanaka et al. (2007), but smaller than the values of 2.19 at 200 GPa and 2.69 at 150 GPa computed for H3S Duan et al. (2014) and CaH6 Wang et al. (2012), respectively. The phonon linewidths reveal that unlike CaH6 Wang et al. (2012), where the electron phonon coupling was derived primarily from a single vibrational mode, a plethora of modes contribute towards in PH2.
The superconducting critical temperatures we compute for the and 2FU- phases of PH2 are somewhat lower than the experimentally measured value of 103 K at 207 GPa Drozdov et al. . However, it may be that the measured by Drozdov and co-workers results from a mixture of phases. For example, recent experimental work has suggested that the decomposition of LiH under pressure in a diamond anvil cell may lead to the formation of layers with different LiHn stoichiometriesPepin et al. (2015). The experiments were inspired by theoretical predictionsZurek et al. (2009), and observables computed via DFT calculations were employed to aid the interpretation of the experimental results. Pepin and co-workers suggested that under pressure Li diffuses into the diamond anvil cell forming a LiH6 layer at the diamond/sample interface, and an LiH2 layer at the LiH6/LiH interface. Such mechanisms may also be important for the pressure induced decomposition of phosphine, and it is only via comparison of the computed experimental observables for specific phases with the results obtained experimentally that one can uncover which phases are formed under pressure, and the mechanisms underlying their formation. A feedback loop between experiment and theory is integral to advance our understanding of high pressure phenomena.
The decrease in with pressure of all of the PH2 phases considered herein correlates with the markedly lower critical temperature, 30 K, measured by Drozdov and co-workers at 83 GPa. In future work we will focus on predicting the structures of PHn phases at pressures where vdW interactions may be important, and interrogate their bonding and superconducting properties.
IV Conclusions
Recent experiments revealed that when PH3 is compressed to 207 GPa, it becomes superconducting below 103 K Drozdov et al. . Our density functional theory (DFT) calculations have shown that at pressures of 100, 150 and 200 GPa PH3 is thermodynamically unstable with respect to decomposition into the elemental phases, as well as PH2 and H2. Based upon the computed enthalpies other reactions that may occur under pressure are: PHHPH5 (100 and 150 GPa) and PHH2+PH (100 GPa). A priori crystal structure prediction has been used to identify three PH2 phases that are dynamically stable in the pressure range of 100-200 GPa. All of these are calculated to be superconducting via the Allen-Dynes modified McMillan equation, suggesting that like H3S Drozdov A. P. et al. (2015), PH2 may be another hydrogen-rich Bardeen-Cooper-Schrieffer (BCS)-type superconductor.
Two PH2 structures with and symmetry were computed to have a superconducting critical temperature, , of 76 K and 70 K, respectively, at 200 GPa. Between 150-200 GPa the non-ZPE (zero point energy) corrected enthalpies of these phases differed by only a few meV/atom, and their structures both consisted of square nets of phosphorous atoms. In the structure the phosphorous atoms were octahedrally coordinated, with two hydrogen atoms in the axial positions. In the phase the hydrogens are slightly canted from the ideal octahedral angles allowing the distance between the planes of phosphorous atoms to decrease, and reducing the volume of the structure. A five formula unit phase with symmetry (5FU-), which consists of 1-D PH3-PH-PH2-PH-PH3 oligomers, was also identified in our evolutionary searches, and it has the lowest non-ZPE corrected enthalpy at 100 GPa. At this pressure it’s is computed to be 49 K. Upon decreasing the pressure, the of all of the PH2 phases decreased.
Our results provide another example of how pressure can lead to the formation of compounds with stoichiometries and properties that would not be predicted based upon our experience at 1 atm. Comparison of the observables computed for these PH2 phases with results obtained experimentally will unveil which phase, or mixture of phases, give rise to the superconducting properties observed by Drozdov and co-workers Drozdov et al. .
Supplementary Information Available:
Details of the structure searches, band structures, structural parameters, DOS plots, phonon DOS plots, absolute energies in Hartree, phonon convergence plots, and Nudged Elastic Band results. This material is available free of charge via the Internet at http://pubs.acs.org.
V Acknowledgements
We acknowledge the NSF (DMR-1505817) for financial, and the Center for Computational Research (CCR) at SUNY Buffalo for computational support. A.S. acknowledges financial support from the Department of Energy National Nuclear Security Administration under Award Number DE-NA0002006, and E.Z. thanks the Alfred P. Sloan Foundation for a research fellowship (2013-2015). A.S. also acknowledges Daniel Miller for his help with using the Nudge Elastic Band Method.
References
- Grochala et al. (2007) W. Grochala, R. Hoffmann, J. Feng and N. W. Ashcroft, Angew. Chem. Int. Ed., 2007, 46, 3620–3642.
- Zurek and Grochala (2015) E. Zurek and W. Grochala, Phys. Chem. Chem. Phys., 2015, 17, 2917–2934.
- Hermann and Schwerdtfeger (2014) Hermann, A.; Schwerdtfeger, P. J. Phys. Chem. Lett. 2014, 5, 4336–4342.
- Hermann et al. (2012) Hermann, A.; McSorley, A.; Ashcroft, N. W.; Hoffmann, R. J. Am. Chem. Soc 2012, 134, 18606–18618.
- Peng et al. (2012) Peng, F.; Miao, M.; Wang, H.; Li, Q.; Ma, Y. J. Am. Chem. Soc. 2012, 134, 18599–18605.
- Peng et al. (2015) Peng, F.; Yao, Y.; Liu, H.; Ma, Y. J. Phys. Chem. Lett. 2015, 6, 2363–2366.
- Lu et al. (2013) Lu, C.; Miao, M.; Ma, Y. J. Am. Chem. Soc 2013, 135, 14167–14171.
- Yao and Hoffmann (2011) Yao, Y.; Hoffmann, R. J. Am. Chem. Soc. 2011, 133, 21002–21009.
- Drozdov A. P. et al. (2015) Drozdov A. P., Eremets M. I., Troyan I. A., Ksenofontov V. and Shylin S. I., Nature, 2015, 525, 73–76.
- Li et al. (2014) Y. Li, J. Hao, H. Liu, Y. Li and Y. Ma, J. Chem. Phys., 2014, 140, 174712.
- Duan et al. (2014) D. Duan, Y. Liu, F. Tian, D. Li, X. Huang, Z. Zhao, H. Yu, B. Liu, W. Tian and T. Cui, Sci. Rep., 2014, 4, 6968.
- (12) J. A. Flores-Livas, A. Sanna and E. K. U. Gross, arXiv:1501.06336v1.
- Papaconstantopoulos et al. (2015) D. A. Papaconstantopoulos, B. M. Klein, M. J. Mehl and W. E. Pickett, Phys. Rev. B, 2015, 91, 184511.
- Bernstein et al. (2015) N. Bernstein, C. S. Hellberg, M. D. Johannes, I. I. Mazin and M. J. Mehl, Phys. Rev. B, 2015, 91, 060511.
- Duan et al. (2015) D. Duan, X. Huang, F. Tian, D. Li, H. Yu, Y. Liu, Y. Ma, B. Liu and T. Cui, Phys. Rev. B, 2015, 91, 180502.
- Errea et al. (2015) I. Errea, M. Calandra, C. J. Pickard, J. Nelson, R. J. Needs, Y. Li, H. Liu, Y. Zhang, Y. Ma and F. Mauri, Phys. Rev. Lett., 2015, 114, 157004.
- Akashi et al. (2015) R. Akashi, M. Kawamura, S. Tsuneyuki, Y. Nomura and R. Arita, Phys. Rev. B, 2015, 91, 224513.
- Zhong et al. (2015) X. Zhong, H. Wang, J. Zhang, H. Liu, S. Zhang, H. Song, G. Yang, L. Zhang and Y. Ma, arXiv:1502.02607.
- Li et al. (2015) Y. Li, L. Wang, H. Liu, Y. Zhang, J. Hao, C. J. Pickard, J. R. Nelson, R. J. Needs, W. Li, Y. Haung, I. Errea, M. Calandra, F. Mauri and Y. Ma, arXiv:1508.03900.
- Ashcroft (2004) N. W. Ashcroft, Phys. Rev. Lett., 2004, 92, 187002.
- (21) A. P. Drozdov, M. I. Eremets and I. A. Troyan, arXiv:1508.06224.
- (22) Y. Fu, X. Du, L. Zhang, F. Peng, M. Zhang, C. Pickard, R. J. Needs, D. J. Singh, W. Zheng, Y. Ma, arXiv:1510.04415.
- Lonie and Zurek (2011) D. C. Lonie and E. Zurek, Comput. Phys. Commun., 2011, 182, 372–387.
- Lonie and Zurek (2011) D. C. Lonie and E. Zurek, Comput. Phys. Commun., 2011, 182, 2305–2306.
- Baettig and Zurek (2011) P. Baettig and E. Zurek, Phys. Rev. Lett., 2011, 106, 237002.
- Hooper and Zurek (2012) J. Hooper and E. Zurek, Chem. Eur. J., 2012, 18, 5013–5021.
- Hooper and Zurek (2012) J. Hooper and E. Zurek, ChemPlusChem, 2012, 77, 969–972.
- Shamp et al. (2012) A. Shamp, J. Hooper and E. Zurek, Inorg. Chem., 2012, 51, 9333–9342.
- Hooper et al. (2014) J. Hooper, T. Terpstra, A. Shamp and E. Zurek, J. Phys. Chem. C, 2014, 118, 6433–6447.
- Lonie and Zurek (2012) D. C. Lonie and E. Zurek, Comput. Phys. Commun., 2012, 183, 690.
- Kresse and Hafner (1993) G. Kresse and J. Hafner, Phys. Rev. B, 1993, 47, 558.
- Perdew et al. (1996) J. P. Perdew, K. Burke and M. Ernzerhof, Phys. Rev. Lett., 1996, 77, 3865.
- Blöchl (1994) P. Blöchl, Phys. Rev. B, 1994, 50, 17953.
- S. et al. (2013) S. Gohr., S. Grimme, T. Sohnel, B. Paulus and P. Schwedtfeger, J. Chem. Phys., 2013, 139, 174501.
- Sheppard et al. (2012) D. Sheppard, P. Xiao, W. Chemelewski, D. D. Johnson, and G. Henkelman, J. Chem. Phys., 2012, 136, 074103.
- Giannozzi et al. (2009) P. Giannozzi, S. Baroni, N. Bonini, M. Calandra, R. Car, C. Cavazzoni, D. Ceresoli, G. L. Chiarotti, M. Cococcioni, I. Dabo, A. Dal Corso, S. de Gironcoli, S. Fabris, G. Fratesi, R. Gebauer, U. Gerstmann, C. Gougoussis, A. Kokalj, M. Lazzeri, L. Martin-Samos, N. Marzari, F. Mauri, R. Mazzarello, S. Paolini, A. Pasquarello, L. Paulatto, C. Sbraccia, S. Scandolo, G. Sclauzero, A. P. Seitsonen, A. Smogunov, P. Umari and R. M. Wentzcovitch, J. Phys. Condens. Matter, 2009, 21, 395502.
- Allen and Dynes (1975) P. B. Allen and R. C. Dynes, Phys. Rev. B, 1975, 12, 905.
- Pickard and Needs (2007) C. J. Pickard and R. J. Needs, Nat. Phys., 2007, 3, 473–476.
- Pickard et al. (2012) C. J. Pickard, M. Martinez-Canales and R. J. Needs, Phys. Rev. B, 2012, 85, 214114.
- Kikegawa and Iwasaki (1983) T. Kikegawa and H. Iwasaki, Acta Cryst., 1983, B39, 158–164.
- Clark and Zaug (2010) S. M. Clark and J. M. Zaug, Phys. Rev. B., 2010, 82, 134111.
- Akahama et al. (1999) Y. Akahama, M. Kobayashi and H. Kawamura, Phys. Rev. B., 1999, 59, 8520.
- Akahama et al. (2000) Y. Akahama, H. Kawamura, S. Carlson, T. L. Bihan and D. Hausermann, Phys. Rev. B, 2000, 61, 3139.
- Jamieson (1963) J. C. Jamieson, Science, 1963, 139, 1291–1292.
- Seo and Hoffmann (1999) D.-K. Seo and R. Hoffmann, J. Solid State Chem., 1999, 147, 26–37.
- Boulfelfel et al. (2012) S. E. Boulfelfel, G. Seifert, Y. Grin and S. Leoni, Phys. Rev. B., 2012, 85, 014110.
- Ehlers and Christensen (2004) F. J. H. Ehlers and N. E. Christensen, Phys. Rev. B, 2004, 69, 214112.
- Hausserman (2003) U. Hausserman, Chem. Eur. J., 2003, 9, 1471–1478.
- Kaye and Laby (1995) G. W. C. Kaye and T. H. Laby, Tables of Physical and Chemical Constants, 1995, http://www.kayelaby.npl.co.uk/.
- Weast and Selby (1966) R. C. Weast and S. M. Selby, Handbook of Chemistry and Physics, 1966, CRC Press/Taylor and Francis, Boca Raton, FL.
- Hooper, Altintas, Shamp, and Zurek (2012) J. Hooper, B. Altintas, A. Shamp and E. Zurek, J. Phys. Chem. C, 2012, 117, 2982-2992.
- Karuzawa et al. (2002) M. Karuzawa, M. Ishizuka and S. Endo, J. Phys. Condens. Matter, 2002, 14, 10759–10762.
- Chan et al. (2013) K. T. Chan, B. D. Malone and M. L. Cohen, Phys. Rev. B, 2013, 88, 064517.
- Richardson et al. (1997) C. F. Richardson and N. W. Ashcroft, Phys. Rev. Lett., 1997, 78, 118.
- McMahon et al. (2011) J. M. McMahon and D. M. Cohen, Phys. Rev. B, 2011, 84, 144515.
- Flores-Livas et al. (2012) J. A. Flores-Livas, M. Amsler, T. J. Lenosky, L. Lehtovaara, S. Botti, M. A. L. Marques and S. Goedecker, Phys. Rev. Lett., 2012, 108, 117004.
- Gao et al. (2008) G. Gao, A. R. Oganov, A. Bergara, M. Martinez-Canales, T. Cui, T. Iitaka, Y. Ma and G. Zou, Phys. Rev. Lett., 2008, 101, 107002.
- Tanaka et al. (2007) J. S. Tse, T. Yao and K. Tanaka, Phys. Rev. Lett., 2007, 98, 117004.
- Wang et al. (2012) H. Wang, J. S. Tse, K. Tanaka, T. Iitaka and Y. Ma, Proc. Natl. Acad. Sci. USA, 2012, 109, 6463–6466.
- Pepin et al. (2015) C. Pepin, P. Loubeyre, F. Occelli, and P. Dumas, Proc. Natl. Acad. Sci. USA, 2015, 112, 7673-7676.
- Zurek et al. (2009) E. Zurek, R. Hoffmann, N. W. Ashcroft, A. R. Oganov, and A. O. Lyakhov, Proc. Natl. Acad. Sci. USA, 2009, 106, 17640-17643.