Few-photon coherent nonlinear optics with a single molecule
Abstract
The pioneering experiments of linear spectroscopy were performed using flames in the 1800s, but nonlinear optical measurements had to wait until lasers became available in the twentieth century. Because the nonlinear cross section of materials is very small mukamel99 ; Boyd-book , usually macroscopic bulk samples and pulsed lasers are used. Numerous efforts have explored coherent nonlinear signal generation from individual nanoparticles Dadap:99 ; Brasselet:04 ; Horneber:15 or small atomic ensembles Wu:77 ; Gruneisen:89 ; Papademetriou:92 with millions of atoms. Experiments on a single semiconductor quantum dot have also been reported, albeit with a very small yield Xu:07 . Here, we report on coherent nonlinear spectroscopy of a single molecule under continuous-wave single-pass illumination, where efficient photon-molecule coupling in a tight focus allows switching of a laser beam by less than a handful of pump photons nearly resonant with the sharp molecular transition. Aside from their fundamental importance, our results emphasize the potential of organic molecules for applications such as quantum information processing, which require strong nonlinearities Chang:14 .
Soon after the advent of single molecule spectroscopy Moerner:89 ; Orrit:90 , several groups also reported nonlinear measurements on single molecules Mertz:95 ; Bopp:98 ; Plakhotnik:96 ; Lounis:97 . These pioneering efforts have detected the incoherent fluorescence signal and have not been concerned with optimizing the nonlinear yield. However, schemes for many of the future quantum technologies rely on optical fields to attenuate and amplify other optical signals in a coherent fashion and with high efficiency Chang:14 . In this Letter, we show that the intrinsically high efficiency of the linear photon-atom coupling Zumofen:08 also gives access to a highly efficient nonlinear interaction of several photons with a quantum emitter.
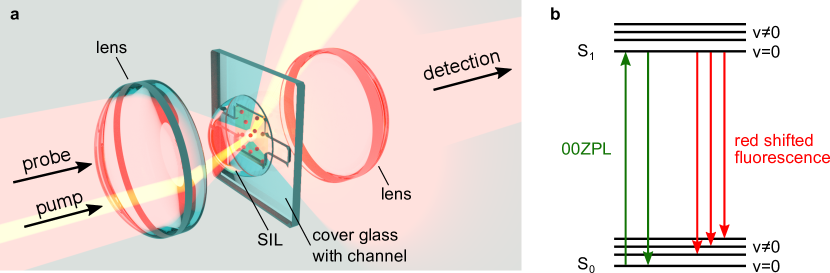
The schematics of our experiment performed in a helium bath cryostat is depicted in Fig. 1a and described further in the supplementary material. Two laser beams at frequencies and were incident on a thin naphthalene sample that contained a small concentration of Dibenzanthanthrene (DBATT) molecules. A solid immersion lens (SIL) combined with a simple aspheric lens provided a tight focus for the probe beam with FWHM nm Wrigge:08 . The probe beam left the SIL with a larger divergence so that a part of it was collimated by the second aspherical lens. The pump beam, which was offset from the lens axis (see Fig. 1a), was spatially filtered out by the collecting aspheric lens. In addition, we used cross-polarized detection to reduce the contribution of the pump to the transmitted probe beam Wrigge:08 .
Figure 1b shows the energy level scheme of DBATT. The so-called 0-0 zero-phonon line (00ZPL) with a lifetime-limited linewidth of MHz at the wavelength of nm connects the vibrational ground states of the electronic ground () and excited () states Jelezko:97 . An important advantage of our system is the large extinction cross section of about associated with its 00ZPL, where the factor 0.5 signifies that about 50% of the population from the excited state decays via red-shifted fluorescence channels.
The interaction of a two-level atom with two optical fields of amplitudes and at frequencies and has been described in several worksMollow:1972 ; haroche_theory_1972 ; Boyd:81 ; Papademetriou:92 ; Jelezko:97 . The bichromatic excitation can be expressed as an amplitude-modulated field, resulting in a time-dependent Rabi frequency modulated at frequency Papademetriou:92 . By using a Fourier ansatz for the Bloch vector, one can write
| (1) |
where denotes the off-diagonal element of the density matrix, and and are the usual components of the Bloch vector. The appearance of the harmonics of in Eq. (1) indicates a nonlinear process and exchange of energy between the two beams. In an alternative picture (see e.g. Fig. 2g and h), the pump field “dresses” the molecular levels, giving rise to new transitions at with the pump generalized Rabi frequency defined as . Here, is the Rabi frequency caused by the pump and denotes the detuning between the pump frequency and the molecular resonance Boyd-book .
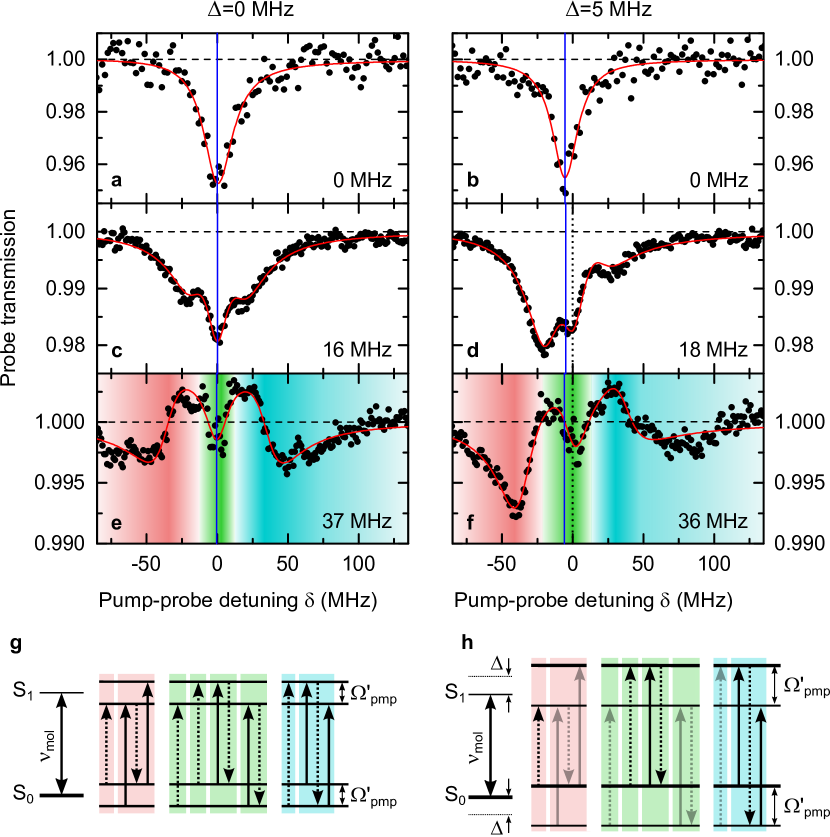
In Fig. 2 we present transmission spectra of the probe laser beam at low Rabi frequency MHz recorded under different pump conditions. The left and right columns are for pump detunings of and 5 MHz, respectively, while Fig. 2a and b show the spectra in the absence of the pump beam Wrigge:08 . The data in Fig. 2c and d illustrate that even at a low Rabi frequency well below , there is a clear redistribution of energy from the pump to the probe, leading to the development of sidebands. In Fig. 2e and f these features become clearer, and we observe a coherent amplification of the probe beam already for .
In Fig. 2g, h, we plot the dressed energy levels and the different possible pump and probe scattering processes. The color coding in Fig. 2 aims to relate the spectral features in parts e and f to different pump and probe scattering processes in g and h, respectively. The symmetric side bands in Fig. 2e are the precursors of the Mollow triplet with their zero crossings at in the strong pump limit Mollow:1972 ; Xu:07 ; Wrigge:08 . In Fig. 2f, the feature in pink indicates the AC-Stark shift of the extinction dip detuned by about , whereas the dispersive feature shaded in green represents stimulated Rayleigh scattering around , a coherent process that involves energy transfer between the pump and the probe Grynberg:93 ; Gruneisen:89 . Finally, at a three-photon process occurs (highlighted blue), where two pump photons are absorbed and one probe photon is emitted in a stimulated process. In this case, the molecule ends up in the excited state and returns to the ground state after a spontaneous decay. Indeed, the resulting fluorescence signal was used to detect this hyper-Raman phenomenon on a single DBATT molecule for a large pump detuning Lounis:97 . Our coherent measurements show that the probe is amplified by . We note that contrary to the usual usage of the dressed picture for the case of strong illumination, in our measurements is not much larger than . Consequently, the observed features are less immediately attributable to well-defined transitions among dressed states but result from the coherent addition of contributions from various channels.
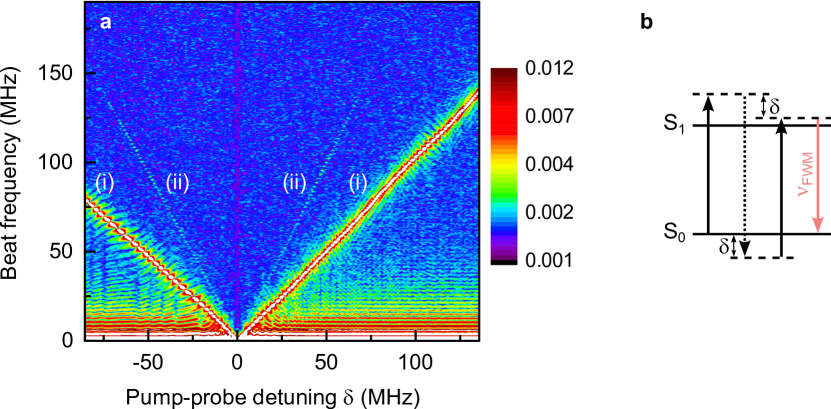
The interaction of the molecule and the pump photons can not only modify the transmitted probe beam, but it can also produce light at other frequencies Boyd-book . To investigate this effect, we used a time-correlated single photon counting system in a start-stop configuration (see supplementary material) and searched for the beating of the probe beam with any other signal. We then calculated the Fourier transform of the recorded time-dependent signal for each pump-probe detuning . Figure 3a shows the outcome for a measurement at MHz. The most dominant feature in this figure appearing at frequency is marked as (i) and stems from the interference of the probe beam with residual amount of pump light. In addition, however, the data points labeled (ii) reveal the existence of a beating signal at . Figure 3b sketches the four wave mixing process with a degenerate pump beam that leads to this new light at frequency Boyd:81 .
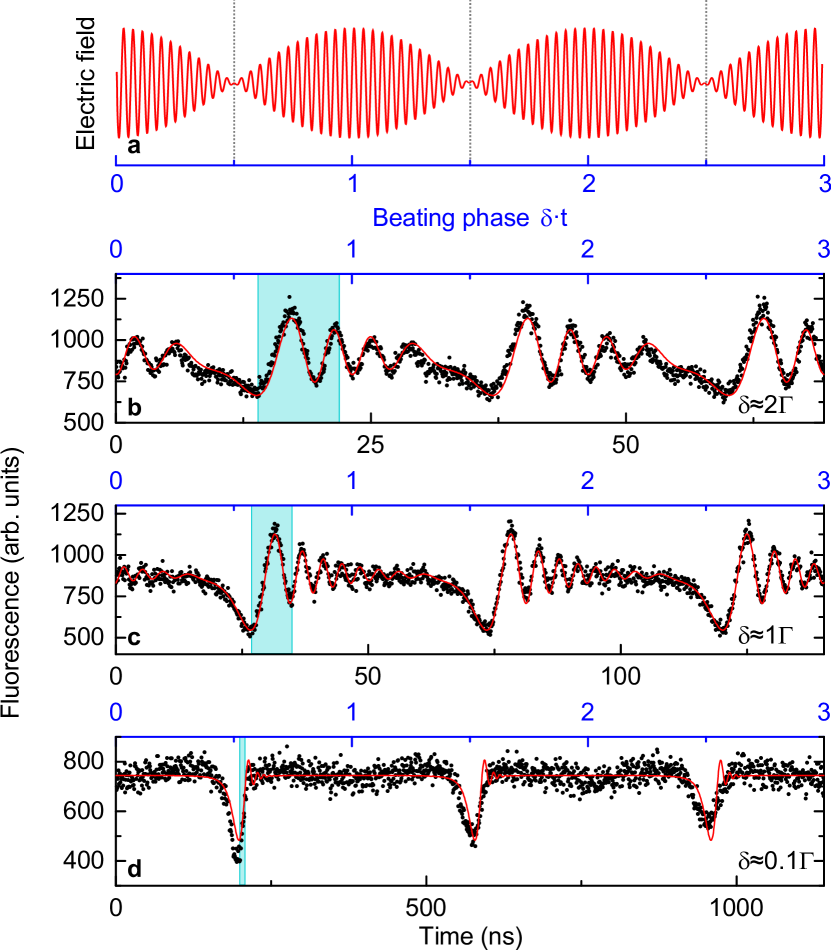
So far we have addressed the steady-state interaction between the pump and probe beams as mediated by the molecule in frequency space. To visualize the dynamic temporal behavior described in Eq. (1) directly, we used the time-dependent measurement described above to monitor the population of the excited state by recording the fluorescence signal. To achieve a strong modulation of the excited state population and a large beating visibility, we set MHz. As illustrated in Fig. 4a, we expect the fluorescence to drop when destructive interference reduces the total electric field to zero. When the field builds up again, the molecular emission undergoes Rabi oscillations, which are damped by the spontaneous emission to a steady-state level Gerhardt:09 .
Figure 4b-d displays three time-resolved fluorescence signals, where was kept at zero and was varied. In plots b and c, the Rabi frequency quickly reaches significant values within a time much shorter than the fluorescence lifetime , allowing for Rabi oscillations to be observed. In both cases, the variation of with time causes a chirp in the temporal oscillations equivalent to subharmonic Rabi resonances in the frequency domain Papademetriou:92 ; Jelezko:97 . In Fig. 4d, the excited-state population is not changed for most of the beating period because the driving field saturates the molecule within a time comparable to , reducing the visibility of Rabi oscillations.
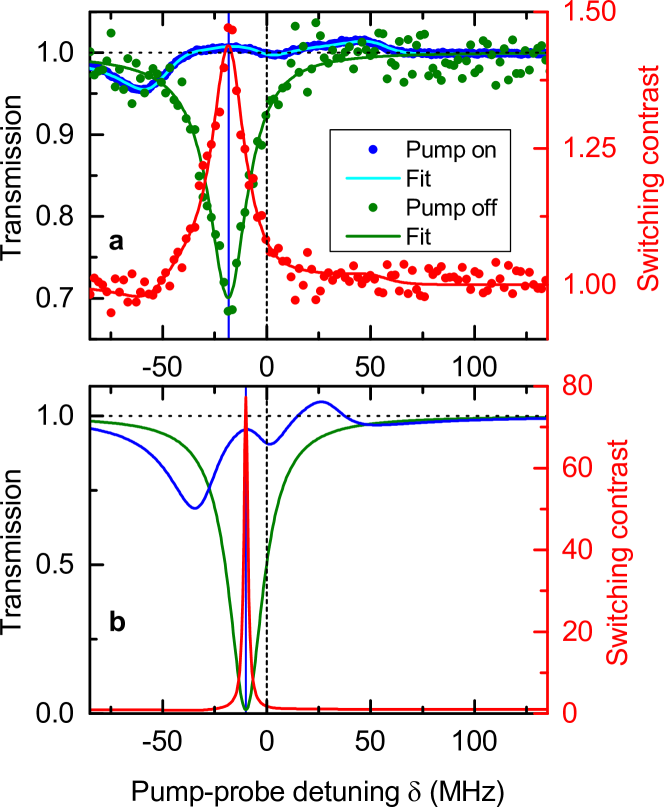
Our measurements show that the sharp Fourier-limited ZPL of a single molecule can efficiently couple photons at two or more frequencies. Such nonlinear interactions are of great interest in the context of quantum information processing, where single quanta of light and matter would be used to transport or mediate information Chang:14 . A key step in many of these endeavors is to switch an optical field with only a few, or ideally single, photons. We now show that our system readily enters this regime. Let us start with the green transmission spectrum in Fig. 5a, where a single molecule attenuates a detected light signal by 30% (see supplementary material for details). The blue spectrum in Fig. 5a shows that we can recover the transmitted signal at if we turn on a pump field with MHz and MHz. To assess the switching quality, we define as the switching contrast, where and denote the transmitted probe power with the pump on and off, respectively. As displayed by the red curve in Fig. 5a, we reach a switching contrast of about 1.8 dB. In the current experiment, the molecule required an average of 6-30 incident photons within an excited-state lifetime to scatter one photon (see supplementary material). However, theory predicts that this coupling can reach 100% in the case of perfect mode matching and unity fluorescence branching ratio Zumofen:08 ; Wrigge:08b . Figure 5b displays an example of high switching performance if we consider a probe beam with , choose and set . This regime corresponds to a saturation parameter , implying that a pump field with less than a handful of photons per can efficiently switch a beam of light (see supplementary material).
We have demonstrated the coherent nonlinear interaction of a single organic molecule with only few nearly-resonant narrow-band photons, paving the way for single photon switching without the need for high-finesse cavities Chang:14 . Our results can also be readily generalized to other quantum systems that have a high degree of coherence such as atoms in vacuum aljunid09 ; Fischer:14 , rare earth ions in crystals Utikal:14 ; Eichhammer:15 or semiconductor quantum dots Xu:07 ; Javadi:15 .
Acknowledgements
This work was financed by the Max Planck Society, an Alexander von Humboldt professorship and the European Research Council Advanced Grant (SINGLEION). We acknowledge helpful discussions with D. Martin-Cano.
References
- (1) Mukamel, S. Principles of Nonlinear Optical Spectroscopy (Oxford Univ. Press, New York, 1999).
- (2) Boyd, R. W. Nonlinear Optics (Academic Press, 2008).
- (3) Dadap, J. I., Shan, J., Eisenthal, K. B. & Heinz, T. F. Second-harmonic rayleigh scattering from a sphere of centrosymmetric material. Phys. Rev. Lett. 83, 4045–4048 (1999).
- (4) Brasselet, S. et al. In Situ diagnostics of the crystalline nature of single organic nanocrystals by nonlinear microscopy. Phys. Rev. Lett. 92, 207401 (2004).
- (5) Horneber, A. et al. Nonlinear optical imaging of single plasmonic nanoparticles with 30 nm resolution. Phys. Chem. Chem. Phys. DOI: 10.1039/c4cp05342g (2015).
- (6) Wu, F. Y., Ezekiel, S., Ducloy, M. & Mollow, B. R. Observation of amplification in a strongly driven two-level atomic system at optical frequencies. Phys. Rev. Lett. 38, 1077–1080 (1977).
- (7) Gruneisen, M. T., Donald, K. R. M., Gaeta, A. L., Boyd, R. W. & Harter, D. J. Energy transfer between laser beams propagating through an atomic vapor. Phys. Rev. A. 40, 3464 (1989).
- (8) Papademetriou, S., Chakmakjian, S. & C. R. Stroud, J. Optical subharmonic rabi resonances. J. Opt. Soc. Am. 9, 1182–1188 (1992).
- (9) Xu, X. et al. Coherent optical spectroscopy of a strongly driven quantum dot. Science 317, 929–932 (2007).
- (10) Chang, D. E., Vuletic, V. & Lukin, M. D. Quantum nonlinear optics photon by photon. Nature Photonics 8, 685–694 (2014).
- (11) Moerner, W. E. & Kador, L. Optical detection and spectroscopy of single molecules in a solid. Phys. Rev. Lett. 62, 2535–2538 (1989).
- (12) Orrit, M. & Bernard, J. Single pentacene molecules detected by fluorescence excitation in a p-terphenyl crystal. Phys. Rev. Lett. 65, 2716–2719 (1990).
- (13) Mertz, J., Xu, C. & Webb, W. W. Single-molecule detection by two-photon-excited fluorescence. Opt. Lett. 20, 2532–2534 (1995).
- (14) Bopp, M. A., Jia, Y., Haran, G., Morlino, E. A. & Hochstrassera, R. M. Single-molecule spectroscopy with 27 fs pulses: Time-resolved experiments and direct imaging of orientational distributions. Appl. Phys. Lett. 73, 7–9 (1998).
- (15) Plakhotnik, T., Walser, D., Pirotta, M., Renn, A. & Wild, U. P. Nonlinear spectroscopy on a single quantum system: Two-photon absorption of a single molecule. Science 271, 1703–1705 (1996).
- (16) Lounis, B., Jelezko, F. & Orrit, M. Single molecules driven by strong resonant fields: Hyper-raman and subharmonic resonances. Phys. Rev. Lett. 78, 3673–3676 (1997).
- (17) Zumofen, G., Mojarad, N. M., Sandoghdar, V. & Agio, M. Perfect reflection of light by an oscillating dipole. Phys. Rev. Lett. 101, 180404 (2008).
- (18) Wrigge, G., Gerhardt, I., Hwang, J., Zumofen, G. & Sandoghdar, V. Efficient coupling of photons to a single molecule and the observation of its resonance fluorescence. Nature Phys. 4, 60–66 (2008).
- (19) Jelezko, F., Lounis, B. & Orrit, M. Pump-probe spectroscopy and photophysical properties of single di-benzanthanthrene molecules in a naphthalene crystal. J. Chem. Phys. 107, 1662–1702 (1997).
- (20) Mollow, B. R. Stimulated Emission and Absorption near Resonance for Driven Systems. Physical Review A 5, 2217–2222 (1972).
- (21) Haroche, S. & Hartmann, F. Theory of Saturated-Absorption Line Shapes. Physical Review A 6, 1280–1300 (1972).
- (22) Boyd, R. W., Raymer, M. G., Narum, P. & Harter, D. J. Four-wave parametric interactions in a strongly driven two-level system. Physical Review A 24, 411–423 (1981).
- (23) Grynberg, G. & Cohen-Tannoudji, C. Central resonance of the Mollow absorption spectrum: physical origin of gain without population inversion. Opt. Comm. 96, 150–163 (1993).
- (24) Gerhardt, I. et al. Coherent state preparation and observation of Rabi oscillations in a single molecule. Phys. Rev. A. 79, 011402(R) (2009).
- (25) Wrigge, G., Hwang, J., Gerhardt, I., Zumofen, G. & Sandoghdar, V. Exploring the limits of single emitter detection in fluorescence and extinction. Opt. Express 16, 17358–17365 (2008).
- (26) Aljunid, S. A. et al. Phase shift of a weak coherent beam induced by a single atom. Phys. Rev. Lett. 103, 153601 (2009).
- (27) Fischer, M. et al. Efficient saturation of an ion in free space. Appl. Phys. B 117, 797–801 (2014).
- (28) Utikal, T. et al. Spectroscopic detection and state preparation of a single praseodymium ion in a crystal. Nat. Commun. 5, 3627 (2014).
- (29) Eichhammer, E., Utikal, T., Götzinger, S. & Sandoghdar, V. High-resolution spectroscopy of single ions on the transition. New J. Phys 17, 083018 (2015).
- (30) Javadi, A. et al. Single-photon nonlinear optics with a quantum dot in a waveguide. arXiv:1504.06895v1 (2015).
- (31) Mawatari, K. et al. Extended-Nanofluidic Systems for Chemistry and Biotechnology (Imperial College Press, London, 2012).
- (32) Faez, S., Türschmann, P., Haakh, H. R., Götzinger, S. & Sandoghdar, V. Coherent interaction of light and single molecules in a dielectric nanoguide. Phys. Rev. Lett. 113, 213601 (2014).
- (33) Pototschnig, M. et al. Controlling the phase of a light beam with a single molecule. Phys. Rev. Lett. 107, 063001 (2011).
- (34) Loudon, R. Quantum Theory of Light (Oxford University Press, 2000).
Supplementary Material
Few-photon coherent nonlinear optics with a single molecule
A. Maser, B. Gmeiner, T. Utikal, S. Götzinger, V. Sandoghdar
Sample Preparation
In order to reduce the effect of background fluorescence and to optimize the focusing ability of the solid immersion lens (SIL), we fabricated our sample in a shallow channel etched into a fused silica cover glass (220 nm deep and 500m wide) and sealed by the SIL (cubic circonia). This is done by bringing the SIL and the cover glass into optical contact, where they are drawn together by van der Waals forces mawatari . Subsequently, a small piece of naphthalene doped with DBATT was placed on the cover glass, next to the SIL and the whole sample was heated by a Peltier element until the naphthalene melted. The liquid naphthalene was drawn by capillary forces into the channel Faez:14 through an opening. The sample crystallized after cooling.
Optical Setup
The two laser beams were generated from the same dye laser with a linewidth of about 2 MHz by using two acousto-optical modulators in double-pass configuration and variable detuning of MHz to MHz. By tuning the laser frequency to the resonances of the molecules within the inhomogeneously broadened absorption band of DBATT inside a naphthalene crystal, we could address each individual molecule separately Moerner:89 ; Orrit:90 . The transmitted laser intensity as well as the backscattered red-shifted fluorescence were measured with single-photon counting modules. The pump and probe Rabi frequencies were determined by measuring the broadening of the 00ZPL in a power-dependent saturation study.
Spectral Drift Compensation
The investigated nonlinear effects are very sensitive to small frequency variations of only a few MHz. Although DBATT in naphthalene is a very stable system, small spectral drifts remain. To counter these residual slow drifts, the transmission signal was measured during a fast sweep of the probe frequency. The spectral position of the molecule was measured and the frequency of the pump beam was adjusted to maintain the desired relative detuning. This procedure was repeated several 100 times until a typical integration time of 1 s per data point was reached.
Time-resolved measurements
To register the temporal development of the signal, we measured the delay between the arrival of a transmitted photon and a reference signal. The latter was extracted from the beating of the pump and probe beams on an avalanche photodiode in front of the cryostat Pototschnig:11 . This was done by using a time-correlated single-photon counting system (HydraHarp, PicoQuant) in a start-stop configuration. In order to record more than one beating period, every fifth stop pulse was taken. The rest of the pulses were sorted out by setting an artificial dead time using a pulse delay generator (Stanford Research DG645).
Spatially filtered detection
For the switching experiment, the transmitted light was spatially selected by a single mode fiber. Thereby, the relative suppression of the pump beam can be improved to more than 200. Additionally, the single mode fiber improves the overlap of the probe light and the light scattered by the molecule in the detected signal, leading to an extinction contrast of about 30%.
Coupling efficiency
It is instructive to see what incident photon rate is required to achieve a photon scattering rate . Combining equations (1) and (3) of Ref. Zumofen:08 for steady-state monochromatic excitation, one can show that in the case of perfect mode matching,
| (2) |
where is the scattering cross section at a given finite incident power and denotes the saturation parameter in the general case of detuned excitation Loudon-book ; Zumofen:08 . Using these results and the textbook relation Loudon-book , we arrive at
| (3) |
Following this derivation, we find that an average of 2 incident photons per lifetime suffices to reach at in the ideal case of perfect coupling.
In our experiment, we determined that photons per excited-state lifetime can suffice as the average rate of the incident photons at the location of the molecule for reaching on resonance. Here, we carefully calibrated the optical losses through the cryostat windows and lenses on the way to the sample for the case of tight focusing. The spread in the measurement stems from the variation in the coupling efficiency observed for individual molecules in the sample.