Assessing the contribution of Centaur impacts to ice giant luminosities
Abstract
Voyager 2 observations revealed that Neptune’s internal luminosity is an order of magnitude higher than that of Uranus. If the two planets have similar interior structures and cooling histories, Neptune’s luminosity can only be explained by invoking some energy source beyond gravitational contraction. This paper investigates whether Centaur impacts could provide the energy necessary to produce Neptune’s luminosity. The major findings are (1) that impacts on both Uranus and Neptune are too infrequent to provide luminosities of order Neptune’s observed value, even for optimistic impact-rate estimates, and (2) that Uranus and Neptune rarely have significantly different impact-generated luminosities at any given time. Uranus and Neptune most likely have structural differences that force them to cool and contract at different rates.
keywords:
Centaurs , Neptune , Uranus , Trans-neptunian objects1 Introduction
While the ice giants may have similar interior structures (e.g. Podolak et al., 1995; Fortney and Nettelmann, 2010), their internal luminosities differ by a factor of 10. From Voyager 2 IRIS radiometer observations, Pearl and Conrath (1991) calculated an internal luminosity of for Neptune, while Pearl et al. (1990) found an internal luminosity of for Uranus. The mass difference between the two planets is not enough to explain the luminosity difference: the internal power generated per unit mass is erg g-1 s-1 for Neptune and erg g-1 s-1 for Uranus (Pearl et al., 1990; Pearl and Conrath, 1991). Multiple theories explaining the energy balance of the ice giants have been put forward, including stable stratification in Uranus’ interior (Podolak et al., 1990), early and efficient heat transport by baroclinic instability in Uranus (Holme and Ingersoll, 1994), and efficient capture of strongly interacting dark matter by Neptune (Mitra, 2004; Adler, 2009).
One energy source that has not been investigated in connection with ice giant energy balance is impact heating. Given a sufficient supply of Centaurs111While we use the word “Centaur” loosely to describe any object that may impact Uranus or Neptune, Jewitt (2009) defines Centaurs as comets whose dynamics are controlled by perihelion and/or aphelion interactions with giant planets, such that perihelia and semimajor axes are in the range AU. The Minor Planet Center website, minorplanetcenter.net/blog/asteroid-classification-i-dynamics/, defines a Centaur as an asteroid with AU and AU., impacts onto Neptune could be frequent enough to boost Neptune’s luminosity to observed values. Indeed, meteoroid impacts onto the moon generate flashes of optical light, first observed by Dunham et al. (1999). Energy deposited in ice giant atmospheres by Centaurs that penetrate the photosphere would not be released instantly to space, as in the case of lunar meteoroid flashes, but would instead be radiated away on a -year timescale (Conrath et al., 1990). This paper explores the possibility that Centaur impacts may contribute significantly to ice giant luminosities.
The investigation begins with an order-of-magnitude calculation of the typical Centaur size required to produce Neptune’s luminosity with impacts alone, treating impacts as a steady-state process. Next, we explore different impact rates and break the steady-state assumption, treating impacts as a stochastic process. Section 3 contains estimates of the total number of Centaurs, which we use as a scaling factor for published impact rates. Section 4 describes a Monte Carlo approach to computing a cumulative probability distribution of planet luminosity. Results and conclusions are presented in Section 5.
2 Impact-Induced Luminosity: Order-of-Magnitude Estimate
To get a basic idea of how much impacts contribute to ice giant luminosities, we assign a constant value to each planet’s accretion rate and assume a constant accretion-generated luminosity. The impact-generated luminosity is then
| (1) |
where is the planet mass and is the planet radius. Equating with Neptune’s present luminosity requires g yr-1. Based on simulations of diffusion from the Kuiper Belt to the inner Solar System, Levison and Duncan (1997) found that comets impact Uranus and Neptune slightly more than once per thousand years. To deliver the average quoted above, most of the impacting Centaurs with a density of g cm-3 would have to have radii over 40 km. Such a large average Centaur size can be ruled out by crater observations; for example, Stern and McKinnon (2000) calculated that the largest craters detected on Triton were created by impactors with radii of 1-5.5 km. The occultation surveys of Roques et al. (2006) and Schlichting et al. (2009, 2012) also indicate a Centaur/Kuiper Belt Object size distribution heavily biased toward sub-kilometer bodies.
In the steady-state scenario where is constant and the Levison and Duncan (1997) impact rate applies, impacts clearly cannot drive Neptune’s internal heating. Explaining Neptune’s luminosity with impacts alone requires one of two scenarios: (1) a substantially higher impact rate, which is possible if Levison and Duncan (1997) underestimated the total number of Centaurs; or (2) a recent giant impact that has driven Neptune’s luminosity to an above-equilibrium value. The rest of this paper examines scenarios (1) and (2).
3 Total number and size distribution of Centaurs
Determining the frequency and energy of impacts on ice giants requires knowing both the total number of Centaurs and their size distribution. The number of Centaur detections is too small to reconstruct a size distribution based on observations alone: only 7 Centaurs met the “secure orbit” standards used by the Deep Ecliptic Survey team to compute a debiased -magnitude distribution (Adams et al., 2014). Fortunately, Centaurs have short dynamical lifetimes, so their size distribution is a relic of their source population. The cold Kuiper Belt (e.g. Holman and Wisdom, 1993; Levison and Duncan, 1997; Fraser et al., 2010; Volk and Malhotra, 2011), the Neptune Trojans (Horner and Lykawka, 2010), the inner Oort cloud (Emel’yanenko et al., 2005; Kaib et al., 2009; Brasser et al., 2012; Volk and Malhotra, 2013; de la Fuente Marcos and de la Fuente Marcos, 2014; Fouchard et al., 2014), the Plutinos (Morbidelli, 1997; di Sisto et al., 2010), and the scattered disk (di Sisto and Brunini, 2007; Volk and Malhotra, 2008, 2013) could all be Centaur sources. However, no empirical information exists on the size distribution of objects in the Oort cloud, and Fraser et al. (2010) find that the scattered disk is not populous enough to explain the observed influx of comets into the inner Solar System. Doressoundiram et al. (2005) also show that Centaur colors are not consistent with an origin in the scattered disk. Moreover, Schlichting et al. (2013) show that the cold Kuiper Belt and scattered disk objects have size distributions that follow the same functional form, only with different maximum sizes. Calculations presented here are based on the cold Kuiper Belt size spectrum of Schlichting et al. (2013), which is a close match to the size spectrum of Saturnian satellite impactors inferred from the cratering record (Minton et al., 2012). Schlichting et al. (2013) used a combination of theoretical coagulation models, occultation surveys, and observations of large KBOs to constrain the size spectrum.
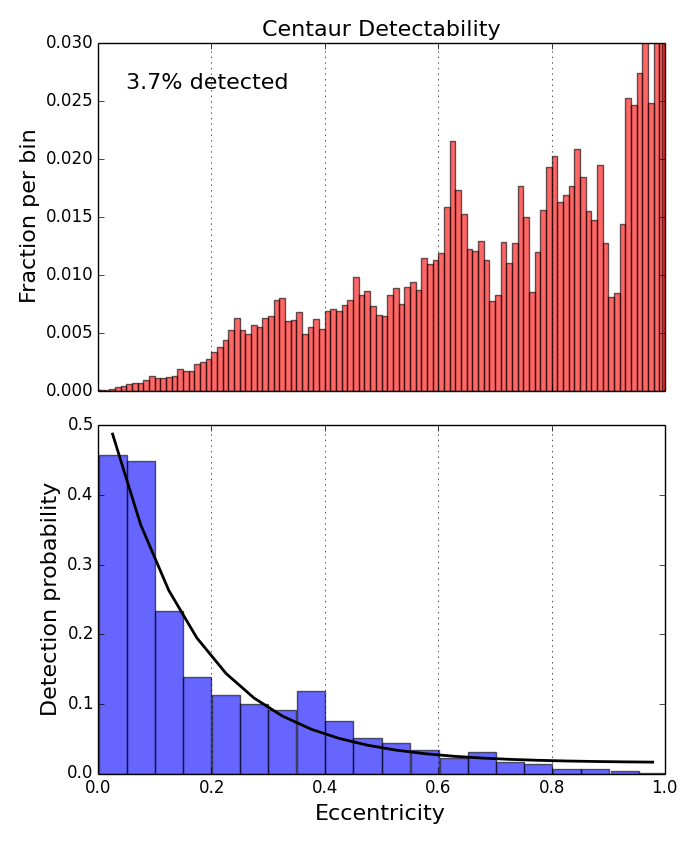
The first estimate of the total number of Centaurs comes from the simulations of Tiscareno and Malhotra (2003), who investigated the dynamical evolution of the observed Centaurs over 100 Myr. The top panel of Figure 1 shows their computed time-averaged eccentricity distribution. Tiscareno and Malhotra (2003) also estimated the detection fraction of Centaurs as a function of eccentricity, which is reproduced in the bottom panel of Figure 1. The detection fraction estimate holds for Centaurs with km. Multiplying the eccentricity distribution with a fit to the detectability function (black line in the bottom panel of Figure 1) and summing over the 0-1 eccentricity range yields an estimate of % for the fraction of Centaurs with km that have been detected. The total number of large Centaurs with km is then is , where is the number of Centaurs that had been discovered when the Tiscareno and Malhotra (2003) calculations were performed.
The next step in determining the total number of Centaurs is to find the radius of the largest Centaur. For km,
| (2) |
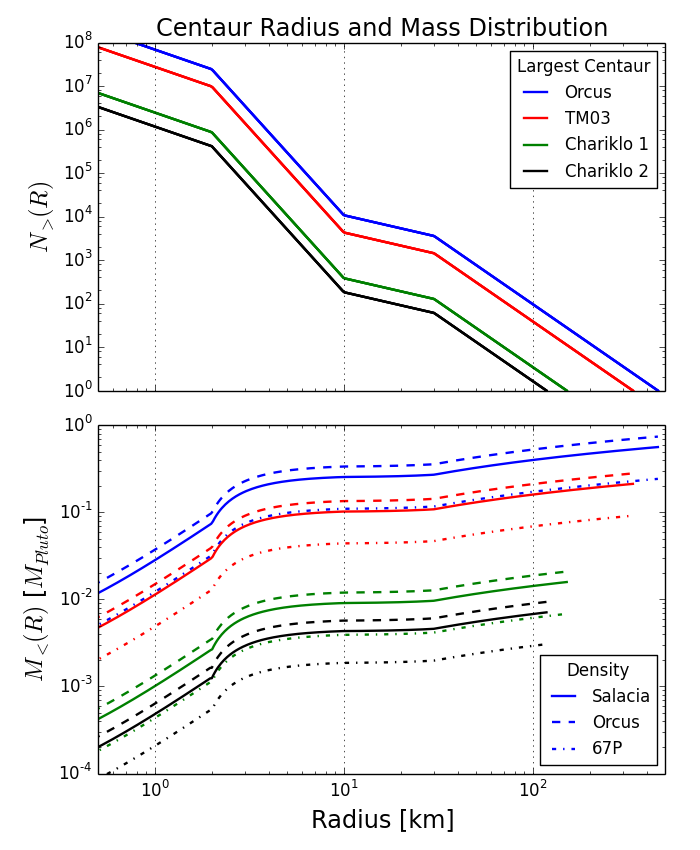
In Equation 2, , , and (e.g. Trujillo et al., 2001; Fraser et al., 2008; Minton et al., 2012; Schlichting et al., 2013), so that km. An estimate of the total number of Centaurs then follows, given an analytical form for the differential size distribution . Schlichting et al. (2013) find a KBO size distribution of the form , where for 10 km km; for 2 km km; and for 0.1 km km. We set a lower limit of km to the size of Centaurs considered here, which is justified because the mass contained in the smallest bodies is negligible unless . The Schlichting et al. (2013) conclusion that for the smallest bodies is supported by sky brightness measurements, which rule out for km (Kenyon and Windhorst, 2001; Ichikawa and Fukugita, 2011). The size distribution computed based on the Tiscareno and Malhotra (2003) maximum Centaur-size estimate contains comets with km, and is shown in the top panel of Figure 2 (red curve). The distribution agrees well with the results of Sheppard et al. (2000), who predict about 100 Centaurs with radii above 50 km. However, the number of small bodies is an order of magnitude lower than the di Sisto and Brunini (2007) estimate of Centaurs with radii above 1 km.
Other estimates of the total number of Centaurs come from radius measurements of Centaurs and KBOs. The most conservative estimates come from assuming that Chariklo, the largest observed Centaur, is in fact the largest Centaur in the Solar System. (It is highly likely that the largest Centaur has not been observed, given that the detection probability is extremely low for even moderately eccentric orbits.) Chariklo radius estimates range between 118 km and 151 km (Fornasier et al., 2013; Stansberry et al., 2008; Groussin et al., 2004; Altenhoff et al., 2001; Jewitt and Kalas, 1998). The green and black curves in Figure 2 show size distributions where the largest body takes on the maximum and minimum observational estimates of Chariklo’s radius, respectively. Finally, Figure 2 shows a size distribution that is optimistic about the size of the largest body, with km, the maximum measured radius of the Plutino Orcus (blue curve). Larger TNOs such as Quaoar and Pluto have higher densities that suggest differentiation, whereas Orcus’ bulk density is more consistent with the undifferentiated comet population. It is plausible, then, that Orcus represents a transition object between Kuiper Belt comets/Centaurs and true dwarf planets. Note that this “optimistic” size distribution predicts only a factor of 2.5 more Centaurs than using the Tiscareno and Malhotra (2003) results, but brings the number of small bodies closer to the predictions of di Sisto and Brunini (2007).
The bottom panel of Figure 2 shows the cumulative mass function , the mass of Centaurs with radii less than a given value. For each size distribution from the top of Figure 2, three possible Centaur densities are considered. The highest density is the maximum inferred value for Orcus (1.53 g cm-3, Stansberry et al. (2012), dashed lines). The solid lines show mass functions with the bulk density of KBO Salacia, which has the lowest bulk density measurement of any TNO (1.16 g cm-3, Stansberry et al. (2012)). Finally, the smallest Centaurs may have very low densities comparable to comet 67P/Churyumov-Gerasimenko, g cm-3 (Sierks et al., 2015). The dash-dot lines show cumulative mass distributions with g cm-3. All Centaurs are given the same density regardless of size, though in reality the larger bodies probably have higher densities.
It is important to note that the abundance of large Centaurs may be out of equilibrium with the source KBO population, due both to stochastic effects and to the possibility that the diffusion rate from the Kuiper Belt to the inner Solar System is a function of size. Since impacts by 100-km objects onto ice giants occur less than once per 10 Myr, these objects may be safely neglected from any discussion of the steady-state ice-giant luminosities. However, the size distributions presented here are anchored by the large objects, so disequilibrium from the source KBO population could lead to large uncertainties the number of small bodies.
4 Impact-generated luminosity
Given the Centaur size distribution, impact speed, and radiative time constants of the ice giant atmospheres, we can compute the impact-generated luminosity of ice giants as a function of time. The impact speed is , where is the planet’s escape speed, is the Centaur’s eccentricity, and is the Centaur’s orbital speed. For Centaurs crossing the orbits of Uranus and Neptune, , and impacts occur roughly at escape speed. Each impact converts Centaur kinetic energy into heat, which the ice giant atmospheres radiate away over a characteristic timescale.
Radiative time constants used here are 95 years for Uranus and 105 years for Neptune. Conrath et al. (1990) computed radiative time constants based on profiles of , the infrared energy deposited per unit volume and time at each level of the planet atmosphere. is usually negative, indicating cooling, and is dominated by methane emission. To compute , Conrath et al. (1990) first constructed model atmospheres by imposing the latitudnally dependent temperature measured by Voyager data as a boundary condition, then perturbed the temperature profile at each atmosphere depth to compute the change in . Changes in the composition of ice giant atmospheres, such as aerosol darkening predicted to correspond with the 11-year solar cycle (Baines and Smith, 1990; Hammel and Lockwood, 2007), could alter the radiative time constants; how much is not clear as the Conrath et al. (1990) calculation has not been updated based on new data. Since radiative time constants become independent of atmospheric pressure for bar (the boundary between the radiative and convective layers according to Conrath et al. (1990) and de Pater and Lissauer (2010)) and even the smallest impactors considered ( km) would penetrate deeper than the 1-bar level, impact-generated luminosities are assumed not to be sensitive to the penetration depth of the impactors.
We use a Monte Carlo simulation of successive ice giant impacts from Centaurs with radii chosen randomly from the size distributions plotted in Figure 2. The Monte Carlo simulation reveals how often Centaur impacts can bring Neptune’s internal luminosity (excluding reprocessed energy from the Sun) up to the observed value of erg s-1. A sequence of impacts meets the criteria for a Poisson process: gravitational interactions between Centaurs are negligible, so the probability of an impact is independent of previous impact history, and the likelihood of an impact in a given amount of time increases with the length of the time interval under consideration. Impacts are therefore modeled as a Poisson process with rate parameter , where is the mean time interval between impacts, and the distribution of time intervals between impacts is exponential. Only impactors larger than 1 km are included in the simulation. Based on their models of diffusion from the Kuiper Belt, Levison and Duncan (1997) calculated that there should be ecliptic comets (Centaurs, Halley-type comets and Jupiter-family comets combined222The size distributions based on measurements of Chariklo and Orcus do not encode any dynamical information about the impactors, so that they may represent Jupiter-family comets or Halley-type comets as well as Centaurs. No correction needs to be made to the total number of objects to be consistent with the Levison and Duncan (1997) impact rates. Of the estimates of the total number of Uranus and Neptune impactors in Section 3, only the one based on the Tiscareno and Malhotra (2003) detectability simulation is restricted to true Centaurs with AU. However, since Levison and Duncan (1997) find that true Centaurs are far more common than shorter-period comets, we also make no correction to the total number of impactors from this size distribution.), assuming a maximum radius of km and a minimum radius in the range 0.5-2 km. Levison and Duncan (1997) find impact rates of yr-1 for Neptune and yr-1 for Uranus. Rate parameters are scaled to the Levison and Duncan (1997) results according to the number of Centaurs with radii over 1 km, such that
| (3) |
The simulation is built on the simplifying assumption that impact energy is deposited instantaneously and then redistributed throughout the atmosphere immediately. Subsequent to an impact, Newtonian cooling governs impact-generated planet luminosity as a function of time. Luminosity is then determined by both the impact energy and the atmospheric radiative time constant:
| (4) |
| (5) |
In Equation 4, is the time of the most recent impact and represents any residual luminosity left over from previous impacts. We assume 100% conversion of impactor kinetic energy to heat, though in reality some energy will be lost to sublimation and ablation of the impactor. As the goal of this experiment is to assess how much of the ice giant energy balance can be explained by impacts, no other source of internal energy (such as gravitational contraction or radioactive decay) is included.
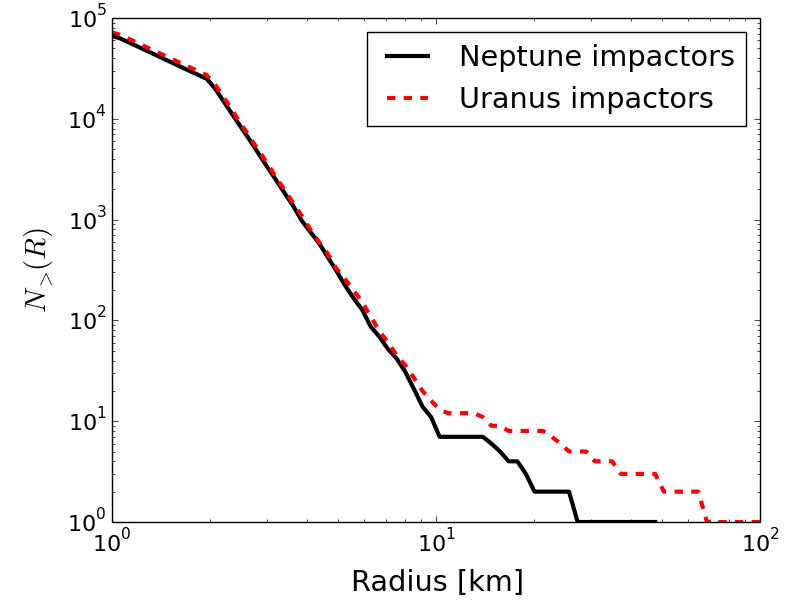
The simulation proceeds as follows: (1) a random set of impact time intervals is drawn from an exponential distribution. (2) For each impact, a Centaur radius is randomly selected from the size distribution under consideration. Figure 3 shows two realizations of randomly chosen impactor size distributions. (3) The time evolution of the planet’s luminosity is calculated. At each impact time, the luminosity is added to any remaining luminosity from previous impacts and a Newtonian cooling process starts (Equations 4 and 5). (4) The cumulative probability distribution of planet luminosity is calculated.
5 Results and Conclusions
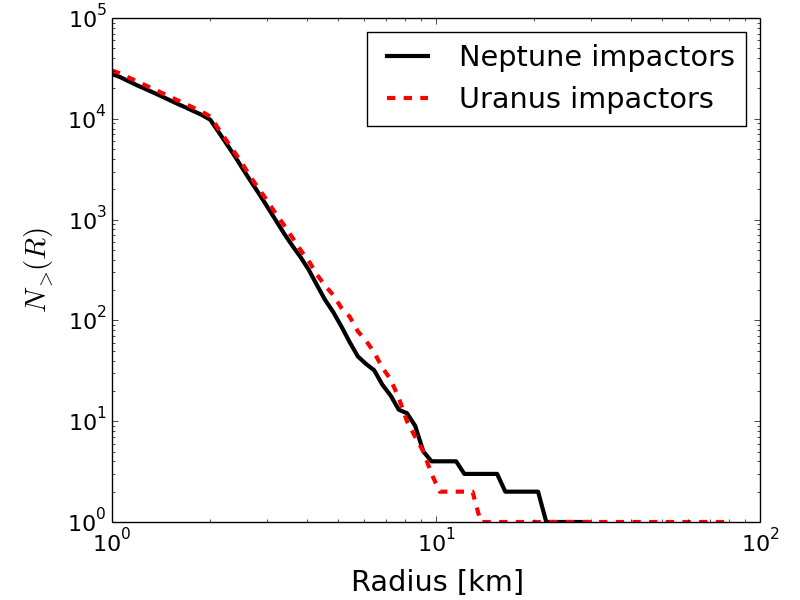
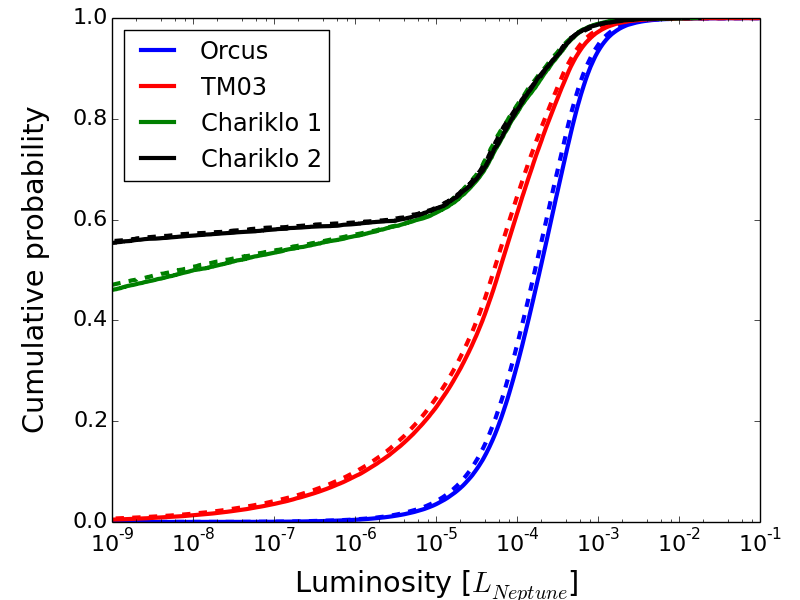
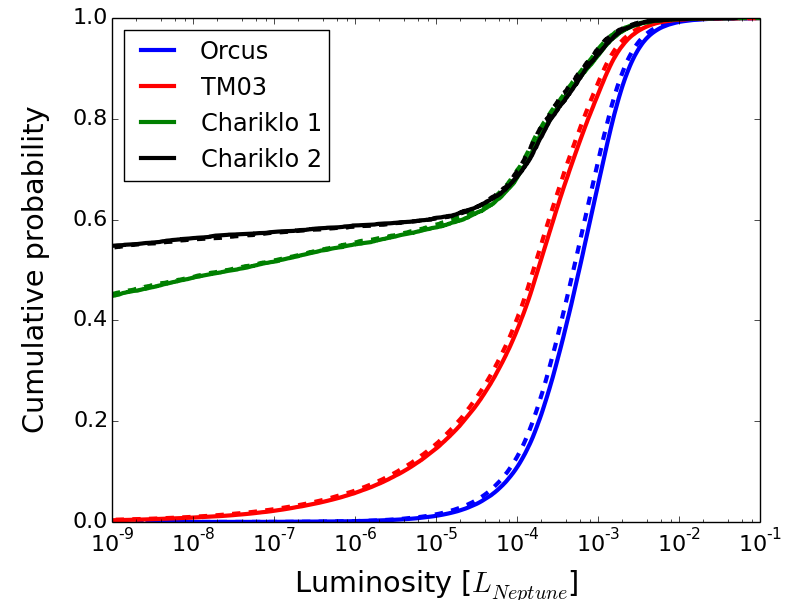
Figure 4 shows probability distributions of planet luminosity from a 10-Myr simulation, for all four size distributions shown in Figure 2, and for Centaur densities of 0.5 g cm-3 (left) and 1.5 g cm-3 (right). For only the two most populous size distributions did the simulations record impacts that produce luminosities of order Neptune’s observed value, erg s-1—and then extremely infrequently. If the total Centaur mass is of order Pluto’s mass (see blue dashed curve in the bottom panel of Figure 2), an impact that yields a luminosity of erg s-1 occurs every 0.6 Myr. The largest luminosity generated by a single impact that the simulations produced was erg s-1, from a 13-km impactor with g cm-3.
Based on current understanding of Centaur dynamics and radii, it is clear that impacts cannot explain the ice giants’ energy balance. Not only are energetic impacts far too rare to provide Neptune’s luminosity, but Levison and Duncan (1997) show that Uranus and Neptune experience impacts at almost the same rate. Furthermore, their atmospheres radiate away energy on similar timescales. Only after a rare giant impact onto one planet are their impact-induced luminosities are substantially different. Instead, Uranus and Neptune’s different energy balances are probably the result of a structural dichotomy between the two planets (Nettelmann et al., 2013), though shape and rotation data are not yet precise enough to elucidate exactly how the ice giant interior structures differ.
There are two circumstances in which it may be worth revisiting the connection between impacts and ice giant energy balance. First, a re-calculation is warranted if observers discover a significant population of Neptune-crossing comets that have not been well represented in dynamical simulations (i.e. high-inclination objects). With a factor of 100 increase in Centaur abundance over and above the most populous Centaur size distribution considered here, impacts would contribute substantially to Neptune’s steady-state energy balance. Furthermore, high-inclination Centaurs from the Oort cloud have longer dynamical lifetimes than those with low inclinations (e.g. di Sisto and Brunini, 2007; Brasser et al., 2012; Volk and Malhotra, 2013), which may indicate that this work underestimates the steady-state Centaur abundance. The number of low-inclination Centaurs sourced from the scattered disk and cold Kuiper Belt is not likely to increase much as both populations have been well characterized (e.g. Adams et al., 2014). The highest estimate of the number of Centaurs (di Sisto and Brunini, 2007) is a mere factor of four higher than the maximum number considered here, and Horner et al. (2004) predict only Centaurs larger than 1 km. We do not consider a substantial upward revision to the total number of Centaurs likely. Second, if models of the KBO size distribution are revised to include a significantly higher proportion of -km objects, median impact energies would produce luminosities of order Neptune’s current value. However, for impact rates calculated by Levison and Duncan (1997), changing the KBO size spectrum to favor 10-km objects could push Uranus’ luminosity well over observed values. In any case, planetesimal-growth simulations, occultation statistics, and crater size measurements are converging in a way that make substantial revisions to the 10-km KBO abundance unlikely (e.g. Schlichting et al., 2009; Kenyon and Bromley, 2012; Minton et al., 2012; Schlichting et al., 2013).
One possibly fruitful avenue for future research is investigating the connection between impacts and seismic disturbances or storms. A comet of radius 1 km would deposit erg of energy locally over a timescale of seconds, based on the Shoemaker-Levy Jupiter impact models of Harrington and Deming (2001). Marley (1994) demonstrated that impacts of energies ergs and higher would produce detectable temperature fluctuations exceeding 1 K on Jupiter due to the excitation of seismic waves. However, impacts by 1 km objects are still too infrequent—once per hundred years, even for generous estimates of the number of Centaurs such as those of di Sisto and Brunini (2007)—to make ice-giant seismology a reasonable observing campaign. Detection of seismic activity would be serendipitous. It is faintly possible, however, that sedimentation of particles ablated from an impactor could be observable. In Keck NIRC2 adaptive optics observations of Uranus on 12 August 2004, Sromosky and Fry (2005) noted three low surface-brightness features that appeared and disappeared on timescales of 0.3-1.5 hours. Based on observations by Carlson et al. (1988), Sromosky and Fry (2005) suggest that sedimentation of 300-m particles caused by vertical motion of a cloud could produce the rapid disappearance of the faint features. While vertical shear acting on clouds is the most likely reason for small particles to descend in Uranus’ atmosphere, we suggest cautiously considering impactors a source of settling particles. Extending the Schlichting et al. (2013) size distribution down to its lowest radius limit of 0.01 km yields a total of Centaurs, even assuming the smallest maximum Centaur size considered here (118 km; minimum measured Chariklo radius). At minimum, tens of 0.01 km-size objects would impact each ice giant per year. Given that Uranus has recently shown record-breaking storms (de Pater et al., 2015), despite its equinox passage possibly decreasing convective activity, it is worth considering whether impacts may trigger local storms.
Funding for this project was provided by NSF grant AST-1055910. The idea that impacts may be responsible for Neptune’s high luminosity grew out of a discussion in the upper-division Solar System Astronomy course at University of Texas in Fall 2011. I thank Andy Liao for asking questions that led me to perform this calculation. I am grateful to Renu Malhotra and Matthew Tiscareno for sharing data from their 2003 paper, and for comments that improved this work. Thoughtful reviews from two anonymous referees improved the manuscript. Advanced undergraduate and graduate students at both Univeristy of Texas and University of Delaware have performed an order-of-magnitude version of this calculation on their homework assignments. Please contact me if you would like to use the assignment in your course.
References
- Adams et al. (2014) Adams, E. R., Gulbis, A. A. S., Elliot, J. L., Benecchi, S. D., Buie, M. W., Trilling, D. E., and Wasserman, L. H. 2014. De-Biased Populations of Kuiper Belt Objects from the Deep Ecliptic Survey. The Astronomical Journal 148, 3.
- Adler (2009) Adler, S. L. 2009. Planet-bound dark matter and the internal heat of Uranus, Neptune, and hot-Jupiter exoplanets. Physics Letters B 671, 203-206.
- Altenhoff et al. (2001) Altenhoff, W. J., Menten, K. M., and Bertoldi, F. 2001. Size determination of the Centaur Chariklo from millimeter-wavelength bolometer observations. Astronomy and Astrophysics 366, L9-L12.
- Baines and Smith (1990) Baines, K. H., and Smith, H. W. 1990. The atmospheric structure and dynamical properties of Neptune derived from ground-based and IUE spectrophotometry. Icarus 85, 65-108.
- Brasser et al. (2012) Brasser, R., Schwamb, M. E., Lykawka, P. S., and Gomes, R. S. 2012. An Oort cloud origin for the high-inclination, high-perihelion Centaurs. Monthly Notices of the Royal Astronomical Society 420, 3396-3402.
- Carlson et al. (1988) Carlson, B. E., Rossow, W. B., and Orton, G. S. 1988. Cloud microphysics of the giant planets. Journal of Atmospheric Science 45, 2066-2081.
- Conrath et al. (1990) Conrath, B. J., Gierasch, P. J., and Leroy, S. S. 1990. Temperature and circulation in the stratosphere of the outer planets. Icarus 83, 255-281.
- de la Fuente Marcos and de la Fuente Marcos (2014) de la Fuente Marcos, C., and de la Fuente Marcos, R. 2014. Large retrograde Centaurs: visitors from the Oort cloud? Astrophysics and Space Science 352, 409-419.
- de Pater and Lissauer (2010) de Pater, I., and Lissauer, J. J. 2010. Planetary Sciences, 2nd Edition. Cambridge University Press, Cambridge. p. 80 of 607.
- de Pater et al. (2015) de Pater, I., Sromovsky, L. A., Fry, P. M., Hammel, H. B., Baranec, C., and Sayanagi, K. M. 2015. Record-breaking storm activity on Uranus in 2014. Icarus 252, 121-128.
- di Sisto and Brunini (2007) di Sisto, R., and Brunini, A. 2007. The origin and distribution of the Centaur population. Icarus 190, 224-235.
- di Sisto et al. (2010) di Sisto, R. P., Brunini, A., and de Elía, G. C. 2010. Dynamical evolution of escaped plutinos, another source of Centaurs. Astronomy and Astrophysics 519, 112.
- Doressoundiram et al. (2005) Doressoundiram, A., Peixinho, N., Doucet, C., Mousis, O., Barucci, M. A., Petit, J. M., and Veillet, C. 2005. The Meudon Multicolor Syrvey (2MS) of Centaurs and trans-neptunian objects: extended dataset and status on the correlations reported. Icarus 174, 90-104.
- Dunham et al. (1999) Dunham, D. W., Cudnik, B., Hendrix, S., and Asher, D. J. 1999. Lunar Leonid Meteors; DD Cir. International Astronomical Union Circular 7320, 1.
- Emel’yanenko et al. (2005) Emel’yanenko, V. V., Asher, D. J., and Bailey, M. E. 2005. Centaurs from the Oort cloud and the origin of Jupiter-family comets. Monthly Notices of the Royal Astronomical Society 361, 1345-1351.
- Fornasier et al. (2013) Fornasier, S., and 19 colleagues 2013. TNOs are Cool: A survey of the trans-Neptunian region. VIII. Combined Herschel PACS and SPIRE observations of nine bright targets at 70-500 m. Astronomy and Astrophysics 555, A15.
- Fortney and Nettelmann (2010) Fortney, J. J., and Nettelmann, N. 2010. The Interior Structure, Composition, and Evolution of Giant Planets. Space Science Reviews 152, 423-447.
- Fouchard et al. (2014) Fouchard, M., Rickman, H., Froeschlé, Ch., and Valsecchi, G. B. 2014. Planetary perturbations for Oort cloud comets: III. Evolution of the cloud and production of centaurs and Halley type comets. Icarus 231, 99-109.
- Fraser et al. (2010) Fraser, W. C., Brown, M. E., and Schwamb, M. E. 2010. The luminosity function of the hot and cold Kuiper belt populations. Icarus 201, 944-955.
- Fraser et al. (2008) Fraser, W. C., Kavelaars, J. J., Holman, M. J., Pritchet, C. J., Gladman, B. J., Grav, T., Jones, R. L., MacWilliams, J., and Petit, J.-M. 2008. The Kuiper belt luminosity function from m=21 to 26. Icarus 195, 827-843.
- Groussin et al. (2004) Groussin, O., Lamy, P., and Jorda, L. 2004. Properties of the nuclei of Centaurs Chiron and Chariklo. Astronomy and Astrophysics 413, 1163-1175.
- Hammel and Lockwood (2007) Hammel, H. B., and Lockwood, G. W. Long-term atmospheric variability on Uranus and Neptune. 2007. Icarus 186, 291-301.
- Harrington and Deming (2001) Harrington, J., and Deming, D. 2001. Models of the Shoemaker-Levy 9 Impacts. I. Ballistic Monte Carlo Plume. The Astrophysical Journal 561, 455-467.
- Holman and Wisdom (1993) Holman, M. J., and Wisdom, J. 1993. Dynamical stability in the outer solar system and the delivery of short period comets. The Astronomical Journal 105, 1987-1999.
- Holme and Ingersoll (1994) Holme, R., and Ingersoll, A. P. 1994. Baroclinic instability in the interiors of the giant planets: A cooling history of Uranus?. Icarus 110, 340-356.
- Horner et al. (2004) Horner, J., Evans, N. W., and Bailey, M. E. 2004. Simulations of the Population of Centaurs - I. The bulk statistics. Monthly Notices of the Royal Astronomical Society 354, 798.
- Horner and Lykawka (2010) Horner, J., and Lykawka, P. S. 2010. The Neptune Trojans - a new source for the Centaurs?. Monthly Notices of the Royal Astronomical Society 402, 13-20.
- Ichikawa and Fukugita (2011) Ichikawa, K., and Fukugita, M. 2011. Microwave Emission from the Edgeworth-Kuiper Belt and the Asteroid Belt Constrained from the Wilkinson Microwave Anisotropy Probe. Astrophysical Journal 736, 122.
- Jewitt (2009) Jewitt, D. 2009. The Active Centaurs. The Astronomical Journal 137, 4296-4312.
- Jewitt and Kalas (1998) Jewitt, D., and Kalas, P. 1998. Thermal Observations of Centaur 1997 CU26. The Astrophysical Journal 499, L103-L106.
- Levison and Duncan (1997) Levison, H. F., and Duncan, M. J. 1997. From the Kuiper Belt to Jupiter-Family Comets: The Spatial Distribution of Ecliptic Comets. Icarus 127, 13-32.
- Kaib et al. (2009) Kaib, N. A., Becker, A. C., Jones, R. L., Puckett, A. W., Bizyaev, D., Dilday, B., Frieman, J. A., Oravetz, D. J., Pan, K., Quinn, T., Schneider, D. P., and Watters, S. 2009. 2006 SQ372: A Likely Long-Period Comet from the Inner Oort Could. The Astrophysical Journal 695, 268-275.
- Kenyon and Bromley (2012) Kenyon, S. J., and Bromley, B. C. 2012. Coagulation Calculations of Icy Planet Formation at 15-150 AU: A Correlation between the Maximum Radius and the Slope of the Size Distribution for Trans-Neptunian Objects. The Astronomical Journal 143, 63.
- Kenyon and Windhorst (2001) Kenyon, S. J., and Windhorst, R. A. 2001. The Kuiper Belt and Olbers’ Paradox. The Astrophysical Journal 547, L69-L73.
- Marley (1994) Marley, M. S. 1994. Seismological consequences of the collision of Shoemaker-Levy/9 with Jupiter. The Astrophysical Journal, Part 2 - Letters, 427, L63-L66.
- Minton et al. (2012) Minton, D. A., Richardson, J. E., Thomas, P., Kirchoff, M., & Schwamb, M. E. 2012. Combining Saturnian Craters and Kuiper Belt Observations to Build an Outer Solar System Impactor Size-Frequency Distribution. LPI Contributions 1667, 6348.
- Mitra (2004) Mitra, S. 2004. Uranus’s anomalously low excess heat constrains strongly interacting dark matter. Physical Review D 70, 103517.
- Morbidelli (1997) Morbidelli, A. 1997. Chaotic Diffusion and the Origin of Comets from the 2/3 Resonance in the Kuiper Belt. Icarus 127, 1-12.
- Nettelmann et al. (2013) Nettelmann, N., Helled, R., Fortney, J. J., and Redmer, R. 2013. New indication for a dichotomy in the interior structure of Uranus and Neptune from the application of modified shape and rotation data. Planetary and Space Science 77, 143-151.
- Pearl et al. (1990) Pearl, J. C., Conrath, B. J., Hanel, and R. A., Pirraglia, J. A. 1990. The albedo, effective temperature, and energy balance of Uranus, as determined from Voyager IRIS data. Icarus 84, 12-28.
- Pearl and Conrath (1991) Pearl, J. C., and Conrath, B. J. 1991. The albedo, effective temperature, and energy balance of Neptune, as determined from Voyager data. Journal of Geophysical Research 96, 18921.
- Podolak et al. (1990) Podolak, M., Reynolds, R. T., and Young, R. 1990. POST Voyager comparisons of the interiors of Uranus and Neptune. Geophysical Research Letters 17, 1737-1740.
- Podolak et al. (1995) Podolak, M., Weizman, A., and Marley, M. 1995. Comparative models of Uranus and Neptune. Planetary and Space Science 43, 1517-1522.
- Roques et al. (2006) Roques, F., Doressoundiram, A., Dhillon, V., Marsh, T., Bickerton, S., Kavelaars, J. J., Moncuquet, M., Auvergne, M., Belskaya, I., Chevreton, M., Colas, F., Fernandez, A., Fitzsimmons, A., Lecacheux, J., Mousis, O., Pau, S., Peixinho, N., and Tozzi, G. P. 2006. Exploration of the Kuiper Belt by High-Precision Photometric Stellar Occultations: First Results. The Astronomical Journal 132, 819-822.
- Schlichting et al. (2013) Schlichting, H. E., Fuentes, C. I., Trilling, D. E. 2013. Initial Planetesimal Sizes and the Size Distribution of Small Kuiper Belt Objects. The Astronomical Journal 146, 36.
- Schlichting et al. (2012) Schlichting, H. E., Ofek, E. O., Sari, R., Nelan, E. P., Gal-Yam, A., Wenz, M., Muirhead, P., Javanfar, N., and Livio, M. 2012. Measuring the Abundance of Sub-kilometer-sized Kuiper Belt Objects Using Stellar Occultations. The Astrophysical Journal 761, 150.
- Schlichting et al. (2009) Schlichting, H. E., Ofek, E. O., Wenz, M., Sari, R., Gal-Yam, A., Livio, M., Nelan, E., and Zucker, S. 2009. A single sub-kilometre Kuiper belt object from a stellar occultation in archival data. Nature 462, 895-897.
- Sheppard et al. (2000) Sheppard, S. S., Jewitt, D. C., Trujillo, C. A., Brown, M. J. I., and Ashley, M. C. B. 2000. A Wide-Field CCD Survey for Centaurs and Kuiper Belt Objects. The Astronomical Journal 120, 2687-2694.
- Sierks et al. (2015) Sierks, H., and 65 colleagues 2015. On the nucleus structure and activity of comet 67P/Churyumov-Gerasimenko. Science 347, aaa1044.
- Sromosky and Fry (2005) Sromovsky, L. A., and Fry, P. M. 2005. Dynamics of cloud features on Uranys. Icarus 179, 459-484.
- Stansberry et al. (2008) Stansberry, J., Grundy, W., Brown, M., Cruikshank, D., Spencer, J., Trilling, D., Margot, J.-L. 2008. Physical Properties of Kuiper Belt and Centaur Objects: Constraints from the Spitzer Space Telescope. The Solar System Beyond Neptune 161-179.
- Stansberry et al. (2012) Stansberry, J. A., Grundy, W. M., Mueller, M., Benecchi, S. D., Rieke, G. H., Noll, K. S., Buie, M. W., Levison, H. F., Porter, S. B., Roe, H. G. 2012. Physical properties of trans-neptunian binaries (120347) Salacia-Actaea and (42355) Typhon-Echidna. Icarus 219, 676-688.
- Stern and McKinnon (2000) Stern, S. A., and McKinnon, W. B. 2000. Triton’s Surface Age and Impactor Population Revisited in Light of Kuiper Belt Fluxes: Evidence for Small Kuiper Belt Objects and Recent Geological Activity. The Astronomical Journal 119, 925-952.
- Tiscareno and Malhotra (2003) Tiscareno, M. S., and Malhotra, R. 2003. The Dynamics of Known Centaurs. The Astronomical Journal 126, 3122-3131.
- Trujillo et al. (2001) Trujillo, C. A., Luu, J. X., Bosh, A. S., and Elliot, J. L. 2001. Large Bodies in the Kuiper Belt. The Astronomical Journal 122, 2740-2748.
- Volk and Malhotra (2008) Volk, K., and Malhotra, R. 2008. The Scattered Disk as the Source of the Jupiter Family Comets. The Astrophysical Journal 687, 714-725.
- Volk and Malhotra (2011) Volk, K., and Malhotra, R. 2011. Inclination Mixing in the Classical Kuiper Belt. The Astrophysical Journal 736, 11
- Volk and Malhotra (2013) Volk, K., and Malhotra, R. 2013. Do Centaurs preserve their source inclinations? Icarus 224, 66-73.
|
|