An integrated full-field model of concurrent plastic deformation and microstructure evolution: Application to 3D simulation of dynamic recrystallization in polycrystalline copper
Abstract
Many time-dependent deformation processes at elevated temperatures produce significant concurrent microstructure changes that can alter the mechanical properties in a profound manner. Such microstructure evolution is usually absent in mesoscale deformation models and simulations. Here we present an integrated full-field modeling scheme that couples the mechanical response with the underlying microstructure evolution. As a first demonstration, we integrate a fast Fourier transform-based elasto-viscoplastic (FFT-EVP) model with a phase-field (PF) recrystallization model, and carry out three-dimensional simulations of dynamic recrystallization (DRX) in polycrystalline copper. A physics-based coupling between FFT-EVP and PF is achieved by (1) adopting a dislocation-based constitutive model in FFT-EVP, which allows the predicted dislocation density distribution to be converted to a stored energy distribution and passed to PF, and (2) implementing a stochastic nucleation model for DRX. Calibrated with the experimental DRX stress-strain curves, the integrated model is able to deliver full-field mechanical and microstructural information, from which quantitative description and analysis of DRX can be achieved. It is suggested that the initiation of DRX occurs significantly earlier than previous predictions, due to heterogeneous deformation. DRX grains are revealed to form at both grain boundaries and junctions (e.g., quadruple junctions) and tend to grow in a wedge-like fashion to maintain a triple line (not necessarily in equilibrium) with old grains. The resulting stress redistribution due to strain compatibility is found to have a profound influence on the subsequent dislocation evolution and softening.
keywords:
Dynamic recrystallization , Thermomechanical processes , Crystal plasticity , Phase-field , Microstructures1 Introduction
Many thermomechanical processes and high temperature applications of materials involve a coupled evolution of micromechanical fields, local defect populations, and microstructural constituents including precipitates and grains. For instance, during hot deformation crystalline materials with low stacking fault energy (SFE) often undergo dynamic recrystallization (DRX) wherein new grains will continue to nucleate and grow (Sakai and Jonas, 1984; Sakai et al., 2014), altering the population, mutual elastic interaction, and subsequent motion of dislocations in a distinctive manner. These microstructural changes are difficult to capture through purely mechanical laws (Roters et al., 2010).The continued adoption of new computational strategies for accelerated development of materials, such as Integrated Computational Materials Engineering (Allison et al., 2006; Allison, 2011), for materials processed through thermomechanical routes or materials exposed to thermal and mechanical extremes in-service requires modeling and simulation tools that integrate both the mechanical and microstructural aspects in a fully coupled manner.
Within the broader solid mechanics and materials science communities, mature computational approaches exist to study, separately, the deformation of heterogenous materials and microstructure evolution, respectively. On one hand, the field of crystal plasticity has benefited substantially from multi-scale experiments and simulations linking mechanical properties of materials with the evolution of contained structural defects such as dislocations under an applied stress or displacement field. At the mesoscale, this understanding has been implemented into physics-based constitutive theories (Arsenlis and Parks, 2002; Arsenlis et al., 2004; Cheong and Busso, 2004; Ma et al., 2006; Gao and Huang, 2003; Beyerlein and Tomé, 2008) and implemented into homogenized deformation models such as self-consistent schemes (Lebensohn and Tomé, 1993; Niezgoda et al., 2014) or full-field simulations such as finite element based crystal plasticity (FE-CP) (Kalidindi et al., 1992; Beaudoin et al., 1995; Roters et al., 2010) or fast Fourier transform (FFT) based crystal plasticity (FFT-CP) models (Lebensohn, 2001; Lebensohn et al., 2012; Eisenlohr et al., 2013). On the other hand, the microstructural evolution in crystals, such as grain growth (Chen and Yang, 1994; Kazaryan et al., 2002; Moelans et al., 2008b), static recrystallization (Moelans et al., 2013), rafting in superalloy (Zhou et al., 2010; Gaubert et al., 2010) and many other phenomena (Chen, 2002; Wang and Li, 2010) have been well studied using phase-field (PF) simulations. The non-boundary tracking field description of microstructures and the incorporation of thermodynamics-based free energy formulation have made PF a very powerful and robust tool in simulating and predicting the microstructural evolution often in a quantitative manner (Chen, 2002; Boettinger et al., 2002; Shen et al., 2004; Moelans et al., 2008b; Steinbach, 2009; Wang and Li, 2010).
In recent years, efforts have been made towards developing CP models that can incorporate microstructure features to study plastic deformation of materials such as austenitic steels, TRIP steels, brass, TWIP steels and shape memory alloys that deform not only by dislocation slips but also by displacive phase transformation mechanisms. For instance, frameworks (Thamburaja and Anand, 2001; Turteltaub and Suiker, 2005; Lan et al., 2005; Manchiraju and Anderson, 2010) have been developed to incorporate martensitic transformations as the flow rules. Mechanical twinning, which is of great importance to the plasticity of many BCC metals as well as FCC metals with low SFE, has also been incorporated into FE-CP models (Kalidindi, 1998; Staroselsky and Anand, 1998; Salem et al., 2005; Steinmetz et al., 2013; Zhang et al., 2008). Atomistically-informed dislocation-based models have also been developed recently and applied to single crystal (Cereceda et al., 2015). In addition, microstructure modeling techniques such as cellular automata and phase-field have also been applied to the study of mechanics-induced microstructural evolution such as static recrystallization (Hesselbarth and Göbel, 1991; Raabe, 2002; Takaki et al., 2007; Moelans et al., 2013; Chen et al., 2015). These models, while providing certain connection between microstructure and crystal plasticity, still lack a dynamic coupling between the two. On the other hand, phase-field models incorporating either continuum plasticity (Gaubert et al., 2010) or dislocation density fields (Zhou et al., 2010) have also been developed to study rafting in Ni-based superalloys. These models are mainly rooted in the PF framework and significant advances are required in order to generalize the approach and incorporate a wider range of existing constitutive theories.
Regarding the simulation of DRX, there have been models aiming to couple deformation with microstructure evolution. In the models of Ding and Guo (2001) and Takaki et al. (2008), the growth of DRX grains was modeled by cellular automaton and PF, respectively, and the phenomenological Kocks-Mecking model (Mecking and Kocks, 1981) was used to model the evolution of average dislocation density, which in return influenced the mechanics through its square root relationship with the flow stress. Recently Takaki et al. (2014) extended their previous work by replacing the flow stress model with an elastic-plastic FE, intending to establish a full coupling model. However, the mechanical behavior was still considered in a macroscopic level in the sense that an average dislocation density was assumed for each grain which evolved according to the Kocks-Mecking model (Mecking and Kocks, 1981). DRX, on the other hand, occurs at a sub-grain level where grain boundary (GB) bulging (Ponge and Gottstein, 1998; Wusatowska-Sarnek et al., 2002; Miura et al., 2007) or other possible mechanisms (Rollett et al., 2004) might operate to initiate the nucleation of new grains. This length scale separation implies that a “homogenized” coupling scheme (Takaki et al., 2014) may limit its application in exploring the underlying physics. Another recent DRX model by Popova et al. (2014), which couples FE-CP with a probabilistic cellular automata, successfully captured both texture and mechanical feature during the DRX in magnesium. However, only geometrically necessary dislocations (GND) were considered with the effect of statistically stored dislocations (SSD) being ignored, and the two-dimensional (2D) simulation ignores important microstructural features (e.g., the triple/quadruple grain junctions (Miura et al., 2005)) when analyzing the dynamics of DRX grains.
In this paper, we present an integrated modeling scheme of fully coupling the mechanical response with the underlying microstructure evolution by employing FFT-CP and PF. This novel scheme is then implemented in simulating dynamic recrystallization in polycrystalline copper in three-dimensions (3D). Quantitative agreement between simulations and experiments is achieved, and the revealed underlying DRX structures and evolution, to the best of our knowledge, are investigated in full-field 3D dynamics for the first time.
2 Model
To better describe the integrated model that fully couples the mechanics and microstructure, we need to consider both the abstract model structure (AMS), which describes how the PF and mechanical simulation environments interact, and a concrete model structure (CMS), which describes the specific constitutive and kinetic models and what microstructural field variables are passed, as shown in Fig. 1.
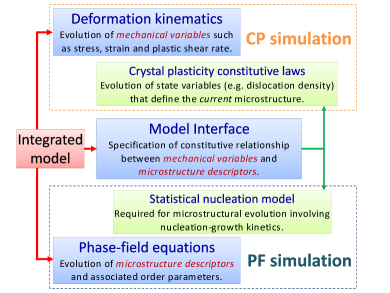
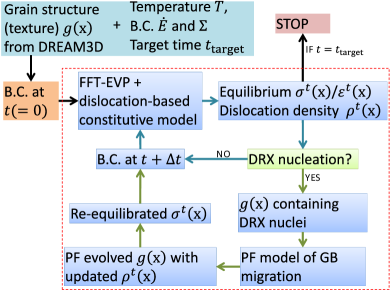
At the AMS level, the framework consists of three parts: (1) deformation kinematics, (2) description of model interfaces, including a constitutive theory that describes the evolution of a set of microstructural state variables (i.e., microscopic variables such as dislocation density and arrangement, cell size, grain size, precipitate size, and spacing, and so forth (Frost and Ashby, 1982)) and their interplay with PF order parameters, and (3) PF governing equations describing the kinetics of microstructure evolution as a function of order parameters. Additional nucleation models are needed when considering issues involving the formation of new grains (e.g., DRX and twinning) or new phases (e.g., precipitation) during the deformation. Implementation of the AMS requires the identification of microstructure descriptors as well as CP frameworks, constitutive laws, PF equations, and/or nucleation models, which all together describe the CMS. As our first demonstration, we have chosen modeling DRX in polycrystalline copper, of which the corresponding CMS with the basic simulation flowchart is shown in Fig. 1. Based on the experiment of Ghauri et al. (1990), it was estimated that during a compression test up to strain under applied strain rate of /s (conditions to be used in the following simulation), grain growth in a polycrystal copper with an average grain size m can be safely ignored (relative change ). As a result, for efficiency and simplicity, in Fig. 1 PF is entered only when DRX is initiated. In the following, the details of each model element will be presented.
2.1 Deformation kinematics
We employ the fast Fourier transform-based elasto-viscoplastic (FFT-EVP) formulation in the framework of infinitesimal-strain, developed by Lebensohn et al. (2012). Using an Euler implicit time discretization and anisotropic elasticity, the stress in material point at is given by
| (1) | ||||
where is the elastic stiffness tensor, is the stress field, and the total strain field , in the small-strain assumption, is simply the sum of elastic and plastic part, i.e. . The plastic strain at is obtained by the first-order approximation . The usage of the plastic strain rate at (a function of stress at ) in calculating the plastic shear increment from to suggests an implicit Euler method, which requires the stress field to be solved iteratively, here by a spectral approach which utilizes FFT algorithms to simplify convolution integrals involving Green’s function. The plastic strain rate is formulated as
| (2) |
where and are, respectively, the shear rate and the Schmid tensor associated with slip system at point , and is the number of active slip systems under consideration. The exact form of is determined by the adopted constitutive laws (Sec. 2.2), which are usually nonlinear equations and will be solved with an augmented Lagrangian scheme adapted from Michel et al. (2000).
The small-strain assumption in Eq. (1) implies that (i) the local neighborhood of a material point does not change drastically due to pure deformation, and (ii) the deformation increment is small with each numerical time step. These can be considered as legitimate in modeling DRX, of which the onset is still at a relatively small strain level (usually ) (Sakai and Jonas, 1984; Rollett et al., 2004). In addition, once DRX is initiated, the mechanical behavior starts to be dominated by the migration of DRX grain boundaries modeled by PF, and the error due to small-strain assumption is further relieved. Additionally, the visco-plastic FFT (no elasticity) formulation with small-strain updates has been demonstrated by Prakash and Lebensohn (2009) to give comparable results to crystal-plasticity finite elements in the simulation of rolling in f.c.c. metals up to 60% thickness reduction and drawing in b.c.c. metals up to 40% equivalent strain. In that work it was found that even at large deformations the FFT scheme captured the location and distribution of stress fluctuations accurately, but that the specific numerical value of the stress localization varies with respect to the CP-FEM. These previous results provide confidence that stress/strain localizations predicted by the FFT-EVP will at least be statistically representative of those occurring in the material and sufficient to accurately predict evolution of the dislocation densities required for modeling nucleation and growth of new grains during DRX, even if the specific spatial values differ. Recently Eisenlohr et al. (2013) demonstrated a FFT formulation which incorporates finite deformation kinematics, which utilizes the 1st Piola-Kirchhoff stress and the deformation gradient as work conjugate stress/deformation measures. Coupling of the finite strain FFT with phase field equations poses several additional computational difficulties, namely that the Fourier grid for the finite strain FFT is naturally formulated in the material or reference configuration while the spectral grid for the phase field is defined in the spatial or deformed state. Adoption of finite strain kinematics would require either a) explicitly mapping the material configuration to the spatial and interpolating onto a regular Fourier grid for the PF and performing the inverse mapping/interpolation every simulation time/strain increment or b) reformulating the phase field in the undeformed configuration. Another possible correction would be to adopt the approach of Cuitino and Ortiz (1992) which uses a logarithmic mapping to extend the small-strain updates to the finite deformation regime. However that approach requires the approximation that the plastic spin is identically zero and the principal directions of the plastic strain are aligned with the principal stresses. For these reasons we adopt the general FFT-EVP framework of Lebensohn et al. (2012), keeping in mind the inherent limitations. Integration of the finite strain FFT and phase field is ongoing and will be reported in future work. Specific discussion on the limitations and implications of the small strain kinematics with respect to the specific DRX case study investigated can be found in Sec. 3.
2.2 Crystal plasticity constitutive laws
The model interface should provide a methodology link between the deformation mechanics and microstructure evolution such that the integrated modeling is physically self-consistent. This requires the shear rate in Eq. (2) to be formulated based on a set of state variables that can also be used as microstructure descriptors. Following the spirit of Orowan equation where is the mobile dislocation density, the magnitude of Burgers vector, and the average dislocation velocity, Ma and Roters (2004) and Ma et al. (2006) derived a dislocation-based flow rule for single-phase FCC metals:
| (3) |
where is the plastic shear rate for slip system (among the total active slip systems) and the pre-exponential factor , with the attempt frequency being in the order of Debye frequency, the Boltzmann constant, the temperature, the shear modulus, and fitting parameters. is the effective activation energy barrier for gliding through distributed obstacles consisting of parallel and forest dislocations with a density of and , respectively, which result in a passing stress and a cutting stress , respectively. According to Ma and Roters (2004) and Ma et al. (2006), and are given as
| (4) | ||||
| (5) | ||||
where , and are, respectively, slip plane normal, slip direction and sense vector of slip system . , and are related to the total GND density of slip system and will be defined in a moment. The SSD density evolves as (Ma et al., 2006)
| (6) |
which accounts for (1) the lock forming between mobile and forest dislocations, (2) the dipole formation between mobile dislocations, (3) the athermal annihilation of two parallel dislocations with anti-parallel Burgers vectors within a critical distance and (4) thermal annihilation by edge dislocation climb. Here is the critical distance for dipole formation (with being the Poisson’s ratio), the activation energy for self-diffusion, the von Mises equivalent stress and the von Mises equivalent shear rate.
The GND density , based on the crystallographic relationship, is decomposed into , and (Ma et al., 2006). The rate of these effective GND densities satisfy the conservation law and can be determined from the deformation gradient following the pioneering works done by Nye (1953), Dai and Parks (1997) and Dai (1997), which in small strain approximation reduce to (Dai, 1997)
| (7) | ||||
The gradient terms in Eq. (7) involve the physical size of simulation grid , which is in principle determined by the physical length scale of the representative volume element (RVE). It is worth noting that when numerically evaluating these gradient terms, forward or backward difference will be used for grid points at grain boundaries and central difference for points in the grain interior. Calculation of GND through Eq. (7), however, ignore the effect that the grain boundary or interface, where the deformation gradient usually build, can also act as a source/sink to emit/absorb GND (Sun et al., 2000). Recently, the saturation of GND has been studied both experimentally (Kysar et al., 2010) and theoretically (Öztop et al., 2013). In the current model, for simplicity, we account for this effect via a phenomenological treatment. In calculating the gradient in Eq. (7), instead of , we use an “effective” length , updated as
| (8) |
where is the current average von Mises equivalent strain and () is a fitting parameter that will give rise to a saturated GND density as the deformation becomes sufficiently large.
2.3 Statistical model of dynamic recrystallization nucleation
During dynamic recrystallization (DRX), new grains are initiated according to complicated and still unclear atomistic mechanisms and usually correlated with stress/strain fields at continuum level (Galiyev et al., 2001; Chauve et al., 2015). Together with considering the experimentally revealed grain boundary (GB) bulging mechanism (Ponge and Gottstein, 1998; Wusatowska-Sarnek et al., 2002; Miura et al., 2007) , we make the following core assumptions: (a) DRX grains nucleate when some material at a GB undergoes certain atomistic transformations driven by thermal fluctuation and local stress to form a stable nucleus; (b) the time scale of this transformation and the formation of a stable nucleus is at atomic level and hence instantaneous as compared to the applied deformation, and (c) the length scale of this transformation is small relative to the FFT-CP computational grid. These consideration are similar to those made by Niezgoda et al. (2014) in modeling of the stochastic twin nucleation, and is illustrated in Fig. 2 to show schematically the length scale separation.
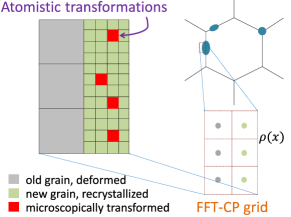
To formulate a statistical model, we assume that the underlying atomistic transformations, occurring on a finely divided subgrid at each FFT-CP gridpoint (Simmons et al., 2000), are independent and identically distributed and that a stable nucleus will form when some minimum number of subgrid points, denoted , transform. Further we introduce a quantity at material point (FFT-CP grid) to measure the nucleation propensity or the driving force for transformations, which, as to be discussed below, will be a function of the local dislocation content that can be computed from FFT-CP. Given that other factors that control nucleation are not explicitly included, we expect that the number of transformation events, , is not strictly deterministic, but rather is a random discrete variable. Our goal is then to link and by formulating a continuous distribution, which gives the probability of a stable nucleus forming at a specific GB (FFT-CP) gridpoint given , and then design a stochastic process accordingly for model implementation. We leave the detail of derivation in A and present directly the probability of nucleating a DRX grain at a FFT-CP gridpoint (assuming )
| (9) |
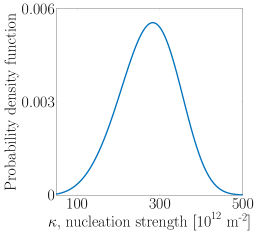
where with and being material constants and the apparent activation energy associated with DRX (Ding and Guo, 2001; Rollett et al., 2004). To further appreciate Eq. (9), we introduce the concept of a stochastic nucleation strength , which is a local material property and depends on the subgrain/atomic structure. Nucleation will occur when the local propensity exceeds the local strength, i.e., . The probability density of can be determined as
| (10) |
The inherent stochastic nature we introduce here is the key distinctive feature compared with previous works (Ding and Guo, 2001; Takaki et al., 2008, 2014).
The construction of the above statistical nucleation model is independent of the exact expression of . Here we simply use the total dislocation density
| (11) |
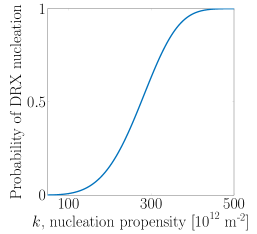
as the relevant measure of the DRX nucleation propensity. As the mechanistic details of nucleation are clarified, new forms of can be incorporated without changing the overall framework. Figs. 2 and 2 plot, respectively, the probability of DRX nucleation as a function of dislocation density (Eq. (9)) and the probability density function (p.d.f.) of the nucleation strength (Eq. (10)), for the simulation to be described in Sec. 3. The parameters and were fit to the macroscale stress/strain curve shown in Fig. 4. Note that as nucleation only occurs at a small fraction of potential sites, must be significantly larger than the average dislocation density. This relationship is explored in more detail in Sec. 4.1.
To implement the above statistical nucleation model, we initially draw a nucleation strength for each FFT gridpoint from the Weibull distribution (i.e., Eq. (9)) specified by two parameters and . Here is considered as a static quantity during the deformation until a DRX nucleation event occurs at , which will assign a new value to due to the change of atomistic environment. The reassignment of again requires the specification of and . Recall that , where is the activation energy characterizing the DRX nucleation mechanism and essentially related to the nature of the GB. Considering that the initial GB obtained via long term heat treatment is apparently quite different from the boundary of recrystallized new grains, we use a different nucleation parameter to draw the new . Currently it is treated as with being simply a fitting parameter. In theory, can be completely determined once the knowledge of , and are available. Since experiments have confirmed that in copper the activation energy of migration of low angle GBs is much higher than that of high angle ones (Viswanathan and Bauer, 1973), it is expected that could deviate significantly from 1 in reality. Nevertheless a further estimation of requires knowing the absolute value of nucleation rate (related to the coefficient ) and is thus difficult to measure.
2.4 Phase-field model
The subsequent evolution of the grain structure containing nucleated DRX grains can be treated by extending the PF grain growth model of Chen and Yang (1994) by including the reduction of the stored strain energy, which competes with the reduction of the curvature to determine the migration of the recrystallized grain boundaries, as an additional driving force. Moelans et al. (2013) have modified the PF grain growth model of Chen and Yang (1994) by using two order parameters and to describe one grain, with the deformed state corresponding to and the recrystallized state to . We further extend the original 2D PF formulation of Moelans et al. (2013) to 3D. The total free energy consists of GB energy and the stored strain energy, namely,
| (12) |
where the local GB energy density (the dependence of is omitted in what follows) is formulated as (Chen and Yang, 1994; Moelans et al., 2013)
| (13) | ||||
where is the total number of grain orientations under consideration, the GB energy that can be taken from experiments, and the width of the diffuse interface zone associated with GB in PF method. The particular relationships between the coefficients were developed for the quantitative simulation of grain growth by Moelans et al. (2008b). The stored energy density is formulated as
| (14) |
where the predicted stored energy by FFT-EVP is approximated (Hull and Bacon, 2001) as where is a dimensionless constant of 0-1 and the total dislocation density is given in Eq. (11). The evolution equations of the order parameters simply follow the Allen-Cahn equation (Allen and Cahn, 1979), which in our case takes the following form (Moelans et al., 2008b):
| (15) | ||||
where is the GB mobility. To model the property of a polycrystal, the RVE should contain sufficient number of grains, which leads to a large number of coupled partial differential equations in Eq. (15). To solve this numerical difficulty, we adopt the sparse data structure technique proposed by Gruber et al. (2006) and Vedantam and Patnaik (2006) to reduce the effective considered for each PF node. It also needs to be pointed out that the PF simulation does not need to reside on the same computational grid as in FFT-EVP, owing to the different length scales of the corresponding physical processes as indicated in Fig. 2. A finer PF grid can be used by interpolating the FFT-EVP grid to increase spatial resolution when simulating the DRX grain growth. To do this, linear interpolation is used to obtain the finely sampled smooth fields such as stress, strain, and dislocation densities; the refined grain structure with a refinement ratio PF grid/FFT-EVP grid = 2:1 is obtained by assigning the orientation value of the nearest original grid point to the new interpolating points, which is only involved in grain boundaries and junctions. The grain ID after PF simulation is determined by .
If a time increment is used to solve the deformation kinematics (Eq. (1)), the corresponding number of PF steps for microstructure relaxation that can take place before further mechanical loading is simply given as where is the real time of one PF simulation step, and means the largest integer not greater than . The determination of follows Moelans et al. (2008a) where parameters were taken so that 6[m3/J], , and 0.0375[m3/J] where is the discrete grid spacing in PF simulation. Such numerical specification has been shown to yield a relative (numerical) error smaller than in terms of simulating GB motion (Moelans et al., 2008a). It is then given that , which as expected is controlled by GB energy and mobility.
In principle, GB energy and mobility should depend on the misorientation and inclination, which leads to grain growth in anisotropic systems and has been considered by previous PF models (Kazaryan et al., 2000; Ma et al., 2004; Suwa et al., 2007; Moelans et al., 2008a). Nevertheless, the experiment (Wusatowska-Sarnek et al., 2002) to be simulated and compared shows mostly equiaxed DRX grains, unlike what was predicted by PF grain growth in anisotropic system (Kazaryan et al., 2002); the essentially random texture found in the experiment (Wusatowska-Sarnek et al., 2002) also frees us from considering the high anisotropy in GB mobility that manifests only in highly textured polycrystals (Ma et al., 2004; Suwa et al., 2007). As a result, we assume isotropic grain growth in the current model and take GB energy and mobility as constant.
2.5 Microstructure update and stress redistribution
Once new grains are formed, state variables, e.g., dislocation density and grain orientation, should be updated based on DRX mechanisms. The general picture that DRX grains are “dislocation-free” or with a much lower dislocation content describes the dislocation activities occurring at subgrain-level (Sakai and Ohashi, 1990) and consequently cannot be directly applied to the dislocation density in the current model, which is defined at a level much larger than the subgrains (Fig. 2). The “dislocation-free” nucleus at subgrain-level will co-deform with its surrounding grains and will rapidly accumulate a significant dislocation density before it grows to the length scale of a typical continuum plasticity simulation. This has been confirmed experimentally by transmission electron microscopy (TEM) observations (Sakai and Ohashi, 1990; Sakai, 1995). Based on this length scale separation, we update the the GND density of material points in new grains as
| (16) |
where is a fitting parameter, while keeping the SSD density unchanged. Physically this means that we ignore the very initiation stage of the growth of subgrain nuclei, which has actually been implied in our nucleation model (Fig. 2). Numerically this ensures the numerical stability in an otherwise high-contrast “mixture” of soft and hard grains. The change of GND accounts for (i) the underlying change of subgrains orientation, i.e., dense dislocation cell walls transforming into high angle boundaries, and (ii) the elimination of pre-existing GBs. On the other hand, the SSD is expect to be more or less the same at the coarse-grained FFT grid.
Regarding the crystal orientation, experiments have shown formation of moderate-angle subboundaries or twins associated with DRX grains. However, there is no overall correlation between DRX and the resulted grain orientations and the texture remains unchanged (or slightly more randomized) during DRX (Wusatowska-Sarnek et al., 2002). For our first demonstrative case-study, we simply assume that the crystal orientation of the new DRX grain points will inherit the current local values, leaving the influence of DRX grain orientation to future studies.
Once the nucleation step is complete and the state variables updated, subsequent PF relaxation will drive the new grains to consume the surrounding old grains. The change in local dislocation density and lattice orientation (the part due to deformation) are accompanied by changes in the elastic strain fields and the stress needs to be re-calculated before the next deformation increment. If a new equilibrium stress state is not calculated, the resolved stresses in the now softer recrystallized grains will be significantly higher than the slip resistances, resulting in non-physical high strain rates. In order to maintain the compatibility, the previous strainrate field (before DRX) is prescribed and new equilibrium stress field due to the change of microstructure is calculated before further mechanical loading is applied in FFT-EVP. The deformation continues following the dynamically coupled scheme described above until the prescribed target strain increment is achieved, as shown in Fig. 1. It needs to be pointed out that once DRX has been initiated, the nucleation event occurs so frequently that the PF microstructure relaxation occurs virtually every FFT-EVP step. As a result, during the implementation of Fig. 1, DRX grains that have been grown for a few steps are still allowed to grow as long as there is a driving force due to the store energy difference.
3 Results
Simulation was carried out after the experimental study of Wusatowska-Sarnek et al. (2002). The material was 99.99% pure Cu (4N) with equiaxed grains exhibiting an average size of m. The texture was nearly random with weak ( times) random and components. The representative volume element (RVE) in our simulation was produced by DREAM3D (Groeber and Jackson, 2014).
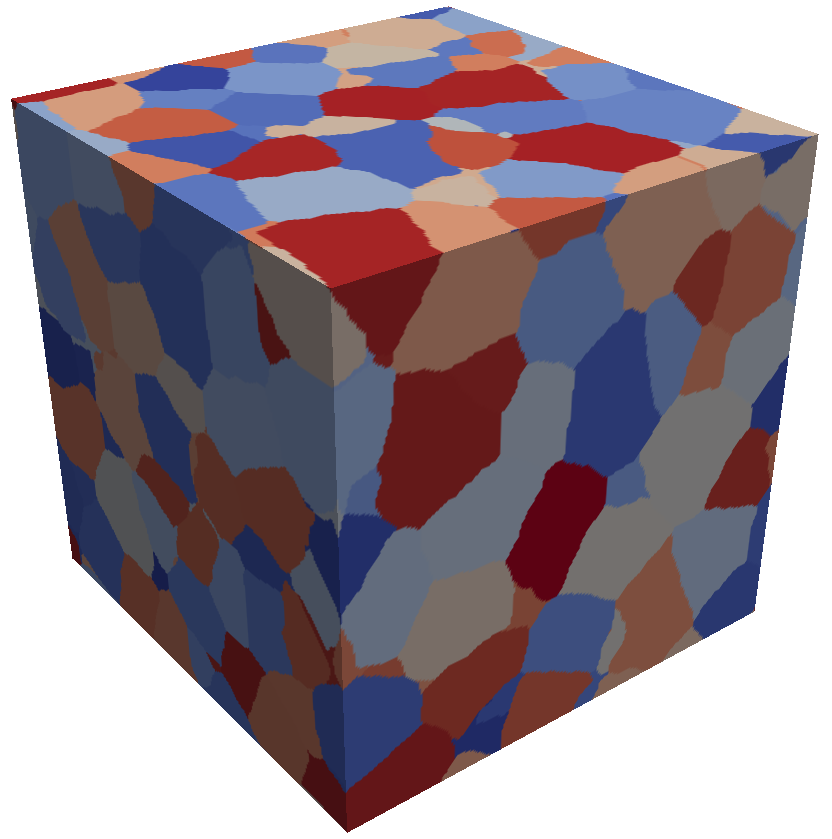
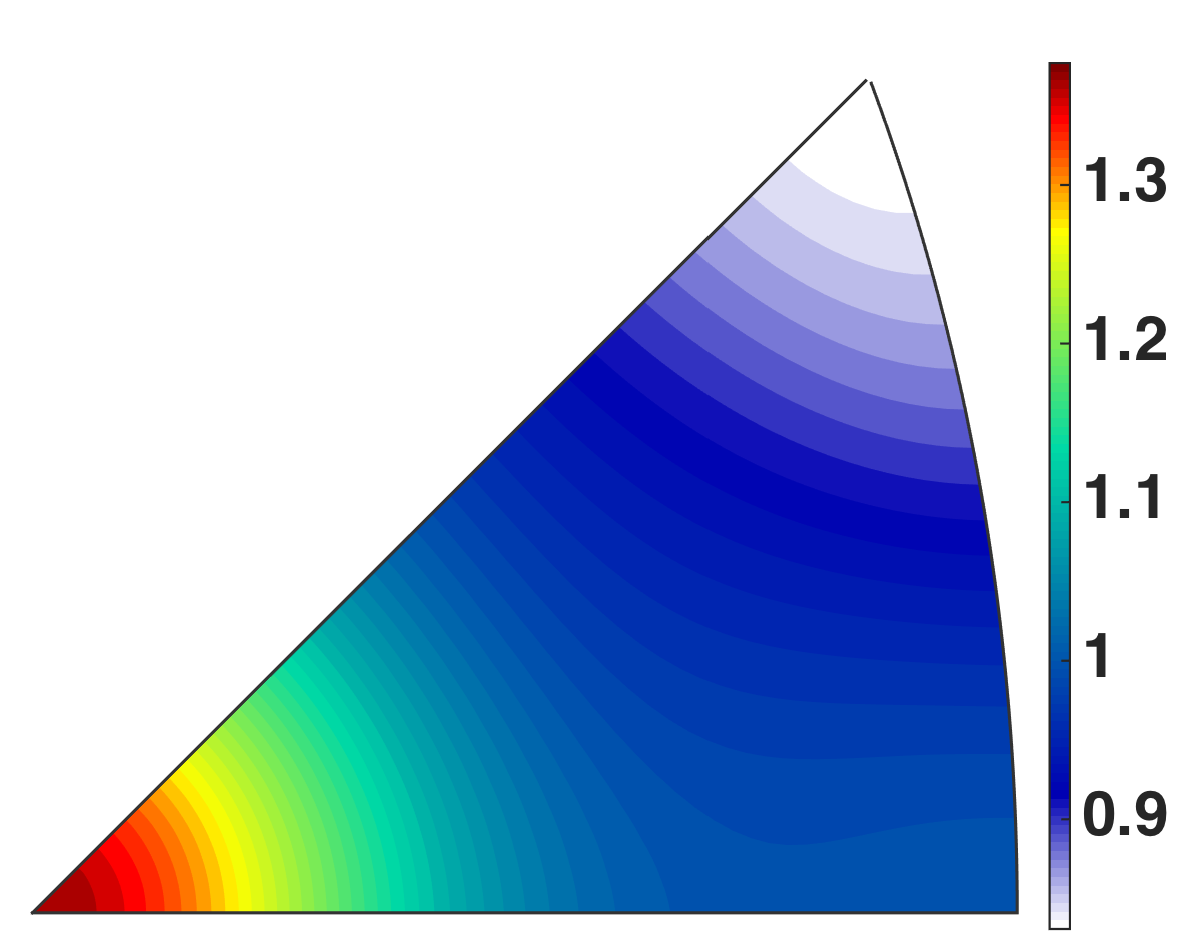

The RVE contained 191 grains and the grid size m was chosen such that the initial average grain size matches the experimental value. The initial grain structure and inverse pole figure (IPF) are shown in Figs. 3 and 3, respectively.
| Symbol | Value | Meaning | ||
|---|---|---|---|---|
| J | Activation energy barrier for slip | |||
| J | Activation energy barrier for climb | |||
| 21.4 m | Grid size for a RVE containing 191 grains | |||
| 200 | Constant for effective length of GND | |||
| 0.5 | Constant for passing stress | |||
| 3.0 | Constant for jump width | |||
| 3.0 | Constant for obstacle width | |||
| Constant for lock forming rate | ||||
| 10.0 | Constant for athermal annihilation rate | |||
| Constant for thermal annihilation rate | ||||
| Constant for dipole forming rate | ||||
| 0.24 | Constant for nonlinear climb |
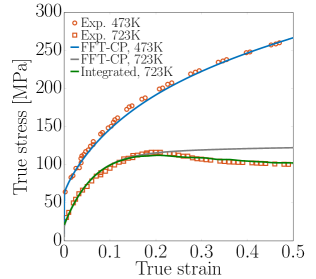
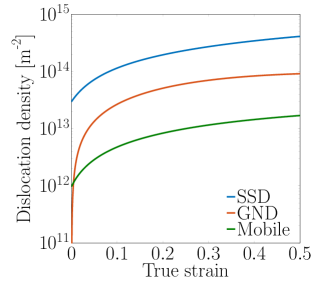
Experimentally DRX was not observed in polycrystalline 4N Cu at 473K at strains (Wusatowska-Sarnek et al., 2002). Therefore a standalone FFT-EVP without PF coupling was used to calibrate the dislocation model. The RVE was subjected to simple compression at a strain rate of /s to match the experimental conditions. The temperature dependence of the model was verified against the early part of the stress strain curve for 4N Cu at 723 K before the onset of dynamic recrystallization (See Fig. 4). The resulting parameters are listed in Table 1 and the corresponding simulated stress-strain curve is shown in Fig. 4. It needs to be pointed out that the initial SSD density is taken as at 473 K and at 723 K. This is found necessary in order to account for the significant difference between the initial yield points of the experimental stress-strain curves shown in Fig. 4. One possible reason is that effects such as grain boundary strengthening and/or temperature-dependent activation volume have been ignored in the current study. The evolution of simulated dislocation densities are shown in Fig. 4, which as expected shows that the mobile dislocation population is only a small fraction of that of the immobile dislocations.
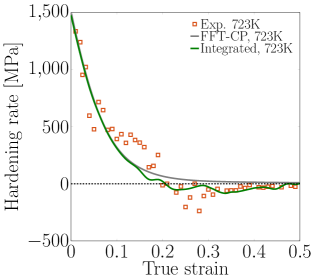
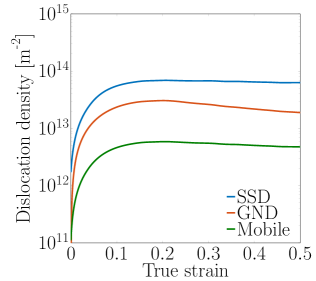
With the calibrated constitutive law in hand, we now integrate FFT-EVP with our nucleation model and PF model to implement the complete DRX simulation as depicted in Fig. 1. Experimental values were used for GB energy and mobility (Murr, 1975; Vandermeer et al., 1997) while the other nucleation and PF parameters were fit to the experimental stress/strain data (see Table 2). The resulting fit reproduces both the experimental stress-strain curve and hardening rate (HR) evolution at 723 K with good agreement, as shown, respectively, in Fig. 4 and Fig. 4. In the standalone crystal plasticity simulation, the HR monotonically decreases to zero due to the dynamic recovery (i.e., annihilation terms in Eq. (6)). In the integrated simulation, the additional softening due to DRX starts to produce a slight deviation on the HR curve around strain and gradually macroscopic softening, i.e., a negative slope on the stress-strain curve (or equivalently negative HR). The corresponding evolution of average dislocation densities are shown in Fig. 4, where the average density of SSD exhibits a significant decrease during DRX and is a major contributor to the softening. As will be shown later, the softening is mainly attributed to the local stress relaxation and redistribution in the neighborhood of newly nucleated and growing grains. It should be noted that all model parameters were exclusively fit to the macroscopic stress-strain curves, and the resulting evolution of dislocation densities is a key prediction of the coupled simulations.
| Symbol | Value | Meaning | ||
|---|---|---|---|---|
| Grain boundary energy | ||||
| Grain boundary mobility | ||||
| 0.25 | Constant for stored strain energy | |||
| 300 | Characteristic dislocation density for nucleation | |||
| 4.4 | Exponent for Weibull distribution of nucleation rate | |||
| 0.05 | Accounting for the change of | |||
| 0.9 | Fraction of GND inherited in DRX grains |
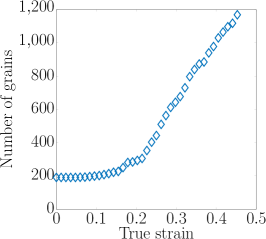
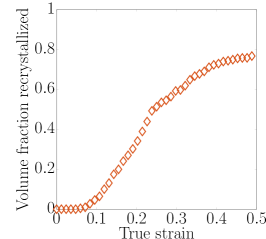
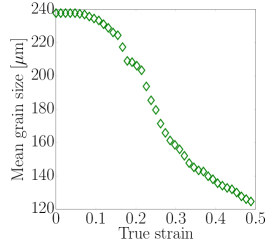
Another key prediction is the full-field microstructural information during DRX. Figs. 5 plots the evolution of total number of grains in the RVE, the volume fraction of recrystallized grains and the mean grain size during the deformation. The overall sigmoidal form of the recrystallized volume fraction agrees with the experiments (Blaz et al., 1983; Rollett et al., 2004), and the continuous increase of the number of gains suggests grain refinement, which agrees with the experiment as well.
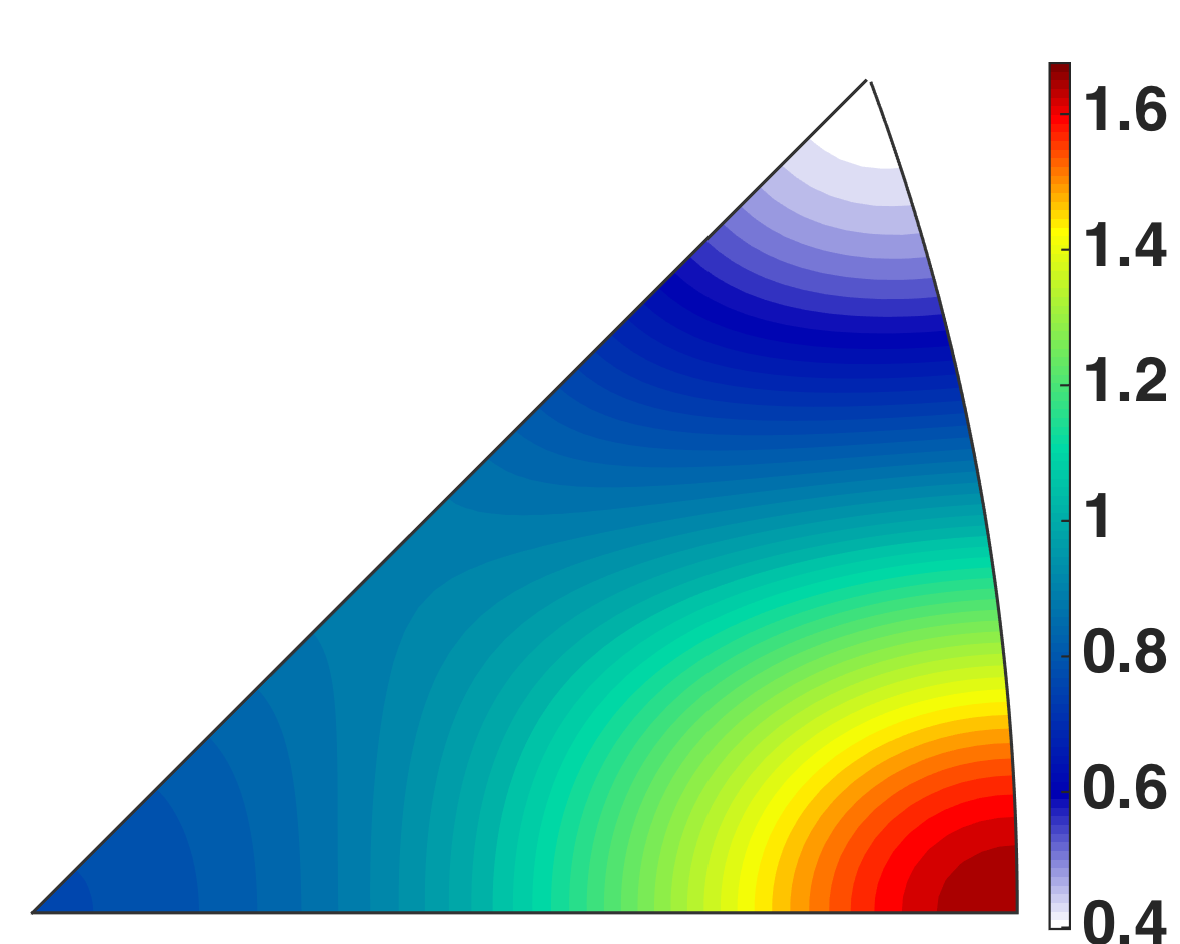
The underlying grain structure evolution is shown in Fig. 6 by plotting snapshots of grain maps during the compression. It can be seen that DRX grains have been formed at both grain boundaries and junctions. Note that the grain structure has changed so significantly that the detailed DRX nucleation and growth processes can only be achieved by more quantitative analysis of the simulation result, which will be presented in the following Discussion section. The simulation also shows that new grains are mostly equiaxed, which is consistent with the corresponding experiment (Wusatowska-Sarnek et al., 2002). IPFs at the macroscopic strain of for the standalone FFT-EVP and integrated simulations at 723 K (Fig. 4) are plotted in Figs. 3 and 3, respectively. The exhibited formation of fiber texture is consistent with the experiment (Wusatowska-Sarnek et al., 2002). In addition, DRX essentially places no difference in terms of the texture, which is also consistent with the experimental conclusion that DRX only causes slightly weakening of the fiber texture (Wusatowska-Sarnek et al., 2002).


4 Discussion
4.1 Critical strain of DRX
The initiation of DRX is well documented to occur before the strain that corresponds to the peak stress (Sakai and Jonas, 1984). This threshold strain , known as the critical strain of DRX, is a very fundamental DRX parameter for practical purpose. However, it can only be determined under isothermal, constant strain rate conditions, involving a large number of interrupted tests (Manonukul and Dunne, 1999). It is expected that experimental identification of based on 2D cross-section should be always larger than the actual strain corresponding to the very first DRX event, for sufficient volume fraction of DRX grains is required to yield statistically observable new grains in a randomly chosen 2D cross-section. Our integrated modeling provides an accurate way of predicting by simply examining the first DRX nucleation event. Table 3 lists our simulation result together with experimental results performed on polycrystalline 3N Cu at a slightly different temperature (700 K) with various strain rates.
| Experiments, 700 K | Simulation, 723 K | |||||
|---|---|---|---|---|---|---|
| Strain rate () | ||||||
| 0.15 | 0.19 | 0.23 | 0.06† | |||
| 0.22 | 0.30 | 0.36 | 0.22 | |||
| 0.68 | 0.63 | 0.64 | 0.27† | |||
As expected our predicted is significantly smaller than the experimental measurement, which should only serve as the upper bound of the actual . Our integrated modeling suggests that in reality the initiation of DRX may occur at a much earlier stage than what is revealed by the existing experimental technique and mean-field theory.
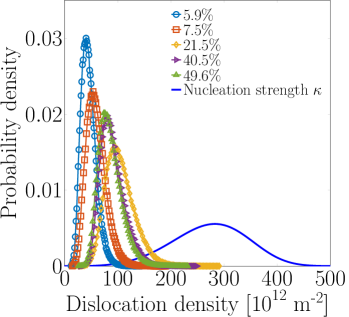
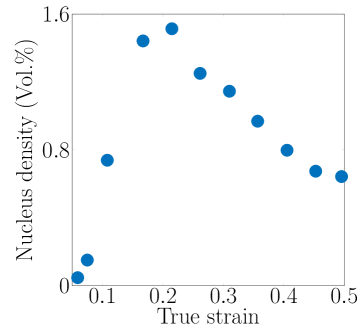
In Fig. 7, the dislocation density distributions at various strain levels prior to DRX nucleation are plotted. With increasing applied strain the dislocation density distribution shifts towards towards higher dislocation densities and broadens. After an applied strain of (), however, the mean of the distribution shifts back towards lower values, indicating a macroscopic softening. In addition, the distribution of dislocation density overlaps with the distribution of nucleation strength only at tails (Fig. 7), suggesting that it is the material points with extreme values of dislocation density that actually controls the initiation of DRX. Integrating the overlap between the two distributions, , gives the expected nucleus density (i.e., volume percentage of mesoscale voxels undertaking DRX nucleation) at the given deformation state as shown in Fig. 7, which is a direct measurement of instantaneous nucleation rates. It suggests that the DRX nucleation rate increases significantly once initiated and reaches a maximum at , followed by a gradual decrease. As discussed above, DRX is triggered by extreme sites, which keep increase as the material continue to work-harden. Initially, the work-hardening outweighs the softening due to recovery and DRX, and the nucleation rate reaches the maximum at , at which the work-hardening is balanced by the softening and the apparent hardening rate becomes zero as shown in Fig. 4. The post- softening, originated from the stress redistribution that will be discussed in Sec. 4.4, implies that the population of extreme sites will no longer increase (as the dislocation density distribution is shifting towards lower values as shown in Fig. 7) and a macroscopic stress-drop is developed as the dynamic system approaches the steady-state.
4.2 Nucleation and growth of DRX grains
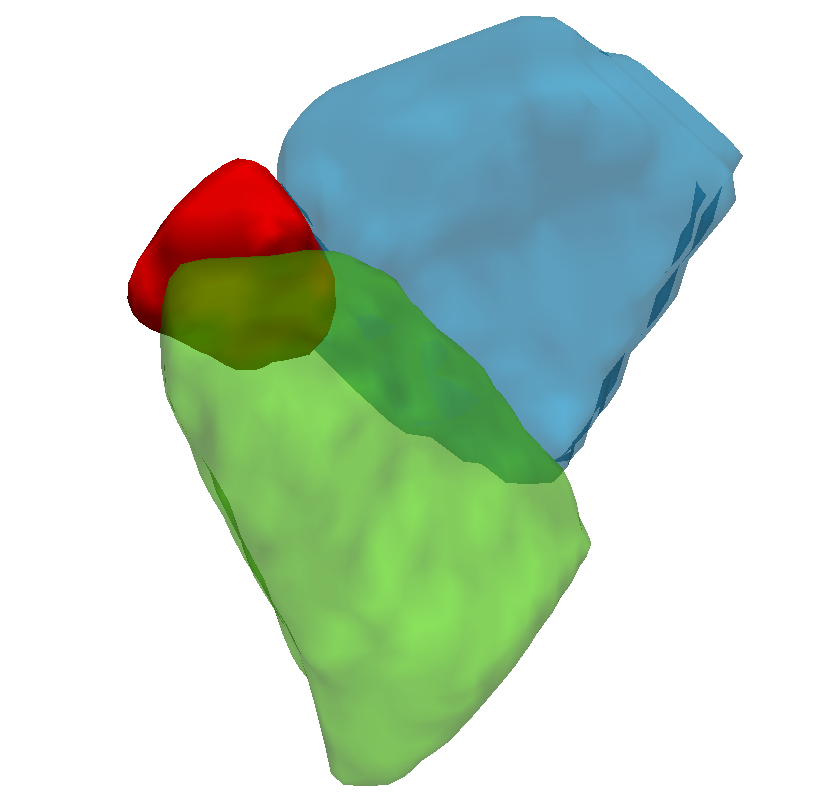
The growth of the very first DRX grain is shown in Fig. 8. This DRX grain is formed at a normal grain boundary. In addition, the new grain grows in a wedge-like fashion to maintain a triple line with the two old grains, wherein the equilibrium triple junction configuration () does not need to be reached. For one thing, grain growth is now mainly driven by the stored energy difference rather than the curvature; for another, the dynamic nature of DRX is very likely to prevent the equilibrium configuration from being reached before other nucleation and growth events come into play.

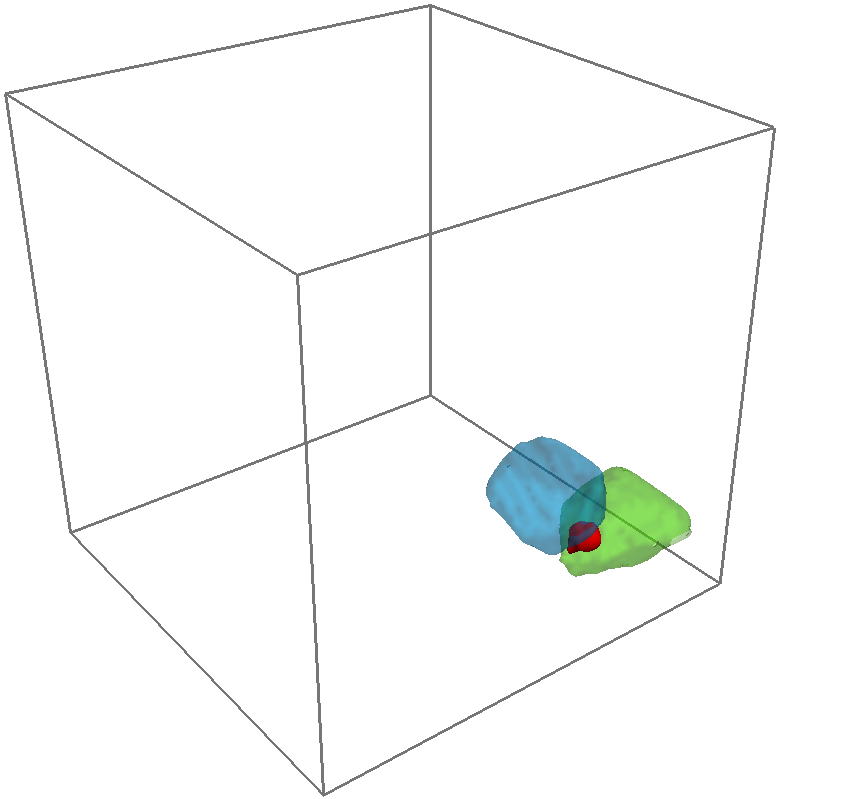
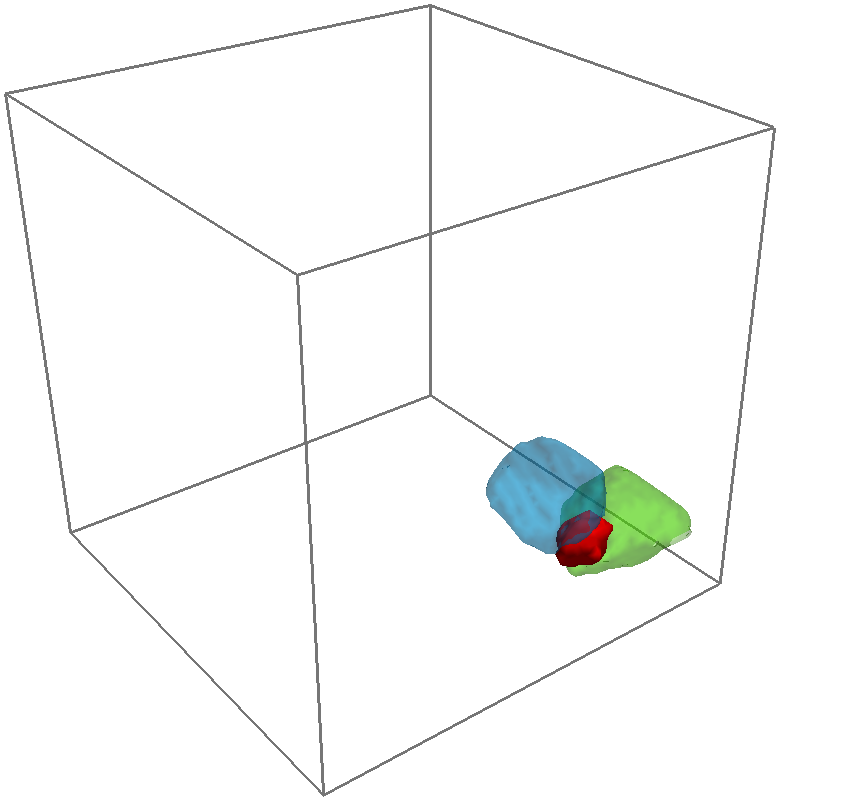
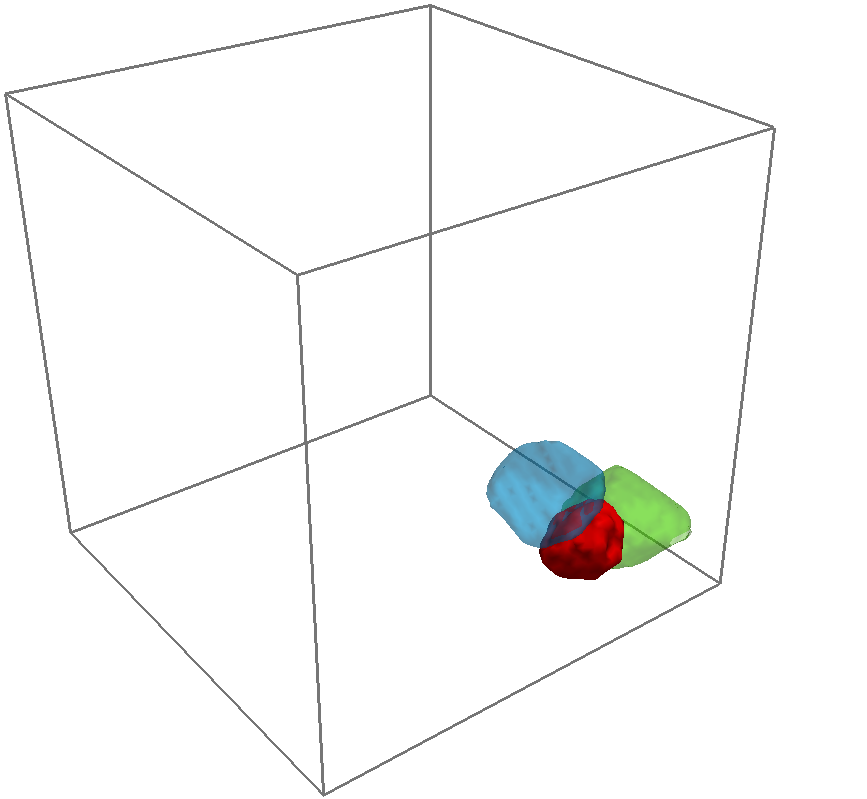
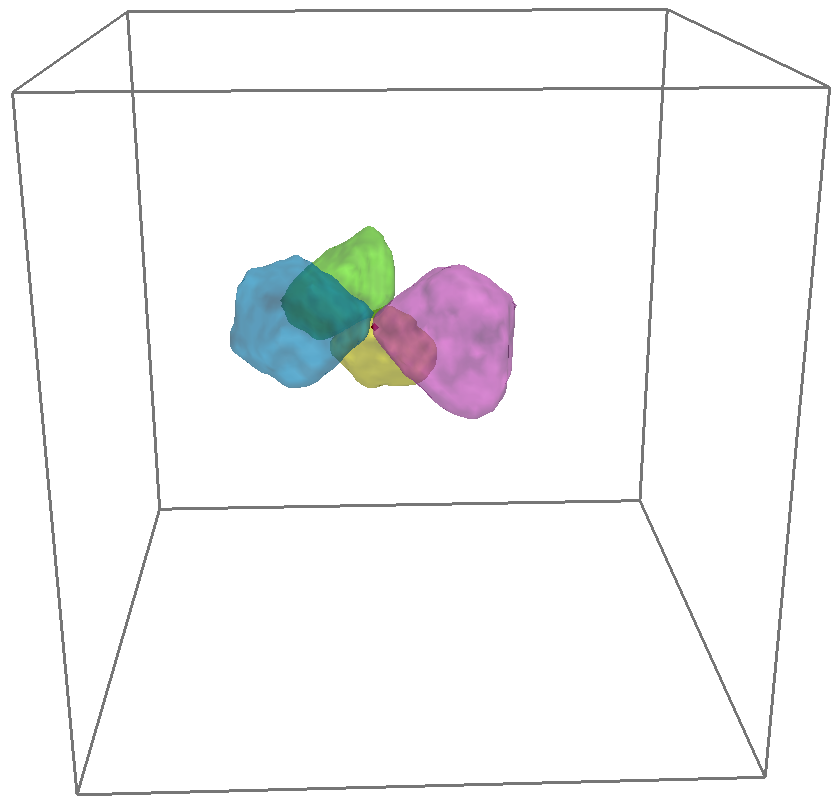
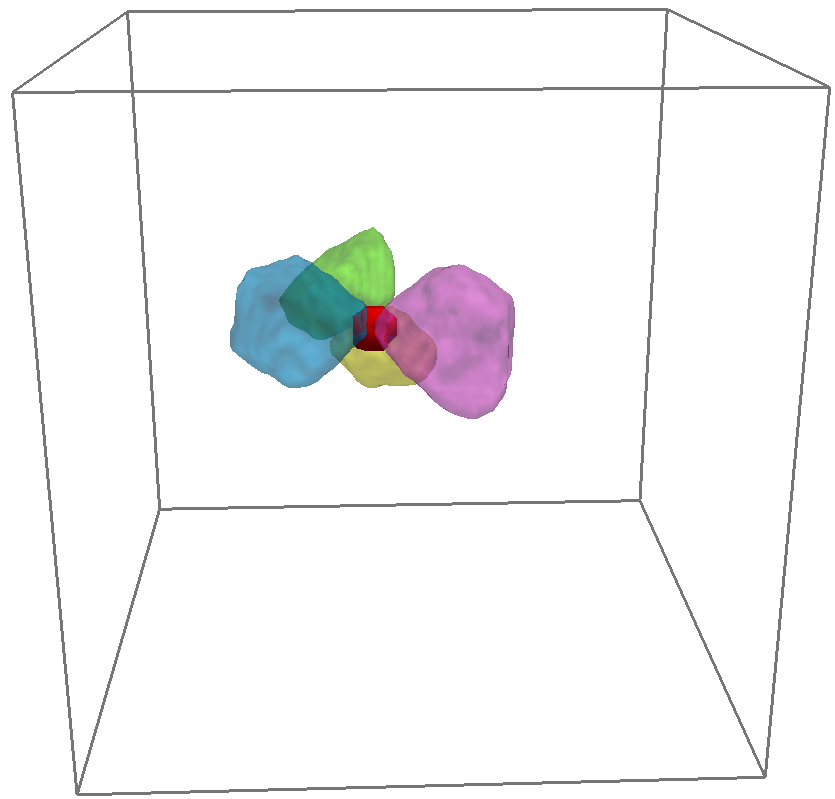
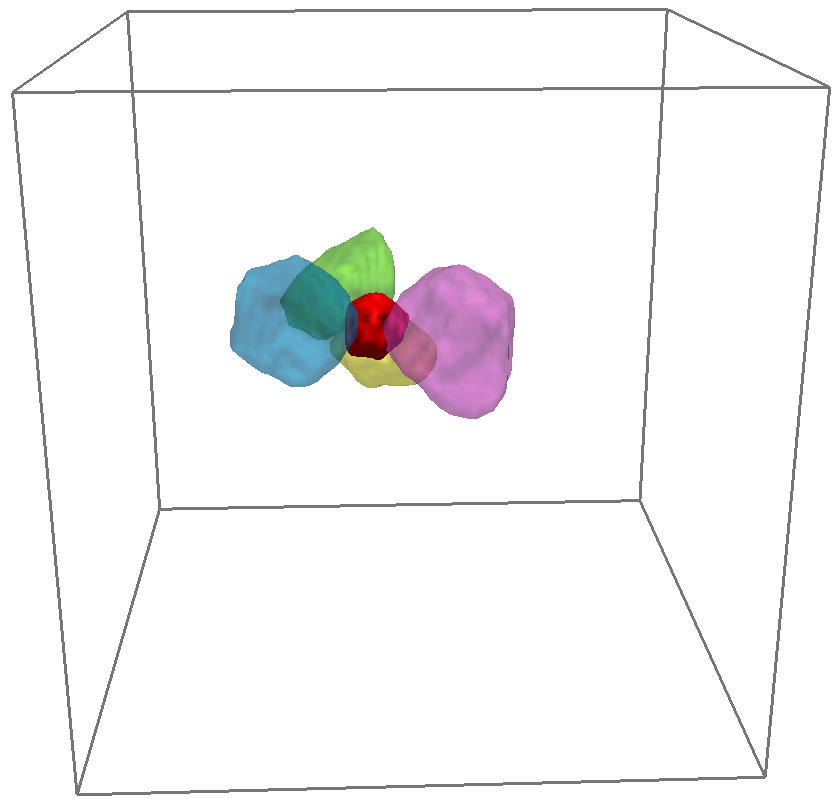
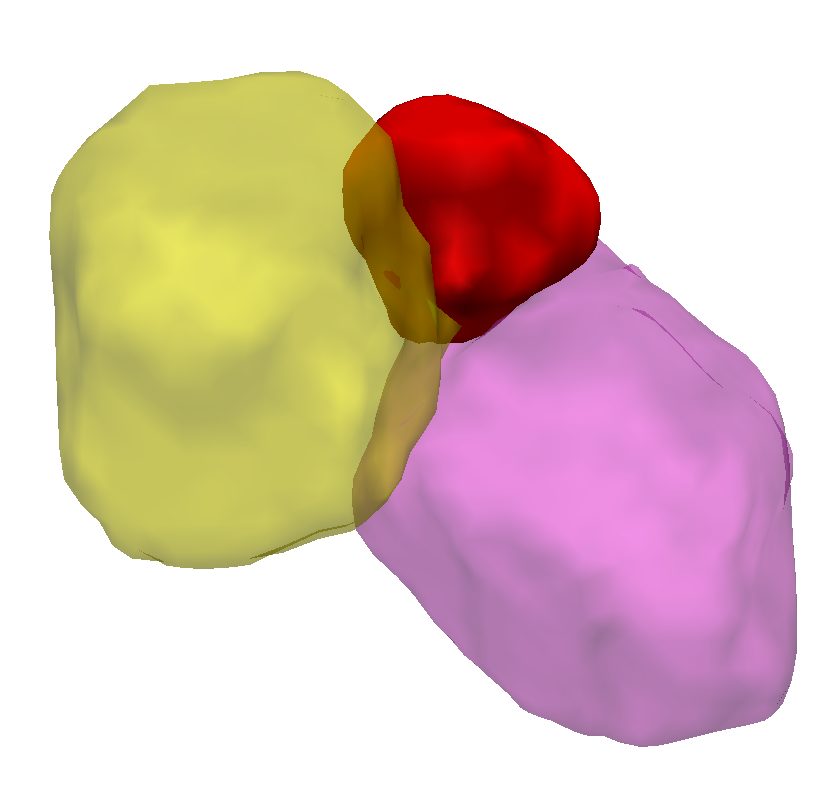
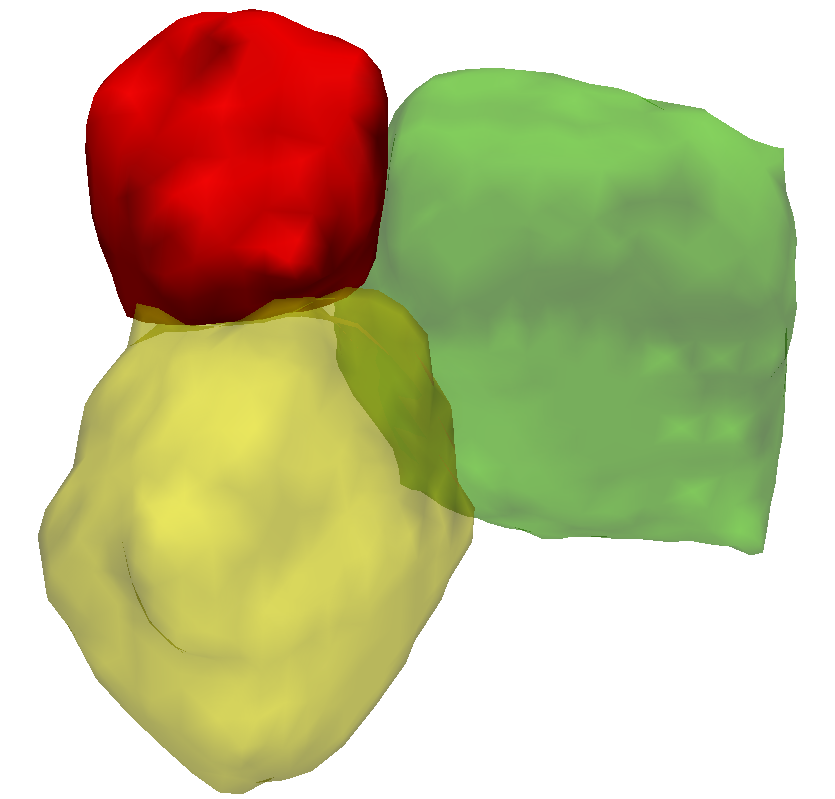
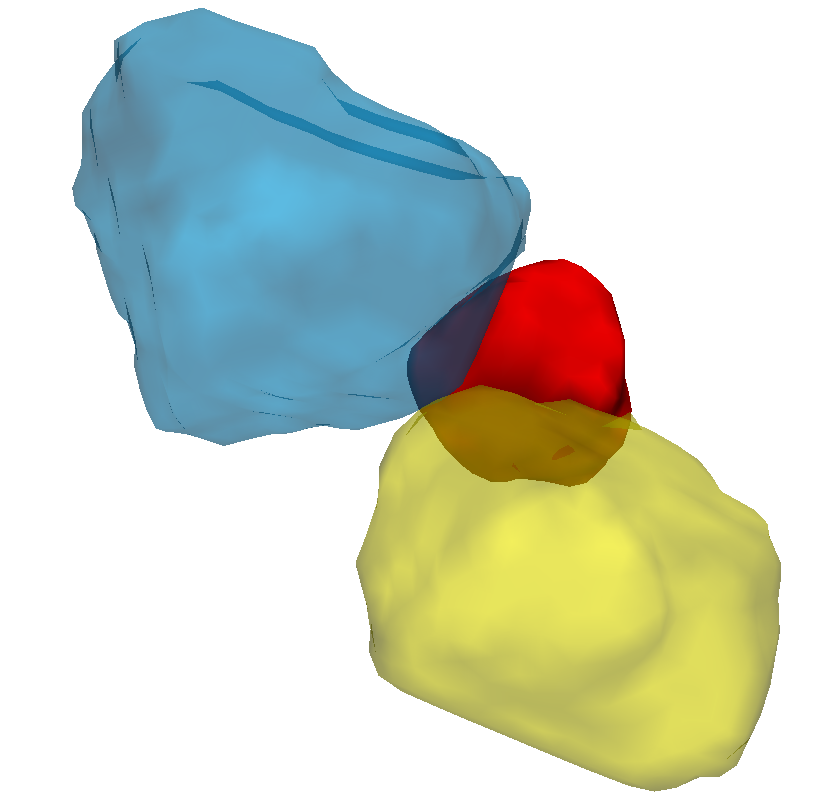
Apart from nucleation at grain boundaries, experiments have indicated that triple junctions may be the preferential nucleation sites for DRX grains (Miura et al., 2005). However, as has also been pointed out by Miura et al. (2005), from 3D point of view, quadruple junctions should be more preferred over triple junctions in terms of DRX nucleation due to the fact that stress or strain can concentrate more easily at quadruple junctions owing to its non-equilibrium nature. In our simulation, we have actually identified the nucleation of DRX at a quadruple junction, as shown in Fig. 9. A close inspection of the 3D structure as shown in Fig. 10 suggests that as in the case of nucleation and growth at a normal GB, the DRX grain formed at a quadruple junction also tends to maintain a triple line with each pair of the neighboring grains by growing in a wedge-like fashion.

It would also be of great interest to analyze all nucleated DRX grains in our integrated simulations and perform statistics on the nucleation at GB, triple junctions and quadruple junctions. However, this is beyond the purpose of the current paper and we leave that as a topic of future work.
4.3 Kinetics of DRX
For static recrystallization, the kinetics can be analyzed using the Avrami equation:
| (17) |
where is the volume fraction recrystallized, is time, is a constant called Avrami exponent, and is also a constant. During DRX if the strain rate is constant, the time in Eq. (17) is usually replaced by and the kinetics can again be analyzed using the Avrami equation (Roberts et al., 1979), which is shown in Fig. 11.
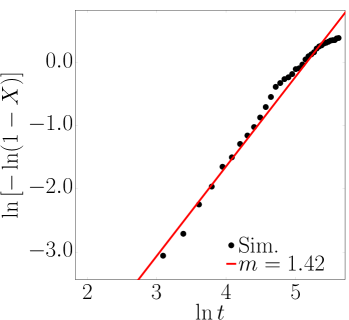
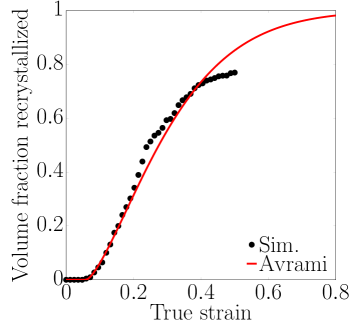
The Avrami exponent from our simulation (Fig. 11) falls in the range of the experimental values revealed by the data on commercial purity copper (García et al., 2000).
The slope in Fig. 11 shows some variation, indicating that the Avrami exponent is decreasing when deformation becomes large. The nonuniform Avrami exponent has also been observed in static recrystallization, where the Avrami exponent decreases as the recrystallization proceeds. This is attributed to the lack of uniformity of the stored energy (Rollett et al., 1989), which is also the case in DRX. The Avrami analysis (Fig. 11) indicates that the completion of DRX is , at which level the steady-state flow has just been reached according to the experimental stress-strain curve of Wusatowska-Sarnek et al. (2002).
The estimated mean grain size during the compression (Fig. 5) shows grain refinement of ( is the initial mean grain size) up to strain, which is consistent with the common empirical criterion (Sakai and Jonas, 1984) that a single stress peak DRX usually corresponds to . The corresponding experiment data (Wusatowska-Sarnek et al., 2002) shows , measured after a strain of when the steady-state has been reached. It is difficult to “extrapolate” current simulation results (Figs. 5 and 5) and compare with this experimental result. Nevertheless, the initially rapid grain refinement has shown a decrease in the refinement rate. In our future work, the replacement of FFT-EVP with a finite-strain framework will eventually allow us to approach the steady grain size revealed by many DRX experiments (Sah et al., 1974; Blaz et al., 1983; Sakai and Jonas, 1984).
4.4 Softening during DRX
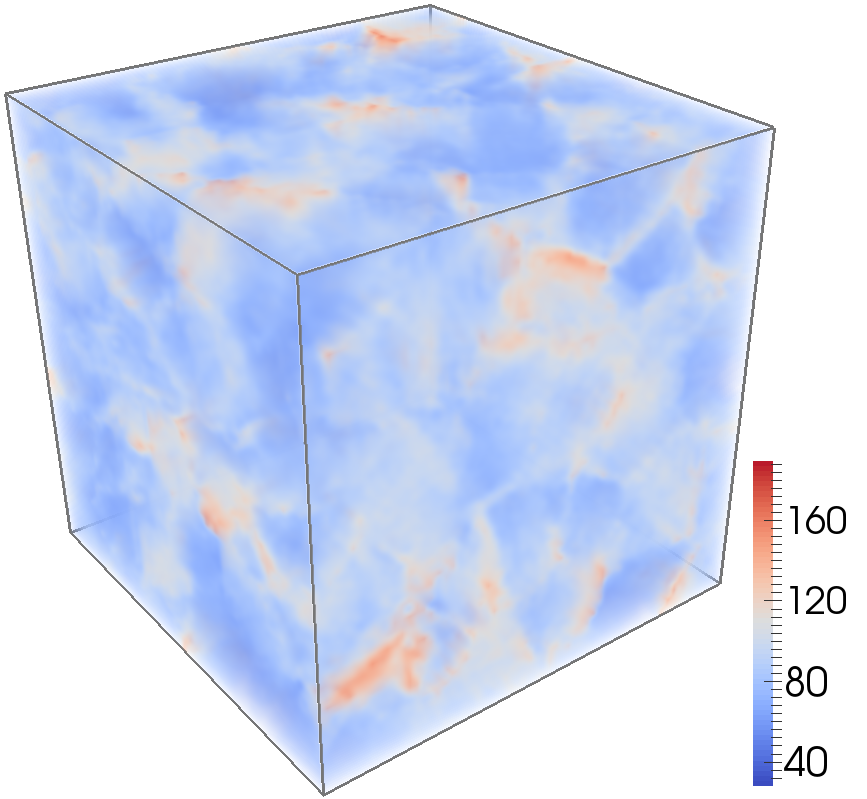
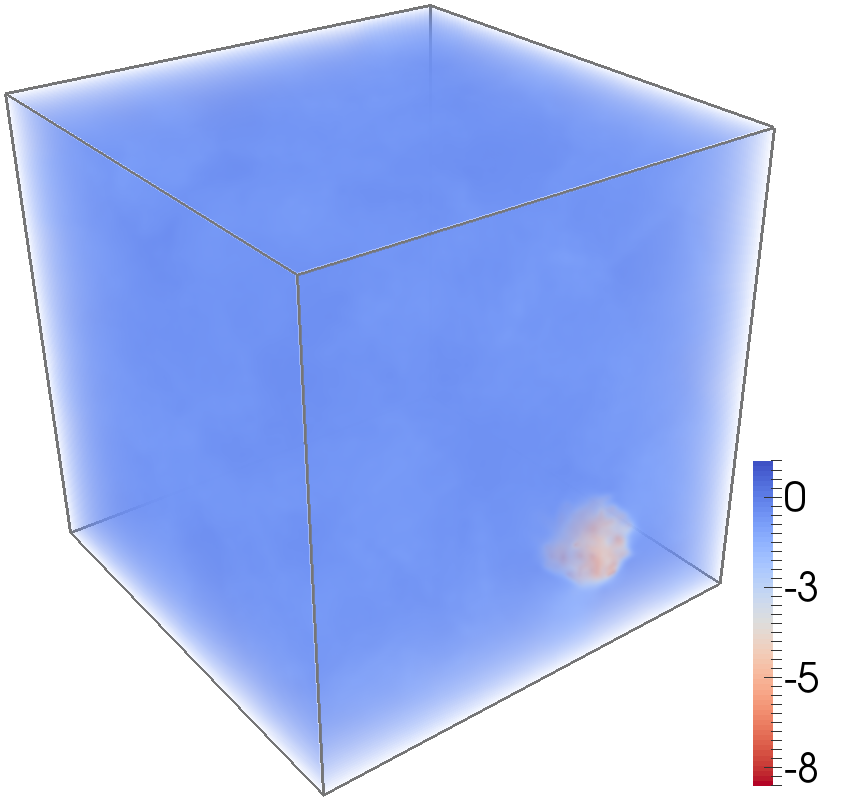
While the analogy between the formation of “dislocation-free” grains and phase transformation has been adopted to intuitively explain the softening of DRX, it has to be noted that DRX is essentially related to the formation and migration of grain boundaries, which are extended defects rather than phases, and extended defects are strongly driven by stress rather than thermodynamics (Zhao et al., 2013, 2014). At the length scale of discrete extended defects, the RVE-average stress is expected to exhibit successive drops due to the repeated relaxation of local stresses, which, however, may easily be averaged out from further coarse-graining at a larger length scale. For instance, while dynamic recovery due to dislocation annihilation can certainly lead to softening, the effect is usually balanced by the hardening due to dislocation entanglement occurring at the same scale (as shown in Eq. (6)), leaving the stress-strain curve approaching monotonically a plateau (Rollett et al., 2004) without showing any macroscopic softening, as shown in the standalone FFT-CP simulation in Figs. 4 and 4. As a result, softening (negative tangent modulus) during DRX must be attributed to dislocation population evolution due to stress relaxation at a much larger scale than that of discrete dislocation motions/interactions; which is limited to the mean free path of dislocation slip () and/or the interaction length of dislocation annihilation (such as climb). To this end, the stress field prior to the nucleation of the very first DRX grain (Fig. 8) is plotted in Fig. 12. Compared with the corresponding grain structure in Fig. 3, it is obvious that stress concentrations mainly occur at the grain boundaries and junctions, supporting the GB bulging mechanism adopted in our simulation. (The dislocation density field has a similar distribution.) The change of von Mises stress after the growth of the new grain, shown in Fig. 12, indicates that the most significant changes ( MPa) are localized within a small region that corresponds exactly to the region of the new grain as shown in Fig. 8. (Note that Figs. 8 and 12 have the same viewpoint.) In addition, the maximum decrease of local stress in Fig. 12 is MPa, which is at the level of the overall macroscopic stress drop as shown in Fig. 4.
Similar results are obtained when analyzing the stress relaxation upon DRX event at the quadruple junction shown in Fig. 9. This suggests that enforcing strain rate compatibility immediately after DRX nucleation can effectively redistribute the equilibrium internal stress field to maintain concordance with the evolved grain structure. The redistributed internal stress can then influence the subsequent dislocation density (both SSD and GND) evolution through the mesoscopic constitutive laws (Eqs. (6) and (7)) and eventually lead to the macroscopic softening on the stress-strain curve. The exhibited macroscopic instability is a dynamic net result developed by a series of successive discrete DRX events subject to continuous loading conditions, which is by no means trivial to perceive based solely on static argument such as instantaneous dislocation density. The current interpretation of DRX emphasizes the importance of the time and length scale associated with the “dislocation-free” concept in the previous DRX description and suggests that internal stress redistribution is responsible for the macroscopic softening. The redistribution of strain and stress field during DRX nucleation has actually been indicated recently by Chauve et al. (2015) using Digital Image Correlation. It is thus of great interest to carry out more detailed analysis as in Fig. 12 to yield a statistically more reliable correlation between stress redistribution and DRX; this will be done in our future work.
5 Conclusions
In this paper an integrated full-field modeling scheme that couples plastic deformation with microstructure evolution has been established, which provides a general framework for investigating thermomechanical processes. The key feature of the integrated modeling scheme is the selection of microstructure descriptors that will be used in both constitutive laws of plasticity and the nucleation and growth of new phases/grains. As the first demonstration, a FFT-based elasto-viscoplastic model and a phase-field grain boundary migration model were integrated through the combination of a dislocation-based crystal plasticity model and a statistical DRX nucleation model, with the density of dislocations (including SSD, GND, and mobile dislocations) being the selected microstructure descriptors to couple plastic and microstructural evolution. After calibration solely based on experimental mechanical response of DRX in polycrystalline copper, the model delivered fruitful full-field microstructural information, which were used to provide quantitative description and analysis of the DRX process. Quantitative agreement with experiments in terms of the kinetics and softening during DRX were achieved.
This effort represents several firsts in the simulation of thermomechanical processes. First and foremost, it is the first successful demonstration of full coupling between crystal plasticity and phase-field simulations using a spectral (FFT) framework. Secondly, this work also represents the first implementation of a dislocation based constitutive theory within the FFT-CP framework with applications to polycrystals, further demonstrating the utility of the FFT method as a general micromechanical modeling platform. Finally, to the best of the author’s knowledge this work represents the first case where softening has been handled within the FFT-CP as well.
Despite the fact that DRX is a well studied phenomenon, our integrated simulation makes several new predictions awaiting experimental verification. Namely we predict the evolution of dislocation densities through the early and intermediate stages of DRX. In addition, we predict that the dislocation content of newly nucleated grains must increase rapidly due to the co-deformation of the new grain with its surrounding neighborhood. This suggests that the observed macroscale softening is largely due to the effect of local stress redistribution on the dislocation density, particularly a drop in the statistically stored dislocation content. We further predict a much earlier onset of DRX than what have been reported or predicted previously due to the heterogeneous deformation and stochastic nature of DRX nucleation. Finally we show that DRX grains formed at both grain boundaries and junctions (e.g., quadruple junctions) tend to grow in a wedge-like fashion to maintain a triple line (not necessarily in equilibrium) with the old grains.
While quantitative agreement of our simulations with experiments have been reached, the current model has some limitations with respect to the specific DRX simulation explored here. First of all, the small-strain framework of FFT-EVP prevents us from simulating the complete DRX process to compare with experiments. Secondly, the special orientation of nucleated DRX grains (e.g., forming the twin boundary with the parent grain (Wusatowska-Sarnek et al., 2002)) has not been considered in the current model. Finally, the dislocation-based constitutive laws employed and modified in the current model can be further improved towards a more physics-based manner to account for features such as GND emission/absorption at grain boundaries or interfaces (Sun et al., 2000) and GND saturation (Kysar et al., 2010; Öztop et al., 2013). The future adoption of the finite-strain FFT-CP, would allow a complete simulation of DRX and more accurate prediction of the steady state mean grain size. The integration of finite deformation kinematics with the phase-field is also crucial for the simulation of other technologically relevant thermomechanical processes.
6 Acknowledgements
This work was supported by The National Science Foundation under the DMREF program with Grant No. DMR-1435483. Additional support for S.R.N. and Y.W. comes from the National Science Foundation DMREF program Grant no. DMR-1534826.
Appendix A Poisson statistical model for DRX nucleation
Consider a unit area of GB with a nucleation propensity 111The convention followed in the statistics literature of denoting random variables in bold unfortunately conflicts with the usual use of bold typeface to denote tensorial or vector quantities. It should be clear from context whether a particular variable is a random scalar or a tensor of vector quantity. (for clarity, we will omit the dependence of ), then due to thermal and atomic structural fluctuations, the number of transformation events will be a random number and expected to increases with increasing . Given the assumptions stated above, we can say that obeys an inhomogeneous Poisson process (Niezgoda et al., 2014). Correspondingly, we introduce the cumulative hazard function that encodes the probability of a subcell transformation. The probability of observing sub-cell nucleation events is thus given by
| (18) |
In order to link Eq. 18 to a probability of nucleation we need to determine the minimum number of transformations required to form a stable nucleus, , and the form of . Recall that we have not specified how the division of a FFT gridpoint into sub-cells can be done, and due to lack of a specific atomistic mechanisms for DRX nucleation it is unclear what physical events describes. Clearly there is a connection between the two. If a finer sub-grid is chosen, then is expected to have higher absolute values compared to the case of a coarser sub-grid, with, however, the actual reaction rate remained the same. This non-uniqueness actually allows us to arbitrarily fix the sub-grid for our convenience such that and fit so that the resulting nucleation probability matches experimental data. The probability of nucleation can then be given as
| (19) |
| (20) |
which will serve as the numerical criterion to check if a FFT gridpoint will undergo DRX nucleation. This is the same as the explicit nucleation model of Simmons et al. (2000) used in phase-field simulation of phase transformations, as well as the twin nucleation model of Niezgoda et al. (2014). Following the previous studies of Ding and Guo (2001) and Rollett et al. (2004), the cumulative hazard function adopts an exponential form
| (21) |
where and are material constants. and can be interpreted as the characteristic threshold that the nucleation propensity needs to exceed in order to yield appreciable nucleation probabilities. Substituting Eq. (21) into Eq. (20) leads to Eq. (9) in Sec. 2.3.
References
- Allen and Cahn (1979) Allen, S.M., Cahn, J.W., 1979. A microscopic theory for antiphase boundary motion and its application to antiphase domain coarsening. Acta Metallurgica 27, 1085–1095.
- Allison (2011) Allison, J., 2011. Integrated computational materials engineering: A perspective on progress and future steps. JOM Journal of the Minerals, Metals and Materials Society 63, 15–18.
- Allison et al. (2006) Allison, J., Backman, D., Christodoulou, L., 2006. Integrated computational materials engineering: a new paradigm for the global materials profession. JOM 58, 25–27.
- Arsenlis and Parks (2002) Arsenlis, A., Parks, D.M., 2002. Modeling the evolution of crystallographic dislocation density in crystal plasticity. Journal of the Mechanics and Physics of Solids 50, 1979–2009.
- Arsenlis et al. (2004) Arsenlis, A., Parks, D.M., Becker, R., Bulatov, V.V., 2004. On the evolution of crystallographic dislocation density in non-homogeneously deforming crystals. Journal of the Mechanics and Physics of Solids 52, 1213–1246.
- Beaudoin et al. (1995) Beaudoin, A., Dawson, P., Mathur, K., Kocks, U., 1995. A hybrid finite element formulation for polycrystal plasticity with consideration of macrostructural and microstructural linking. International Journal of Plasticity 11, 501–521.
- Beyerlein and Tomé (2008) Beyerlein, I., Tomé, C., 2008. A dislocation-based constitutive law for pure zr including temperature effects. International Journal of Plasticity 24, 867–895.
- Blaz et al. (1983) Blaz, L., Sakai, T., Jonas, J., 1983. Effect of initial grain size on dynamic recrystallization of copper. Metal Science 17, 609–616.
- Boettinger et al. (2002) Boettinger, W., Warren, J., Beckermann, C., Karma, A., 2002. Phase-field simulation of solidification. Annual review of materials research 32, 163–194.
- Cereceda et al. (2015) Cereceda, D., Diehl, M., Roters, F., Raabe, D., Perlado, J.M., Marian, J., 2015. Unraveling the temperature dependence of the yield strength in single-crystal tungsten using atomistically-informed crystal plasticity calculations. International Journal of Plasticity .
- Chauve et al. (2015) Chauve, T., Montagnat, M., Vacher, P., 2015. Strain field evolution during dynamic recrystallization nucleation; a case study on ice. Acta Materialia 101, 116–124.
- Chen et al. (2015) Chen, L., Chen, J., Lebensohn, R., Ji, Y., Heo, T., Bhattacharyya, S., Chang, K., Mathaudhu, S., Liu, Z., Chen, L.Q., 2015. An integrated fast fourier transform-based phase-field and crystal plasticity approach to model recrystallization of three dimensional polycrystals. Computer Methods in Applied Mechanics and Engineering 285, 829–848.
- Chen (2002) Chen, L.Q., 2002. Phase-field models for microstructure evolution. Annual review of materials research 32, 113–140.
- Chen and Yang (1994) Chen, L.Q., Yang, W., 1994. Computer simulation of the domain dynamics of a quenched system with a large number of nonconserved order parameters: The grain-growth kinetics. Physical Review B 50, 15752.
- Cheong and Busso (2004) Cheong, K.S., Busso, E.P., 2004. Discrete dislocation density modelling of single phase fcc polycrystal aggregates. Acta Materialia 52, 5665–5675.
- Cuitino and Ortiz (1992) Cuitino, A., Ortiz, M., 1992. A material-independent method for extending stress update algorithms from small-strain plasticity to finite plasticity with multiplicative kinematics. Engineering computations 9, 437–451.
- Dai (1997) Dai, H., 1997. Geometrically-necessary dislocation density in continuum plasticity theory, FEM implementation and applications. Ph.D. thesis. Massachusetts Institute of Technology.
- Dai and Parks (1997) Dai, H., Parks, D.M., 1997. Geometrically-necessary dislocation density and scaledependent crystal plasticity, in: Proceedings of Plasticity”(Ed. AS Khan), Neat Press, pp. 17–18.
- Davis et al. (2001) Davis, J.R., et al., 2001. Copper and copper alloys. ASM international.
- Ding and Guo (2001) Ding, R., Guo, Z., 2001. Coupled quantitative simulation of microstructural evolution and plastic flow during dynamic recrystallization. Acta materialia 49, 3163–3175.
- Eisenlohr et al. (2013) Eisenlohr, P., Diehl, M., Lebensohn, R., Roters, F., 2013. A spectral method solution to crystal elasto-viscoplasticity at finite strains. International Journal of Plasticity 46, 37–53.
- Frost and Ashby (1982) Frost, H.J., Ashby, M.F., 1982. Deformation mechanism maps: the plasticity and creep of metals and ceramics. Pergamon press.
- Galiyev et al. (2001) Galiyev, A., Kaibyshev, R., Gottstein, G., 2001. Correlation of plastic deformation and dynamic recrystallization in magnesium alloy ZK60. Acta Materialia 49, 1199–1207.
- Gao and Huang (2003) Gao, H., Huang, Y., 2003. Geometrically necessary dislocation and size-dependent plasticity. Scripta Materialia 48, 113–118.
- García et al. (2000) García, V., Cabrera, J., Riera, L., Prado, J., 2000. Hot deformation of a commercial purity copper, in: Proceedings of Euromat 2000: Advances in Mechanical Behaviour, Plasticity and Damage. Elsevier Science, Oxford, pp. 1357–1362.
- Gaubert et al. (2010) Gaubert, A., Le Bouar, Y., Finel, A., 2010. Coupling phase field and viscoplasticity to study rafting in Ni-based superalloys. Philosophical Magazine 90, 375–404.
- Ghauri et al. (1990) Ghauri, I., Butt, M., Raza, S., 1990. Grain growth in copper and alpha-brasses. Journal of Materials Science 25, 4782–4784.
- Groeber and Jackson (2014) Groeber, M.A., Jackson, M.A., 2014. Dream. 3D: A digital representation environment for the analysis of microstructure in 3D. Integrating Materials and Manufacturing Innovation 3, 5.
- Gruber et al. (2006) Gruber, J., Ma, N., Wang, Y., Rollett, A., Rohrer, G., 2006. Sparse data structure and algorithm for the phase field method. Modelling and simulation in materials science and engineering 14, 1189.
- Hesselbarth and Göbel (1991) Hesselbarth, H., Göbel, I., 1991. Simulation of recrystallization by cellular automata. Acta Metallurgica et Materialia 39, 2135–2143.
- Hull and Bacon (2001) Hull, D., Bacon, D.J., 2001. Introduction to dislocations. Butterworth-Heinemann.
- Kalidindi (1998) Kalidindi, S.R., 1998. Incorporation of deformation twinning in crystal plasticity models. Journal of the Mechanics and Physics of Solids 46, 267–290.
- Kalidindi et al. (1992) Kalidindi, S.R., Bronkhorst, C.A., Anand, L., 1992. Crystallographic texture evolution in bulk deformation processing of fcc metals. Journal of the Mechanics and Physics of Solids 40, 537–569.
- Kazaryan et al. (2002) Kazaryan, A., Wang, Y., Dregia, S., Patton, B., 2002. Grain growth in anisotropic systems: comparison of effects of energy and mobility. Acta Materialia 50, 2491–2502.
- Kazaryan et al. (2000) Kazaryan, A., Wang, Y., Dregia, S., Patton, B.R., 2000. Generalized phase-field model for computer simulation of grain growth in anisotropic systems. Physical Review B 61, 14275.
- Kysar et al. (2010) Kysar, J., Saito, Y., Oztop, M., Lee, D., Huh, W., 2010. Experimental lower bounds on geometrically necessary dislocation density. International Journal of Plasticity 26, 1097–1123.
- Lan et al. (2005) Lan, Y., Xiao, N., Li, D., Li, Y., 2005. Mesoscale simulation of deformed austenite decomposition into ferrite by coupling a cellular automaton method with a crystal plasticity finite element model. Acta materialia 53, 991–1003.
- Lebensohn (2001) Lebensohn, R., 2001. N-site modeling of a 3d viscoplastic polycrystal using fast fourier transform. Acta Materialia 49, 2723–2737.
- Lebensohn and Tomé (1993) Lebensohn, R., Tomé, C., 1993. A self-consistent anisotropic approach for the simulation of plastic deformation and texture development of polycrystals: application to zirconium alloys. Acta metallurgica et materialia 41, 2611–2624.
- Lebensohn et al. (2012) Lebensohn, R.A., Kanjarla, A.K., Eisenlohr, P., 2012. An elasto-viscoplastic formulation based on fast Fourier transforms for the prediction of micromechanical fields in polycrystalline materials. International Journal of Plasticity 32, 59–69.
- Ma and Roters (2004) Ma, A., Roters, F., 2004. A constitutive model for fcc single crystals based on dislocation densities and its application to uniaxial compression of aluminium single crystals. Acta materialia 52, 3603–3612.
- Ma et al. (2006) Ma, A., Roters, F., Raabe, D., 2006. A dislocation density based constitutive model for crystal plasticity fem including geometrically necessary dislocations. Acta Materialia 54, 2169–2179.
- Ma et al. (2004) Ma, N., Kazaryan, A., Dregia, S., Wang, Y., 2004. Computer simulation of texture evolution during grain growth: effect of boundary properties and initial microstructure. Acta Materialia 52, 3869–3879.
- Manchiraju and Anderson (2010) Manchiraju, S., Anderson, P., 2010. Coupling between martensitic phase transformations and plasticity: a microstructure-based finite element model. International Journal of Plasticity 26, 1508–1526.
- Manonukul and Dunne (1999) Manonukul, A., Dunne, F., 1999. Initiation of dynamic recrystallization under inhomogeneous stress states in pure copper. Acta materialia 47, 4339–4354.
- Mecking and Kocks (1981) Mecking, H., Kocks, U., 1981. Kinetics of flow and strain-hardening. Acta Metallurgica 29, 1865–1875.
- Michel et al. (2000) Michel, J., Moulinec, H., Suquet, P., 2000. A computational method based on augmented lagrangians and fast fourier transforms for composites with high contrast. CMES(Computer Modelling in Engineering & Sciences) 1, 79–88.
- Miura et al. (2005) Miura, H., Sakai, T., Andiarwanto, S., Jonas, J., 2005. Nucleation of dynamic recrystallization at triple junctions in polycrystalline copper. Philosophical Magazine 85, 2653–2669.
- Miura et al. (2007) Miura, H., Sakai, T., Mogawa, R., Jonas, J.J., 2007. Nucleation of dynamic recrystallization at the grain boundaries of copper bicrystals, in: Materials Science Forum, Trans Tech Publ. pp. 457–464.
- Moelans et al. (2008a) Moelans, N., Blanpain, B., Wollants, P., 2008a. Quantitative analysis of grain boundary properties in a generalized phase field model for grain growth in anisotropic systems. Physical Review B 78, 024113.
- Moelans et al. (2008b) Moelans, N., Blanpain, B., Wollants, P., 2008b. Quantitative phase-field approach for simulating grain growth in anisotropic systems with arbitrary inclination and misorientation dependence. Physical review letters 101, 025502.
- Moelans et al. (2013) Moelans, N., Godfrey, A., Zhang, Y., Jensen, D.J., 2013. Phase-field simulation study of the migration of recrystallization boundaries. Physical Review B 88, 054103.
- Murr (1975) Murr, L.E., 1975. Interfacial phenomena in metals and alloys. Addison-Wesley.
- Niezgoda et al. (2014) Niezgoda, S.R., Kanjarla, A.K., Beyerlein, I.J., Tome, C.N., 2014. Stochastic modeling of twin nucleation in polycrystals: An application in hexagonal close-packed metals. International Journal of Plasticity 56, 119–138.
- Nye (1953) Nye, J., 1953. Some geometrical relations in dislocated crystals. Acta metallurgica 1, 153–162.
- Öztop et al. (2013) Öztop, M.S., Niordson, C.F., Kysar, J.W., 2013. Length-scale effect due to periodic variation of geometrically necessary dislocation densities. International Journal of Plasticity 41, 189–201.
- Ponge and Gottstein (1998) Ponge, D., Gottstein, G., 1998. Necklace formation during dynamic recrystallization: mechanisms and impact on flow behavior. Acta Materialia 46, 69–80.
- Popova et al. (2014) Popova, E., Staraselski, Y., Brahme, A., Mishra, R., Inal, K., 2014. Coupled crystal plasticity-probabilistic cellular automata approach to model dynamic recrystallization in magnesium alloys. International Journal of Plasticity .
- Prakash and Lebensohn (2009) Prakash, A., Lebensohn, R., 2009. Simulation of micromechanical behavior of polycrystals: finite elements versus fast fourier transforms. Modelling and Simulation in Materials Science and Engineering 17, 064010.
- Raabe (2002) Raabe, D., 2002. Cellular automata in materials science with particular reference to recrystallization simulation. Annual review of materials research 32, 53–76.
- Roberts et al. (1979) Roberts, W., Boden, H., Ahlblom, B., 1979. Dynamic recrystallization kinetics. Metal Science 13, 195–205.
- Rollett et al. (2004) Rollett, A., Humphreys, F., Rohrer, G.S., Hatherly, M., 2004. Recrystallization and related annealing phenomena. Elsevier.
- Rollett et al. (1989) Rollett, A., Srolovitz, D.J., Doherty, R., Anderson, M., 1989. Computer simulation of recrystallization in non-uniformly deformed metals. Acta Metallurgica 37, 627–639.
- Roters et al. (2010) Roters, F., Eisenlohr, P., Hantcherli, L., Tjahjanto, D., Bieler, T., Raabe, D., 2010. Overview of constitutive laws, kinematics, homogenization and multiscale methods in crystal plasticity finite-element modeling: Theory, experiments, applications. Acta Materialia 58, 1152–1211.
- Sah et al. (1974) Sah, J., Richardson, G., Sellars, C., 1974. Grain-size effects during dynamic recrystallization of nickel. Metal Science 8, 325–331.
- Sakai (1995) Sakai, T., 1995. Dynamic recrystallization microstructures under hot working conditions. Journal of Materials Processing Technology 53, 349–361.
- Sakai et al. (2014) Sakai, T., Belyakov, A., Kaibyshev, R., Miura, H., Jonas, J.J., 2014. Dynamic and post-dynamic recrystallization under hot, cold and severe plastic deformation conditions. Progress in Materials Science 60, 130–207.
- Sakai and Jonas (1984) Sakai, T., Jonas, J.J., 1984. Overview no. 35 dynamic recrystallization: Mechanical and microstructural considerations. Acta Metallurgica 32, 189–209.
- Sakai and Ohashi (1990) Sakai, T., Ohashi, M., 1990. Dislocation substructures developed during dynamic recrystallisation in polycrystalline nickel. Materials Science and Technology 6, 1251–1257.
- Salem et al. (2005) Salem, A., Kalidindi, S., Semiatin, S., 2005. Strain hardening due to deformation twinning in -titanium: constitutive relations and crystal-plasticity modeling. Acta Materialia 53, 3495–3502.
- Shen et al. (2004) Shen, C., Chen, Q., Wen, Y., Simmons, J., Wang, Y., 2004. Increasing length scale of quantitative phase field modeling of growth-dominant or coarsening-dominant process. Scripta materialia 50, 1023–1028.
- Simmons et al. (2000) Simmons, J., Shen, C., Wang, Y., 2000. Phase field modeling of simultaneous nucleation and growth by explicitly incorporating nucleation events. Scripta materialia 43, 935–942.
- Staroselsky and Anand (1998) Staroselsky, A., Anand, L., 1998. Inelastic deformation of polycrystalline face centered cubic materials by slip and twinning. Journal of the Mechanics and Physics of Solids 46, 671–696.
- Steinbach (2009) Steinbach, I., 2009. Phase-field models in materials science. Modelling and simulation in materials science and engineering 17, 073001.
- Steinmetz et al. (2013) Steinmetz, D.R., Jäpel, T., Wietbrock, B., Eisenlohr, P., Gutierrez-Urrutia, I., Saeed-Akbari, A., Hickel, T., Roters, F., Raabe, D., 2013. Revealing the strain-hardening behavior of twinning-induced plasticity steels: Theory, simulations, experiments. Acta Materialia 61, 494–510.
- Sun et al. (2000) Sun, S., Adams, B., King, W., 2000. Observations of lattice curvature near the interface of a deformed aluminium bicrystal. Philosophical Magazine A 80, 9–25.
- Suwa et al. (2007) Suwa, Y., Saito, Y., Onodera, H., 2007. Three-dimensional phase field simulation of the effect of anisotropy in grain-boundary mobility on growth kinetics and morphology of grain structure. Computational materials science 40, 40–50.
- Takaki et al. (2008) Takaki, T., Hirouchi, T., Hisakuni, Y., Yamanaka, A., Tomita, Y., 2008. Multi-phase-field model to simulate microstructure evolutions during dynamic recrystallization. Materials transactions 49, 2559–2565.
- Takaki et al. (2007) Takaki, T., Yamanaka, A., Higa, Y., Tomita, Y., 2007. Phase-field model during static recrystallization based on crystal-plasticity theory. Journal of Computer-Aided Materials Design 14, 75–84.
- Takaki et al. (2014) Takaki, T., Yoshimoto, C., Yamanaka, A., Tomita, Y., 2014. Multiscale modeling of hot-working with dynamic recrystallization by coupling microstructure evolution and macroscopic mechanical behavior. International Journal of Plasticity 52, 105–116.
- Thamburaja and Anand (2001) Thamburaja, P., Anand, L., 2001. Polycrystalline shape-memory materials: effect of crystallographic texture. Journal of the Mechanics and Physics of Solids 49, 709–737.
- Turteltaub and Suiker (2005) Turteltaub, S., Suiker, A., 2005. Transformation-induced plasticity in ferrous alloys. Journal of the Mechanics and Physics of Solids 53, 1747–1788.
- Vandermeer et al. (1997) Vandermeer, R., Jensen, D.J., Woldt, E., 1997. Grain boundary mobility during recrystallization of copper. Metallurgical and Materials Transactions A 28, 749–754.
- Vedantam and Patnaik (2006) Vedantam, S., Patnaik, B., 2006. Efficient numerical algorithm for multiphase field simulations. Physical Review E 73, 016703.
- Viswanathan and Bauer (1973) Viswanathan, R., Bauer, C., 1973. Kinetics of grain boundary migration in copper bicrystals with [001] rotation axes. Acta Metallurgica 21, 1099–1109.
- Wang and Li (2010) Wang, Y., Li, J., 2010. Phase field modeling of defects and deformation. Acta Materialia 58, 1212–1235.
- Wusatowska-Sarnek et al. (2002) Wusatowska-Sarnek, A., Miura, H., Sakai, T., 2002. Nucleation and microtexture development under dynamic recrystallization of copper. Materials Science and Engineering: A 323, 177–186.
- Zhang et al. (2008) Zhang, R.Y., Daymond, M.R., Holt, R.A., 2008. A finite element model of deformation twinning in zirconium. Materials Science and Engineering: A 473, 139–146.
- Zhao et al. (2013) Zhao, P., Li, J., Wang, Y., 2013. Heterogeneously randomized stz model of metallic glasses: Softening and extreme value statistics during deformation. International Journal of Plasticity 40, 1–22.
- Zhao et al. (2014) Zhao, P., Li, J., Wang, Y., 2014. Extended defects, ideal strength and actual strengths of finite-sized metallic glasses. Acta Materialia 73, 149–166.
- Zhou et al. (2010) Zhou, N., Shen, C., Mills, M., Wang, Y., 2010. Large-scale three-dimensional phase field simulation of -rafting and creep deformation. Philosophical Magazine 90, 405–436.