Identification of new transitions and mass assignments of levels in 143-153Pr
Abstract
The previously reported levels assigned
to 151,152,153Pr have recently been called into question
regarding their mass assignment.
Clarify the above questioned level assignments by
measuring -transitions tagged with A and Z in an in-beam
experiment in addition to the measurements from 252Cf spontaneous
fission (SF) and establish new spectroscopic information from to
in the Pr isotopic chain.
The isotopic chain 143-153Pr has been studied
from the spontaneous fission of 252Cf by using Gammasphere and
also from the measurement of the prompt -rays in coincidence
with isotopically-identified fission fragments using VAMOS++ and
EXOGAM at GANIL. The latter were produced using 238U beams on a
9Be target at energies around the Coulomb barrier. The
--- data from 252Cf (SF) and
those from the GANIL in-beam A- and Z-gated spectra were combined to
unambiguously assign the various transitions and levels in
151,152,153Pr and other isotopes.
A band of 3 new transitions added to the known level
in 145Pr, 9 new transitions in two new bands in 147Pr, 6 new
transitions in a new level scheme for 148Pr, two new bands with
17 new transitions in 149Pr and 2 new bands with 11 new
transitions in 150Pr were identified by using
-- and ---
coincidences and A and Z gated - spectra. The
transitions and levels previously assigned to 151,153Pr have been
confirmed by the (A,Z) gated spectra. Small changes have been made to
their original level schemes. The transitions previously assigned to
152Pr are now assigned to 151Pr on the basis of the (A,Z)
gated spectra. Two new bands with 20 new transitions in 152Pr and
one new band with 7 new transitions in 153Pr are identified from
the --- coincidence spectra and the
(A,Z) gated spectrum. In addition, new -rays are also reported
in 143-146Pr.
New levels of 145,147-153Pr have been
established, reliable mass assignments of the levels in
151,152,153Pr have been given in the present work and new
transitions have been identified in 143-146Pr showing the new
avenues that are opened by combining the two experimental approaches.
pacs:
23.20.Lv, 25.85.Ca, 21.10.-k, 27.70.+qI introduction
Studies of nuclear energy levels over long isotopic chains reveal structural changes as a function of N and provide important test of nuclear models. Spontaneous fission (SF) has provided a good approach to study nuclei over long isotopic chains Ham95 . In SF, the new transitions in a certain isotope are generally identified by gating on the known transitions in the particular isotope observed in -decay or by gating on known transitions in the complementary fission fragment, which are usually less neutron-rich and well studied in most of the cases. Usually, this procedure gives reliable identifications. However, in some cases, when the -spectrum is complex, the overlapping of transition energies in different isotopes could lead to a wrong mass identification of the bands.
Recently prompt ray spectroscopy of fully identified (A, Z) fission fragments produced in fusion-fission and transfer-fission reactions around the Coulomb barrier Nav ; Nav14 have been reported where due to the advantage of unambiguously identifying the fragments, the assignments of -rays to a particular A and Z are directly obtained. The combination of the traditional high fold gamma-coincidence method Ham95 and this method Nav ; Nav14 is expected to strengthen explorations and understanding of the evolution of nuclear structure as a function of both isospin and spin.
Historically, levels of several Pr isotopes have been identified from 252Cf and 248Cm SF Hwa00 ; Hwa10 ; Rza ; Liu . Only 151,153Pr were reported to have possible octupole correlations between parity-doublet bands Hwa10 . As mentioned in Ref. Hwa10 the octupole correlations in this region are associated with N = 1, j = 3 and = 3 orbital pairs such as near Z =56 and near N =88. The mass assignments of the previously reported levels assigned to 151,152,153Pr Hwa10 ; Liu have recently been called into question Mal . The -ray transitions and levels in 151,153Pr reported in the previous work Hwa10 were assigned to 152,154Pr respectively in Ref. Mal . The two bands proposed to be in 152Pr in Ref. Liu were assigned to 151,153Pr separately Mal . The assignment of gamma transitions to their corresponding nuclei is challenging due to the closely spaced transitions and the complexity of the spectra. In order to have an unambiguous identification of the nuclei in the A 150 mass region, two different techniques have been combined in the present work to investigate the high spin states and the possible octupole correlations for neutron rich Pr isotopes. In this paper, we provide new analysis of both 252Cf SF and 238U+9Be induced fission data Nav ; Nav14 with direct identification of fission fragment mass and Z to give reliable assignments of the levels and transitions in these Pr isotopes. New level schemes of 145,147-153Pr and new transitions in 143-146Pr are reported in the present work. The possibility of the occurrence of octupole correlations in the band structures of 149,151Pr are indicated.
II Experimental method
Two complementary methods have been used to investigate the level structure of Pr isotopes, which include both the unambiguous identification of the mass (A) and the proton number (Z) of the emitting fission fragment using a large acceptance spectrometer for in-beam measurements and the high fold data from spontaneous fission of a 252Cf source. These complementary methods have allowed us to identify new transitions and extend the level schemes to higher spins. In the present work the new transitions identified using (A, Z) gated ’singles’ prompt -ray spectroscopy did not require knowledge of the spectroscopic information of the complementary fragment. This allowed the study of very neutron rich nuclei, combining the unique in-beam identification with the high fold coincidences from SF. In the following, double gated coincidence spectra have a variable energy binning ranging from 0.7 keV/channel at 100 keV to 1 keV/channel at 1 MeV. The triple gated coincidence spectra have a fixed binning of 1.3 keV/channel.
II.1 238U + 9Be induced fission
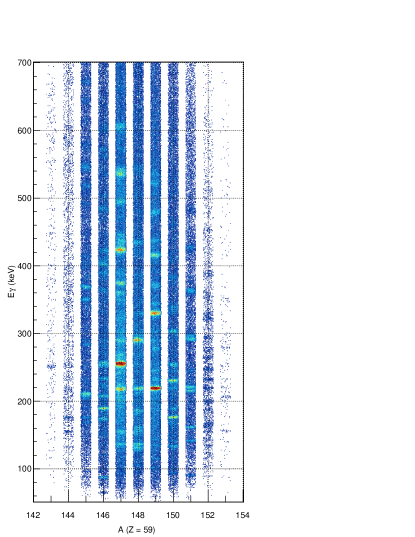
The measurements of transfer and fusion induced fission were performed at GANIL using a 238U beam at 6.2 MeV/u, with a typical intensity of 0.2 pnA, impinging on a 10-m thick 9Be target. The advantage of the inverse kinematics used in this work is that fission fragments are forward focussed and have a large velocity, resulting in both an efficient detection and isotopic identification in the spectrometer. A single magnetic field setting of the large-acceptance spectrometer VAMOS++ Rej11 , possessing a momentum acceptance of around 20%, placed at 20∘ with respect to the beam axis, was used to identify uniquely the fission fragments. The detection system (10.15 m2 ) at the focal plane of the spectrometer was composed of (i) a Multi-Wire Parallel Plate Avalanche Counter (MWPPAC), (ii) two Drift Chambers (x,y), (iii) a Segmented Ionization Chamber (E), and (iv) 40 silicon detectors arranged in a wall structure (Er). The time of flight (TOF) was obtained using the signals from the two MWPPACs, one located after the target and the other at the focal plane (flight path 7.5 m). The parameters measured at the focal plane [(x,y), E, Er, TOF] along with the known magnetic field were used to determine, on an event-by-event basis, the mass number (A), charge state (q), atomic number (Z), and velocity vector after the reaction for the detected fragment. Isotopic identifications of elements were made up to with a mass resolution of % Nav13 . The prompt rays were measured in coincidence with the isotopically-identified fragments, using the EXOGAM array ExoGaM consisting of 11 Compton-suppressed segmented clover HpGe detectors (15 cm from the target). The velocity of the fragment along with the angle of the segment of the relevant clover detector were used to obtain the -ray energy in the rest frame of the emitting fragment. Error on the -ray energies of the strong transitions is 0.5 keV, while for the weak transitions it could be as much as 1 keV. As compared to the results presented in Ref. Nav13 for the Zr isotopes the present work is the result of further improvements in the analysis especially improving the Z identification and also involves a larger data set. Figure 1 shows a two dimensional spectra of A vs ’singles’ Eγ for the Pr isotopes using such a data set which also allows one to view directly the evolution of the various transitions as a function of mass number.
II.2 252Cf spontaneous fission
The experiment with 252Cf was carried out at the Lawrence Berkeley National Laboratory(LBNL). A 62 Ci 252Cf source was sandwiched between two Fe foils of thickness 10mg/cm2. By using 101 Ge detectors of Gammasphere, the data were sorted into 5.71011 -- and higher fold events and 1.91011 --- and higher fold coincident events. These coincident data were analyzed by the RADWARE software package Rad . Gamma-ray energies of the strong transitions have errors of 0.1 keV while the errors on the weak transitions could be as much as 0.5 keV.
Another similar experiment was performed earlier at LBNL by using 72 Ge detectors of Gammasphere with a 28 Ci 252Cf source. Less -- and higher fold coincidence events were collected in this experiment but the data were built according to several discrete coincidence time windows ranging from 4ns to 500ns of the -rays Hwa98 ; Hwa03 .
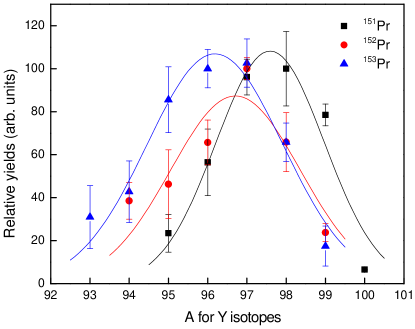
To independently confirm the mass assignments obtained above (Fig. 1), the relative yield curves of the yttrium partner isotopes coincident with 151,152,153Pr were measured. Fig. 2 is a set of Y yield curves measured by double or triple gating on transitions in 151-153Pr. The intensity summations of all the observable transitions which directly feed the ground state were used as a representative of the respective Y yields. The 97Y isotope has an isomeric state at a level energy of 667.5 keV (1.17s). Therefore, the intensity summation of two transitions (668.6 and 989.9 keV), which feed the 667.5 keV state, was used instead. In the 252Cf binary spontaneous fission, a pair of correlated partners is produced and followed by neutron emission after fission. The yield is generally maximized at the 3n or 4n channel Wah In Fig. 2, the highest yields were populated at around 98,97,96Y for 151,152,153Pr respectively, which are all 3n reaction channels for these Pr isotopes. Further Gaussian fitting analysis for the curves indicates that the fitting peaks for 151,152,153Pr are located at the respective 3.4, 3.3 and 2.8n channels. These yield distribution curves of the Y partner isotopes are consistent with the mass assignments of levels in 151,152,153Pr.
III Experimental results
In this section new transitions for 143-147Pr are reported using in-beam fission whereas the new level schemes of 145,147-153Pr were obtained by combining both the data sets.
III.1 143Pr
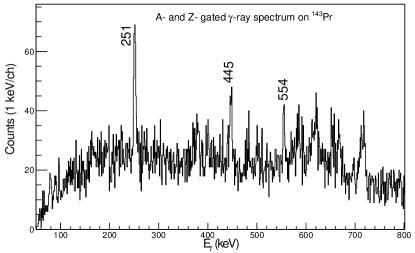
The A- and Z- gated -ray spectrum on 143Pr is shown in Fig. 3. Three new transitions 251(1),445(1) and 554(1) keV were identified. Other transitions are not labelled.
III.2 144Pr
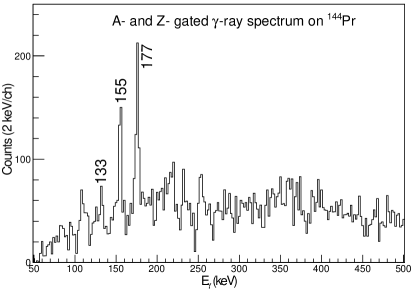
The A- and Z- gated -ray spectrum on 144Pr is shown in Fig. 4. The 133(1) keV peak could be the 133.5 keV transition identified in 144Ce -decay Dal . It should be pointed out that the unbiased ’singles’ nature of the data allows the identification of low multiplicity transitions seen in beta decay. In addition two new transitions 155(1) and 177(1) keV were also identified. Due to the complexity of the spectrum and lack of coincidences in this odd-odd nucleus, other transitions above 200 keV are not labelled and no level scheme is presented.
III.3 145Pr
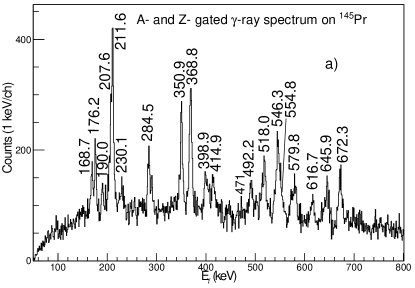
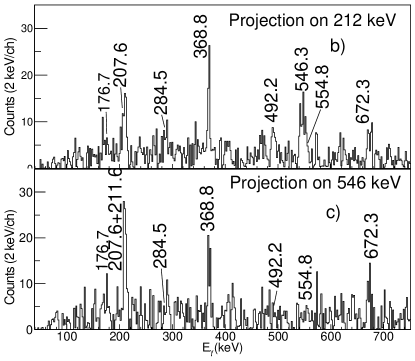
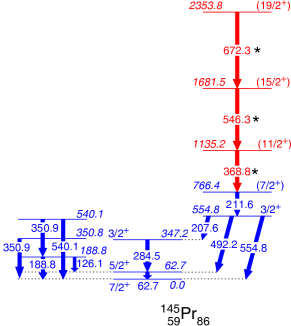
The A- and Z- gated -ray spectrum on 145Pr is shown in Fig. 5(a). The 207.6, 211.6, 284.5 and 492.2 keV peaks were previously identified in 145Ce -decay Bau . The 350.9 keV peak could be an overlap of a 350.9 keV transition (decay from 350.9 keV level to the ground state seen in -decay) and another 350.9 keV transition (decay from 540.1 keV level to a 188.8 keV level in -decay) identified in -decay Bau . Fig. 5(b) and (c) shows -ray spectra gated on the 211.6 keV and 546 keV transitions respectively. In these spectra, the coincident 204.0, 207.6, 368.8, 492.2, 546.3 and 672.3 keV transitions can be seen. From the energy spacing of the 211.6, 368.8, 546.3 and 672.3 keV transitions and the intensities shown in Fig. 5(a), these -rays are possibly E2 transitions in a rotational band. Thus, spins and parities of levels in this band are tentatively assigned. The level scheme for 145Pr is shown in Fig. 6. It should be pointed out that in the beta decay measurements the 211.6 is weak whereas in the present work it is very intense, showing the complementarity of the in-beam and decay work. There is coincidence evidence in the (A, Z) gated data for a 350-415 keV cascade feeding a 168 keV transition. It is not definitive that this cascade feeds into the 207-212 cascades, so it is not placed in the level scheme. The (A, Z) gated coincidence data (Fig. 5) indicate the 176.7 keV transition is in coincidence with the 207-212-284-368-546 keV cascade, but it is not clear where to place it. The observed 190.0, 230.1, 518.0, 579.8, 616.7 keV transitions are also new but we have no coincidence data to place them.
III.4 146Pr
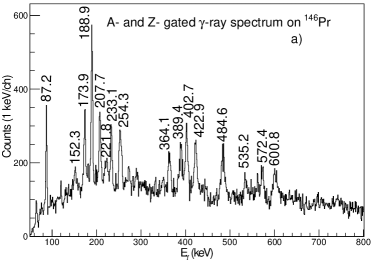
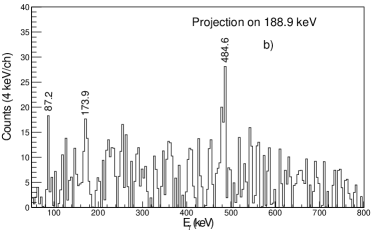
The A- and Z- gated -ray spectrum on 146Pr is shown in Fig. 7(a). The 87.2 keV transition can be identified with that previously known in 146Ce -decay Yam80 . Fig. 7(b) is a spectrum gated on the 188.9 keV transition. In this spectrum, the coincident 87.2, 173.9 and 484.6 keV transitions can be seen. With only these data it was not possible to build a level scheme.
III.5 147Pr
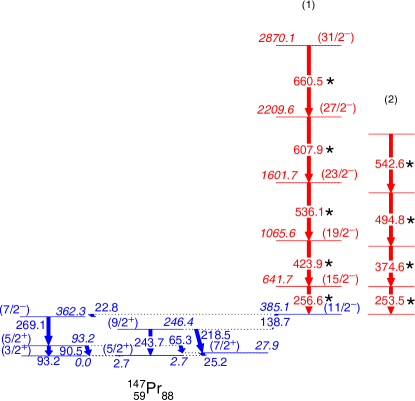
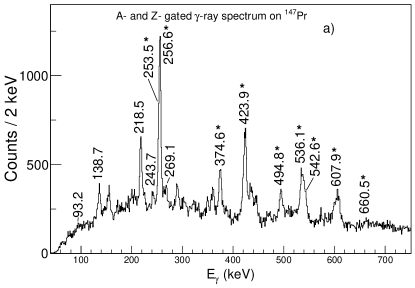


The new level scheme for 147Pr is shown in Fig. 8. In this case, the known transitions were previously observed in the -decay of 147Ce Man ; Gre . The ground state, 2.7, 27.9, 93.2 and 246.4 keV levels were tentatively proposed to have positive parity Man . The 363.3 keV level was proposed to have a negative parity Man . The (A, Z) gated spectrum is shown in Fig. 9, where evidence for a high spin band is seen. A new band is assigned to 147Pr by observing the -rays in coincidence with the 138.7, 218.5 and 243.7 keV transitions. A partial coincident -ray spectrum obtained with 252Cf SF data is shown in Fig. 10. In this spectrum with gate on a previously known transition and the strongest transition in Fig. 9, one can clearly see the known 218.5 and 243.7 keV transitions, new 423.9, 536.1, 607.9 and 660.5 keV transitions and the Y partner transitions. Note the 179.2 keV transition labeled in the spectrum is a new transition in 100Y. The work including the new level scheme of 100Y will be published later. These new transitions in 147Pr are confirmed in the (A, Z) gated spectrum on 147Pr (Fig. 9). The 2.7 and 25.2 keV transitions are not observed in the current work because the and cube data cut off the energy from 33.3 keV. The 66 and 72 keV transitions in this double gate come from the coincidence of the 138 keV transition in 107Tc. The 103 keV transition in this gate in Fig. 10 is caused by the 138 and 255 keV transitions in 103Mo. These three contamination transitions are not seen in the 256.6-423.9 keV gated spectrum, so are not in 147Pr. The time gated data from 252Cf SF indicate a short lifetime (20ns) of the 385.7 keV level. However, since no lifetime of this level was reported by Mantica et al. in -decay work Man , there might be a very low energy transition between the 138.7 and 256.6 keV transitions. This possible short lifetime would also explain the rather low intensity of the 138.7 keV transition in the prompt (A, Z) gated spectrum. Such a loss of intensity has already been found in the case of the neutron rich Zr isotopes Nav13 . The gated spectrum on the 374 keV transition of (A, Z) gated data shows evidence for a 253-374-495-542 cascade as seen in Fig. 9 (c). This cascade is also confirmed by the 252Cf SF data, but not in coincidence with any other transitions reported in 147Ce -decay in Ref. Man ; Gre . Thus, level energy of this cascade is not placed in the level scheme. Other unlabeled transitions identified in Fig. 9 (155, 290, 343, 360, 435, and 443 keV) could not be placed in the level scheme for lack of coincidence data.
Previously, internal conversion coefficient of the 138.7 keV transition was not measured in -decay Man . In the current work, exp of the 138.7 keV transition can be measured from the intensities of the 138.7, 218.5 and 243.7 keV transitions in the 256/424 double gate with the internal conversion of the relevant transitions included. The exp value obtained is 0.15(3), which is consistent with a theoretical E1 transition (0.10) but not M1(0.51) or E2(0.67). Thus, band (1) is proposed to have a negative parity and the band-head could be either the 362.3 or 385.1 keV level. From the comparison with the negative parity bands in 145La Urb96 ; Zhu99 and 149Pm Jon96 , the 256.6 keV ray is more likely to be a transition decaying from 15/2- to 11/2-. Previously, the ground state, 2.7, 27.9, 93.2 keV levels were tentatively assigned to 3/2+, 5/2+, 7/2+ and 5/2+, respectively, in -decay work Man according to the decay pattern. The 218.5 and 269.1 keV transitions were assigned as M1 and E1, respectively, according to internal conversion measurement Man . Assigning 11/2- to 385.1 keV level, the 246.4 keV level is proposed to be 9/2+. The 362.3 keV level is then 7/2- because the 11/2- level decays to this state. Note that 11/2- and 7/2- are the lowest two negative levels (¡250 keV) in the particle-plus-triaxial rotor model (PTRM) calculation in Ref. Man . In contrast, the adopted levels in Ref. Nic tentatively assigned the ground state, 2.7, 27.9, 93.2 and 362.3 keV states to 5/2+, 3/2+, 5/2+, 7/2+ and 5/2-, respectively, based on the PTRM positive parity calculation in Ref. Man . However, this 5/2- assignment does not agree with the lowest negative parity levels as the already noted. Thus considering both the negative and positive parity calculations, we agree with the spins and parities assigned in Ref. Man and not with Ref. Nic for the lowest states.
III.6 148Pr
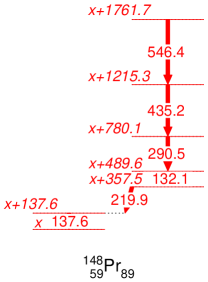
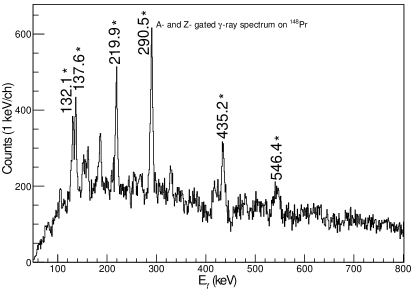

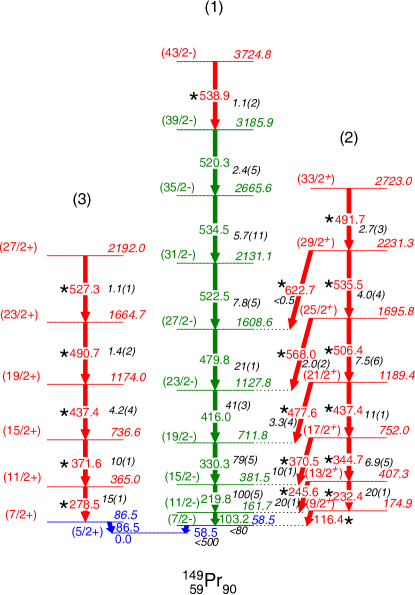
The new level scheme for 148Pr is shown in Fig. 11. In this case, all transitions are newly identified. The new transitions are seen in the mass-Z gated spectrum of 148Pr (Fig. 12). None of transitions from the -decay of 148Ce Gre ; Ara ; Koj are observed in this work. A partial coincident -ray spectrum from the 252Cf data is shown in Fig. 13. In this spectrum with gates on 132.1 and 290.5 keV transitions, one can clearly see the 137.6, 219.9, 435.2 and 546.4 keV new transitions and the Y partner transitions. The order of these new transitions are placed based on the intensities and the similarity to 150Pr. In 252Cf SF data, the intensity ratios of 137.6/132.1 and 219.9/132.1 decrease about 80 as the time coincidence window decreases from 500ns to 8ns. In the contrast, the ratio of the 132.1, 290.5, 435.2 and 546.4 keV transition intensities remain almost the same. Thus, the 219.9 and 137.6 keV transitions are placed at the bottom and a lifetime of the order of a hundred ns is proposed for the level which the 132.1 keV transition feeds. This is consistent with the non observation of the 219.9 keV transition in coincidence with 290.5 keV in the prompt ray spectrum obtained using the (A, Z) gate where the prompt gamma rays are sensitive only to states with lifetimes shorter than 2 ns.. In addition spectra obtained in A/Z coincidence with 219.9 keV suggest the existence of another band consisting of 219.9 and 329 keV transitions. But we cannot confirm this cascade in SF data. Triple gates (137.6-132.1-290.5 and 219.5-132.1-290.5 keV) show no evidence for the strong 105, 121, 195 or 289 keV transitions seen in -decay. Thus we conclude none of the low spins (1,2) states seen in -decay are feed by the cascade seen in Fig. 12. This cascade could feed the 2 mins 4- isomer at 77 keV Koj .
III.7 149Pr
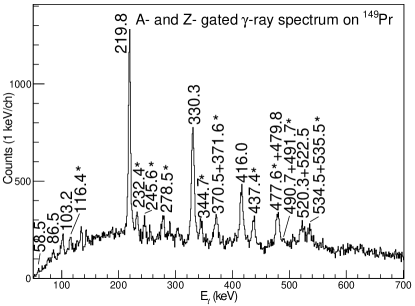


The new level scheme for 149Pr is shown in Fig. 14. In this case, the 58.5 and 86.5 keV transitions were previously observed in the -decay of 149Ce Pfe ; Keys . The band (1) in Fig. 14 was previously reported in Ref. Hwa00 . In Fig. 15, previously reported band (1) transitions and new transitions in band (2) and (3) are seen in the (A, Z) gated spectra. These spectra were important in guiding SF ray coincidence spectra analysis to identify the new band (3). These two new bands (2) and (3) are established in the present work by observing the coincidence between the -rays in these bands and the 86.5 or 58.5 keV transition in 252Cf SF data. A partial coincident -ray spectrum is shown in Fig. 16(a). In this spectrum with a gate on two new transitions in band (3), one can clearly see the 86.5 keV transition, three other new transitions and Y partner transitions. Another partial coincident -ray spectrum is shown in Fig. 16(b). In this spectrum with gate on two new transitions in band (2) one can clearly see the 58.5, 103.2 keV transitions, six other new transitions and Y partner transitions. By gating on these new transitions and analyzing the relative -transition intensities, these two new bands are proposed for 149Pr. The 252Cf data also shows some weak evidence for the coincidences between the 103.2 and 232.4, 219.8 and 344.7 keV transitions, respectively. The possible low energy 13.2 (174.9 to 161.7) and 25.8 (407.3 to 381.5) keV transitions are not indicated in the level scheme in Fig. 14.
Spins and parities of levels in band (1) were tentatively assigned in Ref. Rza by an internal conversion coefficient measurement and theoretical calculations. Those results are adopted in this paper. Based on the regular energy spacings and -ray intensities, the new level at 3724.8 keV is assigned as 43/2-.
The total internal conversion coefficient of the 86.5 keV transition in 149Pr was measured from the intensity ratio between 86.5 and 278.5 keV transition in the coincident spectrum gated on 371.6 and 437.4 keV transitions above them. The value was obtained to be 1.63(22), and is in agreement with the theoretical calculated value bri of 1.96 for a M1 transition but not with 3.58 for an E2 transition.
Quasiparticle-rotor model (QPRM) calculations Rza ; Gab suggest a 5/2[413] configuration for the 149Pr ground state level. The lowest three exited level energies at 86.5, 365.0, 736.6 keV of band (3) in 149Pr are also reasonably consistent with the QRPM calculations of 7/2+, 11/2+ and 15/2+ for the states at 87, 342 and 708 keV, respectively in Ref. Rza . Therefore, the spins and parities of exited states in band (2) are tentatively assigned as 7/2+, 11/2+, 15/2+, 19/2+, 23/2+ and 27/2+ in the present work.
Spins and parities of the levels in band (2) are tentatively assigned in Fig. 14 based on the structure similarity to the signature s=+i octupole bands (1) and (2) in Ref. Zhu99 . When octupole deformation or octupole correlations are strong, one expects a symplectic quantum number s=i, two bands of opposite parity with the spin show in Fig. 14 and strong E1 transitions between the two bands as found Naza . Note that QPRM calculation in Ref. Rza indicates that this band is unlikely to be another signature of band (1). Further analysis is included in the discussion part.
III.8 150Pr
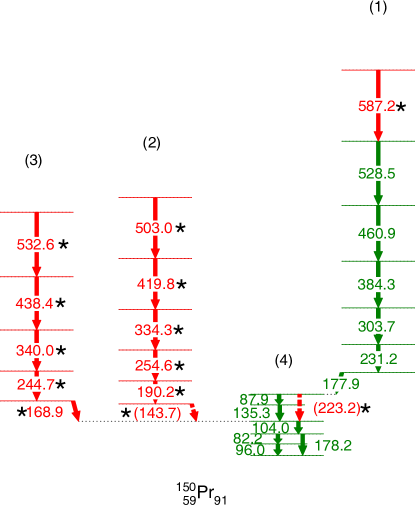
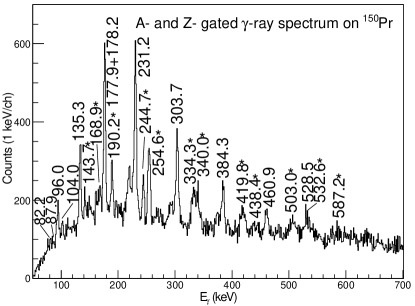
The new level scheme for 150Pr is shown in Fig. 17. Bands (1) and (4) were previously assigned to 150Pr in Ref. Hwa00 ; Hwa10 from the SF of 252Cf. In this earlier work, the relative yield ratios of partner Y isotopes were measured Hwa10 . The transitions previously assigned to 150Pr along with several new ones are shown in the (A, Z) gated spectrum (Fig. 18). Fig. 19(a) shows a coincidence spectrum double-gated on the new 190.2 and 254.6 keV transitions. Fig. 19(b) shows a coincidence spectrum double gated on the new 244.7 and 340.0 keV transitions.The previously known -transitions of 96, 82.2 and 104.0 keV of 150Pr and the -transitions in the partner Y isotopes can be seen in these spectra. Therefore, these new transitions are assigned to 150Pr in the present work. The newly observed 334.3, 419.8 and 503.0 keV transitions are coincident with the new 190.2 and 254.6 keV transitions in Fig. 19(a). Also, the new 438.4 and 532.6 keV transitions are coincident with the new 340.7 and 244.7 keV transitions in Fig. 19(b). By using these coincidence relationships in multiple gates, bands (2) and (3) were found as shown in Fig. 17. The 143.7 keV transition is dashed because the intensity is weaker than that of the 190.2 keV transition.
III.9 151Pr
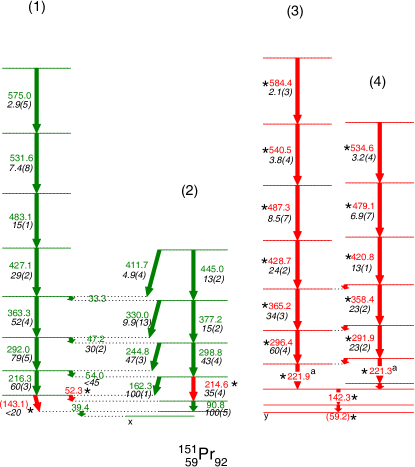
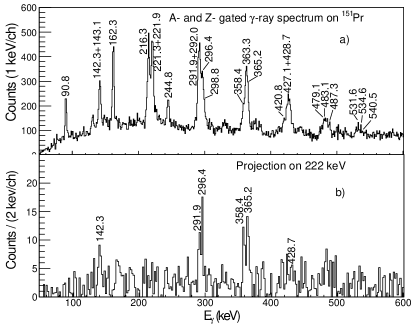


The new level scheme for 151Pr is shown in Fig. 20. The 151Pr A and Z gated spectra obtained from 238U + 9Be induced fission are shown in Figs. 21(a) and (b). Bands (1) and (2) in Fig. 20 were assigned previously to 151Pr in Ref. Hwa10 . In this earlier work, the relative yield ratios of partner Y isotopes were measured. However, bands (1) and (2) were assigned to 152Pr, by Malkiewicz et al. Mal . The previously reported Hwa10 -transitions in bands (1) and (2) are confirmed from the mass and Z gated spectrum in Fig. 21(a). In the present work, the 204.2 and 41.9 keV transitions in Ref. Hwa10 are replaced with the new 214.6 and 52.3 keV transitions in bands (1) and (2) of Fig. 20. Also, a possible new 143.1 keV transition is added. Previously, bands (3) and (4) were assigned to 152Pr in Ref. Liu .
Then band (3) was assigned to 151Pr and band (4) to 153Pr from the SF work of 248Cm and 252Cf Mal . Now band (3) and band (4) in Fig. 20 are assigned to 151Pr in the present work because the 142.3, 221.3+221.9, 296.4, 291.9, 365.2 and 358.4 keV transitions are seen in the 151Pr mass and Z gated spectra in Figs. 21(a) and 21(b). The 221.3 and 221.9 keV transitions were reported earlier as one 221.9 keV transition Liu . Later, the 142.3 keV transition in Ref. Liu was separated into 142.1 and 141.6 keV transitions in Ref. Mal . The 221.9 keV transition in Ref. Liu was separated into 221.8 and 221.0 keV transitions in Ref. Mal . In this paper, a shift of about 0.6 keV of the 221.9 keV peak has been confirmed by comparing the gates between bands (3) and (4), for example, double gates on 296.4 and 356.2 keV in band (3), 291.9 and 358.4 keV in band (4), triple gates on 296.4,356.2 and 428.7 keV in band (3), 291.9, 358.4 and 420.8 keV in band (4). But no visible energy difference of the 142.3 keV transition is seen when comparisons are set between any of the gates in bands (3) and (4). Thus, two different 221.9 and 221.3 keV transitions are proposed but there is only one 142.3 keV transition in the level scheme. In the present work all of bands (1), (2), (3) and (4) are definitely assigned to 151Pr, as shown Fig. 20. Further analysis about the mass assignment will be presented in the 152,153Pr and discussion sections.
Fig. 22(a) is a coincidence spectrum from 252Cf SF data by gating on 216.3 and 292.0 keV transitions showing the new 52.3 and 143.1 keV transitions. The peak around 40 keV is an overlap of a 39.4 keV transition and 41.0 keV Pr X-ray. Therefore, the energy of the 39.4 keV transition has a relative large uncertainty and might range from 39 to 42 keV. If the 39.4 keV transition is the same as the 38.9 keV one reported in -decay work Koj , bands (1) and (2) would decay to the ground state. However, since the energy of this transition has a large uncertainty, an x keV level is used in Fig. 20. The 143.1 keV transition is much weaker than the 90.8 keV one and is bracketed in the level scheme. Fig. 22(b) is a coincidence spectrum from 252Cf SF data triple gated on 298.8, 377.2 and 445.0 keV transitions. The 204.2 keV transition is not seen compared to 214.6 keV in this gate, which suggest some contamination at 204.2 keV in the spectrum of the previous work (Ref. Hwa10 ). Thus, the 204.2 keV transition is replaced by the 214.6 one in the present work.
Fig. 23(a) is a coincidence spectrum from 252Cf SF data by gating on 221.9, 296.4 and 365.2 keV transitions. The 428.7, 487.3, 540.5 and 584.4 keV transitions in band (3) can be seen. Fig. 23(b) is a coincidence spectrum from 252Cf Sf data by gating on 221.3, 291.9 and 358.4 keV transitions. The 420.8, 479.1 and 534.6 keV transitions in band (4) can be seen. The 252Cf SF data also show coincidence of the 296.4 and 358.4 keV transitions, as well as the 365.2 and 420.8 keV transitions, but interband transitions linking bands (3) and (4) are not observed in the current work. These coincidences indicate the existence of a very low energy transition to lift up band (4) in 151Pr.
The analysis result for transition intensities are also labeled in the level scheme. The intensities have been separated into two parts. The intensities of transitions in band (1) and band (2) are normalized to that of the 162.3 keV transition and those in band (3) and band (4) are normalized to the summation of the 221.9 and 221.3 keV transition intensities.
Previously, internal conversion measurements established the 47.2 and 54.0 keV transitions as E1 and 90.8 keV one as M1 Hwa10 . The value of the 90.8 keV transition was obtained from the 90.8 and 292.0 keV transition intensities in the coincidence spectrum gated on 216.3 and 363.3 keV in Ref. Hwa10 . This measurement did not include the contribution of the 47.2 keV transition. If this contribution is taken into account, the internal conversion value will increase by a factor of 20%, which will make it closer to the theoretical M1 value. Those corrections can be seen in the erratum Ref. Hwaer . The branching of the 143.1 keV transition is very small (see Fig. 22(a)) and does not change the result much. The exp value of the 54.0 keV was obtained from the 54.0, 162.0 and 204.0 keV transition intensities in the 292.0 and 363.3 keV double gate in Ref. Hwa10 . This measurement is also questionable because the 204.0 keV transition is not confirmed in the current work. The peak around 54.0 keV in the 292.0 and 363.3 keV double gate is a overlap of the 52.3 and 54.0 keV transitions. Thus, the intensity as well as the exp value of the 54.0 keV transition cannot be accurately obtained in the present work. The exp value of the 52.3 keV can be obtained from the 52.3 and 90.8 keV transition intensities in the 216.3 and 292.0 keV double gate. The value is 3.5(9), which lies between the theoretical value of E1(1.4) and M1(8.3). However, the 216/292 gate might be interfered by the 214.6 keV transition so that the error of the exp value of the 52.3 keV would be much higher.
III.10 152Pr

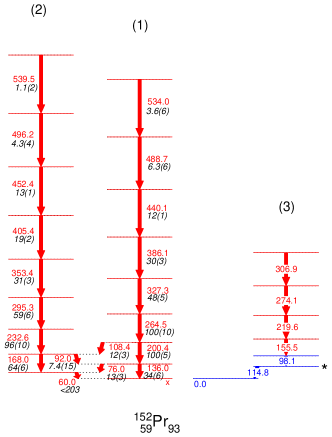
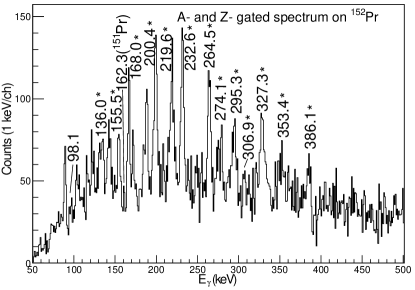
The new level scheme for 152Pr is shown in Fig. 24. All levels and transitions are newly established in the present work except for the 114.8 and 98.1 keV transitions, which were identified in 152Ce - decay Yam . Fig. 25 shows the 152Pr A- and Z- gated ’single’ spectrum from 238U + 9Be induced fission data, illustrating the evidence for the mass assignment for these three new bands. All the strong transitions in these three bands can be seen. As can be seen from the figure the 221.3, 221.9, 358.4 and 365.3 keV transitions are not seen in A = 152 spectrum (Fig. 25) as compared to A = 151 gated spectra (Figs. 21(a),(b)). This confirms that 142.3-221.9-296.4 (151Pr) and 142.3-221.3-292.0 keV cascades do not belong to 152Pr as previously reported in Ref. Liu but in 151Pr and the latter does not belong to 153Pr as recently reportedMal . The position of the 162.3 keV transition in 151Pr (100 relative intensity) is labeled in Fig. 25. The absence of the 162.3 keV peak (the weak peak seen in the valley is at 160.5 keV) indicates that bands (1) and (2) assigned to 151Pr belong there and not to 152Pr as recently reported in Ref. Mal . These facts give further evidence for the mass assignment for the four bands in 151Pr in the present work. Further analysis of the mass assignments will be reported in the 153Pr. The relatively strong 90 and 188 keV peaks in Fig. 25 are not seen in any of the SF coincidence data connected to bands (1) and (2) in Fig. 24. The SF coincidence data do indicate a 188-279-322-385 keV cascade which could form another band in 152Pr.
Fig. 26(a) shows a coincidence spectrum from the 252Cf SF data by double gating on 264.5 and 327.3 keV transitions. The 136.0, 200.4, 386.1, 440.1, 488.7 and 534.0 keV transitions in band (1) and 60.0, 76.0, 92.0, 108.4 keV linking transitions between band (1) and band (2) can be seen. Fig. 26(b) shows a coincidence spectrum from the 252Cf SF data by triple gating on 232.6, 295.3 and 353.4 keV transitions, where 168.0, 405.4, 452.4, 496.2 and 539.5 keV transitions in band (2) and 60.0, 76.0, and 92.0 linking transitions between band (1) and band (2) can be seen. Fig. 26(c) shows a coincidence spectrum from 252Cf SF data by triple gating on 219.6, 274.1 and 306.9 keV transitions, where 98.1 and 155.5 keV transitions in band (3) can be seen. The 114.8 keV transition is not observed in the current work since the electronic coincidence time window for the 252Cf fission experiment is about 1 s, which is relatively smaller than the 4.1 s life time (Yam ) of the 114.8 keV level. For prompt--ray data, the present GANIL experimental setup is sensitive only to states with lifetimes shorter than ns. The result for transition intensities are also given in the level scheme.
III.11 153Pr
The new level scheme for 153Pr is shown in Fig. 27. Band (1) in Fig. 27 was assigned previously to 153Pr in Ref. Hwa10 , but was assigned, recently, to 154Pr from the SF work of 248Cm and 252Cf Mal . In the earlier work, the relative yield ratios of partner Y isotopes were measured Hwa10 . The 153Pr mass and Z gated spectra obtained from 238U + 9Be induced fission are shown in Fig. 28. The previously reported -transitions of 88.0, 156.7, 206.6, 279.5, 351.1, 417.8 and 477.9 keV transitions in 153Pr Hwa10 are confirmed from the mass and Z gated spectrum shown in Fig. 28. The 142.3, 221.3 and 292.2 keV cascade previously assigned to 153Pr by Malkiewicz et al. Mal is not confirmed by the mass and Z gated spectrum in Fig. 28. The position of the 292.2 keV transition is shown in Fig. 28 to illustrate its non-observation. Instead, a new cascade with 143.1, 221.9 and 297.7 keV transition can be seen in the spectrum. Further analysis about the mass assignment will be reported in the discussion part.
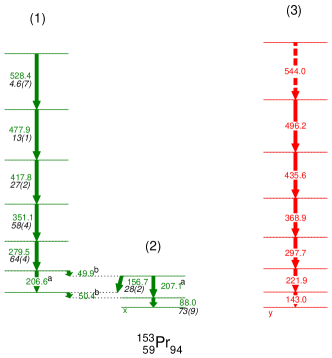
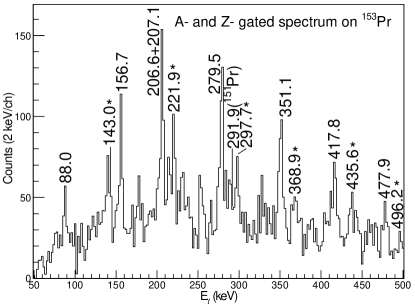

The previously assigned 51.7, 227.8 and 277.7 keV transitions are not placed in Fig. 27 because these transitions are not clearly seen in the 252Cf SF data. Furthermore, the 227.8 keV transition is not observed in the 206.6 and 969.1 keV (a fission partner 95Y transitionUrb09 ) double gate and the 206.6 and 417.8 keV double gate. Thus, the previously reported 13/2 level and its three transitions are tentatively removed from the level scheme. The results for transition intensities are shown in the level scheme. Previous internal conversion measurements established the 50.4 keV transition as E1 and the 88.0 keV one as M1Hwa10 . The value of the 50.4 keV transition is questionable because the 206.6/351.1 keV gate used in Ref. Hwa10 might be interfered by the 207.1 keV transition. If one approximately assumes the 49.9 and 50.4 keV transitions have the same exp value, the 2.3(7) value in Ref. Hwa10 should be used, not 3.2(9) in the erratum Ref. Hwaer because the 227.8 keV transition is not confirmed in the current work. Fig. 29 shows a coincidence spectrum from 252Cf SF data by gating on the 221.9, 297.7 and 368.9 keV transitions. In this gate, four other -ray transitions in band (3) can be seen. The (A, Z) gated spectra were important in guiding the ray coincidence spectra analysis to identify new band (3).
IV discussion
| band 1 E2 (keV) | band 2 E2 (keV) | band 3 E2 (keV) | |||||||
|---|---|---|---|---|---|---|---|---|---|
| 147Pr | 149Pr | 151Pr | 153Pr | 149Pr | 151Pr | 153Pr | 149Pr | 151Pr | 153Pr |
| 103 | 142 | 143 | |||||||
| 256 | 220 | 216 | 207 | 232 | 215 | 207 | 222 | 222 | |
| 424 | 330 | 292 | 280 | 345 | 299 | 279 | 296 | 298 | |
| 536 | 416 | 363 | 351 | 437 | 377 | 372 | 365 | 369 | |
| 608 | 480 | 427 | 418 | 506 | 445 | 437 | 429 | 436 | |
| 660 | 523 | 483 | 478 | 536 | 491 | 487 | 496 | ||
| 535 | 532 | 528 | 492 | 527 | 541 | 544 | |||
| 520 | 575 | 584 | |||||||
| 539 | |||||||||
| band 1 E2 (keV) | band 2 E2 (keV) | band 3 E2 (keV) | |||||||
| 117 | 80 | 79 | |||||||
| 168 | 110 | 76 | 73 | 113 | 84 | 74 | 76 | ||
| 112 | 86 | 71 | 71 | 92 | 78 | 93 | 69 | 71 | |
| 72 | 64 | 64 | 67 | 69 | 68 | 65 | 64 | 67 | |
| 52 | 43 | 56 | 60 | 30 | 54 | 58 | 60 | ||
| 12 | 49 | 50 | -44 | 36 | 54 | 48 | |||
| -15 | 43 | 43 | |||||||
| 19 | |||||||||
Mantica et al. showed that the quadrupole deformation increases gradually from 145Pr to 149Pr Man . The current work implies 151,153Pr have similar but larger deformation than 149Pr based on the decreasing E2 energies and E2 values shown for their bands (1) in Table 1. A comparison of the proposed E2 transition energies and transition energy spacing in bands (1), (2) and (3) in 147,149,151,153Pr is shown in Table 1. The similarity of the transition energies indicates similar structures of the nuclei. Moreover, bands (1) and (3) in 151,153Pr are almost identical both in transition energy (less than 10 keV) and intensity up to very high spins. Such kind of almost identical bands were also observed in 152,154,156Nd Smi , 153,155,157Pm Ran , 156,158,160Sm Zhu , 155,157,159Eu Bur , 160,162,164Gd Jon respectively. This identical bands phenomenon occurs just after the phase transition from spherical to large deformed shape as N increases from 88 to 90 in this region. E2 energy shrinks more in 149Pr and bending takes place at high spin. In contrast, the E2 energies are similar and do not shrink as much in 151,153Pr, which indicates a relatively rigid rotor in these nuclei. Note that the E2 and E2 energies in bands (1), (2) and (3) in 150Pr are different to indicate that band (2) has a large deformation than bands (1) and (3). Note the E2 energies in band (1) of N=88 147Pr, Fig. 8 are 36, 94, 120, 128, 137 keV, respectively larger than in band 1 of N=90 149Pr where the differences are only 4 to 53 keV between 149Pr and 151Pr to indicate a phase transition here too. An internal conversion measurement in Ref. Hwa10 implied E1 interband transitions between band (1) and band (2) in 151Pr. Therefore, there could be a small octupole deformation or correlation in 151Pr and the similar cross transitions between bands (1) and (2) likewise suggest this in 149Pr. QPRM calculations for 149,151,153Pr have been discussed earlier in Refs. Rza ; Mal .
Pr nuclei in this region present serious challenges in assigning bands to particular odd-Z Nilsson orbitals. There are K=1/2 orbitals of both parities and large values near the Fermi energy. The odd-parity K=1/2-[550] has j=11/2 and the even parity K=1/2+ orbitals are a mix of g7/2 and d5/2. The odd-parity K=1/2 band will have large signature splitting, and the even parity K=1/2 bands can have either sign of signature splitting or near cancellation for certain admixtures.
The 368.8, 546.3 and 672.3 keV transitions in the new 3/2+ band in 145Pr are similar to the first three E2 transitions (397, 541 and 709 keV) in 144Ce. Therefore, the aligned angular momentum of this new band relative to the 144Ce core is around 3.03.5. Such comparison indicates the 3/2+ band in 145Pr is possibly originated from the g7/2 orbital.
As discussed in the previous part, band (1) in 147Pr is proposed to have a negative parity. The available orbital of negative parity in this region is h11/2. According to the PTRM calculations Man , 1/2-[550] band was proposed to be the low lying negative parity one. Note that the negative parity band (1) in 149Pr in the current work was also proposed to be 1/2-[550] from previous QPRM calculation Rza .
The band (2) in 149Pr does not match any configurations in the previous QPRM calculations which are mentioned here for completeness Rza . This band could form a s=i octupole band with band (1) if they have the opposite parity. Note that octupole correlation is not included in the QPRM calculation in Ref. Rza . Our potential-energy-surface calculation in the present work (more details in Ref. Naz ; Xu00 ; Xu02 ) shows medium octupole deformation (3=0.068) of 1/2-[550] configuration (band (1)). Although the previous QPRM calculations predicted this configuration does not have 100 amplitude (91 in Ref. Rza , 77 and 81 in Ref. Gab ), the octupole deformation may change the signature splitting of the 1/2-[550] band (1) in 149Pr. Furthermore, a small double backbending occurs in band (1) of 149Pr at 0.27 MeV while a little more distinct one occurs at about the same rotational frequency in band (2). As discussed in Ref. Hwa00 , cranked shell model calculations Zhu99 suggest that this backbending at 0.27 MeV originates from the alignment of a neutron pair and not a proton pair. Thus, band (2) in 149Pr can also be another signature of band (1). If bands (1) and (2) in 149Pr have the opposite parities, the average B(E1)/B(E2) ratio would be around 0.0510-6 fm-2. This value lies between the average B(E1)/B(E2) ratios of the octupole bands in 148Ce (0.8210-6 Che ) and 150Ce (0.0410-6 Zhu12 ) and is smaller than that of the positive branch of octupole bands in 147La (0.3810-6). These data suggest the importance of octupole correlations in 149Pr as found in 148Ce Jon . Note the predicted center of octupole deformation is that Z=56, N=88 Naza , so 147La with Z=57 and N=90 and 148Ce with Z=58 and N=90 are close to the center and have the expected large E1 strength. Here 149Pr with Z=59 and N=90 is more similar to 150Ce with Z=58, N=92, so the E1 strength decreases as one moves farther away from the center of Z=56 and N=88.
Spin and parity assignments of the bands in 151Pr and 153Pr are not placed in the present work because the E2 transition energies in these bands are quite similar. According to the QPRM calculation in Ref. Mal , 3/2-[541], 1/2+[420] and 3/2+[422] are proposed to be the three low lying states in 151,153Pr. If one assumes the bands (1) and (2) in 151Pr have the same configuration and parity, then only the theoretical prediction of the 3/2+[422] configuration in Ref. Mal can reproduce the signature splitting in bands (1) and (2). According to the statement in the previous part, the x keV level in 151Pr could be the 3/2- ground state. The x+182.5 keV level in band (1) in Fig. 20 would be 7/2+. Bands (3) and (4) in 151Pr could be 1/2+[420] or 3/2-[541] but 1/2+[420] is more likely, because no linking transitions are observed between bands (1,2) and (3,4) in the current work and bands (3) and (4) are more likely to decay to the 35.1 keV isomer. The y keV level could be the 1/2+[420] state. The configurations of bands in 153Pr can be assigned according to the level scheme similarity to 151Pr. However, such assignments cannot explain the absence of bands (2) and (4) in 153Pr. Also, our potential-energy-surface calculation reported here shows octupole deformation (3=0.043) of the 1/2+[420] configuration. If bands (1) and (2) in 151Pr have the opposite parity, they can form an octupole band. In the current work, band (1) is the strongest populated one. Thus, similar to the discussion in Ref. Mal , states in this band are possibly yrast and more likely to be the favored branch of the 3/2-[541]. In all, similar to the discussion of 149Pr, spins and parities of the bands in 151,153Pr still cannot be firmly assigned.
Potential-energy-surface calculations show tendencies toward both octupole deformation and triaxiality. The octupole Y3,0 deformation can give rise to parity doubling, and triaxiality can give so-called bands. Further theoretical and experimental work is needed.
V Conclusion
In conclusion, new bands in 145,147-150Pr have been reported; the previous questionable assignments of transitions and levels in 151,153Pr were clarified by A- and Z- gated spectra and yield curves; a new high spin level scheme for 152Pr has been established and confirmed by mass-Z gated spectra. Spins and parities of the levels in the new band in 149Pr have been tentatively assigned. New transitions have been identified in 143-146Pr. More work on both experiment and theory is needed to understand the nuclear structure of 147-153Pr well. The levels in 149,151Pr are similar to octupole structures. The bands in 151,153Pr are very similar in transition energies and E2, which indicates they are relatively rigid rotors. The long multiple high spin bands with increasing neutron number in the Pr isotopes provide interesting tests for nuclear model calculations. The unique combination of (A, Z) identified in-beam -rays and high fold data from a Cf source has opened new vista to study the evolution of nuclear structure as functions of spin and isospin. Further improvements in the sensitivity for fission fragment spectroscopy are planned using the next generation tracking detector AGATA combined with an improved VAMOS++ spectrometer at GANIL.
Acknowledgements.
The work at Vanderbilt University and Lawrence Berkeley National Laboratory are supported by the US Department of Energy under Grant No. DE-FG05-88ER40407 and Contract No. DE-AC03-76SF00098. The work at Tsinghua University was supported by the National Natural Science Foundation of China under Grant No. 11175095. The work at JINR was supported by the Russian Foundation for Basic Research Grant No. 08-02-00089 and by the INTAS Grant No. 03-51-4496. One of us (S.B.) acknowledges partial financial support through the LIA France-India agreement. We would like to thank J. Goupil, G. Fremont, L. Ménager, J. Ropert, C. Spitaels, and the GANIL accelerator staff for their technical contributions.References
- (1) J. H. Hamilton et al., Prog. Part. Nucl. Phys. 35, 635 (1995).
- (2) A. Navin et al. 5th Int. Conf. on “Fission and properties of neutron-rich nuclei, Sanibel 2012”, World Scientific, 2013.
- (3) A. Navin and M. Rejmund, McGraw-Hill Yearbook of Science and Technology, and the online edition AccessScience (2014) http://dx.doi.org/10.1036/1097-8542.YB140316 .
- (4) J. K. Hwang et al., Phys. Rev. C 62, 044303 (2000).
- (5) J. K. Hwang et al., Phys. Rev. C 82, 034308 (2010).
- (6) T. Rzaca-Urban et al., Phys. Rev. C 82, 067304 (2010).
- (7) S. H. Liu et al., Phys. Rev. C 84, 044303 (2011).
- (8) T. Malkiewicz et al., Phys. Rev. C 85, 044314 (2012).
- (9) M. Rejmund et al., Nucl. Inst. Meth. Phys. Res. A 646,184 (2011).
- (10) A. Navin et al., Phys. Lett. B 728, 136 (2014).
- (11) J. Simpson et al., Acta Physica Hungarica, New Series, Heavy Ion Physics 11, 159 (2000).
- (12) D. C. Radford, Nucl. Instrum. Methods Phys. Res. A 361, 297(1995).
- (13) J. K. Hwang et al., Phys. Rev. C 57, 2250 (1998).
- (14) J. K. Hwang et al., Phys. Rev. C 67, 054304 (2003).
- (15) C. Wahl, At. Data. Nucl. Data Tables 39, 1 (1988).
- (16) J. Dalmasso et al., Nucl. Instrum. Methods 221, 564 (1984).
- (17) E. M. Baum et al., Phys. Rev. C 39, 1514 (1989).
- (18) H. Yamamoto et al., J. inorg. nucl. Chem. Vol. 42, 1539 (1980).
- (19) P. F. Mantica, J. D. Robertson, E. M. Baum, W. B. Walters, Phys. Rev. C 48, 1579 (1993).
- (20) W. Urban et al.. Phys. Rev. C 54, 945 (1996).
- (21) S. J. Zhu et al., Phys. Rev. C 59, 1316 (1999).
- (22) M. A. Jones et al., Nucl. Phys. A 609, 201 (1996).
- (23) N. Nica, Nucl. Data Sheets, 110, 749 (2009).
- (24) R. C. Greenwood et al., Nucl. Inst. Meth. Phys. Res. A 390,95 (1997).
- (25) N. K. Aras et al., Can. J. Chem. 61, 780 (1983).
- (26) Y. Kojima et al., Eur. Phys. J. A 19, 77 (2004).
- (27) B.Pfeiffer et al., J.Phys.(Paris) 38, 9 (1977).
- (28) U.Keyser et al., Proc.Intern.Conf. “Atomic Masses and Fundamental Constants, 6th, East Lansing 1979”, J.A.Nolen, Jr., W.Benenson Eds., Plenum Press, New York, p.485 (1980).
- (29) BrIcc v2.3S, conversion coefficient calculator ; T. Kibedi, T. W. Burrows, M. B. Trzhaskovskaya, P. M. Davidson, and C. W. Nestor Jr., Nucl. Instrum. Methods Phys. Res. A 589, 202 (2008).
- (30) Gabriela Thiamova et al., Phys. Rev. C 86, 044334 (2012).
- (31) W. Nazarewicz and P. Olanders, Nuclear Physics A 441, 420 (1985).
- (32) J. K. Hwang et al., Phys. Rev. C 82, 049901(E) (2010).
- (33) S. Yamada, A. Taniguchi, and K. Okano,J. Phys. Soc. Jpn. 64, 4047 (1995).
- (34) W. Urban et al., Phys. Rev. C 79, 044304 (2009).
- (35) A. G. Smith et al., Phys. Rev. Lett. 73, 2540 (1994).
- (36) J. Ranger et al., 81st Annual Meeting of the APS Southeastern Section, (2014).
- (37) S. J. Zhu et al., J. Phys. G: Nucl. Part. Phys. 21, L57 (1995).
- (38) D. G. Burke et al., Nucl. Phys. A 318, 77 (1979).
- (39) E. F. Jones et al., J. Phys. G: Nucl. Part. Phys. 30, L43 (2004).
- (40) Y. J. Chen et al., Phys. Rev. C 73, 054316 (2006).
- (41) S. J. Zhu et al., Phys. Rev. C 85, 014330 (2012).
- (42) W. Nazarewicz, R. Wyss, and A. Johnson, Nucl. Phys. A 503, 285 (1989).
- (43) F. R. Xu, W. Satuła, and R. Wyss, Nucl. Phys. A 669, 119 (2000).
- (44) F. R. Xu, P. M. Walker, and R. Wyss, Phys. Rev. C 65, 021303(R) (2002).