An ALMA Survey for Disks Orbiting Low-Mass Stars in the TW Hya Association
We have carried out an ALMA survey of 15 confirmed or candidate low-mass () members of the TW Hya Association (TWA) with the goal of detecting molecular gas in the form of CO emission, as well as providing constraints on continuum emission due to cold dust. Our targets have spectral types of M4-L0 and hence represent the extreme low end of the TWA’s mass function. Our ALMA survey has yielded detections of 1.3mm continuum emission around 4 systems (TWA 30B, 32, 33, & 34), suggesting the presence of cold dust grains. All continuum sources are unresolved. TWA 34 further shows 12CO(2–1) emission whose velocity structure is indicative of Keplerian rotation. Among the sample of known 7–10 Myr-old star/disk systems, TWA 34, which lies just 50 pc from Earth, is the lowest mass star thus far identified as harboring cold molecular gas in an orbiting disk.
Key Words.:
open clusters and associations: individual(TWA) — protoplanetary disks — stars: evolution — stars: pre-main sequence1 Introduction
Beginning with the identification of the TW Hya Association (TWA; Kastner et al. 1997) several stellar associations with ages 8–200 Myr have been identified in close proximity to the Earth (Zuckerman & Song 2004; Torres et al. 2008). These young moving groups serve as excellent laboratories to explore the evolution of stellar and planetary properties (e.g., Marois et al. 2008; Lagrange et al. 2010; Rodriguez et al. 2010). Of particular interest is the growing number of M-dwarfs identified as members of these groups and how their properties, such as disk lifetimes, compare with those of higher mass members.
Surveys of star forming regions have shown that protoplanetary disk lifetimes are on the order of 2–3 Myr (Williams & Cieza 2011). To date, we know only of a handful of pre-main sequence stars within 100 pc of Earth that, despite having ages of 5–20 Myr, still host disks that appear primordial in nature. These include TW Hya (8 Myr, 50 pc; Kastner et al. 1997), V4046 Sgr (20 Myr, 70 pc; Kastner et al. 2008), MP Mus (5–7 Myr, 100 pc; Kastner et al. 2010), and T Cha (5–7 Myr, 110 pc; Sacco et al. 2014). All of these are roughly solar-mass (K type) stars; whether or not lower-mass (M type) stars can retain primordial disks to such relatively advanced ages remains to be determined.
Young M-dwarfs can exhibit strong levels of UV and X-ray radiation, either as a result of chromospheric and coronal activity or active accretion. This high energy radiation can drive disk dissipation via photoevaporation (e.g., Gorti & Hollenbach 2009). Nevertheless, the limited studies that have been performed to explore the disk lifetimes of substellar objects have found disk dissipation timescales are at least as long as for solar-mass stars (see, e.g., Luhman & Mamajek 2012, Ercolano et al. 2011, Williams & Cieza 2011, and references therein). Investigations aimed at establishing the masses of gas and dust around similarly young M stars are key to advance our understanding of disk evolution timescales and processes.
Among the nearby young moving groups, the TWA is particularly interesting, as it represents an important evolutionary stage in the lives of protoplanetary disks. With an age of 8 Myr (Torres et al. 2008; Ducourant et al. 2014), the TWA represents an epoch coinciding with the time required for giant planet formation via core accretion (eg, Chabrier et al. 2014). The disks in the TWA range from evidently gas-poor debris disks to at least one example of a long-lived, gas-rich, apparently primordial disk — i.e., the disk orbiting TW Hya itself (e.g., Riviere-Marichalar et al. 2013; Schneider et al. 2012a; Andrews et al. 2010; and references therein). Recent work has yielded many new M-dwarf members and candidate members of the TWA (Looper et al. 2007, 2010a, 2010b; Looper 2011; Shkolnik et al. 2011; Rodriguez et al. 2011; Schneider et al. 2012b; Gagné et al. 2014b). With masses lower than 0.2 , these new mid/late M-dwarfs constitute a sample of objects that allows us to probe disks among the poorly explored substellar population, and to do so at the relatively advanced age of the TWA.
2 Observations
We carried out an ALMA survey of 15 members or proposed members of the TWA as drawn from Looper et al. (2007, 2010a, 2010b); Looper (2011); Shkolnik et al. (2011); Rodriguez et al. (2011); Schneider et al. (2012b); Gagné et al. (2014b). These stars, listed in Table 1, were chosen as targets as they constitute some of the lowest mass members suggested to date for the TWA. None of these had yet been observed with ALMA, though most are known to host dusty circumstellar disks as inferred via WISE and Herschel infrared excesses (eg, Schneider et al. 2012a, b; Liu et al. 2015). For those not in published IR surveys, we noted the WISE color and marked those with colors redder than 2 as having an IR excess. Some targets, notably J1326–5022 and TWA 29, have low TWA membership probabilities (10%) according to BANYAN II (Gagné et al. 2014a), but were nevertheless included in our survey. BANYAN II returns a 98% likelihood of membership for TWA 31; however, other studies do not consider it a likely member (e.g., Ducourant et al. 2014).
Our ALMA Cycle 2 program (2013.1.00457.S) consisted of observations of continuum dust emission at 230 GHz and observations of the 12CO(2–1) and 13CO(2–1) emission lines with a resolution of 488 kHz, corresponding to a velocity resolution of 0.6 km/s. We reached a sensitivity of 0.05 mJy/beam in the continuum and 5 mJy/beam per 0.6 km/s channel in 12CO and 13CO. Calibration and cleaning was performed by the ALMA staff with CASA version 4.2.2. Briggs weighting was used with robust=0.5. The final restored beam was, on average, ″ and corresponds to a scale of 40–80 AU at the mean distance of the stars in the TWA.
3 Results
| Name | RA | Dec. | Sp. | W1-W3 | W1-W4 | IR | Distance | Flux | Ref. | |
|---|---|---|---|---|---|---|---|---|---|---|
| Type | (mag) | (mag) | Excess | (pc) | (mJy) | () | ||||
| TWA 30B | 11:32:18 | -30:18:31 | M4 | 4.96 | 7.23 | Y | 3.7 | 1 | ||
| TWA 30A | 11:32:18 | -30:19:51 | M5 | 1.72 | 3.64 | Y | 0.20 | 0.9 | 2 | |
| TWA 31 | 12:07:10 | -32:30:53 | M5 | 1.80 | 3.92 | Y | 0.20 | 1.3 | 3 | |
| TWA 33 | 11:39:33 | -30:40:00 | M5 | 1.63 | 3.25 | Y | 1.5 | 4 | ||
| TWA 34 | 10:28:45 | -28:30:37 | M5 | 1.35 | 2.75 | Y | 2.5 | 4 | ||
| TWA 32 | 12:26:51 | -33:16:12 | M6 | 1.77 | 3.77 | Y | 15.8 | 3, 5 | ||
| J1045-2819 | 10:45:52 | -28:19:30 | M6 | 0.32 | 2.73 | ? | 0.15 | 0.9 | 6 | |
| J1111-2655 | 11:11:28 | -26:55:02 | M6 | 0.47 | 0.93 | N | 0.16 | 0.7 | 6 | |
| J1203-3821 | 12:03:59 | -38:21:40 | M8 | 0.80 | 3.09 | ? | 0.15 | 1.4 | 6 | |
| J1252-4948 | 12:52:09 | -49:48:28 | M8/9 | 0.86 | 3.00 | Y | 0.13 | 2.3 | 6 | |
| J1106-3715 | 11:06:44 | -37:15:11 | M9 | 0.88 | 4.02 | ? | 0.12 | 0.7 | 6 | |
| J1326-5022 | 13:26:53 | -50:22:27 | M9 | 1.44 | 3.32 | ? | 0.13 | 1.4 | 6 | |
| J1247-3816 | 12:47:44 | -38:16:46 | M9 | 2.16 | 4.27 | Y | 0.15 | 1.3 | 7 | |
| TWA 29 | 12:45:14 | -44:29:07 | M9/9.5 | 0.43 | 3.90 | ? | 0.14 | 0.3 | 8 | |
| J1207-3900 | 12:07:48 | -39:00:04 | L0/1 | 0.43 | 4.44 | ? | 0.14 | 1.1 | 7 |
References: (1) Looper et al. 2010b, (2) Looper et al. 2010a, (3) Shkolnik et al. 2011, (4) Schneider et al. 2012b, (5) Rodriguez et al. 2011, (6) Looper 2011, (7) Gagné et al. 2014b, (8) Looper et al. 2007.
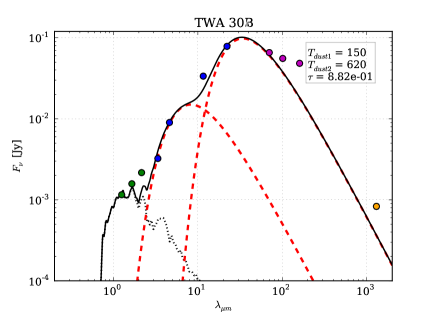
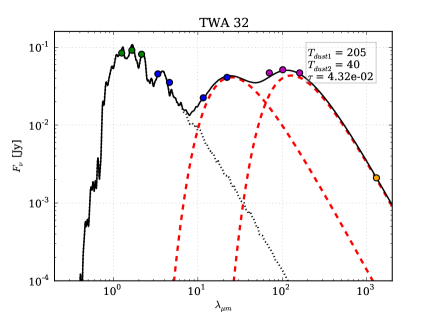
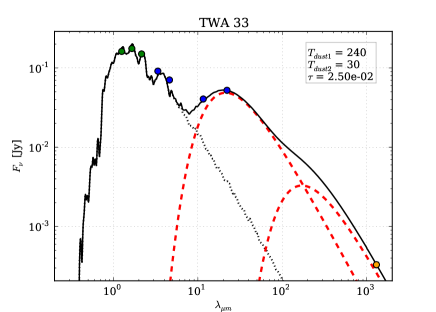
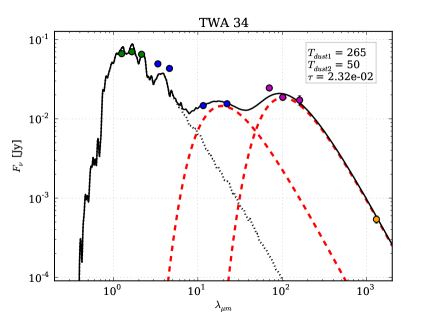
Of the 15 targets observed, four systems were detected in continuum emission. All four sources were unresolved. These first-time detections are listed in Table 1 along with the measured flux from the primary beam corrected images. Fluxes were measured by fitting a Gaussian to the cleaned image. We also list 3- limits, which are three times the RMS error estimated in each case. The measured fluxes are consistent with emission from T40 K dust grains as determined by modeling the spectral energy distribution (SED). Figure 1 shows SEDs of these 4 systems along with blackbody fits to their IR/submm excesses (see, e.g., Schneider et al. 2012a). In the case of TWA 30B, which displays strong variability and may have complex disk structure as a result of the edge-on disk geometry (Looper et al. 2010b; Principe et al., submitted), a more sophisticated model is clearly required to accurately describe its SED.
These SED models are overly simplistic; unless the emission is coming from narrow rings, the real disks will have a range of temperatures. Nevertheless, the models in Fig. 1 are useful to demonstrate the presence of cold dust in the system. The fractional luminosity, , ranges from 2 to 4% for TWA 32, 33, and 34. If we assume the continuum emission is coming from large (mm-sized) grains which radiate as blackbodies at 40 K, then the dust grains need to be located a few AU from these low-mass stars.
In addition to the four Table 1 stars that are coincident with submm continuum sources, we detected continuum sources that are well offset (typically by 10″) from three systems (TWA 31, J1247-3816, and J1207-3900). Given the typical positional accuracy of ALMA observations is better than 0.1″, we conclude these are background sources, likely of extragalactic origin.
Assuming optically thin dust, we can estimate the dust mass from:
where we adopt cm2/g (see Rodriguez et al. 2010 and references therein) and K. We tabulate the resulting estimates of , as well as 3- upper limits, in Table 1. The inferred dust masses range from 1 to 16% of an Earth mass.
An alternative approach to determine dust masses is to use the temperature-luminosity relationship for protoplanetary disks derived in Andrews et al. (2013), namely . While consistent with results for disks orbiting young, earlier type stars, the Andrews et al. (2013) relationship does not necessarily hold for very low-mass objects such as those in Table 1 (van der Plas et al., in prep). Young M5 stars have log , which suggests a dust temperature of 8 K. This is 5 times lower than the temperatures assumed in the SED model and, under the same assumptions, implies dust masses that are 5 times higher.
In addition to obtaining flux upper limits for the individual continuum non-detections, we created a stacked image by averaging non-detections, to assess whether a significant fraction of them might display emission at levels just below detectability. No detection is apparent in this average image; we obtain a 3- upper limit of 0.05 mJy/beam.
Among our sample only TWA 34 displays detectable 12CO emission, which we discuss in Section 3.1. For those systems in our sample with no CO detections, we can infer a 3- upper limit of 0.002 in molecular gas following the prescription in Section 3.1 and assuming optically thin 12CO, CO:H2 of 10-4, and a distance of 60 pc.
3.1 TWA 34: CO Detection
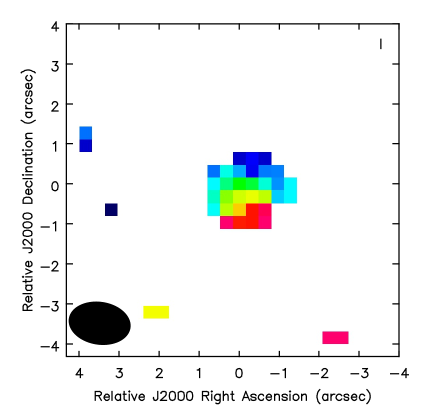
Among the Table 1 systems, only TWA 34 shows evidence of 12CO emission. Although the 12CO emission is unresolved for each individual velocity channel, we find the centroid changes with velocity, allowing us to generate the first moment map in Figure 2. Figure 2 suggests that TWA 34 is orbited by a molecule-rich disk viewed at intermediate to high inclination, with North-South rotation.
We show in Figure 3 the integrated line profile of the CO emission, Hanning smoothed with a kernel size of 3 channels. This double-peaked CO line profile is indicative of Keplerian rotation. Hence, to characterize this emission, we fit a parametrized Keplerian model as described in Kastner et al. (2008). That is, we fit a parametric line profile function described by:
where is the peak line intensity, is the rest frequency in the star/disk system frame, is the projected rotational velocity near the outer edge of the disk, and and are quasi-physical disk parameters (see Kastner et al. 2008 for details). We fix =0.5 and =0.1 for simplicity. The resulting best-fit parametric line profile is displayed in Figure 3. We obtain a peak intensity of Jy, a systemic velocity of km/s in the LSR frame, of km/s, and an integrated intensity of Jy km/s. The parameter can be used to estimate the outer radius of the disk as detected in CO emission, , from
where is the mass of the star, 0.08 (Baraffe et al. 2015). We thereby estimate the CO disk orbiting TWA 34 is 11 AU in radius. This suggests that the disk around TWA 34 is more compact than those seen around younger brown dwarfs and low-mass stars in Taurus (Ricci et al. 2014). We note that the CO emission in Figure 2 is marginally resolved and suggests a larger CO radius of 20–40 AU. This discrepancy in the CO outer radius estimates can also be seen in other disks when comparing single-dish line measurements to resolved interferometric imaging (e.g., Kastner et al. 2008; Rodriguez et al. 2010; Sacco et al. 2014; Huélamo et al. 2015). Higher resolution CO imaging will allow an independent measurement of the disk size, which can in turn be used to accurately estimate the mass of TWA 34.
We estimate a gas mass of 0.2 following the prescriptions of Zuckerman et al. (2008), Kastner et al. (2008), Rodriguez et al. (2010), and references therein. We assume optically thin 13CO, a 12C:13C ratio of 89, a CO:H2 ratio of 10-4, temperature of 40 K, and a 3- 13CO upper limit of 0.03 Jy km/s. The 13CO upper limit is determined assuming a linewidth identical to that of 12CO. This estimate for the gas mass is 7 times higher than that for the dust mass. This ratio is comparable to other evolved molecular gas disks such as TW Hya and V4046 Sgr, as well as some disks in the much younger (1–3 Myr) Taurus star-forming region (e.g., Sacco et al. 2014; Williams & Best 2014). As these and many other previous studies suggest, such low inferred gas-to-dust ratios could be indicative of gas removal through accretion or photoevaporation, or could merely reflect overestimates of the CO:H2 ratio; due, for example, to freezing out of CO on cold dust grains. These various processes result in large uncertainties when estimating the gas mass of disks based on CO measurements.

3.2 TWA 34: System Velocity
From our best-fit Keplerian profile (see prior section), we have obtained an estimate for the systemic velocity of TWA 34. In the barycentric frame of reference, this velocity corresponds to km/s. This is the first accurate radial velocity measurements available for TWA 34 (see also Murphy et al. 2015). At a distance of pc and using the proper motions listed in PPMXL (Roeser et al. 2010), we can estimate UVW velocities of , , km/s. These agree very well with the average velocity of the TWA (, , km/s; Malo et al. 2013). This new velocity measurement thereby further supports the conclusion that TWA 34 is a member of the TWA.
4 Discussion
Among the 15 low-mass TWA members and candidate members listed in Table 1, only 4 yielded ALMA continuum detection at 1.3 mm, despite the fact that many show some evidence of warm circumstellar dust. In the absence of cold dust grains, the warm dust grains detected by WISE would have 1.3 mm emission 0.1 mJy, which is below the sensitivity of our ALMA observations. Because we are only sensitive to cold mm-sized grains, our observations appear to demonstrate that the presence of warm circumstellar dust does not necessarily imply cold dust is also present in the system. This is in agreement with prior studies of M stars (see, e.g., Lestrade et al. 2009 and references therein) that have found the incidence of cold disks to be much lower around such stars than around higher mass stars. Although the ALMA non-detections appear to indicate no cold grains exist, an alternative explanation is that any surviving grains in the outer disk have already grown to cm size or larger and become invisible at 1.3 mm wavelengths (Ricci et al. 2010a, b; Mohanty et al. 2013).
The continuum non-detections suggest dust masses of about or less. This is similar to what has been observed for other 10 Myr-old debris disks around M stars (see Wyatt 2008 and references therein). We were more sensitive to molecular gas masses and achieved a limit of a few times for gas in H2, assuming CO/H2 of . As the case for TWA 34 and other disks shows, the gas-to-dust ratio is unlikely to be 100 as in the ISM (see Williams & Best 2014). It appears likely that by the age of the TWA, the gas in a typical M star’s disk has in general been efficiently removed, even in cases where a significant mass of primordial dust has survived. However, studies have identified signatures of on-going gas accretion in some of these systems, for example around TWA 30A, 30B, and 31 (Looper et al. 2010a, b; Shkolnik et al. 2011). Hence, at least in certain cases, it is likely that disk CO gas has frozen out onto dust grains, suppressing the gas-phase CO abundance.
5 Conclusions
We have carried out an ALMA survey of 15 low-mass TWA members and candidates to search for molecular gas in the form of 12CO and 13CO as well as provide constraints on continuum dust emission. Among systems targeted, four (TWA 30B, 32, 33, and 34) have detected dust emission consistent with the existence of cold dust grains in the disk. Circumstellar dust grain temperatures of 40 K are consistent with the mid-infrared to submm SEDs for these systems. All continuum sources are unresolved. While most of our sample shows indications of warm dust based on WISE measurements, the ALMA non-detections suggest any cold grains present in the outer disk may have already grown to cm size or larger.
Only one system, TWA 34, shows signatures of molecular gas in its disk in the form of 12CO (2–1) emission. The 12CO emission has velocity structure indicative of Keplerian rotation. The systemic velocity for the system, as determined from the CO detection, is consistent with membership in the TWA. Among the sample of known 7–10 Myr-old star/disk systems, TWA 34, at just 50 pc from Earth, is the lowest mass star thus far identified as harboring cold molecular gas in an orbiting disk.
Acknowledgements.
This paper makes use of the following ALMA data: ADS/JAO.ALMA#2013.1.00457.S. ALMA is a partnership of ESO (representing its member states), NSF (USA) and NINS (Japan), together with NRC (Canada), NSC and ASIAA (Taiwan), and KASI (Republic of Korea), in cooperation with the Republic of Chile. The Joint ALMA Observatory is operated by ESO, AUI/NRAO and NAOJ. We thank our referee, Greg Herczeg, for the detailed and useful review of our manuscript. D.R.R. acknowledges support from FONDECYT grant 3130520. G.v.d.P. acknowledges support from FONDECYT grant 3140393. D.P. acknowledges support from FONDECYT grant 3150550. G.v.d.P. acknowledges support from FONDECYT grant 3140393 and by the Millennium Nucleus RC130007 (Chilean Ministry of Economy). J.K.’s research on young stars near Earth is supported by National Science Foundation grant AST-1108950 and NASA Astrophysics Data Analysis Program grant NNX12H37G, both to RIT. S.M. acknowledges the support of the STFC grant ST/K001051/1References
- Andrews et al. (2010) Andrews, S. M., Czekala, I., Wilner, D. J., et al. 2010, ApJ, 710, 462
- Andrews et al. (2013) Andrews, S. M., Rosenfeld, K. A., Kraus, A. L., & Wilner, D. J. 2013, ApJ, 771, 129
- Baraffe et al. (2015) Baraffe, I., Homeier, D., Allard, F., & Chabrier, G. 2015, A&A, 577, A42
- Chabrier et al. (2014) Chabrier, G., Johansen, A., Janson, M., & Rafikov, R. 2014, Protostars and Planets VI, 619
- Ducourant et al. (2014) Ducourant, C., Teixeira, R., Galli, P. A. B., et al. 2014, A&A, 563, A121
- Ercolano et al. (2011) Ercolano, B., Bastian, N., Spezzi, L., & Owen, J. 2011, MNRAS, 416, 439
- Gagné et al. (2014a) Gagné, J., Lafrenière, D., Doyon, R., Malo, L., & Artigau, É. 2014, ApJ, 783, 121
- Gagné et al. (2014b) Gagné, J., Faherty, J. K., Cruz, K., et al. 2014, ApJ, 785, LL14
- Gorti & Hollenbach (2009) Gorti, U., & Hollenbach, D. 2009, ApJ, 690, 1539
- Huélamo et al. (2015) Huélamo, N., de Gregorio-Monsalvo, I., Macias, E., et al. 2015, A&A, 575, L5
- Kastner et al. (1997) Kastner, J. H., Zuckerman, B., Weintraub, D. A., & Forveille, T. 1997, Science, 277, 67
- Kastner et al. (2008) Kastner, J. H., Zuckerman, B., & Forveille, T. 2008, A&A, 486, 239
- Kastner et al. (2008) Kastner, J. H., Zuckerman, B., Hily-Blant, P., & Forveille, T. 2008, A&A, 492, 469
- Kastner et al. (2010) Kastner, J. H., Hily-Blant, P., Sacco, G. G., Forveille, T., & Zuckerman, B. 2010, ApJ, 723, L248
- Lagrange et al. (2010) Lagrange, A.-M., Bonnefoy, M., Chauvin, G., et al. 2010, Science, 329, 57
- Lestrade et al. (2009) Lestrade, J.-F., Wyatt, M. C., Bertoldi, F., Menten, K. M., & Labaigt, G. 2009, A&A, 506, 1455
- Liu et al. (2015) Liu, Y., Herczeg, G. J., Gong, M., et al. 2015, A&A, 573, A63
- Looper et al. (2007) Looper, D. L., Burgasser, A. J., Kirkpatrick, J. D., & Swift, B. J. 2007, ApJ, 669, L97
- Looper et al. (2010a) Looper, D. L., Mohanty, S., Bochanski, J. J., et al. 2010, ApJ, 714, 45
- Looper et al. (2010b) Looper, D. L., Bochanski, J. J., Burgasser, A. J., et al. 2010b, AJ, 140, 1486
- Looper (2011) Looper, D. L. 2011, Ph.D. Thesis, University of Hawai’i
- Luhman & Mamajek (2012) Luhman, K. L., & Mamajek, E. E. 2012, ApJ, 758, 31
- Malo et al. (2013) Malo, L., Doyon, R., Lafrenière, D., et al. 2013, ApJ, 762, 88
- Marois et al. (2008) Marois, C., Macintosh, B., Barman, T., et al. 2008, Science, 322, 1348
- Mohanty et al. (2013) Mohanty, S., Greaves, J., Mortlock, D., et al. 2013, ApJ, 773, 168
- Murphy et al. (2015) Murphy, S. J., Lawson, W. A., & Bento, J. 2015, MNRAS, in press (arXiv:1507.08002)
- Ricci et al. (2010a) Ricci, L., Testi, L., Natta, A., et al. 2010, A&A, 512, A15
- Ricci et al. (2010b) Ricci, L., Testi, L., Natta, A., & Brooks, K. J. 2010, A&A, 521, A66
- Ricci et al. (2014) Ricci, L., Testi, L., Natta, A., et al. 2014, ApJ, 791, 20
- Riviere-Marichalar et al. (2013) Riviere-Marichalar, P., Pinte, C., Barrado, D., et al. 2013, A&A, 555, A67
- Rodriguez et al. (2010) Rodriguez, D. R., Kastner, J. H., Wilner, D., & Qi, C. 2010, ApJ, 720, 1684
- Rodriguez et al. (2011) Rodriguez, D. R., Bessell, M. S., Zuckerman, B., & Kastner, J. H. 2011, ApJ, 727, 62
- Roeser et al. (2010) Roeser, S., Demleitner, M., & Schilbach, E. 2010, AJ, 139, 2440
- Sacco et al. (2014) Sacco, G. G., Kastner, J. H., Forveille, T., et al. 2014, A&A, 561, A42
- Schneider et al. (2012a) Schneider, A., Melis, C., & Song, I. 2012a, ApJ, 754, 39
- Schneider et al. (2012b) Schneider, A., Song, I., Melis, C., Zuckerman, B., & Bessell, M. 2012b, ApJ, 757, 163
- Shkolnik et al. (2011) Shkolnik, E. L., Liu, M. C., Reid, I. N., Dupuy, T., & Weinberger, A. J. 2011, ApJ, 727, 6
- Torres et al. (2008) Torres, C. A. O., Quast, G. R., Melo, C. H. F., & Sterzik, M. F. 2008, Handbook of Star Forming Regions, Volume II, 757
- Williams & Cieza (2011) Williams, J. P., & Cieza, L. A. 2011, ARA&A, 49, 67
- Williams & Best (2014) Williams, J. P., & Best, W. M. J. 2014, ApJ, 788, 59
- Wyatt (2008) Wyatt, M. C. 2008, ARA&A, 46, 339
- Zuckerman & Song (2004) Zuckerman, B., & Song, I. 2004, ARA&A, 42, 685
- Zuckerman et al. (2008) Zuckerman, B., Melis, C., Song, I., et al. 2008, ApJ, 683, 1085