Discovery of a Strongly Lensed Massive Quiescent Galaxy at :
Spatially Resolved Spectroscopy and Indications of Rotation
Abstract
We report the discovery of RG1M0150, a massive, recently quenched galaxy at that is multiply imaged by the cluster MACSJ0150.3-1005. We derive a stellar mass of and a half-light radius of kpc. Taking advantage of the lensing magnification, we are able to spatially resolve a remarkably massive yet compact quiescent galaxy at in ground-based near-infrared spectroscopic observations using Magellan/FIRE and Keck/MOSFIRE. We find no gradient in the strength of the Balmer absorption lines over , which are consistent with an age of 760 Myr. Gas emission in [N II] broadly traces the spatial distribution of the stars and is coupled with weak H emission (log [N II]/H), indicating that OB stars are not the primary ionizing source. The velocity dispersion within the effective radius is km s-1. We detect rotation in the stellar absorption lines for the first time beyond . Using a two-integral Jeans model that accounts for observational effects, we measure a dynamical mass of and . This is a high degree of rotation considering the modest observed ellipticity of , but it is consistent with predictions from dissipational merger simulations that produce compact remnants. The mass of RG1M0150 implies that it is likely to become a slowly rotating elliptical. If it is typical, this suggests that the progenitors of massive ellipticals retain significant net angular momentum after quenching which later declines, perhaps through accretion of satellites.
Subject headings:
galaxies: elliptical and lenticular, cD—galaxies: kinematics and dynamics—gravitational lensing: strong1. Introduction
Observations are beginning to reveal the bulk properties of the high-redshift progenitors of massive elliptical galaxies. Massive quiescent galaxies are present at but have very compact sizes compared to local early-type galaxies (ETGs). Much effort in recent years has focused on understanding the growth of these “nuggets” and the emergence of extended stellar envelopes (e.g., Trujillo et al., 2006; van Dokkum et al., 2010; Newman et al., 2012; Patel et al., 2013; Belli et al., 2015). Recent observations are also beginning to link these early quiescent galaxies to star-forming progenitors at even earlier epochs via their masses, sizes, and kinematics (Barro et al., 2014; Toft et al., 2014; van Dokkum et al., 2015).
Numerical simulations have made increasingly detailed predictions for the properties of ETGs formed in disk mergers (e.g., Cox et al., 2006; Robertson et al., 2006; Hopkins et al., 2009; Zolotov et al., 2015). Forming a dense stellar core requires significant dissipation, and such gas-rich mergers are predicted to produce rotating remnants—possibly with a velocity exceeding the bulk of today’s ETGs (Wuyts et al., 2010). Different channels for the formation of compact galaxies can be tested with stellar population gradients (Wellons et al., 2015) and kinematic data. However, such comparisons require spatially resolved observations, which are very challenging given the small angular sizes of typical quiescent galaxies (). Gravitational lensing provides a promising route toward resolving these compact systems. The main challenge in locating lensed examples is the need for wide-area near-infrared (NIR) imaging to overcome their rarity and faintness at optical wavelengths. Thus far only three example have been published (Muzzin et al., 2012; Geier et al., 2013), and none has spatially resolved spectroscopic data.
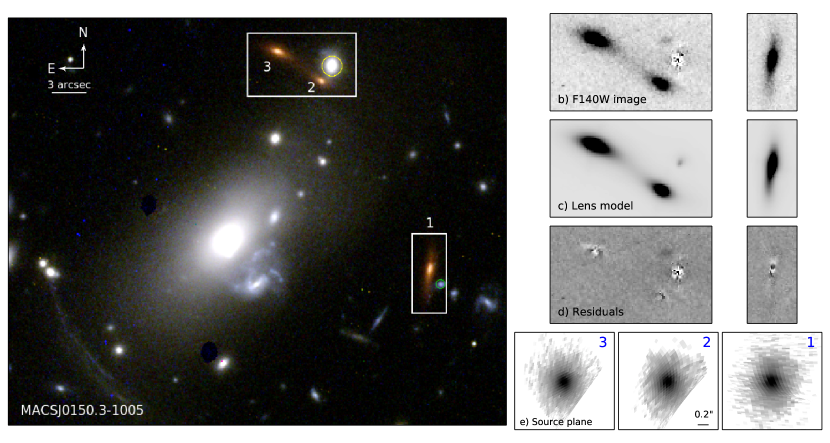
In this Letter we present the discovery of RG1M0150, a rare example of a massive, quiescent galaxy at that is multiply imaged by the cluster MACSJ0150.3-1005 (R.A. , Decl. , ; Ebeling et al. 2001). RG1M0150 was located in a search for bright sources with red NIR colors that are magnified by clusters in the Hubble Space Telescope (HST) archive. It is extremely bright () and well suited for detailed follow-up observations. We analyze NIR spectra collected with Magellan/FIRE and Keck/MOSFIRE and are able to spatially resolve stellar absorption lines with spectral resolution sufficient for kinematic work. We use these unique data to study the resolved stellar populations and rotational support of RG1M0150.
Throughout we adopt AB magnitudes and the cosmological parameters .
2. Observations
2.1. Imaging
RG1M0150 was identified in a search of archival HST/WFC3 images of massive clusters. We targeted bright, magnified sources with red NIR colors indicative of a Balmer/4000 Å break at . HST imaging of RG1M0150 covers WFC3/F140W, WFC3/F110W, ACS/F814W, and WFCP2/F606W (SNAP-12884 and SNAP-11103, P.I. Ebeling; see Figure 1). We also obtained , , and band observations with Magellan/FourStar (Persson et al., 2013) which were reduced following procedures discussed by Kelson et al. (2014). Colors were measured in a rectangular aperture along Image 1 matching the spectroscopic aperture used in Section 2.2. Matching of the point spread function (PSF) between the FourStar and HST images was performed as described by Newman et al. (2012). Total fluxes were obtained by scaling to the F140W flux in larger rectangle. We also incorporate 3.4m and 4.6m measurements from the AllWISE catalog.111http://wise2.ipac.caltech.edu/docs/release/allwise/ Zeropoint and PSF matching uncertainties of 0.03 mag (HST), 0.05 mag (FourStar), and 0.1 mag (WISE) were added in quadrature.
2.2. Spectroscopy
We obtained NIR spectroscopic observations of Image 1 of RG1M0150 with both MOSFIRE (McLean et al., 2012) at the Keck I telescope and FIRE (Simcoe et al., 2013) at the Magellan Baade telescope. FIRE is a cross-dispersed echellette instrument that covers m simultaneously. The MOSFIRE data cover the band only but afford somewhat cleaner sky subtraction owing to the faster dithering cadence. A position angle (PA) of was selected to place the slit along Image 1.
The MOSFIRE exposures total 260 minutes taken over 2014 November 26-27, consisting of 2 minute integrations in an AB dither pattern. The slit provided a resolution of . Another slit was positioned on a star to measure the average seeing of . Data were reduced using the MOSFIRE Data Reduction Pipeline.
The FIRE observations were conducted over 2014 November 1 and 3 and total 390 minutes, consisting of 30 minute exposures using up-the-ramp sampling. The slit provided a resolution of . The average seeing of was determined by monitoring a star on the NIR slit viewing camera. The data were reduced using a modified version of the FIREHOSE pipeline that produces two-dimensional rectified spectra. For both data sets, telluric absorption correction and flux calibration were performed using A0V star observations and xtellcor (Vacca et al., 2003).
2.3. Lens Model
We construct a lens model using the three images of RG1M0150 as constraints. Analytic models describe the lens mass distribution and the source light profile. Their parameters are constrained simultaneously using the ray-tracing code described in Newman et al. (2015), which fits the pixel-level WFC3/F140W data.
Given its smooth, symmetric appearance, the source was modeled using an elliptical Sérsic profile. To model the cluster lens, we use several dual pseudo-isothermal elliptical (dPIE) mass distributions (see Elíasdóttir et al. 2007). Each is described by two scale radii and and a normalization , in addition to its center, PA, and ellipticity. All parameters of the dPIE describing the cluster dark matter halo are free other than , which is beyond the strong lensing zone and can be fixed to 1 Mpc (e.g., Richard et al., 2010). Additional dPIE components account for deflection by luminous cluster galaxies and are generally modeled using the scaling relations and , with priors on and as described by Newman et al. (2013). However, the brightest cluster galaxy and the two galaxies circled in Figure 1, which are important perturbers, were allowed to depart from these scaling relations. We also included external shear to fine tune the image reconstruction, although this did not make a major difference to our final model.
Figure 1 demonstrates that our best-fitting model produces three images that match the F140W data well. The model produces areal magnifications of , and for Images 1, 2, and 3, respectively. Uncertainties were conservatively estimated by comparing to an independent set of Lenstool models (Kneib et al., 1993; Jullo et al., 2007) constrained only by the positions, ellipticity, and fluxes of the images and varying the mass model components.
3. Structure and Stellar Population
3.1. Stellar Structure
Our best-fitting Sérsic model indicates that RG1M0150 is a compact, nearly round, concentrated galaxy with an effective radius (semimajor axis), Sérsic index , magnitude , axis ratio , and . Uncertainties were estimated from the scatter in parameters obtained when fitting the three multiple images individually ( also includes the systematic magnification uncertainty).
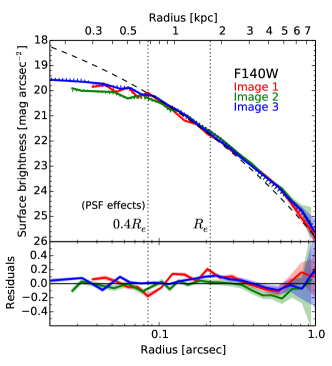
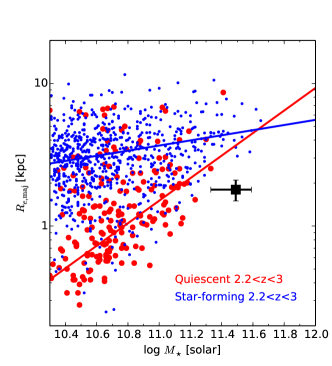
We reconstruct source plane surface brightness profiles for each image in Figure 2. The lensing magnification enables us to probe down to scales of before PSF blurring becomes significant. Over the range a single Sérsic profile remains adequate to fit the F140W light with systematic residuals of (lower panel). The rest-frame colors of RG1M0150 (, ) satisfy the criterion often used to select quiescent galaxies. The right panel of Figure 2 demonstrates that RG1M0150 is a compact galaxy, lying slightly below the mass–size relation defined by other quiescent systems at similar redshift.
3.2. Stellar Population
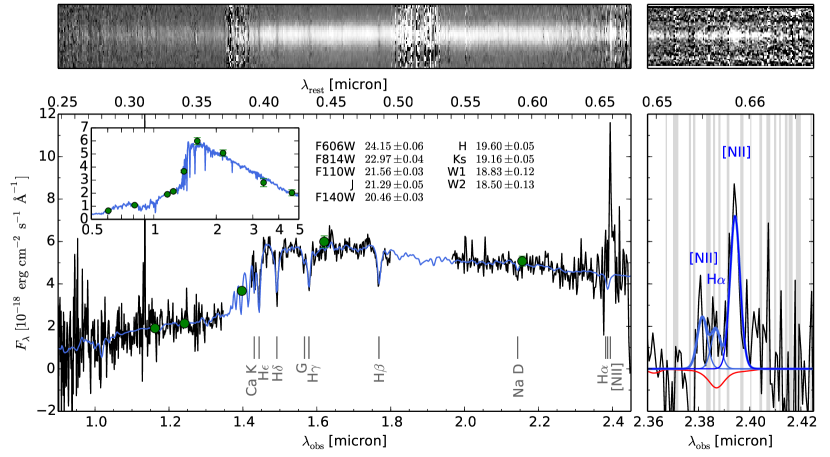
RG1M0150 presents a red continuum shape with strong Balmer absorption dominating the rest-optical spectrum. In Figure 3 we combine the broadband photometry with our FIRE spectrum to constrain the stellar population using our pyspecfit code (Newman et al., 2014). We adopt solar metallicity Bruzual & Charlot (2003) models and a Chabrier (2003) initial mass function. The FIRE spectrum is extracted in a rectangular aperture extending from the center of Image 1, which best approximates in the source plane.
We infer a remarkably high stellar mass of , scaled to the source plane Sérsic model flux and including the magnification uncertainty. Given the very high indicated mass, we simulate the probability distribution of the most massive quiescent galaxy lensed by a cluster in the HST/WFC3 archive (80 clusters, assuming a typical cross-section arcsec2 for magnification similar to MACSJ0150.3-1005) using the Muzzin et al. (2013) mass functions. A lensed galaxy with is indeed quite rare (). The probability increases to if the threshold is lowered by to . If we take our simulated probability distribution as a prior in order to account for an Eddington-type bias, the posterior for the stellar mass would shift downward to .
For an exponentially declining star formation history, we find an age of Myr and a prompt -folding time of Myr. The corresponding ongoing star formation rate is only yr-1 (accounting for magnification), indicating that star formation was recently and quickly truncated in this galaxy. The specific star formation rate is (68% CL) independent of magnification. Dust attenuation is moderate with assuming the Calzetti et al. (2000) reddening curve. (These uncertainties are purely statistical and do not include known differences among stellar population models.)
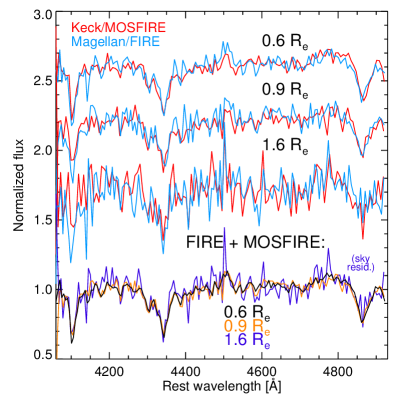
The lensing magnification presents a unique opportunity to probe the location of the last star formation event by spatially resolving the Balmer absorption. We extract spectra in 5 rectangular apertures whose boundaries along the spectroscopic slit are chosen to examine the same luminosity-weighted radius in the source plane on either side of the galaxy: , , and . Figure 4 demonstrates that the FIRE and MOSFIRE spectra agree well, and we therefore combine them in the bottom of the panel to search for gradients in Balmer line strength. No variation is apparent, even though the spectra would be sensitive to an age difference of Myr. Thus, the last star formation event in RG1M0150 was not highly centrally concentrated.
3.3. Ionized Gas
We detect emission in the [N II] and H lines (see Figure 3). Weak H emission with a modest equivalent width of Å (rest frame) is evident only after subtracting the underlying stellar absorption. [N II] is much stronger ( Å). The very high ratio log([N II] exceeds that attainable through photoionization by a starburst (e.g., Kewley et al., 2001). The main ionizing source is therefore not OB stars, a conclusion consistent with the low star formation rate inferred from the stellar continuum. Although other bright emission line diagnostics are not available (e.g., [O II] and [O III] are inaccessible due to atmospheric opacity), similarly high [N II]/H ratios are sometimes seen in red sequence and post-starburst galaxies at lower redshift that usually have LINER-type spectra (e.g., Yan et al., 2006; Lemaux et al., 2010). The [N II] emission in RG1M0150 has a roughly constant EW across the galaxy, which suggests (but does not prove) that the main ionizing source is distributed similarly to the stars (e.g., post-AGB stars or shocks) rather than an active galactic nucleus (AGN). X-ray, radio, and mid/far-IR observations could clarify this by testing for the presence of an AGN or obscured star formation.
4. Stellar Kinematics: Rotation in a Quiescent Galaxy
Stellar kinematics were measured using the -band () spectra within the spatial apertures described in Section 3.2. We use the ppxf code (Cappellari & Emsellem, 2004) and allow a linear combination of Bruzual & Charlot (2003) simple stellar populations as the template.
4.1. Velocity Dispersion
We first determine the velocity dispersion within the aperture encompassing (see Section 3.2). This is simply the second moment of the line-of-sight velocity distribution and includes both random and streaming motions. The FIRE and MOSFIRE spectra yield consistent estimates of km s-1 and km s-1, respectively, which we average to obtain km s-1. Tests of several systematic uncertainties revealed that sensitivity to template construction and the inclusion or exclusion of Balmer lines dominate the error budget, contributing km s-1. Combining the uncertainties in quadrature yields km s-1, which is comparable to that measured for the ionized gas in the same aperture, km s-1.
4.2. Rotation and Dynamical Model
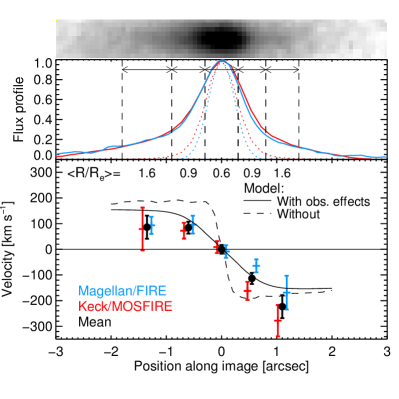
Although our spectra are insufficient for resolved measurements of , we do have sufficient signal to measure velocities in our five spatial bins. This the first such measurement derived from stellar absorption features at redshifts beyond the study of van der Wel & van der Marel (2008). Figure 4 (right panel) shows that all 4 independent measurements on the southern half of the arc are redshifted, while all 4 measurements on the northern half are blueshifted with respect to measured in the central spatial bin. The presence of rotation with the same directional sense in independent data sets gives us significantly higher confidence in its reality.
To compare the rotational velocity of RG1M0150 with other samples, we must account for observational effects, particularly the seeing, slit width, and binning. We do this by constructing a two-integral (semi-isotropic) oblate Jeans dynamical model. We assume mass follows the light distribution described by our Sérsic model. The free parameters are , the rotation parameter (Satoh, 1980), and the inclination. (See van der Wel & van der Marel 2008 for a quite similar approach.) The dynamical model is constructed in the source plane, then lensed, convolved by the seeing, and binned like the data. The model is constrained by the rotation points (Figure 4) and . Fortuitously, the slit PA of , which is aligned with the direction of magnification, is close to the major axis PA ().
The inferred dynamical mass is when marginalizing over the unknown inclination . Here we choose because it corresponds to a maximum intrinsic ellipticity . Although the intrinsic is sensitive to inclination, the projected value that we measure is not. The inferred is also insensitive to inclination except when the galaxy is close to face-on (this result is generic in Jeans dynamical modeling, e.g., van der Marel 1991). In particular, when fixing we find that that the inferred would increase significantly by 0.16 dex. Adopting any inclination that is even slightly larger, however, affects by dex.
Adopting a local virial calibration would have given a slightly smaller mass. is smaller than, but consistent with, our estimate of . However, some tension would arise had we adopted a Salpeter-type initial mass function. It will be interesting to evaluate this further with larger samples of lensed galaxies.
Observational effects modify the observed rotation significantly, as Figure 4 demonstrates. Our modeling allows us to account for these. The best-fitting model has a maximum projected rotation velocity km s-1 and . This model adopts the classic definition of based on and averaged within (e.g., Davies et al., 1983).
5. Discussion
A central question in the evolution of ETGs is the extent to which the quenching of star formation and the transformation of stellar structure, morphology, and kinematics proceed together (e.g., in one major merger episode) or in several distinct events. The presence of compact quiescent galaxies at high redshift demonstrates that growth of the stellar distribution proceeds long after quenching. Recent examinations of the evolving ellipticities of quiescent galaxies suggest that these early, compact systems were also more disk-like (van der Wel et al., 2011; Chang et al., 2013). The key test is a direct measurement of rotation, presented in this Letter for the first time.
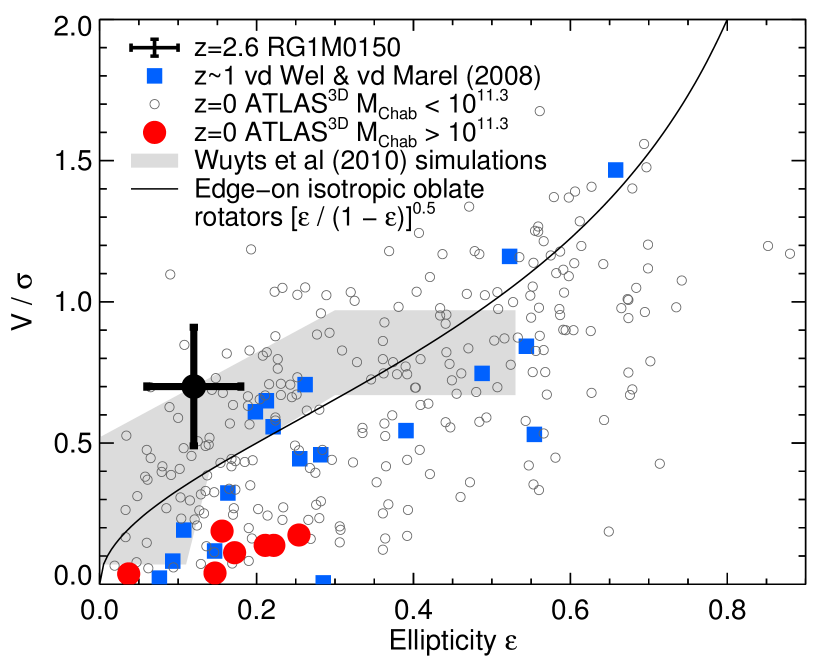
Figure 5 compares the rotational support of RG1M0150 with that of local ETGs in the classic diagram.222Using the ATLAS3D kinematic maps, we determined that their adopted definition (Equation 10 of Cappellari et al., 2007) is lower than ours by an average factor of 1.53. We apply this correction to place the data in Figure 5 on a uniform scale. RG1M0150 has a high for its modest observed ellipticity that places it on the upper envelope of local ETGs. Although we cannot determine the inclination and deproject with current data, it is possible that the edge-on rotation velocity is significantly higher.
Numerical simulations of galaxy mergers require high gas fractions of (Wuyts et al., 2010) to produce compact remnants such as RG1M0150. These simulations generally find that a significant amount of angular momentum is retained and suggest that rotation will be more significant in quiescent galaxies at higher redshift, when mergers were more dissipative. Wuyts et al. (2010) predicted that quiescent galaxies would fall on the upper envelope of local ETGs in the diagram. Intriguingly, we find that RG1M0150 indeed lies close in Figure 5 to their simulated merger remnants, which are compact systems with and kpc comparable to typical quiescent galaxies.
Simulations by Zolotov et al. (2015) predict that the gas in compact quiescent galaxies and their immediate star-forming progenitors is kinematically colder than the stars, i.e., has higher . This causes the projected to be for an edge-on view but progressively higher for lower inclinations. Supporting this, Barro et al. (2015) measured in a quenching compact galaxy at . We find that the stellar and gas line widths are closer in RG1M0150, with , but larger samples will be needed to test this hypothesis due to the strong inclination dependence.
Nearly all local ETGs with (scaled to a Chabrier IMF) are “slow rotators” with much smaller than RG1M0150 (red points in Figure 5). Our best estimate for the stellar mass of RG1M0150 already places it within this range. Even allowing a somewhat smaller mass (e.g., our ), it is quite likely that RG1M0150 will evolve into a slow rotator: empirical estimates based on number density arguments (e.g., Muzzin et al., 2013; Patel et al., 2013) imply that RG1M0150 will grow in stellar mass by 0.2-0.4 dex by . Stellar populations in such ultra-massive galaxies today are almost exclusively very old (e.g., McDermid et al., 2015), so significant later star formation is unlikely. If RG1M0150 is typical, this suggests that the progenitors of giant ellipticals are still rotating significantly after they have been quenched and must reduce their net angular momentum later. A sequence of mostly dry mergers, suspected of driving the observed growth in effective radius, might provide a physical explanation.
General conclusions about galaxy formation obviously cannot be drawn from RG1M0150 alone. Fortunately, a larger sample of lensed compact galaxies at (mostly at lower masses) is within reach and provides the most feasible route toward resolving the stellar populations and dynamics of these intriguing objects.
References
- Barro et al. (2014) Barro, G., Trump, J. R., Koo, D. C., et al. 2014, ApJ, 795, 145
- Barro et al. (2015) Barro, G., Faber, S. M., Dekel, A., et al. 2015, arXiv:1503.07164
- Belli et al. (2015) Belli, S., Newman, A. B., & Ellis, R. S. 2015, ApJ, 799, 206
- Binney (1978) Binney, J. 1978, MNRAS, 183, 501
- Bruzual & Charlot (2003) Bruzual, G., & Charlot, S. 2003, MNRAS, 344, 1000
- Calzetti et al. (2000) Calzetti, D., Armus, L., Bohlin, R. C., et al. 2000, ApJ, 533, 682
- Cappellari & Emsellem (2004) Cappellari, M., & Emsellem, E. 2004, PASP, 116, 138
- Cappellari et al. (2007) Cappellari, M., Emsellem, E., Bacon, R., et al. 2007, MNRAS, 379, 418
- Chabrier (2003) Chabrier, G. 2003, PASP, 115, 763
- Chang et al. (2013) Chang, Y.-Y., van der Wel, A., Rix, H.-W., et al. 2013, ApJ, 762, 83
- Cox et al. (2006) Cox, T. J., Dutta, S. N., Di Matteo, T., et al. 2006, ApJ, 650, 791
- Davies et al. (1983) Davies, R. L., Efstathiou, G., Fall, S. M., Illingworth, G., & Schechter, P. L. 1983, ApJ, 266, 41
- Ebeling et al. (2001) Ebeling, H., Edge, A. C., & Henry, J. P. 2001, ApJ, 553, 668
- Elíasdóttir et al. (2007) Elíasdóttir, Á., Limousin, M., Richard, J., et al. 2007, arXiv:0710.5636
- Emsellem et al. (2011) Emsellem, E., Cappellari, M., Krajnović, D., et al. 2011, MNRAS, 414, 888
- Geier et al. (2013) Geier, S., Richard, J., Man, A. W. S., et al. 2013, ApJ, 777, 87
- Hopkins et al. (2009) Hopkins, P. F., Cox, T. J., Dutta, S. N., et al. 2009, ApJS, 181, 135
- Jullo et al. (2007) Jullo, E., Kneib, J.-P., Limousin, M., et al. 2007, New Journal of Physics, 9, 447
- Kelson et al. (2014) Kelson, D. D., Williams, R. J., Dressler, A., et al. 2014, ApJ, 783, 110
- Kewley et al. (2001) Kewley, L. J., Dopita, M. A., Sutherland, R. S., Heisler, C. A., & Trevena, J. 2001, ApJ, 556, 121
- Kneib et al. (1993) Kneib, J. P., Mellier, Y., Fort, B., & Mathez, G. 1993, A&A, 273, 367
- Lemaux et al. (2010) Lemaux, B. C., Lubin, L. M., Shapley, A., et al. 2010, ApJ, 716, 970
- McDermid et al. (2015) McDermid, R. M., Alatalo, K., Blitz, L., et al. 2015, MNRAS, 448, 3484
- McLean et al. (2012) McLean, I. S., Steidel, C. C., Epps, H. W., et al. 2012, in Society of Photo-Optical Instrumentation Engineers (SPIE) Conference Series, Vol. 8446
- Muzzin et al. (2012) Muzzin, A., Labbé, I., Franx, M., et al. 2012, ApJ, 761, 142
- Muzzin et al. (2013) Muzzin, A., Marchesini, D., Stefanon, M., et al. 2013, ApJ, 777, 18
- Newman et al. (2014) Newman, A. B., Ellis, R. S., Andreon, S., et al. 2014, ApJ, 788, 51
- Newman et al. (2012) Newman, A. B., Ellis, R. S., Bundy, K., & Treu, T. 2012, ApJ, 746, 162
- Newman et al. (2015) Newman, A. B., Ellis, R. S., & Treu, T. 2015, arXiv:1503.05282
- Newman et al. (2013) Newman, A. B., Treu, T., Ellis, R. S., et al. 2013, ApJ, 765, 24
- Patel et al. (2013) Patel, S. G., van Dokkum, P. G., Franx, M., et al. 2013, ApJ, 766, 15
- Persson et al. (2013) Persson, S. E., Murphy, D. C., Smee, S., et al. 2013, PASP, 125, 654
- Richard et al. (2010) Richard, J., Smith, G. P., Kneib, J.-P., et al. 2010, MNRAS, 404, 325
- Robertson et al. (2006) Robertson, B., Cox, T. J., Hernquist, L., et al. 2006, ApJ, 641, 21
- Satoh (1980) Satoh, C. 1980, PASJ, 32, 41
- Simcoe et al. (2013) Simcoe, R. A., Burgasser, A. J., Schechter, P. L., et al. 2013, PASP, 125, 270
- Skelton et al. (2014) Skelton, R. E., Whitaker, K. E., Momcheva, I. G., et al. 2014, ApJS, 214, 24
- Toft et al. (2014) Toft, S., Smolčić, V., Magnelli, B., et al. 2014, ApJ, 782, 68
- Trujillo et al. (2006) Trujillo, I., Feulner, G., Goranova, Y., et al. 2006, MNRAS, 373, L36
- Vacca et al. (2003) Vacca, W. D., Cushing, M. C., & Rayner, J. T. 2003, PASP, 115, 389
- van der Marel (1991) van der Marel, R. P. 1991, MNRAS, 253, 710
- van der Wel & van der Marel (2008) van der Wel, A., & van der Marel, R. P. 2008, ApJ, 684, 260
- van der Wel et al. (2011) van der Wel, A., Rix, H.-W., Wuyts, S., et al. 2011, ApJ, 730, 38
- van der Wel et al. (2014) van der Wel, A., Franx, M., van Dokkum, P. G., et al. 2014, ApJ, 788, 28
- van Dokkum et al. (2010) van Dokkum, P. G., Whitaker, K. E., Brammer, G., et al. 2010, ApJ, 709, 1018
- van Dokkum et al. (2015) van Dokkum, P. G., Nelson, E. J., Franx, M., et al. 2015, arXiv:1506.03085
- Wellons et al. (2015) Wellons, S., Torrey, P., Ma, C.-P., et al. 2015, MNRAS, 449, 361
- Wuyts et al. (2010) Wuyts, S., Cox, T. J., Hayward, C. C., et al. 2010, ApJ, 722, 1666
- Yan et al. (2006) Yan, R., Newman, J. A., Faber, S. M., et al. 2006, ApJ, 648, 281
- Zolotov et al. (2015) Zolotov, A., Dekel, A., Mandelker, N., et al. 2015, MNRAS, 450, 2327