RAVEN AND THE CENTER OF MAFFEI 1: MULTI-OBJECT ADAPTIVE OPTICS OBSERVATIONS OF THE CENTER OF A NEARBY ELLIPTICAL GALAXY AND THE DETECTION OF AN INTERMEDIATE AGE POPULATION 11affiliation: Based on data obtained at Subaru Telescope, which is operated by the National Optical Observatory of Japan. 22affiliation: This research has made use of the NASA/IPAC Infrared Science Archive, which is operated by the Jet Propulsion Laboratory, California Institute of Technology, under contract with the National Aeronautics and Space Administration.
Abstract
Near-infrared (NIR) spectra that have an angular resolution of arcsec are used to examine the stellar content of the central regions of the nearby elliptical galaxy Maffei 1. The spectra were recorded at the Subaru Telescope, with wavefront distortions corrected by the RAVEN Multi-Object Adaptive Optics science demonstrator. The Ballick-Ramsey C2 absorption bandhead near m is detected, and models in which of the light near m originates from stars of spectral type C5 reproduce this feature. Archival NIR and mid-infrared images are also used to probe the structural and photometric properties of the galaxy. Comparisons with models suggest that an intermediate age population dominates the spectral energy distribution between 1 and m near the galaxy center. This is consistent not only with the presence of C stars, but also with the large H index that has been measured previously for Maffei 1. The color is more-or-less constant within 15 arcsec of the galaxy center, suggesting that the brightest red stars are well-mixed in this area.
1 INTRODUCTION
Galaxies that host dominant spheroidal components are present in large numbers over a wide range of look-back times (e.g. Mortlock et al. 2013). While spheroids as a group may share some common morphological characteristics, this is not indicative of a common evolutionary pedigree. Indeed, in the local universe spheroids are likely the result of processes as diverse as mergers (e.g. Barnes 1992) and secular evolution (e.g. Kormendy & Kennicutt 2004).
Insights into the origins of a spheroid can be gleaned from the detailed investigation of its stellar content and structural properties. The central regions of galaxies are prime targets for such investigations, as the deepest part of the gravitational well harbors signatures of past events that played key roles in sculpting the system’s present-day appearance. Nearby galaxies are of particular interest, as their central regions can be explored with intrinsic spatial resolutions that are not possible for more distant objects. As a large classical elliptical galaxy in one of the nearest galaxy groups, Maffei 1 is an important laboratory for examining the evolution of spheroids in moderately dense environments. A frustrating complication is that Maffei 1 is observed through the plane of the Milky-Way, and efforts to investigate its star-forming history (SFH) are confounded by foreground extinction and field star contamination.
Buta & McCall (1999) conducted the first comprehensive survey of the photometric and structural properties of Maffei 1 and its neighbors. They detected a web of dust lanes that may or may not be physically connected to the galaxy. They concluded that (1) Maffei 1 has one of the largest angular extents of any galaxy, and (2) the light profile follows an law, making it a ‘pure’ elliptical galaxy.
Davidge & van den Bergh (2001) and Davidge (2002) observed Maffei 1 with adaptive optics (AO) systems in the near-infrared (NIR) to characterize the photometric properties of the brightest resolved asymptotic giant branch (AGB) stars. Davidge (2002) found that the band luminosity function (LF) of the brightest stars in the outer regions of the galaxy matches that found in NGC 5128, and argued that these bright AGB stars are probably among the most metal-rich members of an old population. Davidge & van den Bergh (2005) searched for globular clusters belonging to Maffei 1, and measured a cluster specific frequency that is comparable to that in other elliptical galaxies in low density environments. Candidate blue globular clusters were also found, hinting at recent star-forming activity. In addition, Davidge (2002) discovered a blue nucleus in the central arcsec ( pc), which is a source of H emission (Buta & McCall 2003). Fingerhut et al. (2003) found that H in Maffei 1 has an equivalent width of 3.6Å in absorption, which is greater than what is seen in the vast majority of nearby ealy-type galaxies (e.g. Trager et al. 1998).
Wu et al. (2014) resolved red giant branch (RGB) and AGB stars in HST images of Maffei 1. While the primary goal of their study was to estimate the distance to Maffei 1 using the brightness of the RGB-tip, their observations also provide insights into stellar content. The brightest AGB stars in their (F110W, F110W–F160W) color-magnitude diagram (CMD) of Maffei 1 have intrinsic brightnesses that are magnitude fainter in F110W than those in an M31 bulge field (Figure 11 of Wu et al. 2014). If the evolved red stellar content of the M31 bulge is similar to that of other spheroids (e.g. Davidge 2002), and if the brightest stars in the M31 bulge CMD are not disk interlopers, then this difference in peak intrinsic stellar brightnesses is difficult to explain unless the stellar content of Maffei 1 systematically differs from that of other spheroids.
In the present study, NIR spectra are used to probe the evolved red stellar content of the central few arcsec of Maffei 1. These spectra were obtained with the RAVEN Multi-Object Adaptive Optics (MOAO: Lardière et al. 2014; Andersen et al. 2012) science demonstrator, which feeds turbulence-corrected wavefronts to the Infrared Camera and Spectrograph (IRCS: Tokunaga et al. 1998) on the 8 meter Subaru telescope. The spectra span the m region and have arcsec angular resolution. The brightest AGB stars contribute significantly to the integrated light in the infrared, and the most prominent absorption features in the NIR spectra of K and M giants are overtone bands of CO. There are other molecular features in this wavelength region, such as the Ballick-Ramsay C2 bandhead near m, that has the potential to provide powerful age information if detected.
The spectra are supplemented with archival broad-band NIR and mid-infrared (MIR) images that are used to probe the photometric and structural properties of Maffei 1. These data bracket the wavelength interval sampled by the spectra, while also probing wavelengths where the impact of dust absorption is reduced and the light originates from stars that belong to the populations that contribute the bulk of the underlying stellar mass. The information obtained from such images provides additional clues into the recent evolution of Maffei 1.
Various distance estimates for Maffei 1 are summarized in Table 1. The entries in this table indicate that Maffei 1 has a distance that is comparable to or – for the most recent estimates – even lower than that of NGC 5128 (Cen A; Mpc, Harris et al. 2010). The distance measured by McCall (2014) hinges on the Humphreys et al. (2013) maser distance determination to NGC 4258, and is adopted for calculating spatial scales throughout this paper. For consistency, we also adopt the Fingerhut et al. (2003) reddening estimate, which is based on an optical depth at m of .
| Distance | Source | Method |
|---|---|---|
| (Mpc) | ||
| Tonry & Lupinno 1993 | Surface Brightness Fluctuations | |
| Davidge & van den Berg (2001) | AGB-tip | |
| Fingerhut et al. (2003) | Fundamental plane and D | |
| Fingerhut et al. (2007) | Fundamental plane | |
| Wu et al. (2014) | RGB-tip | |
| McCall (2014) | Fundamental plane |
The paper is structured as follows. Details of the observations and the processing of the spectra and the images used in the structural analysis are presented in Section 2. The isophotal properties of Maffei 1 in the NIR and MIR are examined in Section 3, while the spectra are investigated in Section 4. A summary and discussion of the results follows in Section 5.
2 OBSERVATIONS
2.1 Spectra
Spectra of Maffei 1 were recorded with the Subaru IRCS during the commissioning of the RAVEN MOAO science demonstrator on UT August 11, 2014. Six 300 sec exposures were recorded of Maffei 1. These were the first observations of an extragalactic target to be recorded with RAVEN. The star HD18077 was observed immediately following Maffei 1 to monitor telluric absorption features and also to provide calibration information to remove the thermal background. This star is degrees East of Maffei 1, and so was observed at an airmass that is comparable to that of Maffei 1. With a spectral-type A2V, HD18077 is a suitable template for removing telluric signatures without affecting the absorption features that are seen in Maffei 1.
The corrected field of view (FOV) in classical AO systems is limited by isoplanatism – the light paths of objects separated by angular offsets in excess of a few arcsec pass through different atmospheric turbulence cells, and so the optimal correction towards one object differs from that towards another. MOAO overcomes this limit on the FOV by separating the sensing and correction of wavefront distortions. At least three guide stars are used in an MOAO system to construct a three dimensional tomographic map of the turbulence across the science field. RAVEN has three natural guide star wavefront sensors (WFSs) that patrol a 3.5 arcminute diameter field as well as an on-axis WFS designed for use with the Subaru laser guide star; the latter was not used during these observations. The delivered level of correction depends on how well the turbulence is mapped, and future facility MOAO systems will likely deploy more WFSs over even larger fields to minimize residual tomographic wavefront error.
Wavefront correction in MOAO systems is done individually for each science target. The use of separate optical paths with autonomous deformable mirrors (DMs) means that the optimal AO correction can be applied for each target, and future facility MOAO instruments may have many parallel science channels. As an MOAO science demonstrator, RAVEN has just two science pick-offs that patrol the 3.5 arcminute field. Wavefront distortions are corrected by an element DM in each science path.
By separating the sensing and correction of atmospheric turbulence, MOAO systems must operate in open loop mode. Open loop control requires the WFSs to have a very large dynamic range; that is, they must measure the uncorrected turbulence distortions very accurately, and without the wavefront correction feedback that is present in closed-loop systems. Any non-linearities or hysteresis in the DM will thus degrade performance, since these sources of error are not sensed. While the use of open loop control poses technical challenges, open loop MOAO instruments benefit from compact system design and potentially higher throughput than traditional AO and Multi-Conjugate AO systems.
As a science demonstrator, RAVEN was designed to balance the degree of correction with sky coverage on a limited financial budget; the tomographic error, determined by the number of WFS pick-off arms, is balanced with the fitting error that is set by the number of DM actuators. High Strehl ratios are not expected with Raven. Still, significant gains in the encircled energy are realised. Future facility MOAO systems could produce diffraction-limited performance by employing higher order DMs and a greater density of WFSs.
When used in spectroscopic mode, the light from the two pick-offs is re-imaged side-by-side by Raven onto the long slit of the IRCS. Each science probe feeds a 7 arcsec long segment to the IRCS, with 0.060 arcsec pixel-1 sampling on the ALLADIN III InSb array that is the spectroscopic detector. This detector has a dark current e- sec-1, and this is roughly two orders of magnitude lower than the signal from Maffei 1 detected at the slit ends in .
For these observations one science pick-off sampled the center of Maffei 1, and the other sampled a field along the minor axis 1 arcmin from the galaxy center. The light was dispersed with the HK grism, and the spectral resolution is with pixel-1 sampling. The band spectrum has a disappointing S/N ratio and does not probe the same radial extent as the band spectra, probably due in part to high levels of emissivity from warm optics in RAVEN. The band spectrum is not considered further.
The individual spectra were combined by taking the median signal at each pixel location. The median was selected for image combination as it is a more robust statistic in the presence of outliers (e.g. as could result from cosmic-rays) when only a modest number of exposures are available. Instrumental and atmospheric signatures were then removed to produce a two-dimensional spectrum from which binned spectra covering various radial intervals could be extracted (Section 4). This involved the following steps. First, the two-dimensional spectrum was divided by a flat-field frame constructed from images of dispersed light from a continuum source. Next, a thermal background calibration frame was constructed from dithered observations of HD18077. This was subtracted from the flat-fielded spectra to remove thermal emission from the sky and from warm opto-mechanical elements along the optical path.
Telluric emission lines were then subtracted from the spectrum. Initially, it was thought that this could be done by subtracting the light from the science pick-off that samples off-nucleus light. However, the throughput of this science path was found to differ from that of the pick-off that sampled Maffei 1, and residual sky lines remained after differencing. Residual sky features were then removed by finding a scaling factor that could be applied to the off-nucleus channel that suppressed residuals near the edge of the Maffei 1 science pick-off slit segment. The resulting sky-subtracted spectrum was then wavelength calibrated using a dispersion solution that was obtained from Ar arc lamp observations. The final processing step was to remove telluric absorption features. This was done by dividing the Maffei 1 spectrum by a spectrum of HD18077 that was normalized to unity and that had Brackett absorption lines removed after modelling these features with Voigt line profiles.
2.2 Archival Imaging Data
2.2.1 SPITZER Observations
Observations of Maffei 1 in [3.6] and [4.5] were recorded as part of Spitzer program 57359 (PI: K. Mansi). The Spitzer images were recorded over three epochs with a different satellite orientation for each epoch. The exposure time is 93.6 sec per epoch, and the angular resolution is arcsec ( pc) FWHM.
Stacked images for each epoch were available as Post-Basic Calibrated Data (PBCD) from the Infrared Processing and Analysis Center (IPAC) Spitzer Heritage Archive 333http://sha.ipac.caltech.edu/applications/Spitzer/SHA/. While the central few arcsec of Maffei 1 are saturated in these images, they are still of interest because they sample the circumnuclear region at wavelengths where much of the light comes from the luminous red stars that also dominate the NIR spectrum of Maffei 1. The PBCD images from each epoch were rotated and aligned to a common reference frame, and then averaged together. The results were trimmed to the arcmin2 area of common overlap. Background light levels were measured arcmin from the galaxy center along the minor axis of Maffei 1, near the edge of the trimmed images, and these background levels were subtracted from the combined images. The [3.6] image was convolved with a Gaussian to match the angular resolution of the [4.5] image.
2.2.2 2MASS Observations
, , and images of Maffei 1 were downloaded from the IPAC Large Galaxy Atlas (LGA: Jarrett et al. 2003) host 444http://irsa.ipac.caltech.edu/applications/2MASS/LGA/. The LGA images cover a arcmin2 field, with an angular resolution of arcsec ( pc) FWHM. The and images were smoothed to match the angular resolution in . Background sky levels were measured along the minor axis near the field edges, and the results were subtracted from the LGA images.
3 RESULTS: Broad-Band imaging
3.1 Isophotal Properties
The structural properties of a galaxy are an important part of its fossil record, providing insights into past events that are complementary to those gleaned from the spectral-energy distribution (SED). A complication for Maffei 1 is that it is obscured by a complex web of dust absorption (Buta & McCall 1999; 2003). Structure in the dust distribution may skew isophotal measurements, with the greatest potential impact at wavelengths m. This being said, the presence of dust and its physical relationship with Maffei 1 is of interest since – if it is associated with Maffei 1, and not the foreground – then it is a possible signature of a recent merger or accretion event. In this study, the isophotal properties of Maffei 1 are investigated using the archival Spitzer and 2MASS images described in Section 2. The effects of dust absorption are greatly reduced at these wavelengths when compared with the visible part of the spectrum. In addition, the stars that contribute most of the light at these wavelengths originate from the populations that likely dominate the stellar mass of Maffei 1.
Isophotal measurements were made with the ellipse program (Jedrzejewski 1987), as implemented in STSDAS. Foreground stars complicate the fitting of isophotes to Maffei 1. It is difficult to remove contaminating stars that are close to the center of Maffei 1 from the images as they are projected against a bright, non-uniform background. Many are saturated, and this renders their removal problematic. Given these difficulties, the sigma-clipping option in ellipse was used to mask regions in which residuals deviated from the fit at the and higher level, as experiments indicated that this level of clipping effectively masks stars.
If the point spread function (PSF) of a star is not completely removed by sigma-clipping then residual signal in the outer wings of the PSF might skew the isophotal measurements, although this is mitigated by azimuthal averaging. The PSFs of the brightest stars can be traced out to a radius of arcsec before blending into the background noise. Therefore, if the surface brightness measurements are skewed by residual signal in the PSF wings then structure on an 18 arcsec angular scale (i.e. twice the PSF radius) would be present.
The influence that unsuppressed signal from the PSF wings might have on the surface brightness measurements was assessed quantitatively using the residual images that are produced by subtracting a galaxy model based on the fitted isophotes from the initial images. The statistical properties of pixel intensities in selected rectangular regions of the residual image were examined. The regions for investigation were selected (1) based on the absence of stars as determined by visual inspection, and (2) because they sample radial distances that exceed those that will be affected by residual PSF wing signatures. The dispersions in pixel intensities in these regions suggest that faint PSF wings may account for no more than magnitude uncertainty in the surface brightness at the largest radius that was photometered in [3.6], and magnitude in [4.5]. This is an upper limit as the dispersion includes photon noise from the sky and the main body of the galaxy. An examination of the 2MASS residual images yields similar results. We conclude that the isophote-subtracted SPITZER and 2MASS images are largely free of the distortions that would be expected if isophote fitting was skewed by individual stars.
The surface brightness, ellipticity, and the fourth order coefficient of the Fourier expansion of the isophotes – B4 – found by running ellipse on the 2MASS and SPITZER [4.5] images are shown in Figure 1. The measurements obtained from the and images are similar to those in , and so are not plotted. Likewise, the isophotal measurements made in [3.6] are very similar to those in [4.5], and so are also not shown. The surface brightnesses were computed using photometric calibration information in the image headers while the [4.5] surface brightness measurements were calibrated using zeropoints from Reach et al. (2005).
The inner few arcsec of Maffei 1 are saturated in [4.5], and this fixes the inner radius of measurements in this filter to arcsec. The angular resolution of the 2MASS images is poorer than that of the SPITZER images. However, the nucleus is not saturated. There is thus overlap with the RAVEN observations, albeit with poorer angular resolution.
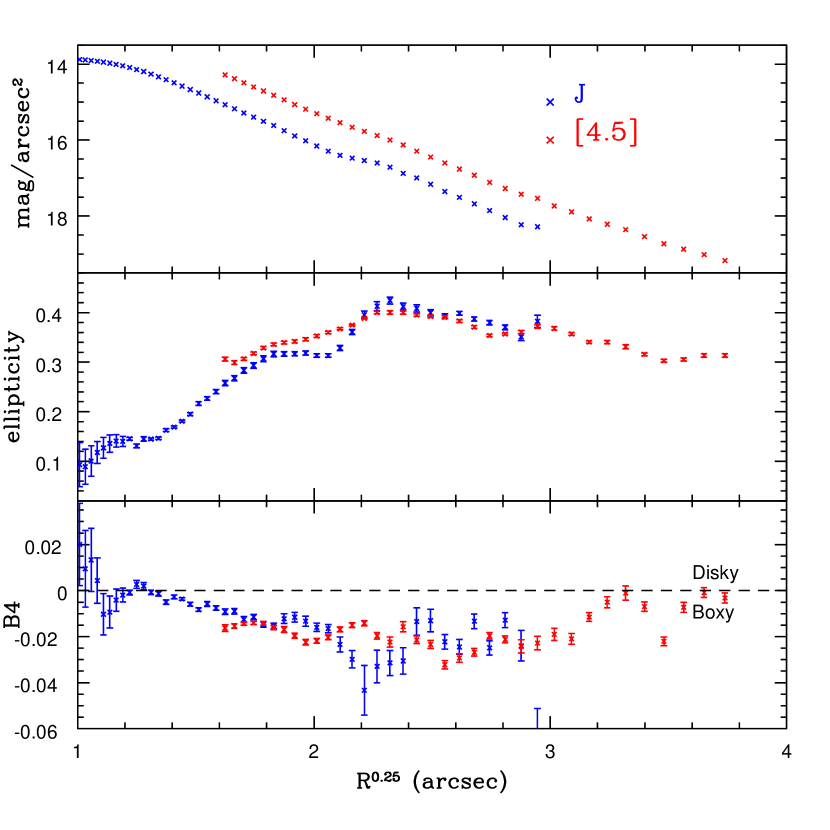
The and [4.5] surface brightness measurements both follow an R1/4 profile. The isophotes in and [4.5] tend to become progressively flatter (i.e. trend to higher ellipticities) from arcsec to arcsec. This trend reverses at arcsec, with the isophotes becoming progressively rounder with increasing radius. The ellipticities in Figure 1 are broadly consistent with those measured by Buta & McCall (2003) at shorter wavelengths. The radial trends in ellipticity in and [4.5] differ between 10 and 25 arcsec, and in Section 3.2 it is shown that this radial interval hosts a population that contains very red bright objects.
B4 distinguishes between boxy (B4 ) and disky (B4 ) isophote shapes (e.g. Carter 1978). Ellipticals that have boxy isophotes are thought to be the result of major mergers (e.g. Khochfar & Burkert 2005; Naab et al. 1999). The frequency of boxy isophotes in galaxies increases towards progressively longer wavelengths (e.g. Bureau et al. 2006), and this has been attributed to the diminished impact of dust absorption towards longer wavelengths (e.g. Bureau et al. 2006), which makes obscured structures easier to detect. The mix of stellar types that dominate the light at different wavelengths may also play a role in the trend between B4 and wavelength.
The structural information obtained from the image shows a tendency for B4 to become more disk-like with decreasing radius for arcsec. At these radii the NIR surface brightness profile flattens and the ellipticity becomes rounder. Buta & McCall (2003) find that B4 transitions to positive values at radii arcsec, as would be expected if the innermost regions of Maffei 1 harbored a disk. A central disk could have formed if rotationally supported material was channeled into the central regions of the galaxy. At radii in excess of a few arcsec the B4 measurements in Maffei 1 tend to be negative, but approach zero at radii arcsec.
3.2 The Infrared Spectral-Energy Distribution
A large fraction of the light from old and intermediate age stellar systems in the NIR and MIR originates from the most evolved stars, and so photometry in this wavelength region provides information that is complementary to photometric measurements at visible wavelengths, where sub-giant branch and main sequence stars contribute significantly to the integrated light. The color profile constructed from the 2MASS surface brightness measurements is shown in the upper left hand corner of Figure 2. The radial behaviour of is very similar to that of in Figure 24 of Buta & McCall (1999). is more-or-less constant at radii arcsec. There is no evidence for a blue nucleus in the 2MASS data, although with a 3 arcsec angular resolution the light from a compact nucleus is significantly blurred.
The near-constant color at radii arcsec suggests that the properties of the brightest red stars do not vary greatly with radius near the center of Maffei 1, which is where the B4 coefficient trends towards more disky values. Given the near-constant color in this interval then absorption features in the NIR spectrum might be expected to be radially uniform near the galaxy center. It is shown in Section 4 that – the nucleus aside – this appears to be the case.
peaks near arcsec. The red color at this radius suggests that there is a larger contribution from luminous red stars with lower effective temperatures than at other radii. The radial trend in ellipticity obtained from the 2MASS image changes at this radius (Figure 1), suggesting that the changes in and the structural properties are linked.
Maffei 1 becomes progressively rounder (i.e. ellipticity drops) with increasing radius at large radii, while the isophotes retain a boxy shape. There is also a tendency for to become smaller with increasing radius when arcsec. Such gradients in the outer regions of classical elliptical galaxies are typically interpreted as the consequence of radial changes in metallicity (e.g. Tamura et al. 2000).
While the NIR light is primarily photospheric in origin, thermal emission from dust with temperatures of a few hundred K in circumstellar shells around AGB stars may contribute significantly to the MIR light. The luminosity and SED of this circumstellar emission is linked to the initial mass and the metallicity of the host star, in the sense that AGB stars with massive, metal-rich progenitors are expected to have higher rates of mass loss and hence thicker dust envelopes than those that have a lower mass and/or are more metal-poor. Photometry in the MIR thus provides a potential probe of the SFH. The potential utility of emission in the m regime as a tracer of SFH was demonstrated by Davidge (2014) who showed that the model [4.5] luminosity function of the brightest AGB stars in M32 obtained by adopting the SFH found by Monachesi et al. (2012) from stars near the main sequence turn-off is in good agreement with the observations.
In order to combine the 2MASS and Spitzer photometric measurements, the [4.5] image was convolved with a Gaussian and re-sampled to match the angular resolution and sampling of the 2MASS image. ellipse was then run on the smoothed image, and the resulting –[4.5] color curve is shown in the lower left hand panel of Figure 2. The –[4.5] curve has a similar shape to the curve at radii arcsec, although at radii arcsec there is not a clear color gradient.
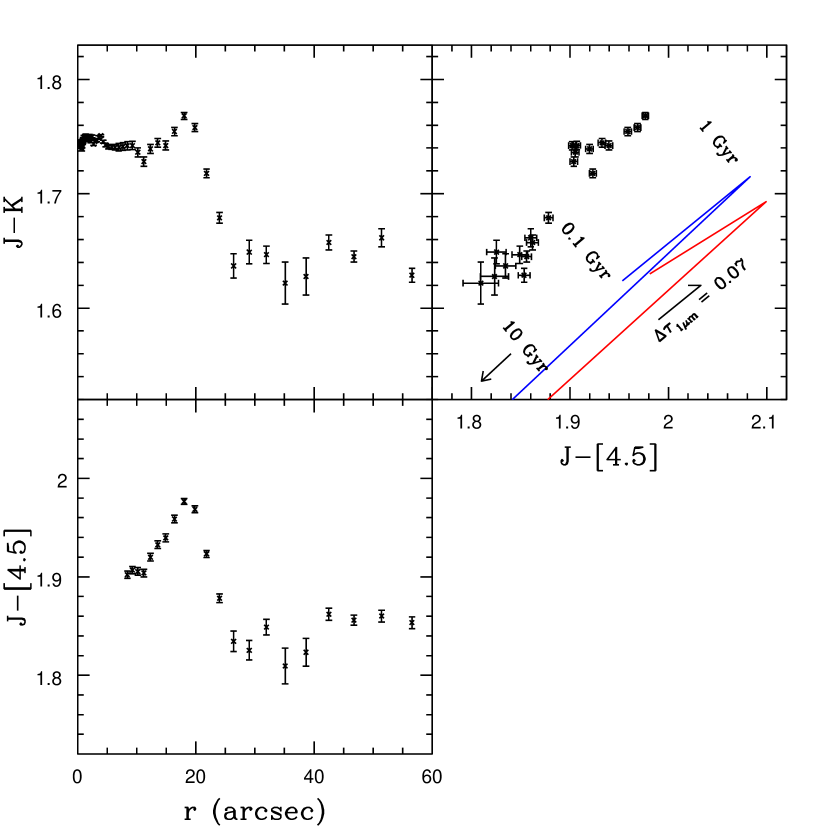
Two color diagrams (TCDs) are one means of comparing observed SEDs with model predictions. The TCD of Maffei 1 is shown in the upper right hand panel of Figure 2. Simple stellar population (SSP) sequences constructed from the Marigo et al. (2008) isochrones are compared with the Maffei 1 measurements in the upper right hand corner of Figure 2. Stars in an SSP have the same age and metallicity; SSPs thus assume an idealized situation in which the component stars are the result of a single instantaneous star-forming episode.
The models were downloaded from the Padova observatory website 555http://stev.oapd.inaf.it/cgi-bin/cmd, and incorporate evolution on the thermal-pulsing AGB (TP-AGB) using the procedures described by Marigo & Girardi (2007). Emission from circumstellar dust is included using the models described by Groenewegen (2006), adopting a silicate AlOx mix for M stars, and a AMC SiC mix for C stars. While the chemical composition of circumstellar dust is uncertain and can affect the SED of the emission, this only becomes significant at wavelengths m (e.g. Figure 1 of Groenewegen 2006).
A Chabrier (2001) mass function was assumed, and the model SSP colors were reddened to (Fingerhut et al. 2003) using the monochromatic extinction curve of Fitzpatrick (1999). Extinction coefficients were computed with the York Extinction Solver (McCall 2004), which is hosted by the Canadian Astronomical Data Center 666http://www.cadc-ccda.hia-iha.nrc-cnrc.gc.ca/community/YorkExtinctionSolver/. The ratios of the extinction in each filter to assuming R are 0.752 (J), 0.324 (K), and 0.133 ([4.5]). The reddening vector, shown in the lower right hand corner of the TCD, parallels the isochrones. Models in which TP-AGB evolution is suppressed have much smaller and colors than the sequences shown in Figure 2, and fall outside of the color range examined in the figure.
Incomplete knowledge of the physical processes at work during TP-AGB evolution and the emission characteristics of circumstellar dust are among the potential sources of uncertainty in the models shown in Figure 2. The rate of mass loss prior to the onset of the TP-AGB can also affect the lifetimes of TP-AGB stars, and hence the contribution that they make to the total light from an SSP (Rosenfeld et al. 2014). This being said, adopting a different mineralology for the circumstellar dust does not change significantly the location of the models in Figure 2. The placement of the models are also only mildly sensitive to RV.
While there is an offset between the models and observations in the TCD, it is encouraging that the model sequences parallel the locus of points in Maffei 1, suggesting that the models track differences in the properties of TP-AGB stars well, and that age – rather than metallicity – is the dominant driver of the radial color variation within 60 arcsec of the nucleus. In fact, the locus of points on the TCD defined by observations at arcsec breaks off to the left on the TCD, as predicted by the models if the luminosity-weighted age in the inner regions of Maffei 1 is younger than at arcsec. Based solely on color, the central r arcsec region of Maffei 1 has a luminosity-weighted age Gyr, indicating that a substantial intermediate age component is present. Spectroscopic signatures of an intermediate age population might then be expected in the central regions of Maffei 1.
4 SPECTRA
4.1 The Light Profile Extracted from the Spectra
Before investigating the absorption spectrum of the central regions of Maffei 1, we first examine the light profile constructed from the IRCS spectrum. Pseudo broad-band photometric measurements were obtained by averaging the counts along the dispersion axis between 1.55 and 1.8m. No attempt was made to reproduce a standard filter response function, although the wavelength limits used here roughly approximate the boundaries of the filter. Given the slit orientation, the resulting light profile samples the minor axis.
The light profile constructed from the spectrum is shown in Figure 3. There is a pronounced central peak that has a characteristic width of 0.1 – 0.2 arcsec. The solid line in the right hand panel is the Buta & McCall (2003) profile of Maffei 1 obtained from WFPC2 observations in F814W, and translated onto the minor axis by applying the ellipticities in their Figure 9. The Buta & McCall (2003) profile has also been shifted along the y axis to match the Subaru profile at log(r) . There are only small differences between the Subaru and HST light profiles, suggesting that the RAVEN-corrected PSF has a characteristic width that is not vastly broader than that produced by HST.

4.2 The Radial Strengths of Absorption Features
Spectra were extracted in various radial intervals to examine the uniformity of the stellar content. The binning intervals, indicated in the left hand panel of Figure 3, were selected based on angular resolution and S/N ratio. The extracted spectra were convolved with a gaussian along the dispersion axis to simulate the higher velocity dispersion in the nuclear spectrum, and all spectra were shifted into the rest frame to correct for rotation within Maffei 1.
The mean of the extracted circumnuclear spectra in the –0.90, 0.90, and 1.62 arcsec intervals in Figure 3, referred to here as the circumnuclear spectrum, and of the nucleus are shown in Figure 4. Spectra of K and M giants from the compilation of Rayner et al. (2009), processed to match the effective spectral resolution and wavelength sampling of the Maffei 1 observations, are also shown in this figure. The stars in the Rayner et al. (2009) compilation are in the Galactic disk, and so likely have solar metallicities and chemical mixtures. All spectra in Figure 4 have been divided by a continuum function.
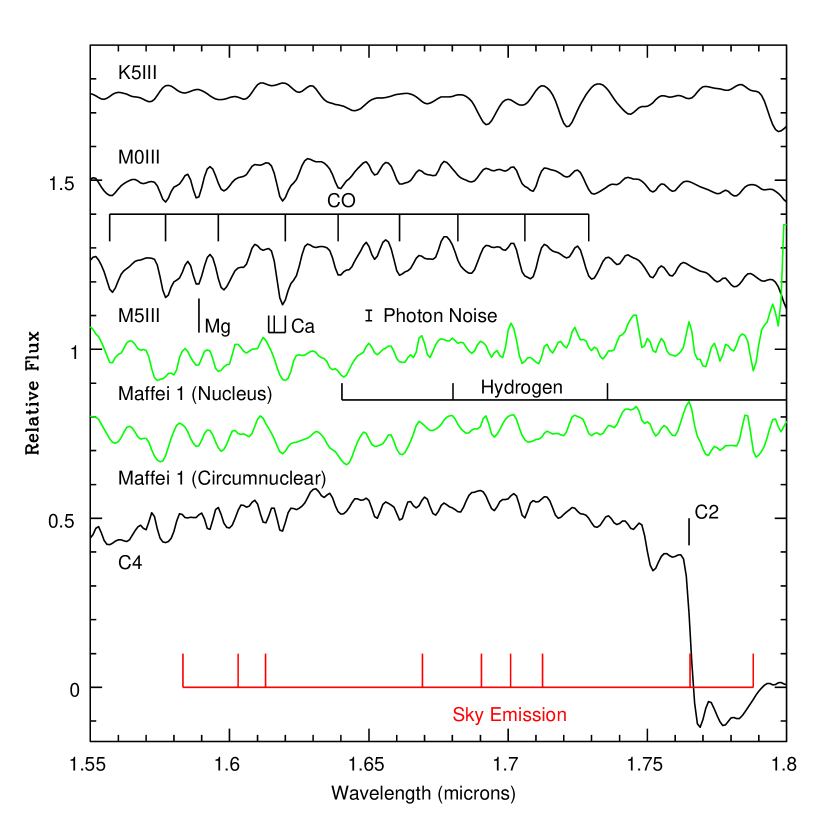
Various molecular and atomic absorption features are marked in Figure 4. The second overtone bands of CO are the dominant features in the H-band spectra of late-type giants. However, some atomic transitions are also detected at this resolution, and the deepest absorption feature in the H-band spectra of M giants and the nucleus of Maffei 1 is a blend of Ca and CO. While Buta & McCall (2003) found centrally-concentrated H emission, Brackett hydrogen emission is not seen in the Maffei 1 spectra.
There is reasonable agreement between the spectra of Maffei 1 and the M0III template between 1.55 and 1.65m. However, at longer wavelengths the quality of agreement degrades. A similar situation is seen in the band spectrum of the lenticular galaxy NGC 5102, which Miner et al. (2011) compare with the spectrum of M32 in their Figure 1. The Ballick-Ramsey C2 band head near m is a prominent C star signature, and Miner et al. (2011) detect it in their spectrum of NGC 5102. The Maffei 1 spectra show a break near 1.76m that is similar to that in the Miner et al. (2011) NGC 5102 spectrum, hinting that the stellar content of the central regions of Maffei 1 may be more closely related to that of the center of NGC 5102, which contains a large population with an age Gyr (Davidge 2015), than to that of older (e.g. 3 – 4 Gyr) systems like M32. If – as suggested by the NIR and MIR colors discussed in Section 3 – the NIR light is dominated by a large population with an age Gyr then C stars might be present in Maffei 1.
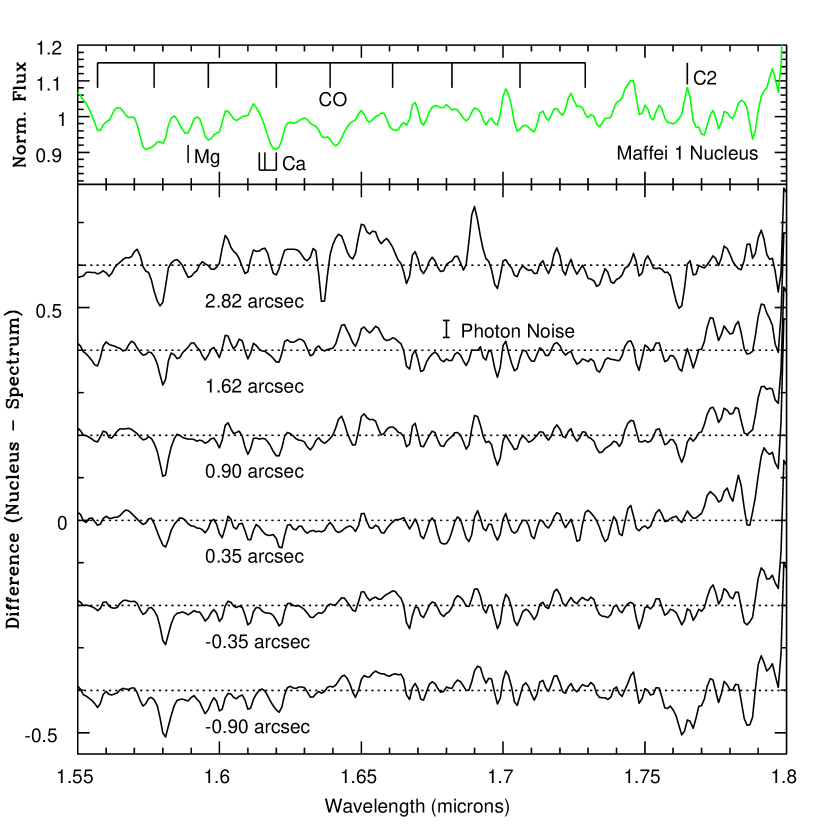
The uniformity of line strengths along the IRCS slit is examined in Figure 5. The nuclear spectrum of Maffei 1 from Figure 4 is re-plotted in the top panel of Figure 5, while the differences between the nuclear spectrum and the extracted spectra in the circumnuclear environment are shown in the lower panel. There are similarities among the differenced spectra in Figure 5, suggesting that the brightest red stars in the circumnuclear region are uniformly mixed with radius. Many of the strongest residuals coincide with the CO band heads, and the residuals are such that these features are stronger in the nucleus than in the circumnuclear region. The nucleus thus contains a stellar mix that differs from that in its immediate surroundings.
4.3 Comparison with Models
The stellar content of the central regions of Maffei 1 is explored in this section by making comparisons with model spectra. The spectra of the central regions of Maffei 1 are found to contain signatures of an intermediate age population that contributes significantly to the NIR light, as might be expected given the broad-band IR colors discussed in Section 3. Comparisons are made with two sets of published models (Section 4.3.1) and with models constructed from the Rayner et al. (2009) spectral library (Section 4.3.2). The models are restricted to SSPs, and a detailed breakdown of the SFR as a function of time in Maffei 1 will best be done with spectra that span a broader wavelength interval than considered here.
4.3.1 Comparisons With Published Models
There is only a modest body of published NIR model spectra that can be compared with the observations, and these models tend to have a low spectral resolution. For the present work, model spectra from the Bag of Stellar Tricks and Isochrones (BaSTI; Cordier et al. 2007) and Maraston (1998; 2008) are considered. These models have a spectral resolution . While having a low resolution, these models have the merit of covering a broad range of ages and metallicities, and allow discernible age signatures to be examined. They thus provide a guide for identifying promising features for more detailed examination. The Cordier et al. (2007) and Maraston (1998; 2005) models reproduce some of the broad-band photometric properties of star clusters (e.g. Salaris et al. 2014), which is an important test of their validity.
Solar metallicity SSP models are shown in the left hand (BaSTI) and right hand (Maraston) panels of Figure 6. A Chabrier (2001) IMF was used to construct the BaSTI models, while a Kroupa (2001) IMF was adopted for the Maraston models. This difference in IMFs should not be a concern when considering SSPs at these wavelengths as a large fraction of the light near m originates from stars that are highly evolved, and thus span a small mass range.
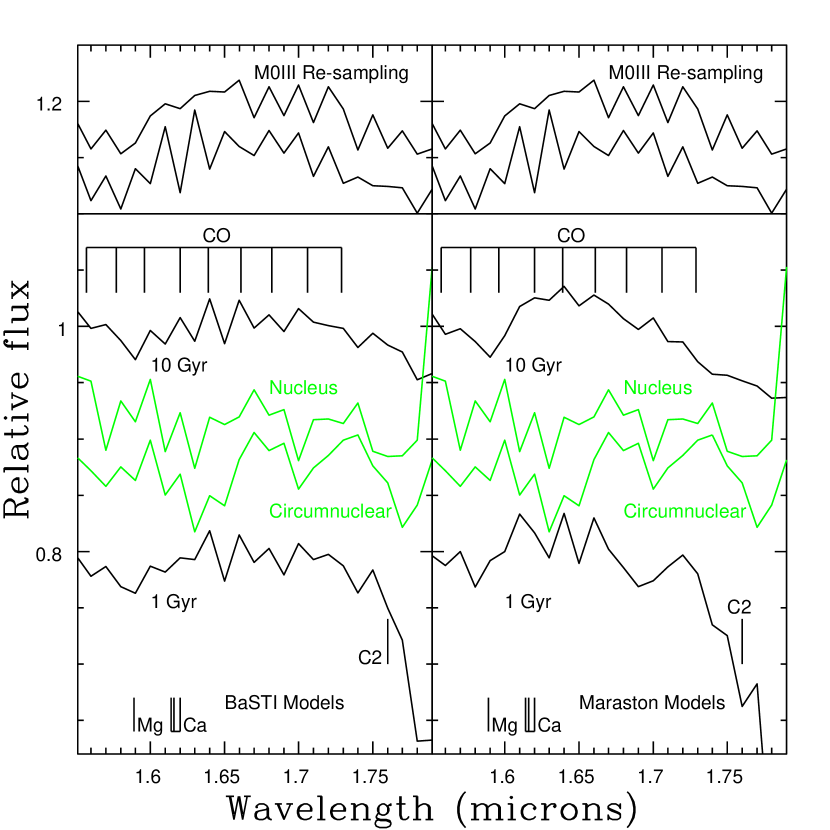
The low spectral resolution of the models causes deep absorption features to be blended together, and so the starting wavelength for binning can influence the appearance of the models. The affect of the starting wavelength for binning at this resolution is investigated in the top panels of Figure 6, where spectra of an M0III star from Rayner et al. (2009) are compared. The spectra in the top panel show the result of changing the initial wavelength for binning by one-half of a resolution element, thereby showing the largest difference that might be expected. There are significant differences between the two spectra. While the locations of absorption features in the two spectra are similar, the depths of absorption features depend on the starting wavelength. The largest differences are evident in the m wavelength region.
There are noticeable differences between the BaSTI and Maraston models. In addition to binning-related effects, these are likely due to differences in the source spectra from which the models are constructed and the methods used to construct the evolutionary sequences upon which the models are based. The techniques used to model the TP-AGB in the BaSTI models are described by Cordier et al. (2007). Evolution prior to the onset of thermal pulses is tracked with a conventional stellar structure code. The TP-AGB is modelled using the techniques described by Iben & Truran (1978), and includes hot-bottom burning and mass loss. The effective temperature at each point on the TP-AGB is computed from relations that link total stellar mass and the mass of the carbon-oxygen core.
In contrast to the BaSTI models, the Maraston (1998; 2005) models use the fuel consumption theorum to determine the contributions made by stars at different evolutionary stages. Empirically-based calibrations then link evolutionary states to observational properties. There is evidence that models based on the fuel consumption theorum may have difficulty reproducing the numbers of TP-AGB stars in intermediate age LMC clusters (Girardi et al. 2013). The fractional contribution made by C stars to the integrated light is determined using the metallicity-related arguments outlined by Renzini & Voli (1981). C stars are formed at all metallicities, but with a higher frequency and over a broader range of masses towards lower metallicities (Figure 12 of Maraston 2005).
Percival et al. (2009) describe the source spectra used to construct the BaSTI models. Model atmospheres are used for stars warmer than 3500 K, while empirical spectral libraries are adopted for stars with TK, including C stars. Real stellar spectra are used for the cool stellar component to avoid uncertainties in model atmospheres at low effective temperatures. Maraston (2005) also combines model atmospheres and empirical stellar spectra, but uses atmosphere models constructed from a different code than that employed by Percival et al. (2009).
The second overtone CO bands produce a sawtooth pattern that is most noticeable in the 10 Gyr BaSTI model. The 1 Gyr and 10 Gyr models in both panels of Figure 6 have different characteristics, and the CO bands in the Maraston models are noticeably deeper in the 1 Gyr model than in the 10 Gyr model. This age dependence is due to the larger contribution made by luminous, cool AGB stars to the integrated NIR light in the younger model.
While there are substantial differences between the BaSTI and Maraston models, there are also common features. A noteable difference between the 1 and 10 Gyr models in both sets of models is seen at wavelengths longward of m, and is due to the appearance of the Ballick-Ramsey C2 band in the 1 Gyr models. A corresponding feature is also seen in the nuclear and circumnuclear spectra of Maffei 1, which are also shown in Figure 6. The Maffei 1 spectra were processed to match the resolution of the models, using a starting wavelength for binning that produced the best visual agreement with the models. The appearance of the C2 feature in the Maffei 1 spectra is robust in terms of the initial wavelength for binning.
C stars are expected in populations that span only a limited range of metallicities and ages, and models of single star evolution predict that C stars do not form in populations with an age of 10 Gyr. In the disk of M31 the C/M star ratio decreases towards smaller galactocentric radius (e.g. Brewer et al. 1996; Boyer et al. 2013). While this trend is usually interpreted as a metallicity effect, it could also reflect a dearth of star-forming activity during an epoch that would result in a population of C stars at the present day. Battinelli & Demers (2005) find a clear trend between C star frequency and metallicity in nearby galaxies.
As a moderately large elliptical galaxy, Maffei 1 might be expected to have a solar or higher mean metallicity. This does not preclude the formation of C stars, as models of C star evolution predict that they will form at solar metallicities, albeit with a mass range that decreases with increasing metallicity (e.g. Karakas 2014; Mouhcine & Lancon 2003). The chances of finding other large ellipticals like Maffei 1 that have C star signatures are thus lower than if a sample of (lower metallicity) dwarf ellipticals were compared, as there is a narrower range of SFHs that will produce significant numbers of C stars in the more massive galaxies.
4.3.2 Comparisons With New Models
Neither the BaSTI nor Maraston models give a satisfactory match to the Maffei 1 spectra, even outside of the m interval where binning effects are most pronounced. Thus, given the level of agreement between the Maffei 1 observations and the Rayner et al. (2009) standard stars in Figure 4, a modest suite of model spectra were constructed using the Rayner et al. (2009) stellar library. The models are based on the evolutionary sequences from Marigo et al. (2008), which include advanced stages of evolution that follow prescriptions discussed by Bertelli et al. (1994), Girardi et al. (2000), and Marigo & Girardi (2007). The model spectra are restricted to solar metallicity given that the stars in the Rayner et al. (2009) sample are in the solar neighborhood. Spectral type Teff relations from Pecaut & Mamajek (2013) and Richichi et al. (1999) were used to assign spectral types to the various evolutionary stages. A Salpeter (1955) IMF was assumed. The contribution from faint MS stars is modest when compared with highly evolved objects, and so the use of a different mass function will not change greatly the results. The baseline models assume oxygen-dominated photospheres, although it is shown below that the inclusion of C star spectra improve the agreement with the observations.
The models were smoothed and re-sampled to match the spectral resolution of the IRCS spectra, and the results are compared with the Maffei 1 spectra in Figure 7. The absorption features in the 0.5 and 1 Gyr models are deeper than in the 10 Gyr models, reflecting the larger contribution made by very luminous late-type AGB stars to the integrated NIR light during intermediate epochs. While the depths of absorption features in the Maffei 1 spectra are better matched by the 0.5 and 1 Gyr models than the 10 Gyr model, it should be kept in mind that there is an age-metallicity degeneracy. As a result, 10 Gyr models with super-solar metallicities would likely yield better agreement with the Maffei 1 spectra than the solar metallicity 10 Gyr models.
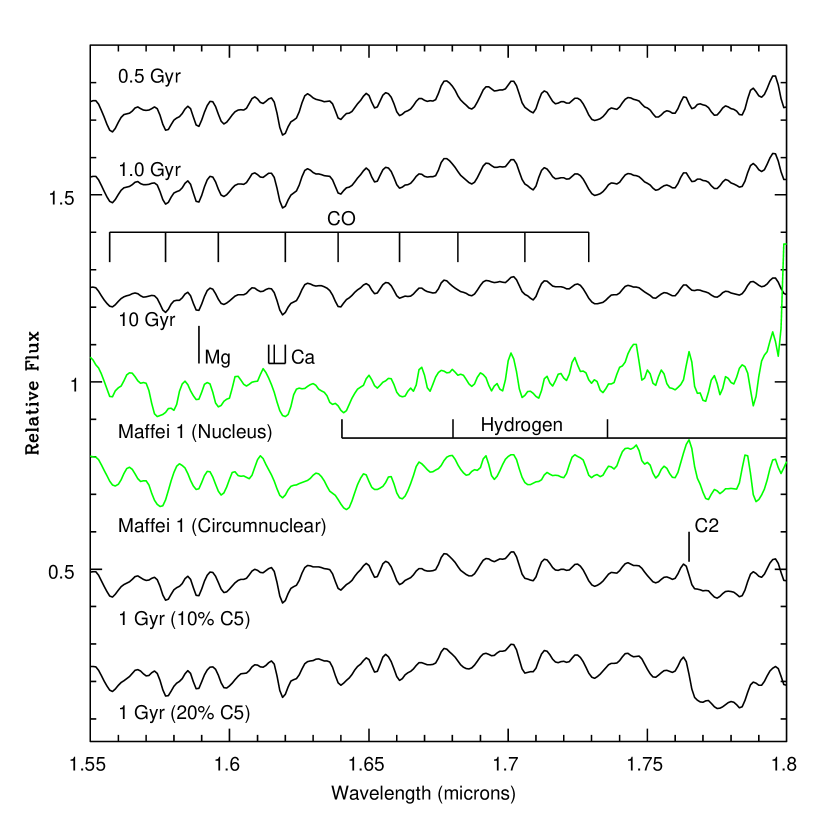
The baseline models in Figure 7 do not match the Maffei 1 spectra in the 1.75 – 1.80m interval, which is the wavelength region containing the Ballick-Ramsey C2 bands. Models were thus investigated in which the spectrum of a C5 star was added. This spectral type is the most common among C stars in the Galactic disk (Alksnis et al. 2001). Models in which a C5 star contributes 10% and 20% of the total light in are shown in Figure 7.
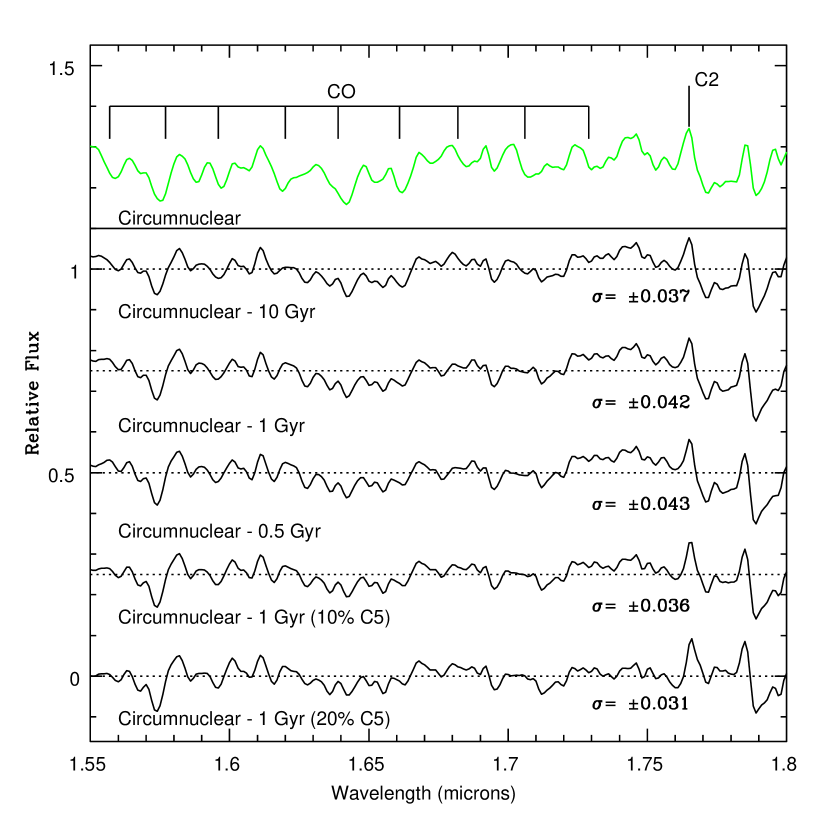
The differences between the circumnuclear spectrum and the various models are shown in Figure 8. The addition of the C5 spectrum yields a better match to the circumnuclear spectrum than the baseline models. The dispersion of the residuals over all wavelengths in the circumnuclear spectrum is at a minimum if 20% of the light comes from C stars. For comparison, the minimum dispersion for the nuclear spectrum occurs when there is a 10% contribution from C stars. The residuals are much larger when C stars are excluded from the models.
5 DISCUSSION & SUMMARY
The stellar content in the central few arcsec of the nearby elliptical galaxy Maffei 1 has been investigated using NIR spectra and archival IR images. The spectra were recorded with RAVENIRCS on the Subaru Telescope. The nucleus of Maffei 1 has an angular size of arcsec FWHM in these data, corresponding to parsecs at the distance of Maffei 1. The good angular resolution delivered by RAVEN is demonstrated in Figure 3, where it is shown that the light profile constructed from the IRCS spectra matches that obtained from the HST. These data thus demonstrate the ability of RAVEN to deliver scientifically interesting angular resolutions.
As one of the nearest large elliptical galaxies, Maffei 1 is an important laboratory for understanding the evolution of early-type galaxies in group environments. The central regions of Maffei 1 harbor important clues of its past evolution. The IR colors of the central 20 arcsec are redder than at larger radii, suggesting that luminous AGB stars contribute a higher fraction of the light within 20 arcsec of the nucleus than at larger radii. In addition, the trend between ellipticity and radius changes markedly along the major-axis near arcsec. The shape of the isophotes as gauged by B4 – the coefficient of the fourth order cosine term in the Fourier expansion of the isophotes – stays more-or-less constant at arcsec. However, at radii arcsec, B4 approaches and exceeds 0, thereby hinting that a disk-like structure is present near the galaxy center. It thus appears that the central 20 arcsec of Maffei 1 differs from the galaxy at larger radii in terms of stellar content and isophotal properties.
Fingerhut et al. (2003) find that the equivalent width of H absorption in Maffei 1 is 3.6Å , which is indicative of an intermediate age population (e.g. Worthey 1994). In the present study additional evidence for an intermediate age population is found in the form of (1) red IR colors near the galaxy center, and (2) an absorption feature longward of m that is identified with C2. Comparisons with models indicate that the depth of the C2 feature can be reproduced if 10 – 20% of the band light originates from stars of spectral type C5, which is the most common spectral type for C stars in the solar neighborhood. The color of the central regions of Maffei 1 suggests an age of Gyr. While it is not clear what uncertainty should be assigned to age estimates made from integrated NIR light and spectra, C stars are expected to make their largest contribution to the light from solar metallicity SSPs at ages Gyr (Figure 12 of Maraston 2005), which is consistent with the age estimated from integrated light. Photometry and spectroscopy thus yield a qualitatively consistent picture of the stellar content of the central regions of Maffei 1.
The origins of the gas that sparked a central star-forming episode in Maffei 1 Gyr in the past is a matter of speculation. One possible source of gas is an interaction with a gas-rich companion. If the companion had a lower mass than Maffei 1 then the accreted gas would have formed stars with a lower metallicity than older stars in Maffei 1, which presumably formed as part of a more massive system. The metallicity distribution function of intermediate age stars near the center of Maffei 1 would then differ from that of older stars in the galaxy. If lower metallicity gas did fuel star formation near the center of Maffei 1 then it would broaden the mass range over which C stars could form.
A merger a few Gyr in the past may have left other observational signatures, although detecting these may prove difficult given the location of Maffei 1 along the Galactic disk plane. There is no evidence for shells at large radii around Maffei 1, although these would be difficult to detect given the substantial line of sight extinction. Residual dust lanes throughout the main body of Maffei 1 might also be expected after a merger with a gas-rich system, although if a merger occured more than a few crossing times in the past then any residual dust may have been consumed and/or dispersed by star formation. Buta & McCall (2003) conclude that the complex network of dust absorption that is visible in their deep HST images is probably Galactic in origin. Finally, the blue globular clusters found by Davidge & van den Bergh (2005) may be remnants of the elevated levels of star formation that would have resulted from a gas-rich merger.
Maffei 1 is in close physical proximity to the barred spiral galaxy Maffei 2 (e.g. McCall 2014). The LGA image of Maffei 2 shows a plume of stars extending to the south of Maffei 2, which is suggestive of a tidal tail. If there was an interaction between Maffei 1 and Maffei 2 then the former galaxy – which is intrinsically brighter and hence should be more massive – may have received gas from the latter. Such an encounter between Maffei 1 and Maffei 2 might also have triggered large scale star formation in Maffei 2. Wu et al. (2014) present NIR CMDs of the outer regions of Maffei 2 and the late type spiral galaxy IC 342, which may be part of the same group as Maffei 2. There is evidence that IC 342 hosts star burst activity (e.g. Isizuki et al. 1990). When compared with IC 342, Maffei 2 has only a modest number of AGB stars, and these have a lower peak brightness. This suggests that there were not elevated levels of star-forming activity in the outer regions of Maffei 2 during intermediate epochs.
Some observational predictions can be made based on the conclusions reached in this study. The color in the central 20 arcsec of Maffei 1 is more-or-less constant, indicating that bright red stars are well-mixed throughout this part of the galaxy. Long slit spectra of Maffei 1 at visible wavelengths should then show signatures of deep H absorption out to a major axis radius of 20 arcsec, at which point evidence may be found for an even younger population in the circumnuclear ring. Spectroscopic signatures of C stars should also be found in NIR spectra throughout the central 20 arcsec. Finally, C stars will contribute an even larger fraction of the light at longer wavelengths than those sampled here by IRCS. One of the most prominent features in the absorption spectrum of C stars occurs in the m wavelength interval, and is attributed to HCNC2H2. Spectra of the central regions of Maffei 1 at this wavelength should show this feature.
References
- (1)
- (2) Alksnis, A., Balklaus, A., Dzervites, U., Eglitis, J., Paupers, O., & Pundure, I. 2001, BaltA, 10, 1
- (3)
- (4) Andersen, D. R., Bardley, C., Lardière, O., et al. 2012, Proc. SPIE, 8447, 3F
- (5)
- (6) Barnes, J. E. 1992, ApJ, 393, 484
- (7)
- (8) Battinelli, P., & Demers, S. 2005, A&A, 434, 657
- (9)
- (10) Bertelli, G., Bressan, A., Chiosi, C., Fagotto, F., & Nasi, E. 1994, A&AS, 106, 275
- (11)
- (12) Boyer, M. L., Girardi, L., Marigo, P., et al. 2013, ApJ, 774, 83
- (13)
- (14) Brewer, J. P., Richer, H. B., & Crabtree, D. R. 1996, AJ, 112, 491
- (15)
- (16) Bureau, M., Aronica, G., Athanassoula, E., Dettmar, R.-J., Bosma, A., & Freeman, K. C. 2006, MNRAS, 370, 753
- (17)
- (18) Buta, R. J., & McCall, M. L. 1999, ApJS, 124, 33
- (19)
- (20) Buta, R. J., & McCall, M. L. 2003, AJ, 125, 1150
- (21)
- (22) Carter, D. 1978, MNRAS, 182, 797
- (23)
- (24) Chabrier, G. 2001, ApJ, 554, 1274
- (25)
- (26) Cordier, D., Pietrinferni, A., Cassisi, S., & Salaris, M. 2007, AJ, 173, 468
- (27)
- (28) Davidge, T. J., & van den Berg, S. 2001, ApJ, 553, L133
- (29)
- (30) Davidge, T. J., & van den Berg, S. 2005, PASP, 117, 589
- (31)
- (32) Davidge, T. J. 2002, AJ, 124, 2012
- (33)
- (34) Davidge, T. J. 2015, ApJ, 799, 97
- (35)
- (36) Fingerhut, R. L., McCall, M. L., De Robertis, M., Kingsburgh, R. L., Komljenovic, M., Lee, H., & Buta, R. J. 2003, ApJ, 587, 672
- (37)
- (38) Fingerhut, R. L., Lee, H., McCall, M. L., Richer, M. G. 2007, ApJ, 655, 814
- (39)
- (40) Girardi, L., Bressan, A., Bertelli, G., & Chiosi, C. 2000, A&AS, 141, 371
- (41)
- (42) Girardi, L., Marigo, P., Bressan, A., & Rosenfield, P. 2013, ApJ, 777, 142
- (43)
- (44) Groenewegen, M. A. T. 2006, A&A, 448, 181
- (45)
- (46) Harris, G. L. H., Rejkuba, M., & Harris, W. E. 2010, PASA, 27, 457
- (47)
- (48) Humphreys, E. M. L., Reid, M. J., Moran, J. M., Greenhill, L. J., & Argon, A. L. 2013, ApJ, 775, 13
- (49)
- (50) Iben, I., & Truran, J. W. 1978, ApJ, 220, 980
- (51)
- (52) Isizuki, S., Kawabe, R., Ishiguro, M., Okumura, S. K., Morita, K-I, Yoshihiro, C., & Kasuga, T. 1990, Nature, 344, 224
- (53)
- (54) Jarrett, T. H., Chester, T., Cutri, R., Schneider, S. E., & Huchra, J. P. 2003, AJ, 125, 525
- (55)
- (56) Jedrzejewski, R. I. 1987, MNRAS, 226, 747
- (57)
- (58) Karakas, A. I. 2014, MNRAS, 445, 347
- (59)
- (60) Khochfar, S., & Burkert, A. 2005, MNRAS, 359, 1379
- (61)
- (62) Kormendy, J., & Kennicutt, R. C. 2004, ARA&A, 42, 603
- (63)
- (64) Kroupa, P. 2001, MNRAS, 322, 231
- (65)
- (66) Lardi‘ere, O., Andersen, D., Blain, C., Bradley, C., Gamroth, D., Jackson, K., Lach, P., Nash, R., et al. 2014, Proc. SPIEE, 9148, 1GL
- (67)
- (68) Luppino, G. A., & Tonry, J. L. 1993, ApJ, 410, 81
- (69)
- (70) Maraston, C. 1998, MNRAS, 300, 872
- (71)
- (72) Maraston, C. 2005, MNRAS, 362, 799
- (73)
- (74) Marigo, P., & Girardi, L. 2007, A&A, 469, 239
- (75)
- (76) Marigo, P., Girardi, L., & Bressan, A. et al. 2008, A&A, 482, 883
- (77)
- (78) McCall, M. L. 2014, MNRAS, 440, 405
- (79)
- (80) Miner, J., Rose, J. A., & Cecil, G. 2011, ApJ, 727, L15
- (81)
- (82) Monachesi, A., Trager, S. C., Lauer, T. R., et al. 2012, ApJ, 745, 97
- (83)
- (84) Mortlock, A., Conselice, C. J., Hartley, W. G., et al. 2013, MNRAS, 433, 1185
- (85)
- (86) Mouhcine, M., & Lancon, A. 2003, MNRAS, 338, 572
- (87)
- (88) Naab, T., Burkert, A., & Hernquist, L. 1999, ApJ, 523, L133
- (89)
- (90) Pecaut, M. J., & Mamajek, E. E. 2013, ApJS, 208, 9
- (91)
- (92) Rayner, J. T., Cushing, M. C., & Vacca, W. D. 2009, ApJS, 185, 289
- (93)
- (94) Reach, W. T., Megeath, S. T., Cohen, M., et al. 2005, PASP, 117, 978
- (95)
- (96) Renzini, A., & Voli, M. 1981, A&A, 94, 175
- (97)
- (98) Richichi, A., Fabbroni, L., Ragland, S., & Scholz, M. 1999, A&A, 344, 511
- (99)
- (100) Rosenfeld, P., Marigo, P., Girardi, L., et al. 2014, ApJ, 790, 22
- (101)
- (102) Salaris, M., Weiss, A., Cassara, L. P., Piovan, L., & Chiosi, C. 2014, A&A, 565, A9
- (103)
- (104) Salpeter, E. E. 1955, ApJ, 121, 161
- (105)
- (106) Tamura, N., Kobayashi, C., Arimoto, N., Kodama, T., & Ohta, K. 2000, AJ, 119, 2134
- (107)
- (108) Tokunaga, A., Kobayashi, N., Bell, J., et al. 1998, Proc. SPIE, 3354, 512
- (109)
- (110) Trager, S. C., Worthey, G., Faber, S. M., Burstein, D., & Gonzalez, J. J. 1998, ApJS, 116, 1
- (111)
- (112) Worthey, G. 1994, ApJS, 95, 107
- (113)
- (114) Wu, P-O, Tully, R. B., Rizzi, L., Dolphin, A. E., Jacobs, B. A., & Karachentsev, I. D. 2014, AJ, 148, A7
- (115)