Vol.0 (200x) No.0, 000–000
Key Laboratory of Solar Activities, National Astronomical Observatories, Chinese Academy of Sciences, Beijing 100012, China
Key Laboratory of Modern Astronomy and Astrophysics (Nanjing University) Ministry of Education, Nanjing 210093, China
Key Laboratory of Radio Astronomy, Chinese Academy of Sciences, Nanjing 210008, China
Energy Spectral property in an Isolated CME-driven Shock 111This work is supported by the Xinjiang Natural Science Foundation No. 2014211A069
Abstract
Observations from multiple spacecraft show that there are energy spectral “breaks” at 1-10MeV in some large CME-driven shocks. However, numerical models can hardly simulate this property due to high computational expense. The present paper focuses on analyzing these energy spectral “breaks” by Monte Carlo particle simulations of an isolated CME-driven shock. Taking the Dec 14 2006 CME-driven shock as an example, we investigate the formation of this energy spectral property. For this purpose, we apply different values for the scattering time in our isolated shock model to obtain the highest energy “tails”, which can potentially exceed the “break” energy range. However, we have not found the highest energy “tails” beyond the “break” energy range, but instead find that the highest energy “tails” reach saturation near the range of energy at 5MeV. So, we believe that there exists an energy spectral “cut off” in an isolated shock. If there is no interaction with another shock, there would not be formation of the energy spectral “break” property.
keywords:
acceleration of particles — shock waves — Sun: coronal mass ejections (CMEs) — solar wind — methods: numerical1 Introduction
Strong astrophysical shocks are often associated with superthermal particle emission and with magnetic field amplification (Bykov et al., 2013; Vladimirov et al., 2006). This phenomenon suggests that shocks are regions where particles are efficiently accelerated, and this large group of energetic particles is responsible for the excitation of magnetic turbulence via plasma instabilities (Bell, 1978; Bell et al., 2013; Jokipii, J. R., 2013). These magnetic fields which diffuse cosmic rays in the vicinity of the shock are required to be much higher than the averaged magnetic field in the interstellar medium.
The theoretical model includes the determination of the particle injection energy from the thermal particle distribution into the non-thermal particle distribution, the maximum energy of particles accelerated at the shock, energetic particle spectra at all spatial and temporal locations, and the dynamical distribution of particles that escape upstream and downstream from the evolving shock complex (Zank et al., 2000). Monte Carlo simulation results indicate that solar ejecta transfer energy into the non-thermal particles in an interplanetary shock with an efficiency of 10% (Wang et al., 2013). Studies of the dependence of this efficiency on the angle between shock normal and the magnetic field direction ()can have implications for ground-level enhancement (GLE) events (Li et al., 2010; Snodin et al., 2013). Estimation of the maximum particle energy by CME-driven shocks is becoming more and more vital for forecasting space weather. Since particles accelerated at the shock escape rather easily from the acceleration site, they can be detected well before the arrival of the shock. This, of course, has immediate and interesting implications for space weather monitoring and prediction systems, but it does imply too that the study of the ion acceleration mechanism is complicated by the subsequent interplanetary propagation of the energetic particles.
For the past several decades, there has been much literature focusing on all aspects of the diffusive shock acceleration (DSA). In the past, cosmic ray (CR) spectra, acceleration efficiency, and amplification of the magnetic field have been calculated regularly via a two-fluid approach (O’ C. Drury, 1983). More recently, those have been simulated via a particle Monte Carlo method (Vladimirov et al., 2006; Wang & Yan, 2011; Ellison et al., 2004, 1990; Niemiec et al., 2004), or via hybrid method (Caprioli et al., 2014; Gargaté et al., 2012; Giacalone et al., 1993; Guo et al., 2013; Winske, 1985), and via full particle-in-cell (PIC) method (Amano et al., 2007; Riquelme et al., 2011). In addition, the CR’s transport equations have also been solved by a numerical method (Kang et al., 2002; Zirakashvili et al., 2010) and an analytical method (Liu et al., 2004; Caprioli et al., 2010; Malkov et al., 1996). These methods are all able to provide consistent results for the dynamics of the shock including the CR’s back-reaction. However, unlike the analytical method, the particle method and the numerical MHD method have not yet been able to simulate the energy spectral “break” property (Malkov et al., 2013). Since the “break” of the energy spectrum would be associated with the particle leakage mechanism, Malkov has presented a new combined diffusion coefficient to describe particle acceleration and escape in different regions. It accounts for a high turbulent magnetic field in the vicinity of the shock site (particle acceleration) and for faded turbulence of the magnetic field far away from the shock front (particle escape).
Although it is widely accepted that the most efficient acceleration of solar energetic particles(SEP) would happen in CME-driven shocks, the underlying acceleration mechanism in the shock environment still remains uncertain. In particular, it is not clear how the extensive maximum particle energy can be produced and why the energy spectral shape can be broken (i.e., why an abrupt change in slope of the energy spectrum can occur ) in some large CME-driven shocks (Mewaldt et al., 2008). In the past solar cycle 23, there are several observed events exhibiting proton energy spectral “breaks”. These events occurred on Nov-6-97, Apr-15-01, Jan-20-05, Sep-7-05, Dec-05-06, and Dec-14-06, respectively. In addition, there are hard X-ray and -ray energy spectra from Reuven Ramaty High Energy Solar Spectroscopic Imager (RHESSI) occurring on 2002 July 23. This event shows a double-power-law spectrum with a “break” at 30keV in X-ray and a high energy “cut-off” tail at 5MeV in -ray. The X-ray spectrum indicates that the substantial electron acceleration achieved to tens of keV. The -ray line shows that ions are accelerated to tens of MeV(Lin et al., 2003). There are also some debates about broken lower energy spectrum in X-ray, which is far different from an ad hoc assumption of hot thermal plasma presenting as the highest low-energy cutoff (20keV). Actually, there are a lot of analyses of the hardening spectra occurring in the energy range varying from 20keV to a few MeV (Gan et al., 2001; Kong et al., 2013; Huang, 2009). More recent years, an extensive solar energetic particle (SEP) event was detected by STEREO A on July 23 2012 near 1 AU. Liu et al. (2014) suggest that the in-transit interaction between two closely launched CMEs resulted in the extreme enhancement of the SEP. These results provide a new view crucial to space weather and solar physics as to how an extreme space weather event can be produced from an interaction between solar energetic ejecta (Gopalswamy et al., 2005; Cheng et al., 2013; Wang & Ji, 2013; Su et al., 2013; Schneider, 1993).
The parallel shocks show an effective amplification of the initial magnetic field due to the current of energetic ions that propagate anisotropically into the upstream flow. Caprioli et al. (2013, 2014) have used 2D and 3D hybrid simulations with large computational boxes to reveal the formation of upstream filaments and cavities, which eventually trigger the Richtmeyer–Meshkov instability at the shock, and lead to further turbulent amplification of magnetic fields in the downstream region. The typical acceleration time, up to energy in a shock with its velocity , is of order (O’ C. Drury, 1983), where is the diffusion coefficient. The acceleration characteristic time scale would be roughly equivalent to the time scale of the ejecta-dominated stage: when the shock is formed, the shock velocity drops quite rapidly, and so does amplification of the magnetic field (Guo et al., 2012). In a certain acceleration time scale of the shock system, the maximum particle energy is decided. However, in the particle simulation system, the particle’s free escaped boundary (FEB) size should be considered, that means the highest energy particle would be escaped from the FEB. If the present simulation will focus on production of the maximum particle energy, the highest energy spectral “tail” should be reserved. To obtain the maximum particle energy, we can either add the FEB size or decrease the value for the scattering time. Due to the expansion of the FEB size, the shock system will be brought the extra computational burden, so we can change the value for the scattering time. In the amplified magnetic field with an order of magnitude , the scattering time is an important factor to determine the acceleration efficiency in the resonant diffusion condition, and thereby determine if the maximum particle energy can be achieved. In this isolated shock model, we can investigate the maximum particle energy by changing the value for the scattering time.
Because we are not sure if an isolated CME-driven shock can accelerate energetic particles beyond Ebreak and even up to GeV, we take an isolated shock as an example to investigate the maximum particle energy and energy spectral “break” by using different values for the scattering time within resonant diffusive scenarios. According to the DSA theory, acceleration efficiency is significantly enhanced once the mean free path for pitch-angle scattering is approximately equal to the particle gyroradius (i.e. ), and the diffusion coefficient reads (Lagage& Cesarsky, 1983). If the Bohm diffusion condition is satisfied in the shock system and a typical interplanetary magnetic field with an order of a few mG, one can estimate that the maximum particle energy would be MeV, which is not enough to explain the energy spectral “break” at 1-10MeV in observations(Ellison et al., 1990). Therefore, we hope to extensively calculate the maximum particle energy Emax using different values for the scattering time within an isolated shock model. If we can obtain the Emax Ebreak, it would imply that there is unnecessary to use multiple shocks model to explain the energy spectral “break” property. If we obtain the Emax Ebreak, then we should examine that whether there would exist an energy spectral “break” at Ebreak and whether we should need a multiple shocks model indeed.
In present paper, we do simulations to further investigate the maximum particle energy in an isolated CME shock by using different values for the scattering time. In section 2, we introduce the dynamical Monte Carlo simulation method simply. In section 3, the simulated results and analysis are presented. In the end, we give a summary and some conclusions.
2 Method
Many deviations of DSA arisen from the nonlinear effects of the shock, such as the modification of the shock structure, magnetic field obliquity, time-dependence, magnetic field amplification, and etc. Those have been calculated by a two-fluid model (Drüry & Völk, 1981) and an analytical model (Caprioli et al., 2010; Malkov et al., 1996; Amato et al., 2006) and particle models including hybrid, particle-in-cell,and Monte-carlo method (Gargaté et al., 2012; Giacalone, 2004; Amano et al., 2007; Riquelme et al., 2011; Vladimirov et al., 2006; Ellison et al., 2004; Wang & Yan, 2011). These models return consistent results well, also can provide the results of the dynamics of the shock including the CR’s back-reactions. In general, there are two aspects of the deviation of DSA: one aspect is about the transfer issue depending on the macro factors of the shock in Mach number, magnetic field obliquity, and time-dependence etc; another aspect is about the acceleration issue depending on micro factors of the shock in diffusive coefficient, injection rate, and scattering time etc.
Here, we use a dynamical Monte Carlo method to study the acceleration issue depending on factor of scattering time. In this isolated shock model, the maximum particle energy will be calculated in different cases by applying different values for the constant of the scattering time. Since the FEB measures the size of the faded turbulent magnetic field in shock precursor region, if the FEB size is larger, then the is higher. Unfortunately, if the size of the FEB is larger, then the computational expense is higher. Instead, we can change the scattering time to achieve a higher in the shock. Assuming a particle can obtain the same additional energy gain from each cycle in a period of the scattering time, it is probable that the more scattering probabilities will obtain more energy gains. If we take a smaller value for the constant of the scattering time in one simulation case, we can obtain a higher value by more scattering probabilities in total simulation time.
Although there still exists the impact from the diffusive coefficient in different shock region, it can be neglected in this isolated shock model. Since the ejecta moves with a large speed and the most part of accelerated particles are located in the turbulent magnetic field in the vicinity of ejecta, so the diffusive processes always can be taken as the Bohm condition and its coefficient difference in this limited precursor region would be slight.
Monte Carlo approach regards the fluid as being composed of particles and focuses on the scattering micro processes between the particles and turbulent magnetic field in the diffusion processes. This technique is based on the computational grids, where large number of particles distributed. Particle’s mean free path is proportional to its local velocity in its local frame as follows.
| (1) |
where, is the local velocity of particles, is the scattering time. In Earth’s bow shock model, the scattering time is taken as a constant(Knerr et al., 1996). For comparing values for maximum particle energy , we apply different values for constant of the scattering time to perform these corresponding cases as in Table 1. To simulate the scattering processes accurately, the scattering time should be chosen to be far more than time step as follows.
| (2) |
To simulate the shock’s formation and evolution, we set the standard scattering time is a constant for all particles in Case A. Other constants of the scattering time and corresponding cases can be seen in Table1. Those related simulation parameters can be refereed to previous work (Wang & Yan, 2012). Here, we just list the scattering times in different cases. All of the scattering times are chosen to be more than time step dt (=/25) in corresponding cases.
| Simulation cases | A | B | C | D | E | F |
|---|---|---|---|---|---|---|
| The scattering time | /2 | /3 | /4 | /5 | /12.5 |
3 Results
3.1 Acceleration of particles
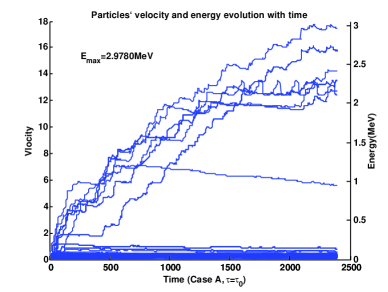
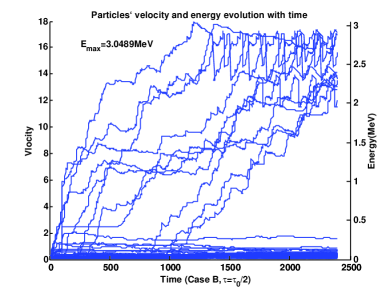
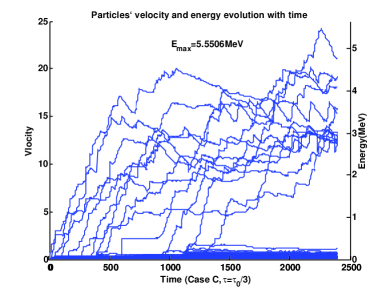
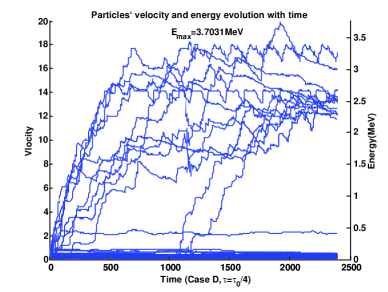

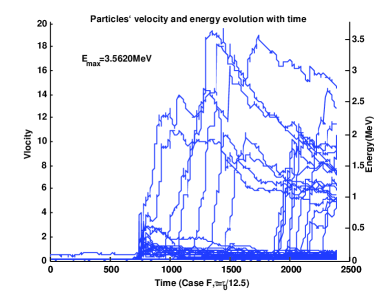
To inspect the entire particles’ acceleration processes in the shock, we extracte a number of particles from the simulated box in each case. Six plots in Figure 1 are taken from six simulate cases from Cases A, B, C, D, E, to Case F, respectively. Each curve in each plot represents one particle’s evolution of velocity and energy with time. Every plot have a few peak velocities in some accelerated particles, the highest peak value in the velocity or energy axis represents the maximum velocity or energy in corresponding case. Each maximum energy value is denoted in each plot. Among of these six cases, the maximum energy value in Case C achieves an energy saturation at 5.5506MeV. In addition, we can also find that a part of particles at the bottom of each plot exhibit no acceleration in total simulation time. Another part of particles with jumps from the lower energy to the higher energy in each plot indicate their accelerating processes in the shock with time. Simultaneously, energy jumps in corresponding case show an increasing steeply tendency with a decreasing value for the constant of scattering time from Cases A, B, C, D, E, to Case F, respectively. Case F shows severely steep jumps and steeply descents in energy or velocity curves,because the scattering time is chosen to approach to time step (). These results indicate that the computational accuracy requires the scattering time should be more enough than time step.
3.2 The Function.
Here, we focus on an isolated CME-driven shock for calculating the maximum particle energy Emax in those cases applying the different values for the scattering time. Using our dynamical Monte Carlo model, we have obtained the different values for the Emax in those cases. So we can build the function of the maximum particle energy Emax versus the values for the scattering time with the value from , /2, /3, /4, and /5 to /12.5 in corresponding case.
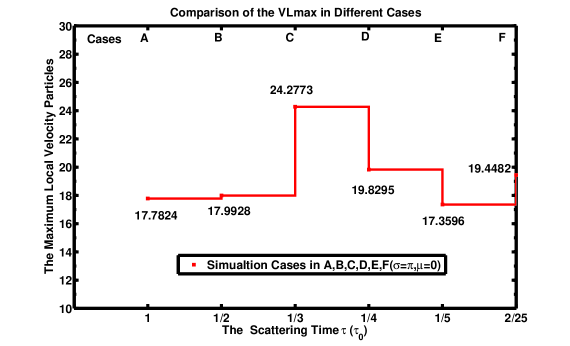
Utilizing the method described in Section Method, the calculations of are performed under the scattering angular distribution with a standard deviation value for and an average value for , which would relatively be more efficient for the particle acceleration in the CME-driven shock demonstrated by previous model (Wang & Yan, 2012). From the large population of the accelerated particles at the end of the simulation in each case, we find each maximum local velocity in corresponding case with its scattering time . The relationship between the maximum local velocity and the value for the scattering time in all cases are shown in Fig.2. The solid line denotes the correlation of the maximum local velocity versus the different value for the scattering time in corresponding case. In present Monte Carlo model, the value for the scattering time is chosen from , /2, /3, /4 and /5 to /12.5, respectively. And these six squares represent the maximum local velocity values for in all cases with their correspondingly values for the scattering time. The maximum local velocity is represented by a dimensionless value for =17.7824, =17.9928, =24.2773, =19.8295, =17.3596, and =19.4482 in each case, respectively. As shown in Fig.2, among these maximum local velocities , the largest is the one in Case C with a value of =24.2773, and its value for the scattering time is /3. The top of the stair line in Fig.2 shows that there exists a saturation in a function of the maximum local velocity versus the value of the scattering time under the resonant diffusion scenarios.
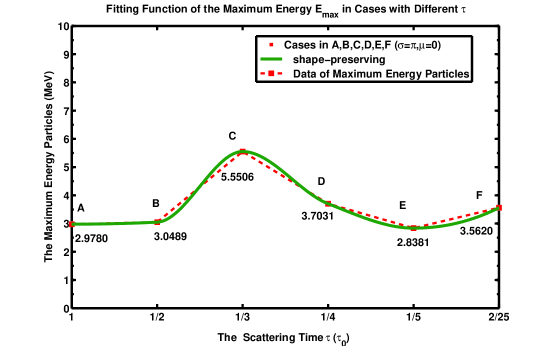
Fig.3 shows the fitting curve of the maximum particle energy versus the values for the scattering time . The maximum particle energy are calculated in the shock frame by a scaled value according to the scale factor for velocity . The maximum particle energy in each case varies along the shape-preserving curve with a sequence of =2.9780MeV, =3.0489MeV, =5.5506MeV, =3.7031MeV, =2.8381MeV, and =3.5620MeV from Cases A, B, C, D, and E, to Case F. respectively. All of those maximum particle energy are not exceed to the upper limit of Ebreak at 10MeV in the observation. But Case C with corresponding value for the scattering time shows that the largest maximum particle energy is =5.5506MeV, which is still less than the upper limit of the Ebreak region. It implies that whatever the value for the scattering time is chosen under an isolated shock model, the maximum particle energy would not more than the upper limit of the region in the observed energy spectrum. According to these simulation results, the energy spectrum “cut-off” would be formed near the energy range of 5MeV. Simultaneously, the saturation value for the maximum energy function demonstrate that these maximum particle energy can fit the observed lower energy spectrum below the limit. Looking from the shape-preserving curve in Fig.3, the will not increase with the value for the scattering time decreasing from /3 to /5. Although the function of maximum particle energy shows a lightly ascendant tendency when the value for the scattering time decreasing from /5 to /12.5, the value for the scattering time /12.5 is approaching to the time step (i.e., ). Considering the precision of the calculation, the value for the scattering time should be chosen to be not less than the time step . Since the amplified magnetic field is limited by the order of the magnitude , whatever the value for the scattering time is chosen in an isolated shock model, the obtained maximum particle energy Emax are not more than the upper limit of the Ebreak in the observed energy spectrum. If we expected to obtain a more extended energy spectrum beyond the upper limit of at 10MeV and even up to GeV, the multiple shocks model would be applied. So it means that the efficiency of acceleration in an isolated shock model will not exceed the upper limit of the as long as the value for the scattering time is chosen to be enough more than the time step . In addition, it also implies that the realistic observation of the energy spectrum strongly requires a multiple shock model to transfer the shock’s energy into the superthermal particles up to a highest energy spectrum for explaining the formation and the higher energy spectrum.
3.3 The Energy Spectra
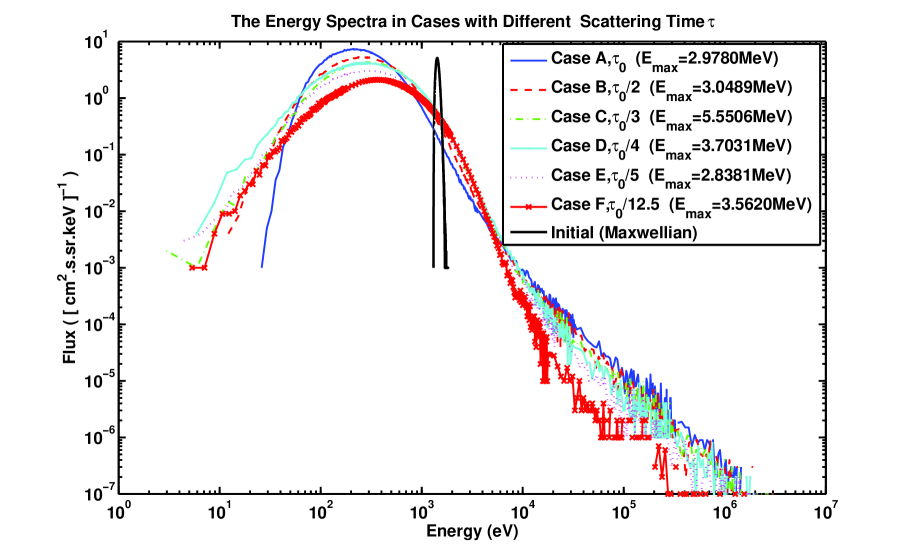
Fig.4 shows the shock energy spectra calculated in the downstream region in all cases. As far as the shape of the energy spectrum is concerned, the power-law slope of six extended curves are similar, because all cases are done in the same resonant diffusion scenarios just only with different values for the scattering time. However, among these cases, the energy spectrum in Case C with the value for the scattering time of /3 shows a relatively hard slope in the highest energy spectral tail. Under an isolated shock model, each case shows that how the initial Maxwellian energy spectrum to evolve into the extended energy spectrum with “power-law” structure in its high energy, respectively. By comparison, we calculated the average value of the maximum particle energy in present six cases. The average value for maximum particle energy is =3.6135MeV and the average value for energy spectral index is . These results agree with the low energy spectrum in the observations from the multiple spacecraft. Observed energy spectrum(Mewaldt et al., 2008) shows low energy spectrum with an index of and a high energy spectrum with an index of . The observed energy spectrum indicated that there exists an Ebreak between the lower energy spectrum and the higher energy spectrum. From these simulated cases, we concluded that all these energy spectra are characterized by a “power-law” with an averaged index , which consists with the observed index of the low energy spectrum. Since there is no maximum particle energy in these six cases beyond the upper limit of at 10MeV, we are unable to conclude that there should exist an Ebreak at 1-10MeV as a “break” from the lower energy spectrum to higher energy spectrum at this range. If we expect the second higher energy spectrum to occur, we can guess that there must exist an enhancement in amplification of the magnetic field associated with multiple shocks model. We propose the multiple shocks model would be applied to further investigate the higher energy spectrum in CME shock events. Recently, there are some analysis of multiple CME collision events that have been discussed. For example, Cheng et al. (2013) report the initiation process of compound CME activity consisting of two successive eruptions of flare ropes that occurred on January 23 2012. Another example presented by Liu et al. (2014) shows that the interactions between consecutive CMEs resulted in a “perfect storm” near 1 AU on 23 July 2012, which would induce to nonlinear amplification of magnetic field. Further more evidences could be gathered from observations in spacecraft such as SDO, SOHO, ACE, Wind and etc. In the implication from these present simulated results, we propose to build a multiple shocks model to simulate the Ebreak formation and the higher energy spectrum in the interplanetary shock. In present model, we think that the parameter of the scattering time would play key role on the strength of the diffusive coefficient for Emax production within the resonant diffusion scenarios associated with isolated shock. According to the final results, we find the relationship between the maximum particle energy Emax and the different value for the scattering time in isolated shock model. Although the difference on these maximum particle energy Emax in simulated cases has happened, no maximum particle energy Emax can exceed the upper limit of to further evolve into a higher energy spectrum up to GeV. The future simulation is necessary to verify the higher energy spectrum with an index of and the energy spectral “break” formation by applying multiple shocks model.
4 Summary and conclusions
In summary, these presented simulations are unable to verify that there should exist an energy spectral “break” below 10MeV in some large CME-driven shocks. But instead we verify that there is an energy spectral “cut-off” near the range of energy at 5MeV in an isolated CME-driven shock. We calculate the maximum particle energy Emax focusing on Dec 14 2006 CME-driven shock event and built the relationship between the maximum particle energy Emax and the value for the scattering time . We find that the maximum particle energy Emax approaches to a saturation near 5MeV below the upper limit of of the observed energy spectrum. We verify the lower energy spectrum is consistent with the observed low energy spectrum, but no higher energy spectrum appears. Although there are several large SEP events in the past solar cycle 23 appear the energy spectral “breaks” between 1-10MeV, there is still no very reasonable explanation. Since these observations are depend on multiple spacecraft, it is not easy to treat the system errors and couple the observed data obtained from different spatial orientations. The huge computational expense also limits numerical methods to reach an enough high energy spectral tail for further to identify this “break”. In the view of the current theoretical point about DSA, analytic method give an implication that this “break” would be connected with particle leakage mechanism. This “break” seemly can be predicted in the escaped position ahead of supernova remnants (SNRs) shock, where the SNRs has a collision with nearby molecule clouds (MC). This idea will motivate us to further investigate the energy spectrum formation and the higher energy spectrum. Hopefully, we propose the multiple shocks model would play key role on explaining the energy spectrum formation and the higher energy spectral shape.
Acknowledgements.
Present work is supported by Xinjiang Natural Science Foundation No. 2014211A069. This work is also funded by the Key Laboratory of Solar Activities of NAOC, the Key Laboratory of Modern Astronomy and Astrophysics (Nanjing University), Ministry of Education, and China Scholarship Council(CSC). Simultaneously, authors thank Profs. Joe Giacalone in University of Arizona and H. B. Hu in Institute of High Energy Physics of Chinese Academy of Sciences for their very helpful comments and discussions on this paper.References
- Amato et al. (2006) Amato, E., Blasi P., 2006, MNRAS,371, 1251-1258
- Amano et al. (2007) Amano, T., & Hoshino, M.,2007,ApJ,661, 190-202.
- Bell (1978) Bell, A. R., 1978, MNRAS,182, 147-156
- Bell et al. (2013) Bell, A. R., Schure, K. M., Reville, B., & Giacinti, G., 2013, MNRAS,431, 415-429
- Bykov et al. (2013) Bykov, A. M., Malkov, M. A., Raymond, J. C. & et al., 2013,Space Sci. Rev.,178,599-632.
- Caprioli et al. (2010) Caprioli, D., Blasi, P. & Amato,E.,2010, Astropart. Phys.,33, 307-311
- Caprioli et al. (2014) Caprioli, D., & Spitkovsky, A., 2014, ApJ ,783, 91
- Caprioli et al. (2013) Caprioli, D., & Spitkovsky, A., 2013, ApJ ,765, L20
- Cheng et al. (2013) Cheng, X., Zhang, J., Ding, M. D. & et al., 2013, ApJ,769, 25
- Drüry & Völk (1981) Drüry, L. O’ C. & Völk, H. J.,1981, ApJ,248, 344-351
- Ellison et al. (1990) Ellison, D. C., Möbius, E. & Paschmann, G. ,1990, ApJ,352,376-394
- Ellison et al. (2004) Ellison, D. C. & Double,G. P., 2004, Astropart. Phys.,22, 323-338
- Gan et al. (2001) Gan, W. Q., Li, Y. P.,& Chang, J., 2001, ApJ ,552, 858-862
- Gargaté et al. (2012) Gargaté, L., & Spitkovsky, A., 2012, ApJ ,744, 67
- Giacalone et al. (1993) Giacalone, J., Burgess, D., Schwartz, S. J., & Ellison, D. C., 1993, ApJ,402, 550-559
- Giacalone (2004) Giacalone, J.,2004, A&A,609, 452-458
- Gopalswamy et al. (2005) Gopalswamy, N.,Yashiro, S., Liu, Y. & et al., 2005, J. Geophys. Res. ,110, A09S15
- Guo et al. (2013) Guo, F., & Giacalone, J.,2013, ApJ ,773, 158
- Guo et al. (2012) Guo, F., & Giacalone, J.,2012, ApJ ,753,28
- Huang (2009) Huang, G. L., 2009, Solar Phys.,257, 323-334
- Jokipii, J. R. (2013) Jokipii, J. R., 2013, Space Sci. Rev.,176, 115-124
- Kang et al. (2002) Kang, H., Jones, T. W. & Gieseler, U. D. J., 2002,ApJ ,579, 337
- Knerr et al. (1996) Knerr, J. M., Jokipii, J. R. & Ellison, D. C., 1996, ApJ,458,641-652
- Kong et al. (2013) Kong, X., Li, G., & Chen, Y., 2013, ApJ,774,140
- Lagage& Cesarsky (1983) Lagage, P. O., & Cesarsky, C. J. ,1983, A&A,125, 249-257
- Li et al. (2010) Li, X., Lu, Q., Chen, Y., & et al. ,2010, ApJ,719, L190-L193
- Lin et al. (2003) Lin, R. P., Krucker, S., Hurford, G. J.,& et al. ,2003, ApJ,595, L69-L76
- Liu et al. (2014) Liu, Y. D., Luhmann, J. G. & et al., 2014, Nat. Commun. ,5,3481
- Liu et al. (2004) Liu, S., Petrosian, V., & Mason, G. M., 2004, ApJ,613, L81-L84
- Malkov et al. (1996) Malkov, M. A. & Völk, H. J., 1996, ApJ,473, 347-355
- Malkov et al. (2013) Malkov, M. A., Diamond, P. H., & et al, 2013, ApJ,768, 73-85
- Mewaldt et al. (2008) Mewaldt, R. A., Cohen, C. M. S., Cummings, A. C., & et al. ,2008, ,in Proceedings of the 30th ICRCMexico), ,1, 107-110.
- Niemiec et al. (2004) Niemiec, J., & Ostrowski, M. ,2004, ApJ,610, 851-867
- O’ C. Drury (1983) O’ C. Drury, L. ,1983, Rep. Progr. Phys.,46, 973-1027
- Qin et al. (2009) Qin, G., & Shalchi, A., 2009, ApJ,707, 61-66
- Riquelme et al. (2011) Riquelme, M. A., & Spitkovsky, A.,2011, ApJ ,733, 63
- Schneider (1993) Schneider,P., 1993, A&A,278,315-327
- Su et al. (2013) Su, Y., Veronig, A. M., Holman, G. D. & et al., 2013, Nature Physics,9, 489-493
- Snodin et al. (2013) Snodin, A. P., Ruffolo, D., Oughton, S. & et al., 2013, ApJ ,779, 56
- Vladimirov et al. (2006) Vladimirov, A., Ellison, D. C., & Bykov, A., 2006,ApJ, 652, 1246-1258
- Wang & Ji (2013) Wang, J. X. & Ji, H. S., 2013, Sci. China Earth Sci. ,56,1091-1117.
- Wang et al. (2013) Wang, X., Wang, N. & Yan, Y., 2013, ApJS ,209,18
- Wang & Yan (2011) Wang, X.& Yan, Y., 2011, A&A,530, A92
- Wang & Yan (2012) Wang, X. & Yan, Y., 2012, \raa,12, 1535-1548
- Winske (1985) Winske, D.,1985, Space Sci. Rev.,42, 53-66
- Zank et al. (2000) Zank, G. P., Rice, W. K. M. & Wu, C. C.,2000,J. Geophys. Res.,105, 25079-25095
- Zirakashvili et al. (2010) Zirakashvili, V. N. & Aharonian, F. A.,2010,ApJ,708, 965-980