Radar scattering of linear dunes and mega-yardangs: Application to Titan
Abstract
The Ku-band (13.8 GHz - 2.2 cm) RADAR instrument onboard the Cassini-Huygens spacecraft has revealed the richness of the surface of Titan, as numerous seas, lakes, rivers, cryo-volcanic flows and vast dune fields have been discovered. Linear dunes are a major geomorphological feature present on Titan, covering up to 17% of its surface, mainly in equatorial regions. However, the resolution of the RADAR instrument is not good enough to allow a detailed study of the morphology of these features. In addition, other linear wind-related landforms, such as mega-yardangs (linear wind-abraded ridges formed in cohesive rocks), are likely to present a comparable radar signature that could be confused with the one of dunes. We conducted a comparative study of the radar radiometry of both linear dunes and mega-yardangs, based on representative terrestrial analogues: the linear dunes located in the Great Sand Sea in western Egypt and in the Namib Desert in Namibia, and the mega-yardangs observed in the Lut Desert in eastern Iran and in the Borkou Desert in northern Chad. We analysed the radar scattering of both terrestrial linear dunes and mega-yardangs, using high-resolution radar images acquired by the X-band (9.6 GHz - 3.1 cm) sensor of the TerraSAR-X satellite. Variations seen in the radar response of dunes are the result of a contrast between the dune and interdune scattering, while for mega-yardangs these variations are the result of a contrast between ridges and erosion valleys. We tested a simple surface scattering model, with parameters derived from the local topography and surface roughness estimates, to accurately reproduce the radar signal variations for both landforms. It appears that we can discriminate between two types of dunes - bare interdunes as in Egypt and sand-covered interdunes as in Namibia, and between two types of mega-yardangs - young yardangs as in Iran and older ones as in Chad. We applied our understanding of the radar scattering to the analysis of Cassini RADAR T8 acquisitions over the Belet Sand Sea on Titan, and show that the linear dunes encountered there are likely to be of both Egyptian and Namibian type. We also show that the radar-bright linear features observed in Cassini RADAR T64 and T83 acquisitions are very likely to be mega-yardangs, possible remnants of ancient lake basins at mid-latitude, formed when Titan’s climate was different.
keywords:
Titan , Radar observations , Aeolian processes1 Introduction
Cassini-Huygens mission has been in orbit around Saturn since June 2004. The Ku-band (13.8 GHz - 2.2 cm) RADAR instrument onboard the Cassini spacecraft is a combined radiometer/altimeter/scatterometer/imaging radar that has revealed a various and rich surface of Titan through its optically-opaque atmosphere (Elachi et al., 2004). RADAR has allowed the discovery of numerous seas, lakes, rivers, cryo-volcanic structures and vast dune fields (Elachi et al., 2005; Lopes et al., 2007; Lorenz et al., 2006; Radebaugh et al., 2007; Stofan et al., 2007). Dunes are in particular a major landform on the surface of Titan, since large dune fields cover more than 10 million km2 in equatorial regions. They are typically 1-2 km wide, with 1-4 km spacing, up to 150 m-high, and can reach more than 100 km in length, being mainly east-west oriented and aligned parallel with time-averaged equatorial winds (Lorenz et al., 2006; Radebaugh et al., 2008; Lorenz and Radebaugh, 2009; Le Gall et al., 2011). Dunes on Titan are the linear type as observed on Earth, the latter ones being used as analogues to infer Titan’s dunes morphology (Neish et al., 2010; Radebaugh et al., 2010; Paillou et al., 2014).
The RADAR instrument shows Titan’s dune fields as dark linear features separated by brighter linear features. Different qualitative interpretations have been proposed for this radar signature: (1) dark lines are sand covered interdunes with brighter features caused by specular reflection over dunes’ crests, as for the linear dunes observed in the Namib Desert (Neish et al., 2010), or (2) dark lines are the smooth dunes with brighter linear features caused by rougher interdunes, where bedrock is exposed, as observed in the Great Sand Sea in Egypt (Paillou et al., 2014). Besides linear dunes, other natural wind-related structures on Earth show a comparable morphology: mega-yardangs are wind-abraded landforms which develop in Earth’s drylands (Sahara, Middle-East, Central Asia), where winds tend to be unimodal in direction (Goudie, 2007). Mega-yardangs are composed of alternating linear ridges and valleys created by wind erosion and sediment deflation, and are often associated with soft deposits of desiccated lake beds. As for linear dunes, radar images of mega-yardang structures show alternating dark linear features (the erosion valleys) and brighter linear features (the ridges): confusing radar images of linear dunes and mega-yardangs is then quite possible, especially at the 300 m resolution of the RADAR instrument.
Comparative planetology is a powerful approach to help understand the geology of remote planetary surfaces. We conducted a comparative study of the radar scattering of both linear dunes and mega-yardangs, based on representative terrestrial analogues. We considered the linear dunes located in the Great Sand Sea in western Egypt and in the Namib Desert in Namibia, and the mega-yardangs located in the Lut Desert in eastern Iran and in the Borkou Desert in northern Chad. We analysed and modelled the radar signatures of both linear structures using high-resolution (18 m) radar images acquired by the X-band (9.6 GHz - 3.1 cm) radar of the TerraSAR-X satellite. We used a simple surface scattering model, whose parameters were derived from the local topography (ASTER Global Digital Elevation Map - GDEM, and Shuttle Radar Topography Mission - SRTM data) and from surface roughness estimates (Bayesian inversion), which accurately reproduces the radar signature for both landforms. We were able to discriminate between two types of dunes: those with bare interdunes in Egypt vs. those with sand-covered interdunes in Namibia; and between two types of mega-yardangs: young ones in Iran vs. older ones in Chad.
We applied our understanding of the radar scattering to the analysis of radar images obtained during the Cassini T8 flyby over the Belet Sand Sea on Titan: we show that the linear dunes there are likely to be of both Egyptian and Namibian types, contradicting previous studies which proposed single-type dune scenarios. We also show that the bright linear structures observed in radar acquisitions during Cassini T64 and T83 flybys are very likely to be mega-yardangs, possible remnants of lake beds at mid-latitude (around 40∘N).
2 Linear dunes and mega-yardangs on Earth
Linear dunes on Earth are mainly located in arid equatorial regions, and constitute more than half of terrestrial dunes (Rubin and Hesp, 2009). They are formed in a context of moderate sand supply, with bimodal wind regimes associated with seasonal changes, producing quasi-symmetrical and linear dunes in a direction parallel to the one of average annual wind (Bristow et al., 2000). Linear dunes can reach hundreds of kilometres in length, and more than a hundred metres in height, with an interdune separation of the order of a couple of kilometres (Besler, 2008). Such results of sedimentary transport and deposition processes have been observed on all bodies of the Solar System that have an atmosphere: Venus, Earth, Mars and Titan (Zimbelman et al., 2013).
Also belonging to the “wind-related linear features” family, are yardangs (or mega-yardangs at a regional scale), made of parallel ridges separated by narrow valleys. The latter are formed by the wind abrasion of cohesive rocks (Goudie, 2007). Mega-yardangs are also mainly located in hyperarid regions on Earth, and form under the condition of a strong unimodal wind, that transports sand and gravel eroding soft sediments on a time scale of a million years (Gabriel, 1938; Ehsani and Quiel, 2008). A favourable condition for yardangs formation is the presence of soft deposits over a harder bedrock, typically observed in areas of ancient lake basins. Mega-yardangs were observed on Mars (De Silva et al., 2010) and might also be present on Venus (Greeley, 1999).
We selected four terrestrial sites to study radar scattering of linear dunes and mega-yardangs. For linear dunes, we considered the Egyptian side of the Great Sand Sea, a large dune field covering 300 x 700 km in eastern Libya and western Egypt (Besler, 2008). The typical length, width and height of dunes in the Great Sand Sea are in the range of values proposed for Titan, the interdune being most of the time uncovered and exposing the underlying bedrock. Egyptian dunes are mainly composed of pure silicate, with a low dielectric constant close to the values reported for Titan’s surface materials (Paillou et al., 2008). They have been used as terrestrial analogues to develop a scattering model that was applied to the study of the radar response of Titan’s dunes (Paillou et al., 2014). The Namib Desert in Namibia (Lancaster, 1989; Bristow et al., 2000) was also considered for its linear dune fields. It is an arid area which borders the southwestern African coast over hundreds of kilometres, with mostly linear sand dunes presenting sand-covered interdunes, and also comparable in size and morphology to those on Titan. These dunes have been used as a training model for radarclinometry (reconstruction of the topography from the radar signature), with results applied to the study of Titan’s dunes (Neish et al., 2010).
As regards mega-yardangs, we considered the young structures of the Lut Desert in eastern Iran, firstly described by Gabriel (1938) and later studied by Ehsani and Quiel (2008). The region corresponds to a Pleistocene basin with fill deposits (silty clay, gypsiferous sands) and is about 150 km long by 50 km wide, with ridges reaching heights of 100 m (Goudie, 2007). We also considered the older mega-yardangs of the Borkou Desert in northern Chad, formed by erosion of sandstone of Paleozoic age (Mainguet, 1968). This is a region located between the Tibesti and Ennedi mountains, in a corridor of very strong unimodal wind oriented to the northeast. Eroded valleys between sandstone ridges are mostly filled with aeolian sand and present an average depth around 50 m (McHone et al., 1996).
We acquired radar scenes of the four study sites using the X-band radar of the TerraSAR-X satellite, launched in 2007 (Pitz and Miller, 2010). The TerraSAR-X sensor presents two interesting characteristics for our study: (1) X-band is the shortest wavelength (3.1 cm) among available orbital radars for Earth observation, close enough to the Cassini RADAR (2.2 cm) and thus sensitive to the same surface roughness range and (2) its high-resolution (18 m) allows the detailed study of the radar signatures of landforms. We used the TerraSAR-X ScanSAR mode, in HH polarisation, to cover 100 x 150 km areas at an average resolution of 18 m (multi-look images resampled to 8.25 m), with a varying incidence angle from the near to the far range of the image. Acquisition parameters of the four TerraSAR-X scenes are summarized in Table 1.
| Site - Country | Scene centre Lat./Lon. | Incidence angle range | Acquisition date | Scene ID | Orbit look |
|---|---|---|---|---|---|
| Great Sand Sea Egypt | N E | 2013-06-06 | 371348705_2 | ascending right | |
| Namib Desert Namibia | S E | 2013-12-27 | 372338466_1 | ascending right | |
| Lut Desert Iran | N E | 2013-06-08 | 371348705_4 | ascending right | |
| Borkou Desert Chad | N E | 2013-12-08 | 372239342_1 | ascending right |
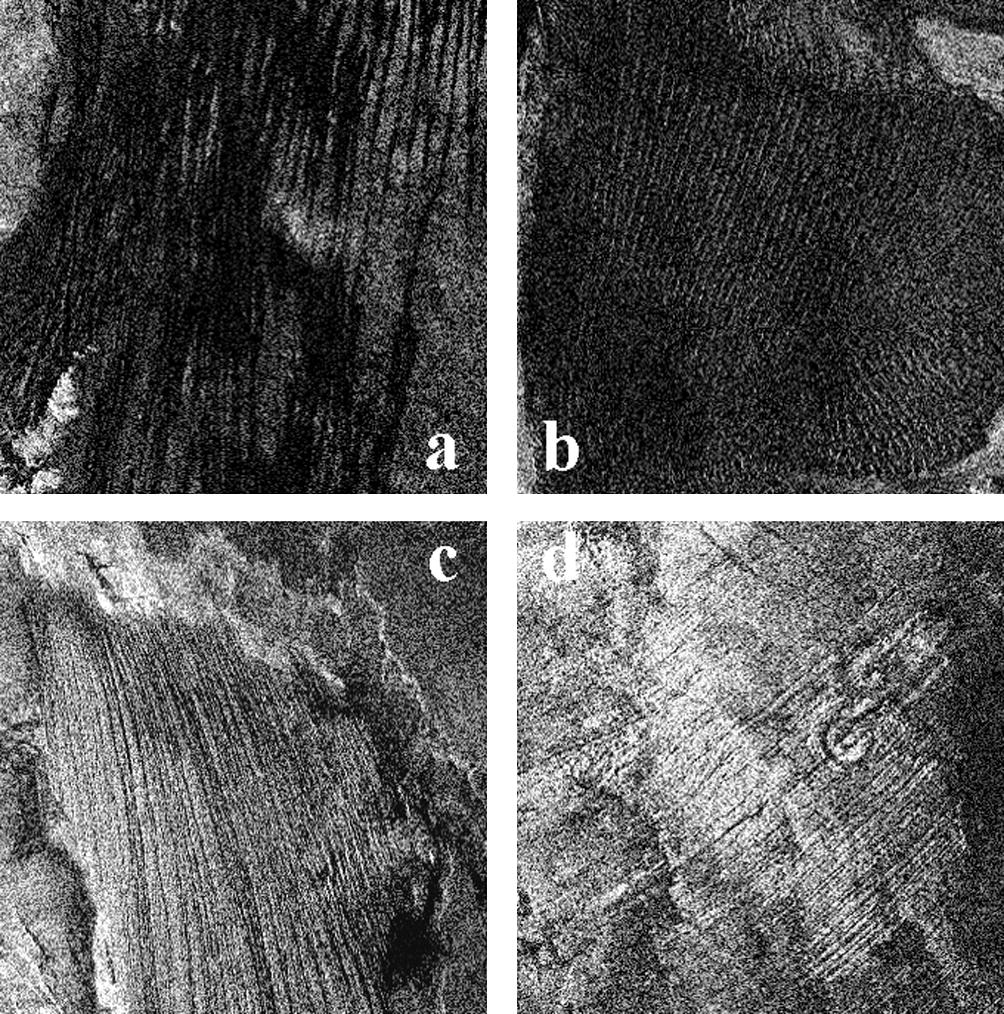
The TerraSAR-X radar scenes are shown in Fig. 1, with relevant full resolution extracts presented in Fig. 2. Both linear dunes of the Great Sand Sea and Namib Desert are roughly north–south oriented and are comparable in size, but they show a different radar signature mainly due to the interdune properties: the bare interdune in Egypt (Fig. 1a) appears brighter than the sand-covered one in Namibia (Fig. 1b), because of the rougher surface associated with the exposed bedrock, which causes a more diffuse scattering of the incident radar wave. Full resolution extracts in Fig. 2a for Egyptian dunes and Fig. 2b for Namibian dunes respectively show some brighter radar returns on the side of the dunes facing the radar illumination, due to the combination of a lower local incidence angle (Blom and Elachi, 1987) and finer dune structures, some of them acting as natural corner reflectors (Paillou et al., 2014). TerraSAR-X’s high resolution also allows us to see the darker “back side” of the linear dunes, corresponding to a low radar return because of a higher local incidence angle.
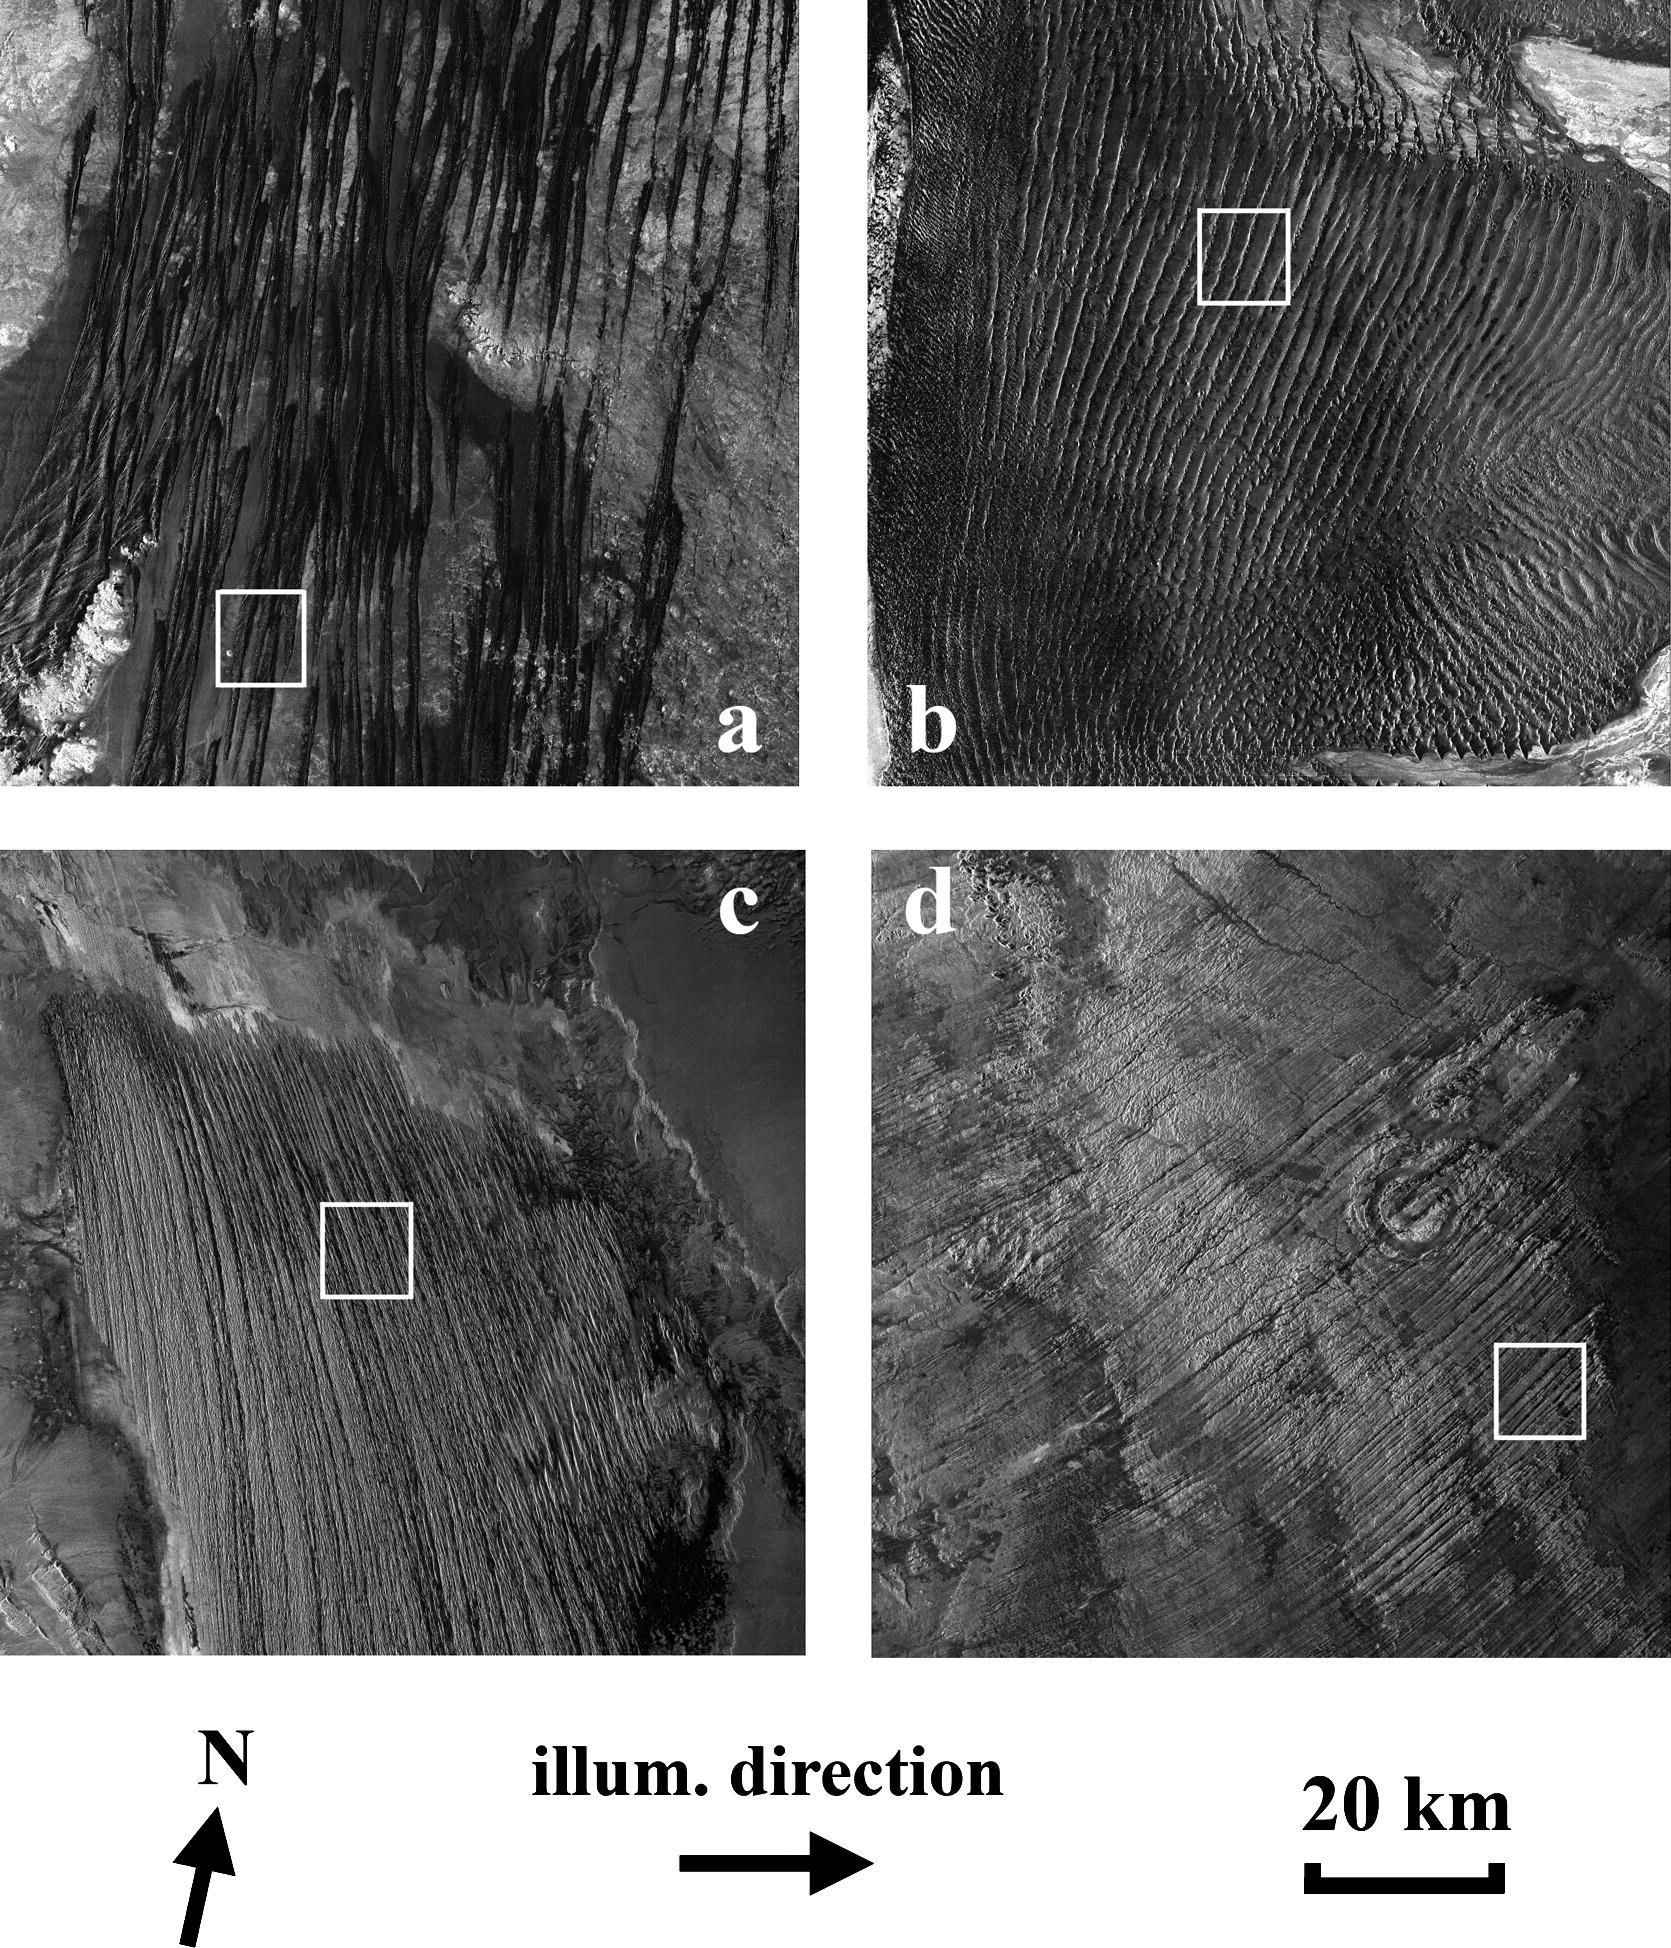
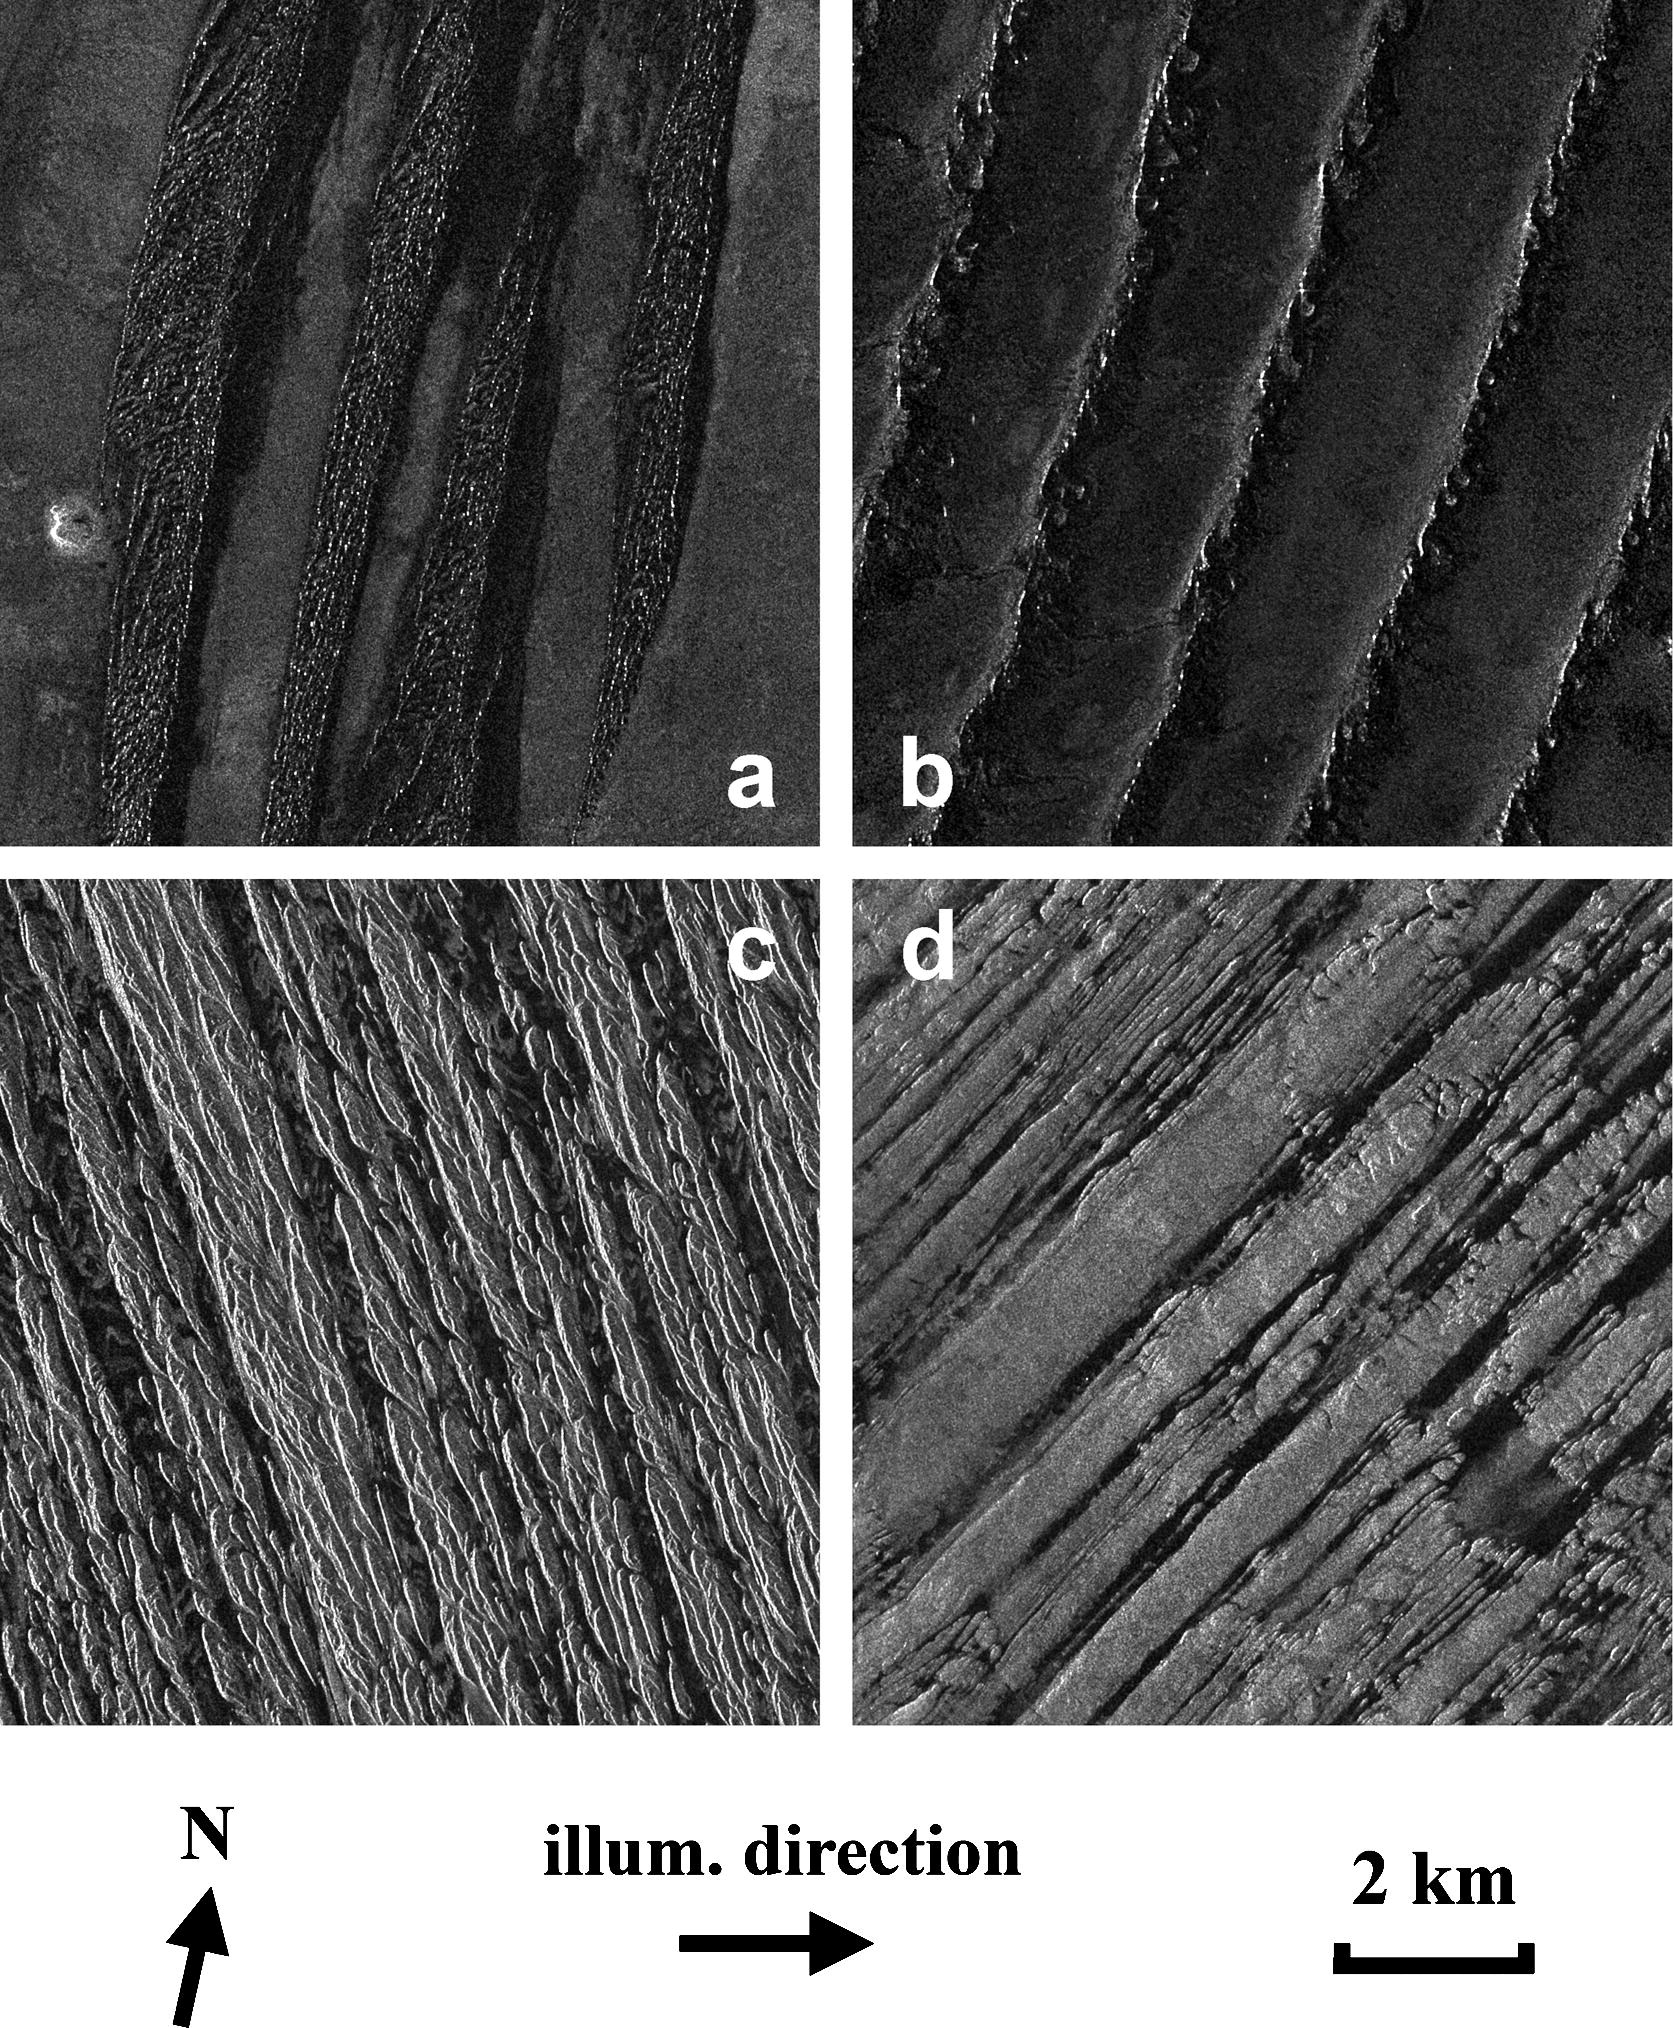
Mega-yardangs of the Lut Desert and of the Borkou Desert do not present the same geographical orientation (Fig. 2c and d), but both appear generally brighter than linear dunes: most of the radar scattering is due to the wide ridges of the eroded layer, which is rougher than sand deposits at X-band. Narrow linear valleys separate the ridges and appear darker because they are filled with smoother aeolian deposits (some valleys even contain very small dunes). The young mega-yardangs of the Lut Desert show complex ridges structures alternating with poorly defined valleys (see Fig. 2c), while the older mega-yardangs of the Borkou Desert exhibit a better contrast between wider and flatter ridges and deeper erosion valleys (see Fig. 2d).
3 Description and modelling of the radar signature of dunes and yardangs
We studied the variations of the radar signal across selected dune and yardang structures, at TerraSAR-X full-resolution, in order to qualitatively understand the scattering mechanisms involved, and then to reproduce the observed variations with the help of a simple surface scattering model.
3.1 Radar signatures of linear dunes and mega-yardangs
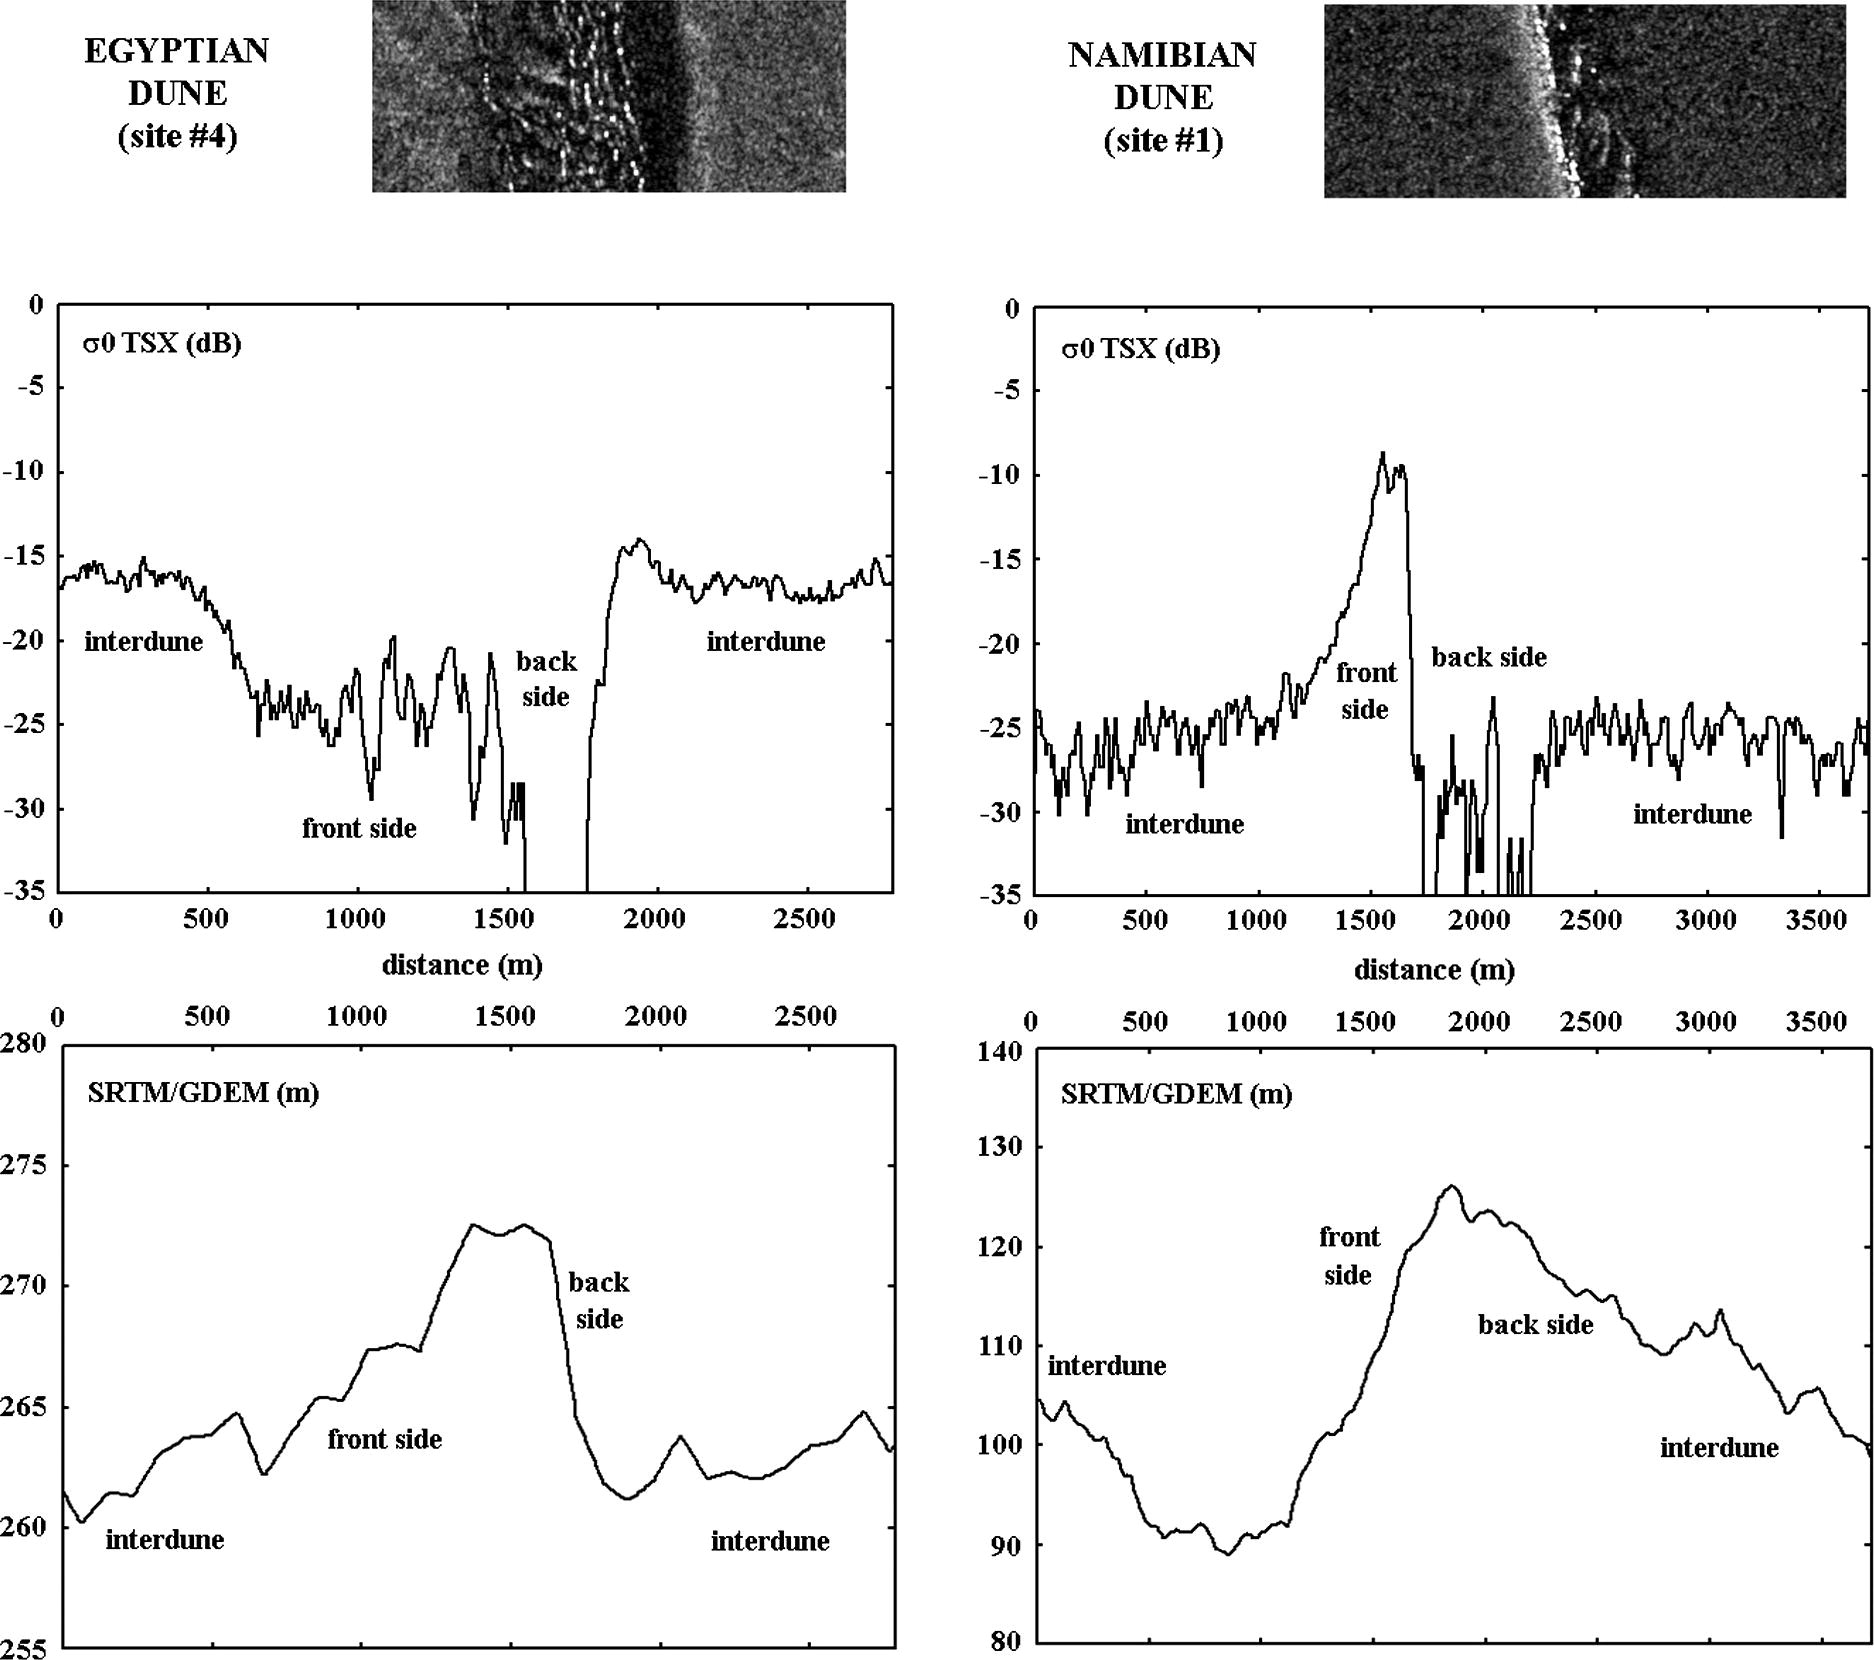
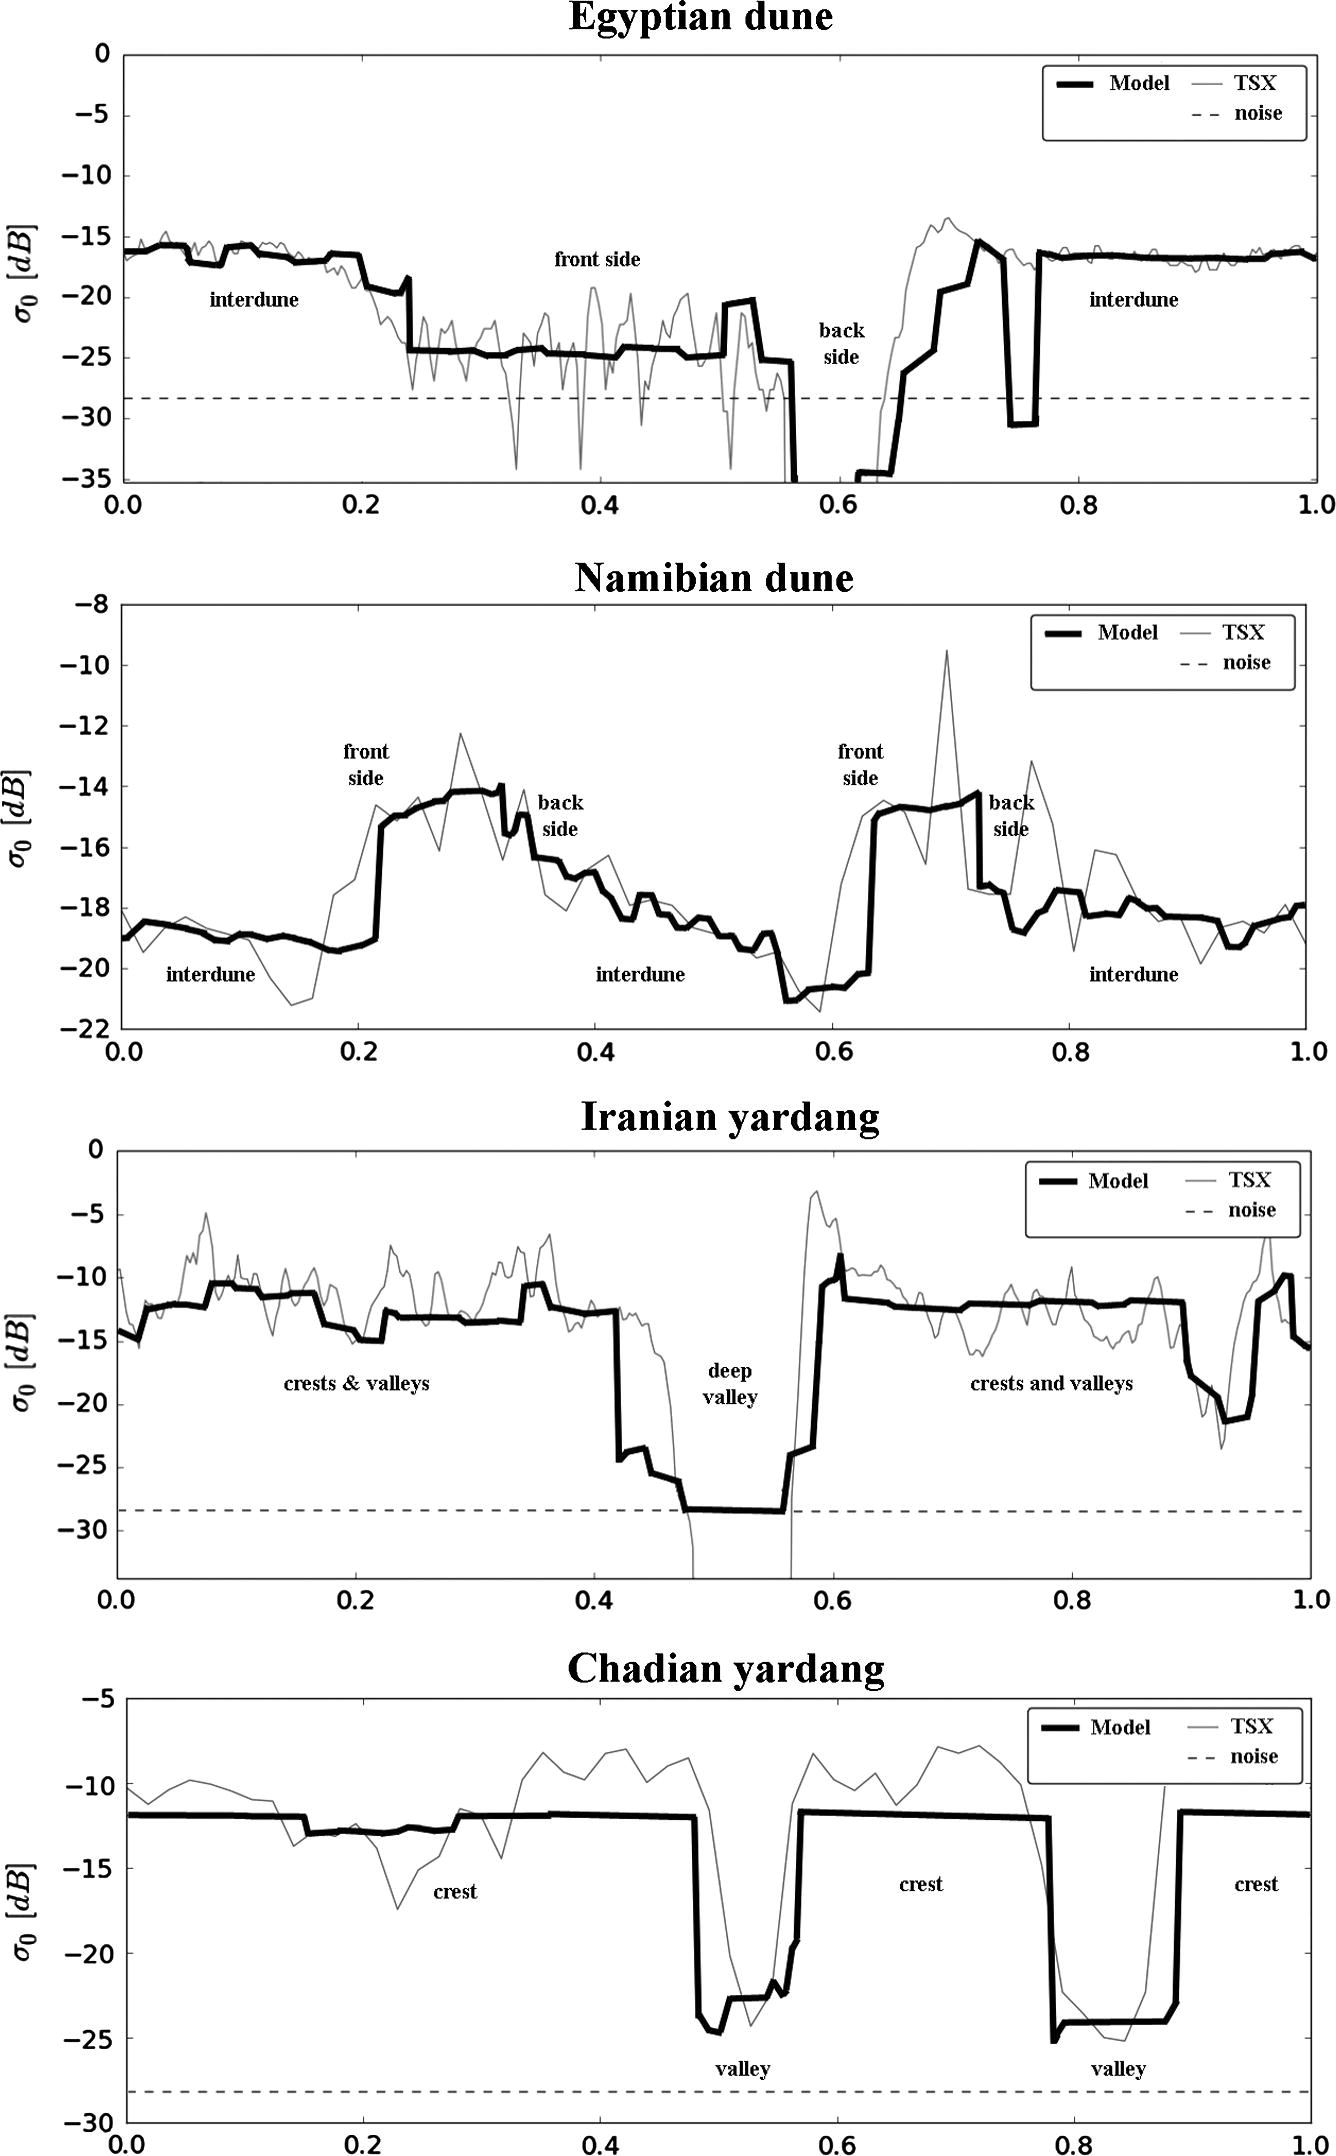
Eight representative locations were selected in the Great Sand Sea and six in the Namib Desert, in order to derive a “typical” radar scattering profile for Egyptian and Namibian dunes. We applied a standard calibration procedure to full resolution TerraSAR-X data to compute the backscattered radar power at each pixel (Schwerdt et al., 2010). We averaged pixels values in the direction parallel to the main orientation of the structures, in order to get a better representation of typical variations of the radar scattering across the studied structures: averaging was performed using a median estimator, so that extreme high returns due to natural corner reflectors and extreme low returns at the noise floor level (around -28 dB for TerraSAR-X) did not bias the average value. Fig. 3 shows two typical radar signatures across Egyptian and Namibian linear dunes. Egyptian dunes present three main levels of radar scattering (Fig. 3, left): a radar-bright interdune (around -15 dB) due to an exposed rough bedrock (Besler, 2008), a medium scattering level for the dune’s side facing the radar illumination (“front side”, around -23 dB), and a low scattering level for the dune’s side opposite to the radar illumination (“back side”, -30 dB and lower). Namibian dunes present a different, rather bimodal, radar signature, with a less radar-bright interdune due to a smooth sand cover (Bristow et al., 2000). Fig. 3 (right) shows a typical radar profile across a Namibian dune, where two main scattering levels can be observed: a strong radar return on the side of the dune facing the radar, can reach -10 dB (due to a lower incidence angle combined with smaller-scale structures superposed to the main dune’s shape (Lancaster, 1989). A lower scattering level, in the -25 to -30 dB range, corresponds to returns from both interdune and back side of the dune (the latter likely mixing with the interdune return when decreasing the radar image resolution). This shows that, while both dune systems in Egypt and Namibia are of the same linear type, their radar signature can be quite different due to different interdune properties. This appears quite obvious here from high-resolution radar images, but at the lower resolution (and higher noise level) of the Cassini RADAR instrument, observing these structures can become more confusing.
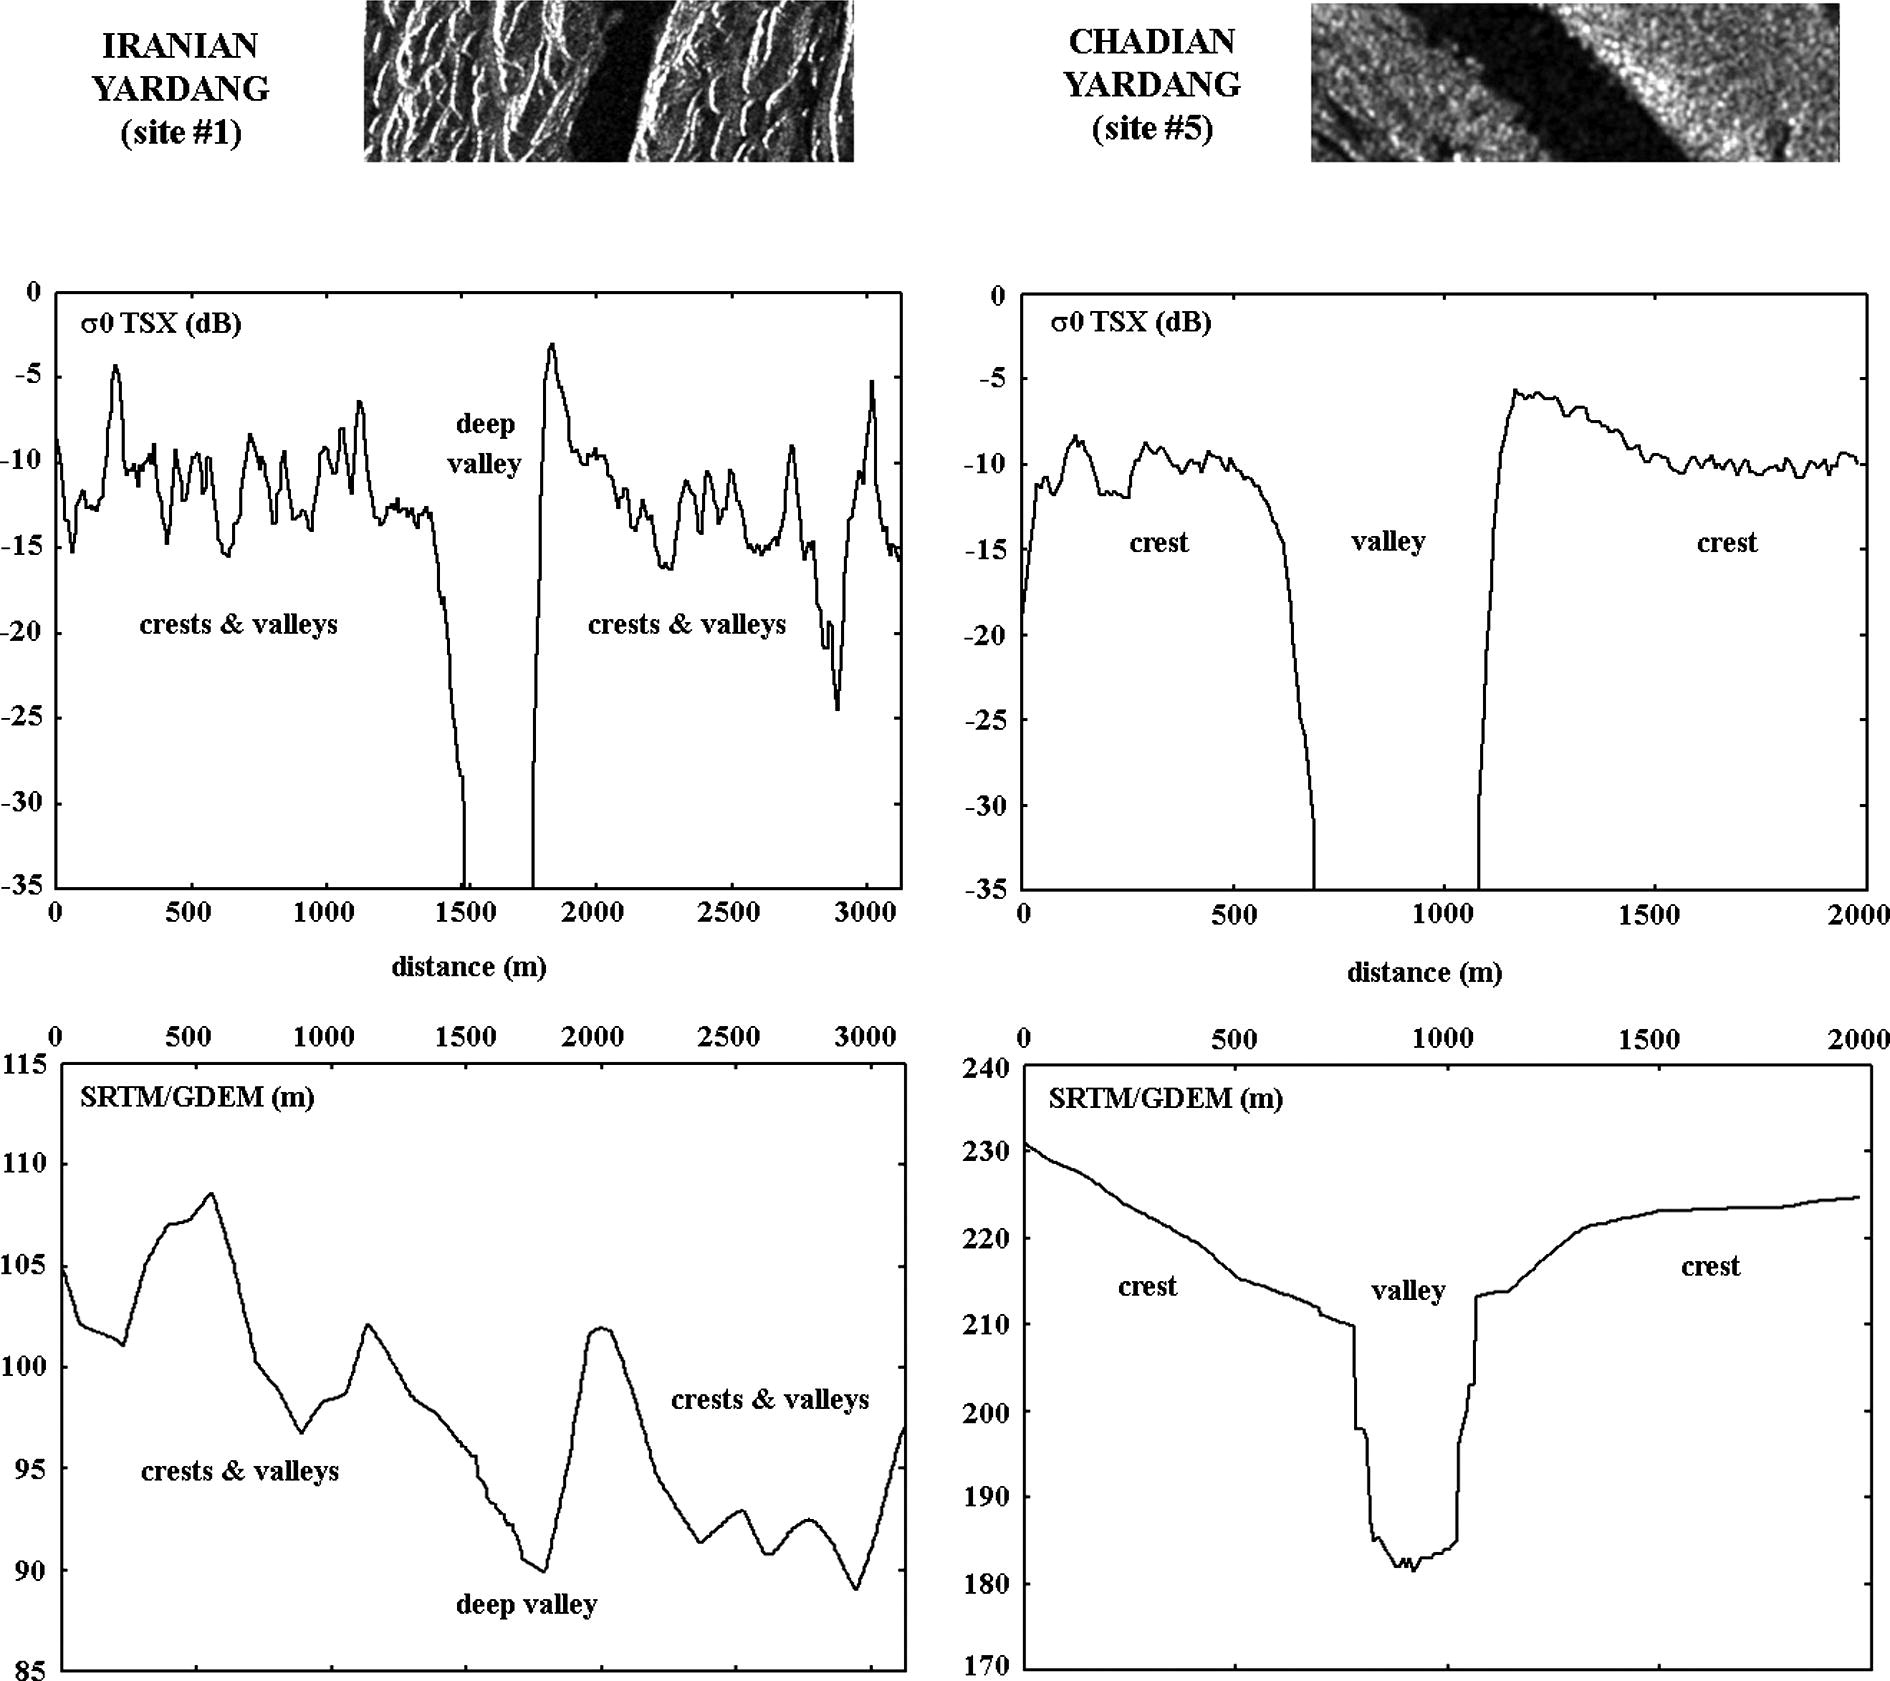
Regarding mega-yardangs, we studied five representative locations in the Lut Desert and also five in the Borkou Desert, to derive typical radar profiles for young and older mega-yardangs. As before, we averaged the pixel values in the direction parallel to the main orientation of the structures using a median estimator. Fig. 4 presents two typical radar signatures across Iranian and Chadian yardangs. The young mega-yardangs in Iran (Fig. 4, left) show a high spatial frequency alternation of the high scattering level from the rough crests of the eroded layer (-10 dB) and the medium-scattering level from narrow and shallow valleys (around -15 dB). This alternation is cut in places by regions of low radar return (-25 dB), due to deeper eroded valleys filled with smooth aeolian deposits (Gabriel, 1938). The older mega-yardangs in Chad present a different, more bimodal radar signature (Fig. 4, right), with alternation of radar-bright level from wider and flatter crests (around -10 dB, less radar-bright than the Iranian ones likely because a longer period of erosion produced a smoother surface), and low-scattering level due to larger erosion valleys (-25 dB), which are likely to be filled with aeolian sand deposits. As for linear dunes, the two mega-yardangs structures, of different age and created in different types of rocks, exhibit differences in their radar signature. However, it is apparent that mega-yardangs in general are more radar-bright than linear dunes, since we observe about 10 dB difference in the average backscattered power. This is likely due to the strong radar return of the rougher and wider yardangs’ crests, compared with a lower overall signal returned by the smoother sandy surfaces of dunes.
3.2 A simple model for the radar signature of dunes and yardangs
After presenting a qualitative description of radar scattering profiles across linear dunes and mega-yardangs, we tried to reproduce the variations of the observed radar backscattered power using simple surface scattering models, whose parameters were estimated from various sources. We considered two surface scattering models, widely used by the radar remote sensing community: the Geometric Optics Model – GOM – suited to rough surfaces (surface roughness being defined with respect to the radar wavelength, most natural surfaces are rough at X-band) (Fung and Eom, 1981), and the Integral Equation Model – IEM – valid for medium-rough to smooth surfaces (Fung et al., 1992). The latter model was previously used to reproduce the radar scattering of linear dunes of the Great Sand Sea in Egypt, using SIR-C/X-SAR scenes (Paillou et al., 2014).
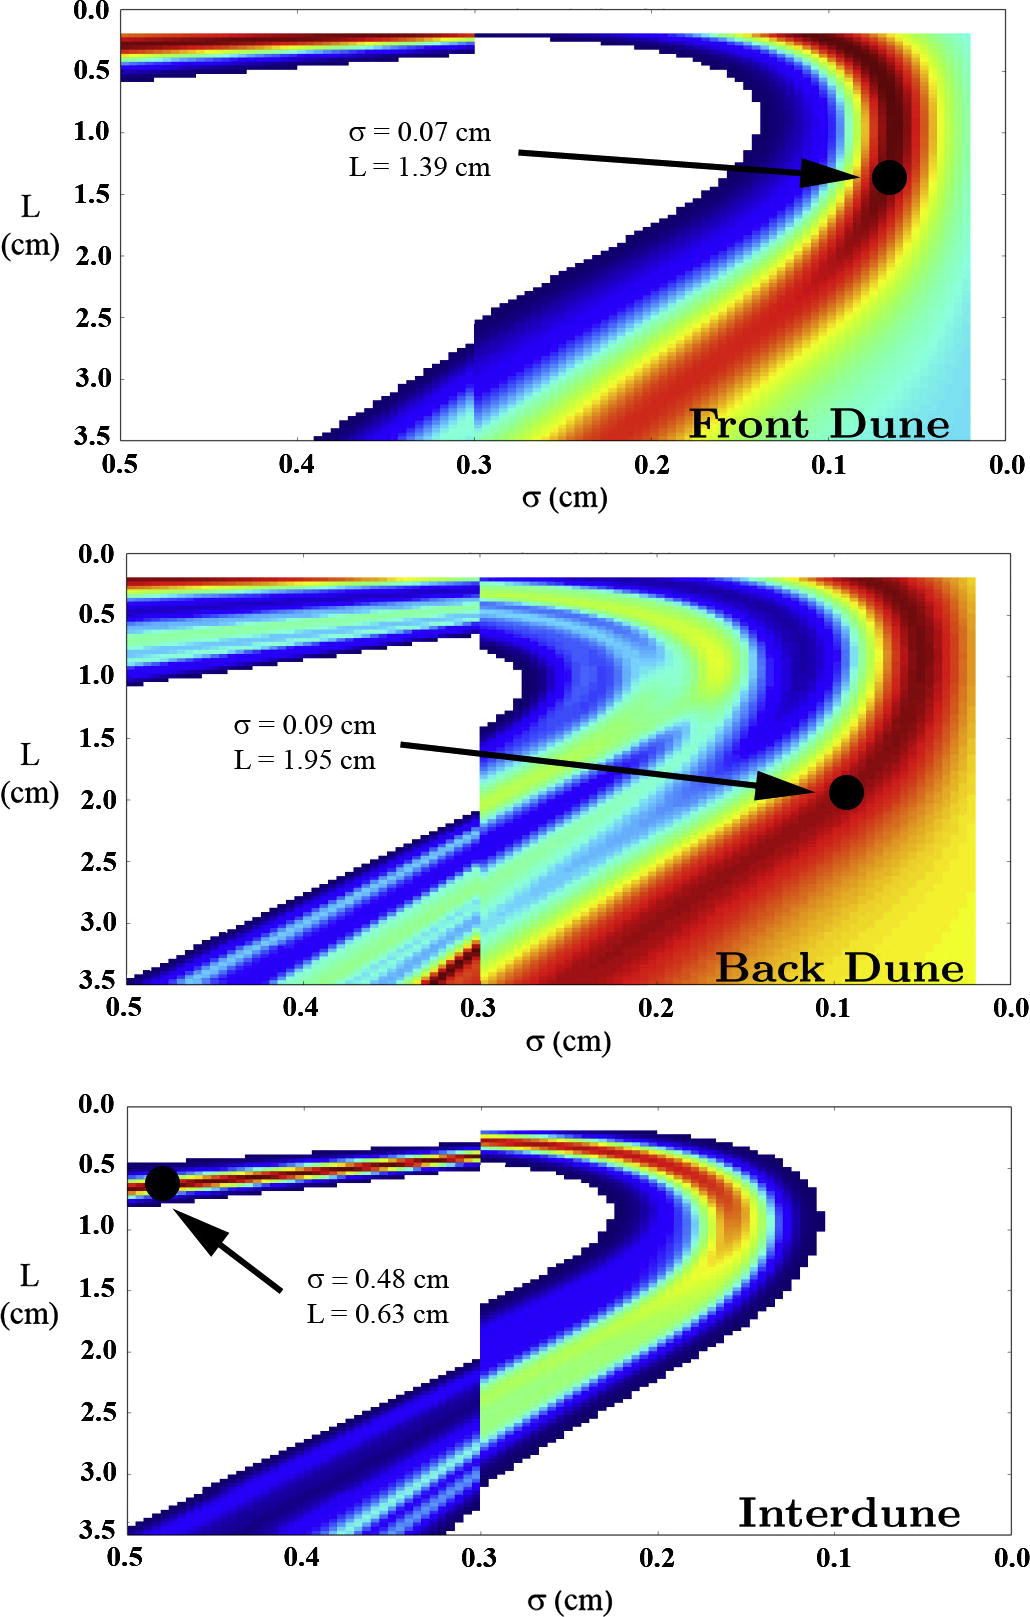
Besides the radar wavelength and polarisation, input parameters for these models are local incidence angle (computed from the radar look angle and local slope at the observed point), surface roughness described by rms-height and correlation length (assuming a Gaussian autocorrelation function), and the dielectric constant of the material constituting the surface. The dielectric constant of dry sediments and sedimentary rocks in desert regions does not vary much and is the 3–6 range for its real part, with an imaginary part close to zero (Ulaby et al., 1990). We fixed the dielectric constant to that of silicate ( = 3.5) for all surfaces. Note that small changes in this parameters are not important when computing radar backscattered power, as compared to the effects of variations in the incidence angle and surface roughness. The topography of the various selected areas was obtained using SRTM and GDEM data, GDEM being mainly used to fill in holes in the SRTM coverage, especially in dune areas. Taking into account the look angle and orbit inclination of the TerraSAR-X radar, we computed slope maps in the radar range direction, from which we derived the local incidence angle at each pixel. The resolution of digital elevation models provided by SRTM (90 m) is coarser than the resolution of the TerraSAR-X images, so it was not possible to reproduce scattering effects due to small-scale features, in particular natural corner reflectors. As regards surface roughness parameters, only the ones for the surface of Egyptian dunes were estimated by previous studies (Paillou et al., 2014). We then considered a Bayesian inversion approach to estimate the surface roughness of dunes and interdunes for both Egyptian and Namibian cases, and of crests and valleys for both Iranian and Chadian yardangs. We computed the probability of similarity between the actual radar backscattered power in TerraSAR-X images and the computed radar backscatter power , for roughness parameters varying between 0.02 and 0.5 cm and varying between 0.2 and 3.5 cm, assuming a tolerance criteria = 0.03:
| (1) |
The GOM model was used when 0.3 cm and the IEM model was used when 0.3 cm. After exploring the roughness parameter space, we kept the (, ) couple which corresponds to a maximum probability of similarity between the actual TerraSAR-X and the computed backscattered power. Fig. 5 shows an example of this Bayesian approach for dunes and interdunes of the Great Sand Sea in Egypt.
Once incidence angle and surface roughness parameters were estimated, we computed “theoretical” radar scattering profiles using GOM and IEM models, and compared them to observations for both linear dunes and mega-yardangs. Fig. 6 shows examples of comparison between computed and observed radar profiles across linear dunes in Egypt and Namibia, and mega-yardangs in Iran and Chad. One can see that the computed radar profiles and the actual TerraSAR-X ones are quite similar on the average. The high-frequency variations in TerraSAR-X profiles could not be reproduced, due to the coarse resolution of the SRTM topography. Nevertheless, simple surface scattering models such as GOM and IEM allow us to explain fairly well the variations of the actual radar scattering, as previously shown in Paillou et al. (2014) for dunes only. These results confirm the qualitative interpretation of the radar signature of linear dunes and mega-yardangs presented in the previous sub-section.
4 Application to Titan
Comparative planetology is a powerful approach when studying remote bodies, especially when only images of their surface are available. This is particularly true for Titan, which shows a complex and rich surface where geological and meteorological processes are active, and where fieldwork is still a dream. It is even more difficult to interpret radar images, which are less intuitive than their optical counterparts, but we only have such (low resolution and noisy) radar scenes to “see” the surface of Titan through its opaque atmosphere. Studying analogue terrestrial landforms using a comparable radar system (at least in terms of wavelength) can then give us some useful indications and directions to help understand the Cassini RADAR images. However, one has to remain cautious, since the actual origin, age, morphology, and materials of the exotic structures observed on the surface of Titan are not well known. With this in mind, the previous qualitative and quantitative study of the radar scattering of terrestrial linear dunes and mega-yardangs can help us to investigate similar linear structures on Titan. We focus here on some selected sites on Titan imaged by the RADAR instrument, and show how the radar images of terrestrial analogues can guide the interpretation.
Regarding linear dunes, we considered the Cassini RADAR acquisition performed during the T8 flyby in October 2005. This covered the more than 2500 km-long Belet Sand Sea, a region dominated by linear dunes, and stretching from 180∘W to 300∘W and from 20∘N to 20∘S (Lunine et al., 2008). Illumination direction is roughly perpendicular to the orientation of the main axis of the dunes, so that the acquisition geometry is comparable to that of TerraSAR-X images presented in the previous section. Incidence angle during the T8 flyby varied from 17∘ to 24∘, also comparable to the range of incidence angle of our TerraSAR-X data. The RADAR instrument resolution is sufficiently coarse that it can be difficult to determine if the linear dunes in the Belet Sand Sea have sandy interdunes like those in Namibia (Neish et al., 2010), or are separated by exposed bedrock like the Egyptian dunes (Paillou et al., 2014), or if the two kinds can be found in different locations across Belet. We studied ten locations in the T8 flyby, where dune structures are clearly imaged, and performed some averaging in the direction parallel to the main orientation of the dunes in order to extract significant radar scattering profiles. We present three interesting and typical radar signatures in Fig. 7. Site #3 is located in a region where radar-dark dunes end on what seems to be a radar-bright plateau, and where the extracted radar scattering profile looks similar to those observed for Egyptian dunes: a first radar-bright level (-4 dB) corresponds to the rough interdune (the exposed surface of the plateau), a second intermediate level (-7 to -8 dB) might correspond to front sides of the dunes illuminated by the radar, and a third lower level (-12 to -13 dB) could be associated to sides of the dunes opposite to the radar illumination direction. Site #8 is located in a region that was previously studied by Neish et al. (2010) who applied radarclinometry techniques to estimate dune heights. It shows the same three “Egyptian-like” scattering levels: a radar-bright level (-1 to -4 dB) that could again be associated with bare interdunes, an intermediate level (-7 to -8 dB) that could correspond to front sides of the dunes, and a lower scattering level (-12 dB) that could be associated with back sides of the dunes (and remains higher than the Cassini RADAR noise level, around -18 dB). However, it is also possible that dunes of site #8 are of the Namibian type, and that the radar-bright peaks are the sides of the dunes facing the direction of the radar illumination, the intermediate level being the result of interdune scattering, and the lower level being the back side of the dunes. Interpreting the radar-bright features as interdunes (Egyptian-type) or as sides of dunes facing the radar (Namibian-type) will have a strong impact on the dunes’ shape estimation using radarclinometry (Neish et al., 2010). Site #7 exhibits a more clear Namibian-like bimodal radar signature. It shows alternation of high-scattering return (-6 to -7 dB) and medium-scattering return (around -12 dB): the signature of site #7 looks very similar to that of Namibian dunes, the radar-bright features being sides of the dunes facing the radar, and the medium-scattering level being related to sand-covered interdunes, mixed with the low return of back sides of the dunes. One can also notice that the radar-scattering levels for Titan’s dunes are generally higher than for terrestrial ones, possibly due to some additional volume scattering in a heterogeneous or porous material, as proposed by Paillou et al. (2014). While the low resolution (at best 300 m) combined with the high noise level (around -18 dB) of the RADAR instrument does not allow us to extract unambiguous radar signatures, both scattering profiles of Egyptian and Namibian-type dunes seem to be present in the Belet Sand Sea. Further studies of Titan’s dune fields should then take into account such possible different interpretations of the dark and bright linear features, and evaluate their impact on the understanding of the morphology and history of the structures.

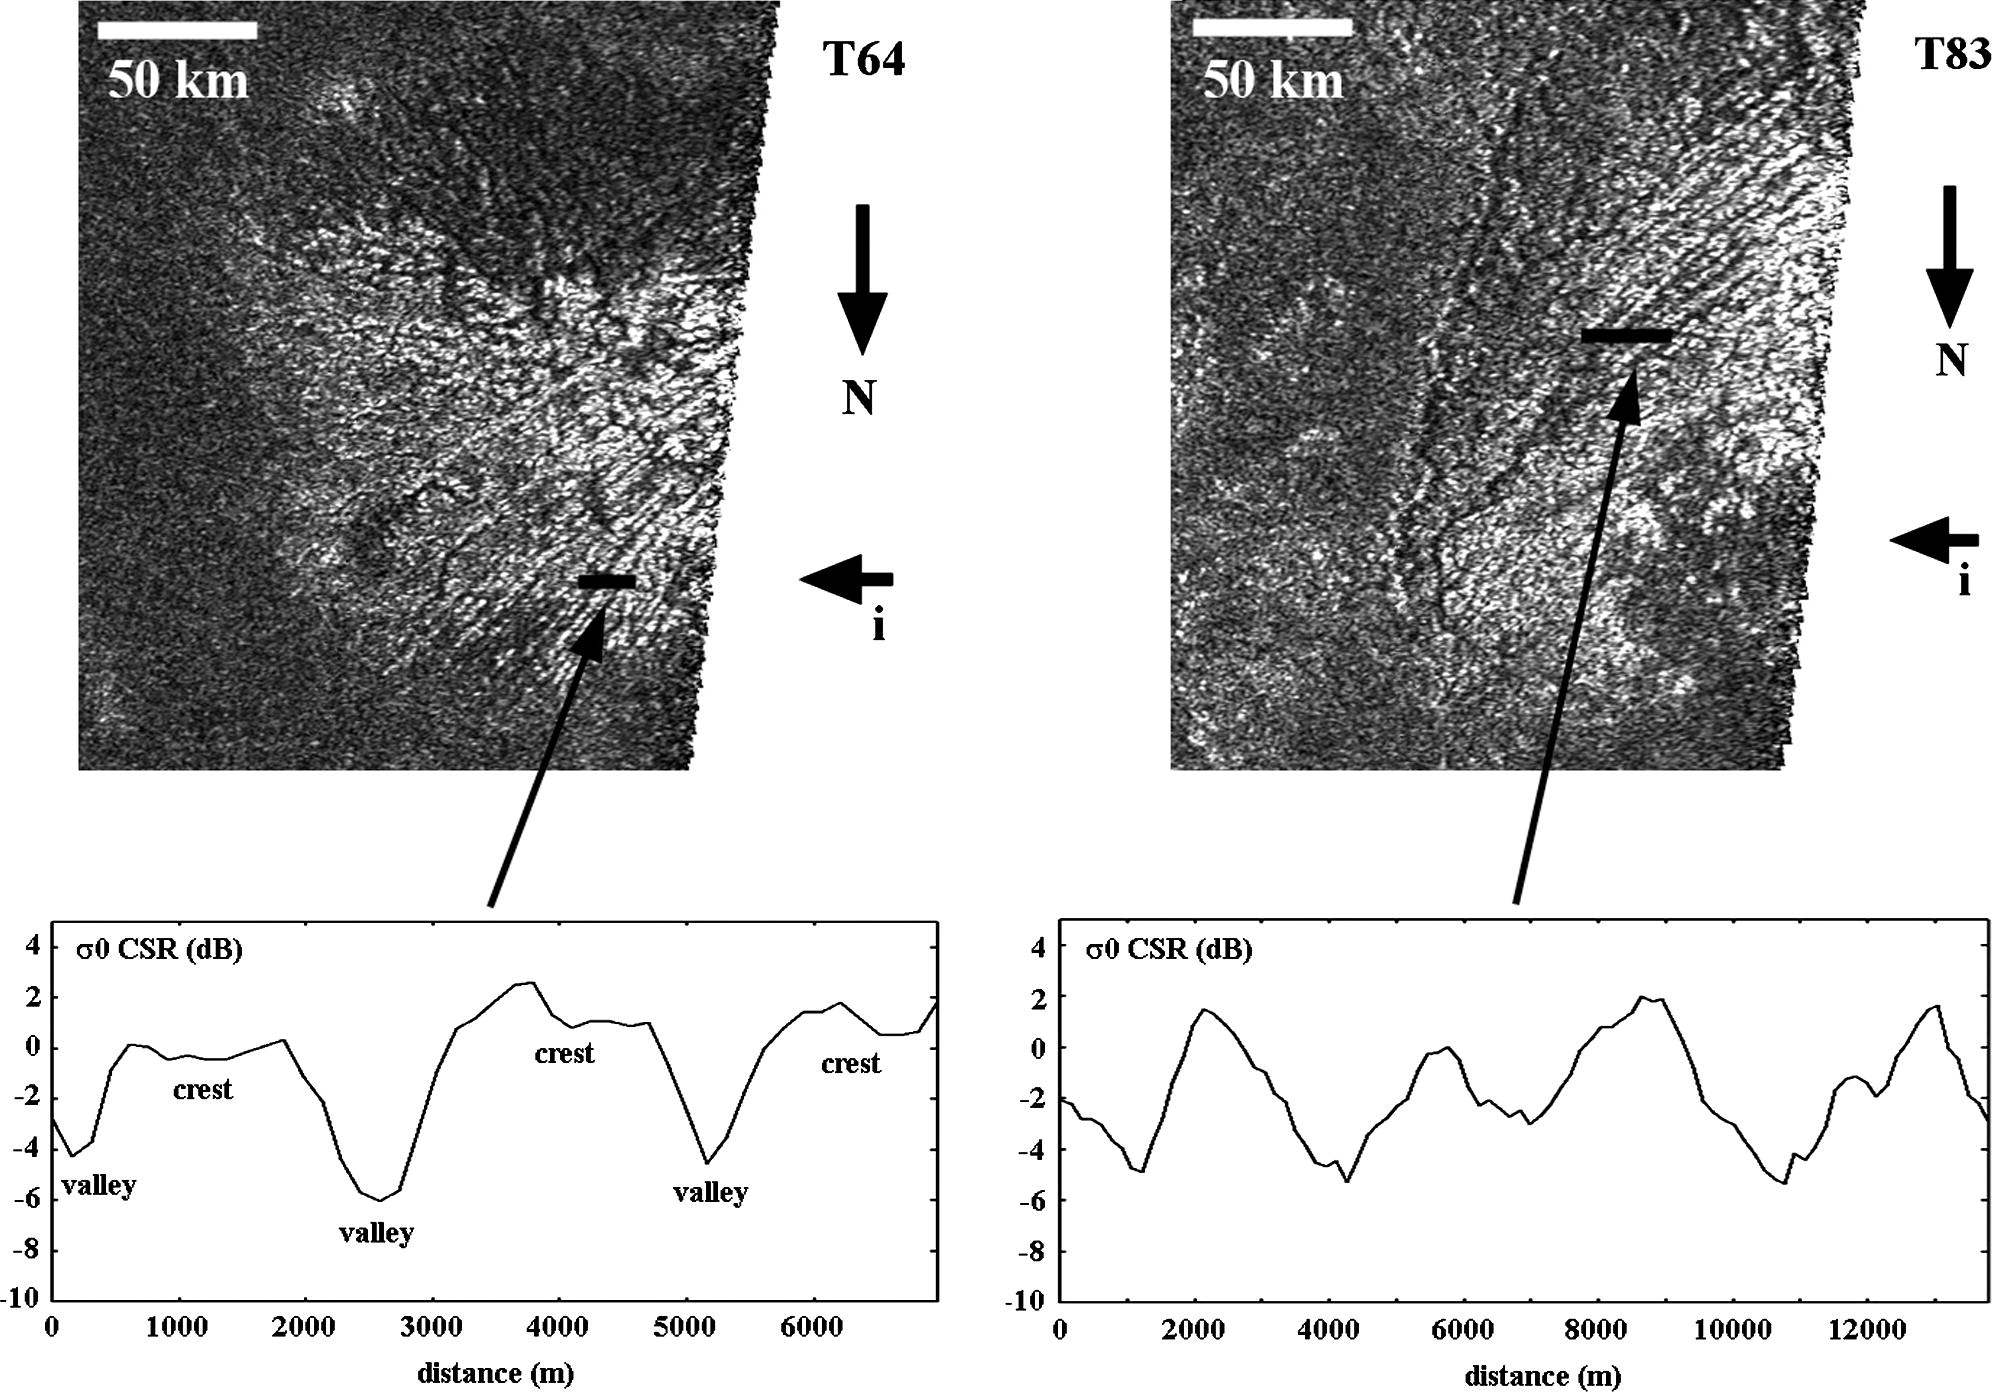
Concerning possible mega-yardangs on Titan, previous work already proposed some candidate structures (Paillou and Radebaugh, 2013; Radebaugh et al., 2015). We considered two interesting landforms, observed at mid-latitudes during the Cassini RADAR flybys T64 and T83. The T64 flyby was performed in December 2009 (Cassini extended mission) and our region of interest is centred on 41∘N/210∘W with an incidence angle around 14∘. The T83 flyby was acquired in May 2012 (Cassini second extended mission) and our region of interest is centred on 40∘N/197∘W with an incidence angle around 12∘. Fig. 8 shows two very bright structures in T64 and T83, presenting alternating dark and bright linear features, which are interpreted as possible mega-yardangs. The two landforms are of comparable size, and cover an area of about 60 x 60 km. Four selected sites were studied in the T64 structure and three in the T83 one, crossing bright-dark alternating linear features (see Fig. 8 presenting radar profiles across two representative sites). Again, we averaged the radar scattering along the main direction of the linear features, in order to derive significant radar scattering profiles. While both T64 and T83 candidate mega-yargdangs look similar, a closer look shows that the T64 structure is more like the old mega-yardangs in Chad, while the T83 structure is more similar to the Iranian mega-yardangs. Fig. 8 presents the radar scattering profile associated with site #1 in T64 flyby: as for Chadian mega-yardangs, two main scattering levels are observed, a very bright level (0 dB) corresponding to possible wide yardang crests, and a less-bright level (around -5 dB) corresponding to possible erosion valleys. Fig. 8 also shows the radar profile associated with site #1 in T83 flyby: the same two radar scattering levels as in T64 are observed there, but with a higher spatial frequency alternation of narrower bright and less-bright features, more similar to the signature of young yardangs observed in the Lut Desert in Iran. We did not conduct any morphological measurements on these potential extra-terrestrial yardangs to compare them to the terrestrial ones (whose morphology is actually poorly described (Goudie, 2007), but we rather focused here on their radiometric signature. As for linear dunes, one can notice that the structures observed on Titan are much brighter than their terrestrial analogues: the brightest crests of Iranian and Chadian yardangs at around -5 dB correspond to the low scattering level of the “valleys” of Titan’s yardangs. Again, additional scattering processes, such as volume scattering, should be considered on Titan. Nevertheless, even if the global radar scattering level on Titan’s surface is higher, the average scattering level difference between linear dunes and mega-yardangs remains of the order of 10 dB, comparable to the difference observed for their terrestrial analogues. Finally, it is interesting to note that the average radar scattering level of the T64 and T83 structures is around -2 dB (for an incidence angle around 13∘), a value comparable to the average scattering level of north polar empty lakes basins (Hayes et al., 2008; Michaelides et al., 2015). If the radar-bright structures in T64 and T83 are mega-yardangs, they may be the erosion result of unimodal wind direction over soft deposits that could be ancient lake beds and/or evaporites (Barnes et al., 2011; Cordier et al., 2013). If confirmed, this would indicate the possible existence of ancient lake basins at lower latitudes (around 40∘N) than polar regions in the past history of Titan.
While comparing terrestrial geological landforms to ones observed on Titan’s surface is not an easy exercise, the choice of relevant structures on Earth and the use of a high-frequency orbital radar sensor can nevertheless help to better interpret the noisy and low resolution images provided by the Cassini RADAR instrument. In order to illustrate, in a qualitative way, the similarity between the radar signature of linear structures on Earth and Titan, we degraded the four TerraSAR-X scenes that we previously used to a resolution and a noise level similar to the RADAR instrument. Fig. 9 presents the resulting degraded images of linear dunes and mega-yardangs on Earth, which are strongly reminiscent of the landforms seen on Titan’s surface.
5 Conclusion
High resolution X-band radar images of terrestrial linear dunes and mega-yardangs can help to better interpret the radar signature of similar structures that are likely to exist on the surface of Titan. Using a simple surface scattering model combined with topography data, we accurately reproduced the radar backscattering profiles of linear dunes (Egypt and Namibia) and mega-yardangs (Iran and Chad), thus establishing a relationship between the radar radiometry and the morphology and nature of imaged structures.
Applying this new understanding of the radar scattering process to the interpretation of Cassini RADAR data, we have shown that both Egyptian and Namibian-type dunes are present in the T8 flyby acquisition of the Belet Sand Sea, i.e. interdune regions there can be either sand-covered or not. This result should be taken into account for future studies of the equatorial dune fields present on Titan.
We have also shown that two radar-bright structures, observed during the T64 and T83 flyby acquisitions, are very likely to be the first mega-yardangs observed on Titan. Such erosional structures could be the remnants of past lake basins at mid-latitude, formed when Titan’s climate was different, and need for further studies to understand their origin.
As previously noticed by other authors, both dunes and yardangs on Titan present a much stronger radar return than their terrestrial counterparts, indicating that some additional scattering processes, such as volume scattering in an heterogeneous or porous material, occur on Titan.
Acknowledgments
The authors would like to acknowledge the French space agency CNES for providing financial support to Ph. Paillou and B. Seignovert for this study, and the German space agency DLR for providing TerraSAR-X scenes (proposal GEO1970). They also thank Tom Farr and Ralph Lorenz for their advices and careful review of this paper.
References
- Barnes et al. (2011) Barnes J.W., et al. 2011. Organic sedimentary deposits in Titan’s dry lakebeds: Probable evaporite. Icarus 216(1):136–40. doi:10.1016/j.icarus.2011.08.022.
- Besler (2008) Besler H. 2008. The Great Sand Sea in Egypt: Formation, Dynamics and Environmental Change - a Sediment-analytical Approach. Elsevier Science. ISBN:9780444529411.
- Blom and Elachi (1987) Blom R., Elachi C. 1987. Multifrequency and multipolarization radar scatterometry of sand dunes and comparison with spaceborne and airborne radar images. J Geophys Res 92(B8):7877. doi:10.1029/JB092iB08p07877.
- Bristow et al. (2000) Bristow C., Bailey S., Lancaster N. 2000. The sedimentary structure of linear sand dunes. Nature 406(6791):56–9. doi:10.1038/35017536.
- Cordier et al. (2013) Cordier D., Barnes J., Ferreira A. 2013. On the chemical composition of Titan’s dry lakebed evaporites. Icarus 226(2):1431–7. doi:10.1016/j.icarus.2013.07.026.
- De Silva et al. (2010) De Silva S., Bailey J., Mandt K., Viramonte J. 2010. Yardangs in terrestrial ignimbrites: Synergistic remote and field observations on Earth with applications to Mars. Planet Space Sci 58(4):459–71. doi:10.1016/j.pss.2009.10.002.
- Ehsani and Quiel (2008) Ehsani A.H., Quiel F. 2008. Application of Self Organizing Map and SRTM data to characterize yardangs in the Lut desert, Iran. Remote Sens Environ 112(7):3284–94. doi:10.1016/j.rse.2008.04.007.
- Elachi et al. (2004) Elachi C., et al. 2004. The Cassini-Huygens Mission. In: Russell C.T., editor. Cassini-Huygens Mission. Dordrecht: Springer Netherlands. ISBN:1-4020-3147-5; p. 71–110. doi:10.1007/1-4020-3874-7.
- Elachi et al. (2005) Elachi C., et al. 2005. Cassini Radar Views the Surface of Titan. Science 308(5724):970–4. doi:10.1126/science.1109919.
- Fung et al. (1992) Fung A., Li Z., Chen K. 1992. Backscattering from a randomly rough dielectric surface. IEEE Trans Geosci Remote Sens 30(2):356–69. doi:10.1109/36.134085.
- Fung and Eom (1981) Fung A.K., Eom H.J. 1981. Multiple scattering and depolarization by a randomly rough Kirchhoff surface. IEEE Trans Antennas Propag 29(3):463–71. doi:10.1109/TAP.1981.1142613.
- Gabriel (1938) Gabriel A. 1938. The Southern Lut and Iranian Baluchistan. Geogr J 92(3):193–208. doi:10.2307/1788828.
- Goudie (2007) Goudie A.S. 2007. Mega-Yardangs: A Global Analysis. Geogr Compass 1(1):65–81. doi:10.1111/j.1749-8198.2006.00003.x.
- Greeley (1999) Greeley R. 1999. Windblown Features on Venus and Geological Mapping. In: NASA STI; vol. 99. p. 16048. URL: http://adsabs.harvard.edu/abs/1999STIN...9916048G.
- Hayes et al. (2008) Hayes A., et al. 2008. Hydrocarbon lakes on Titan: Distribution and interaction with a porous regolith. Geophys Res Lett 35(9):L09204. doi:10.1029/2008GL033409.
- Lancaster (1989) Lancaster N. 1989. The Namib Sand Sea: dune forms, processes and sediments. AA Balkema. ISBN:9061916976.
- Le Gall et al. (2011) Le Gall A., et al. 2011. Cassini SAR, radiometry, scatterometry and altimetry observations of Titan’s dune fields. Icarus 213(2):608–24. doi:10.1016/j.icarus.2011.03.026.
- Lopes et al. (2007) Lopes R., et al. 2007. Cryovolcanic features on Titan’s surface as revealed by the Cassini Titan Radar Mapper. Icarus 186(2):395–412. doi:10.1016/j.icarus.2006.09.006.
- Lorenz et al. (2006) Lorenz R.D., et al. 2006. The Sand Seas of Titan: Cassini RADAR Observations of Longitudinal Dunes. Science 312(5774):724–7. doi:10.1126/science.1123257.
- Lorenz and Radebaugh (2009) Lorenz R.D., Radebaugh J. 2009. Global pattern of Titan’s dunes: Radar survey from the Cassini prime mission. Geophys Res Lett 36(3):L03202. doi:10.1029/2008GL036850.
- Lunine et al. (2008) Lunine J., et al. 2008. Titan’s diverse landscapes as evidenced by Cassini RADAR’s third and fourth looks at Titan. Icarus 195(1):415–33. doi:10.1016/j.icarus.2007.12.022.
- Mainguet (1968) Mainguet M. 1968. Le Borkou. Aspects d’un modèle éolien. Ann Georgr 77(421):296–322. doi:10.3406/geo.1968.15662.
- McHone et al. (1996) McHone J.F., Greeley R., Blumberg D. 1996. SIR-C/X-SAR Radar Studies; Impact and Aeolian Features, Borkou Region Northern Chad. In: Lunar Planet. Sci.; vol. 27. p. 849–50. URL: http://adsabs.harvard.edu/abs/1996LPI....27..849M.
- Michaelides et al. (2015) Michaelides R.J., et al. 2015. Titan’s Empty Lake Basins: Constraining Surface Physical Properties by Investigating Radar Backscatter Behavior at Multiple Incidence Angles. In: 46th Lunar Planet. Sci. Conf. p. 1581. URL: http://adsabs.harvard.edu/abs/2015LPI....46.1581M.
- Neish et al. (2010) Neish C.D., Lorenz R.D., Kirk R.L., Wye L.C. 2010. Radarclinometry of the sand seas of Africa’s Namibia and Saturn’s moon Titan. Icarus 208(1):385–94. doi:10.1016/j.icarus.2010.01.023.
- Paillou et al. (2008) Paillou P., et al. 2008. Microwave dielectric constant of Titan-relevant materials. Geophys Res Lett 35(18):L18202. doi:10.1029/2008GL035216.
- Paillou and Radebaugh (2013) Paillou P., Radebaugh J. 2013. Looking for Mega-Yardang on Titan: A Comparative Planetology Approach. In: EPSC. London; p. 85. URL: http://adsabs.harvard.edu/abs/2013EPSC....8...85P.
- Paillou et al. (2014) Paillou P., et al. 2014. Modeling the SAR backscatter of linear dunes on Earth and Titan. Icarus 230:208–14. doi:10.1016/j.icarus.2013.04.017.
- Pitz and Miller (2010) Pitz W., Miller D. 2010. The TerraSAR-X Satellite. IEEE Trans Geosci Remote Sens 48(2):615–22. doi:10.1109/TGRS.2009.2037432.
- Radebaugh et al. (2007) Radebaugh J., et al. 2007. Mountains on Titan observed by Cassini Radar. Icarus 192(1):77–91. doi:10.1016/j.icarus.2007.06.020.
- Radebaugh et al. (2008) Radebaugh J., et al. 2008. Dunes on Titan observed by Cassini Radar. Icarus 194(2):690–703. doi:10.1016/j.icarus.2007.10.015.
- Radebaugh et al. (2010) Radebaugh J., et al. 2010. Linear dunes on Titan and earth: Initial remote sensing comparisons. Geomorphology 121(1-2):122–32. doi:10.1016/j.geomorph.2009.02.022.
- Radebaugh et al. (2015) Radebaugh J., Lorenz R.D., Paillou P., Farr T.G. 2015. Possible Yardangs of Titan and Western China Reveal Winds and Surface Erosion. In: 46th Lunar Planet. Sci. Conf. p. 2746. URL: http://adsabs.harvard.edu/abs/2015LPI....46.2746R.
- Rubin and Hesp (2009) Rubin D.M., Hesp P.A. 2009. Multiple origins of linear dunes on Earth and Titan. Nat Geosci 2(9):1–6. doi:10.1038/ngeo610.
- Schwerdt et al. (2010) Schwerdt M., et al. 2010. Final TerraSAR-X Calibration Results Based on Novel Efficient Methods. IEEE Trans Geosci Remote Sens 48(2):677–89. doi:10.1109/TGRS.2009.2035308.
- Stofan et al. (2007) Stofan E.R., et al. 2007. The lakes of Titan. Nature 445(7123):61–4. doi:10.1038/nature05438.
- Ulaby et al. (1990) Ulaby F., et al. 1990. Microwave dielectric properties of dry rocks. IEEE Trans Geosci Remote Sens 28(3):325–36. doi:10.1109/36.54359.
- Zimbelman et al. (2013) Zimbelman J., Bourke M., Lorenz R. 2013. Recent developments in planetary Aeolian studies and their terrestrial analogs. Aeolian Res 11:109–26. doi:10.1016/j.aeolia.2013.04.004.