,
The physics of epigenetics
Abstract
In higher organisms, all cells share the same genome, but every cell expresses only a limited and specific set of genes that defines the cell type. During cell division, not only the genome, but also the cell type is inherited by the daughter cells. This intriguing phenomenon is achieved by a variety of processes that have been collectively termed epigenetics: the stable and inheritable changes in gene expression patterns. This article reviews the extremely rich and exquisitely multi-scale physical mechanisms that govern the biological processes behind the initiation, spreading and inheritance of epigenetic states. These include not only the changes in the molecular properties associated with the chemical modifications of DNA and histone proteins, such as methylation and acetylation, but also less conventional changes, typically in the the physics that governs the three-dimensional organization of the genome in cell nuclei. Strikingly, to achieve stability and heritability of epigenetic states, cells take advantage of many different physical principles, such as the universal behavior of polymers and copolymers, the general features of dynamical systems, and the electrostatic and mechanical properties related to chemical modifications of DNA and histones. By putting the complex biological literature under this new light, the emerging picture is that a limited set of general physical rules play a key role in initiating, shaping and transmitting this crucial “epigenetic landscape”. This new perspective not only allows to rationalize the normal cellular functions, but also helps to understand the emergence of pathological states, in which the epigenetic landscape becomes dysfunctional.
I Introduction
I.1 An intricate history
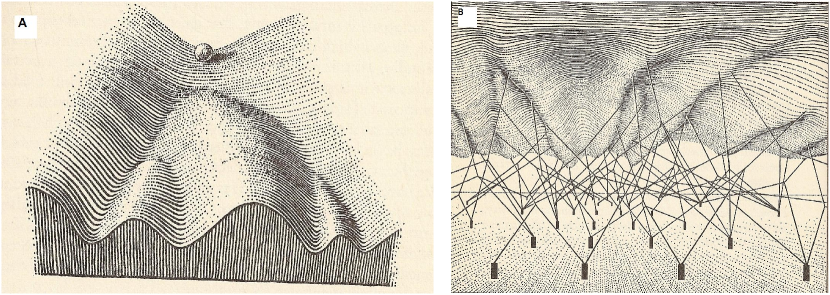
The word “epigenetic” has been introduced by Waddington in 1942 in the context of development, to qualify all the processes relating the genotype and the phenotype of an organism Waddington (1942). The associated investigations belonged to the domain, novel at that time, of developmental genetics. The word “epigenetic” in this original meaning was imprinted by the pre-existing concept of epigenesis, namely the fact that the organism is not fully achieved in the initial cell but experiences complex developmental processes Gilbert (2012). Epigenetics was at that time the mechanistic study of how genes guide the epigenesis (development) of an organism, what is captured in a metaphoric way by the famous Waddington’s epigenetic landscape: a landscape, shaped by the genes, on which the organism would evolve during its development as a rolling stone on the landscape, following one of the possible epigenetic pathways (see Fig. 1).
In parallel, the adjective has been used with the meaning of “para-genetic”. Epigenetic systems, as opposed to the genetic system, were conceived as “signal interpreting devices” Nanney (1958), i.e. mediators between signals – environmental or physiological cues – and the genomic response, mainly at the level of transcriptional regulation.
Due to this dual origin of the word “epigenetic”, the associated concepts have developed in several ways (see Haig (2004) for a detailed historical account) and one could find in 1994 the two following complementary definitions of epigenetics Holliday (1994): (1) changes in gene expression which occur in organisms with differentiated cells, and the mitotic inheritance of the associated patterns of gene expression; (2) transgenerational inheritance, that is, transmission through meiosis of non-genomic information.
Due to this intricate history, a consensus definition of epigenetics is still lacking today Dawson and Kouzarides (2012). Notably the transgenerational inheritance, albeit largely documented in plants, remains a matter of debate in animals and especially in humans.
Recently, some authors proposed an operational definition of epigenetics: “An epigenetic trait is a stably heritable phenotype resulting from changes in a chromosome without alterations in the DNA sequence”. This will be the definition we use in this review. To be even more specific, we note that:
Epigenetics is the modification of the function(s) of a gene, that is stable and heritable during mitosis, possibly during meiosis.
Epigenetics is not the reversible regulation of transcription in response to metabolic cues, because this is not stable nor heritable.
I.2 Scope of this review
In this review, we not only intend to analyze the physics that drives or accompanies epigenetic marking, but we also aim at understanding the rationale behind this marking. And physics is a beautiful, yet underrated guide to reach this goal.
Several epigenetic mechanisms will be distinguished: those occurring at the level of DNA, those involving histone post-translational modification, and less conventional ones involving chromatin topology (supercoiling) and nuclear architecture.
We first introduce in section II the physical template of epigenetic marking, namely chromatin.
Section III is devoted to the physics behind the family of processes at work in the way epigenetic marks control gene expression in different cell types.
Section IV addresses the issue of the initiation, spreading, maintenance, and heritability of the epigenetic marks in the framework of dynamical systems.
In Section V we review other epigenetic processes that have a less clear-cut physical interpretation: DNA methylation, imprinting, chromosome X inactivation, supercoiling marking. In conclusion we finally propose a list of currently significant and challenging issues.
Due the fundamentally different logic of transcriptional regulation in prokaryotes and eukaryotes Struhl (1999), we will let aside the realm of bacteria, although epigenetic switches have been observed as well in prokaryotic cells and have been modeled successfully Lim and Van Oudenaarden (2007); Norregaard et al. (2013).
We hope this review will be a stimulating introduction to epigenetics for physicists as well as an “alternative reading frame” of epigenetics for biologists that will help tackling cutting-edge advances in current topics ranging from nuclear organization and cell differentiation up to cancer progression and chronic diseases.
II The physical template of epigenetics: chromatin
In all living organisms, DNA encodes the genetic instructions required to synthesize proteins, the basic bricks ensuring the proper functioning of the cell. The main steps of protein synthesis are DNA transcription into RNA, then RNA translation into an aminoacid chain and chain folding to form a functional protein Alberts et al. (2013).
The very same genome is found in each cell. It has to be packaged inside its tiny volume, and has to be retrieved at will for physiological purposes. DNA is therefore embedded in an orderly and dynamically retrievable architecture. Two main organizational strategies can be identified. In prokaryotes (bacteria), DNA is located in the same compartment as all other intracellular components. In eukaryotes (from the unicellular yeast up to multicellular organisms, including fungi, animals and plants), DNA is sequestered in the nucleus, a dedicated compartment enclosed within a membrane.
In the cell nucleus, multiple long linear DNA molecules are organized by architectural proteins to form chromosomes. From a physicist point of view, chromosomes are giant polymers. During mitosis, i.e. cell division, chromosomes duplicate and then condense in the well known “X” shape, with each DNA copy forming one of the two rods (the sister chromatids, bound together at the centromere). The rest of the time (i.e. during interphase), chromosomes are less condensed and fill the whole nucleus, more or less homogeneously Leblond and El-Alfy (1998). To give a quantitative idea of the composition of an interphase nucleus, the dry matter of a yeast nucleus is about 70-80% in protein, 20-30% in RNA, and only 2% in DNA Rozijn and Tonino (1964).
In this section we introduce the basic concepts that come into play in the study of epigenetics. In Sec. II.1 we give an overview of the molecular structure of chromatin, and we introduce the concept of epigenetic marks. In Sec. II.2 we will give an overview of the large-scale organization of chromatin in the cellular nucleus, stressing the importance of this organization in gene expression. Finally, in Sec. II.3 we give a synthetic picture of these two aspects, in the framework of polymer physics.
II.1 Molecular picture of chromatin and its modifications
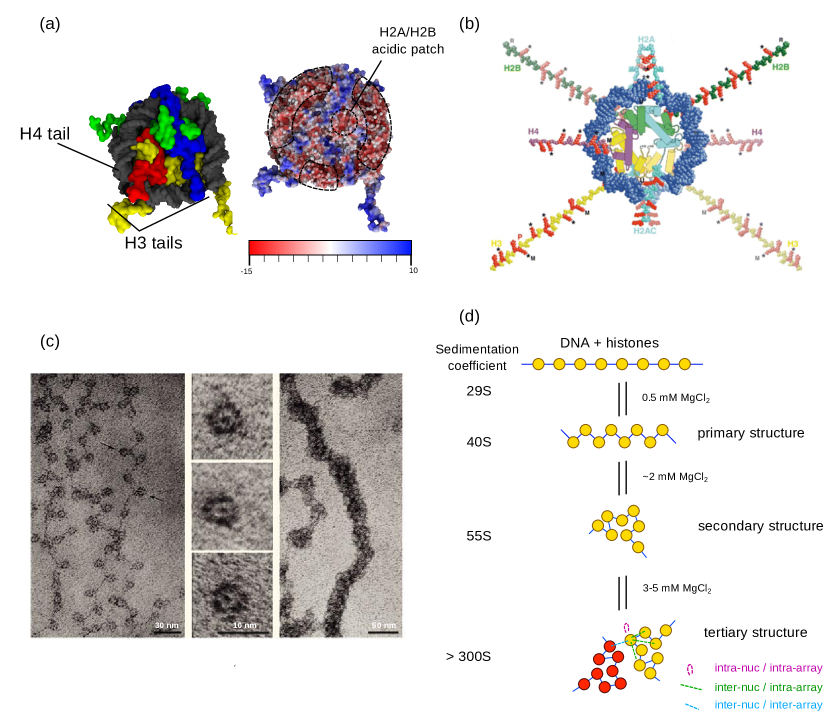
In eukaryotic organisms, chromosomal DNA is associated with proteins to form chromatin. The principal proteins associated with DNA are called histones. Histones are polypeptidic monomers of five types: Histone 1 (H1) class, Histone 2A (H2A) class, Histone 2B (H2B) class, Histone 3 (H3) class and Histone 4 (H4) class. Each histone family has variants whose presence in chromatin depends on the species, the cell type, and the development stage. The classical structure of the histone-DNA assembly consists of 1.7 left-handed turns of double strand DNA (approximately 147 base pairs or bp) wrapped around a histone octamer composed of two copies of each histone monomer H2A, H2B, H3 and H4 Luger et al. (1997); Davey et al. (2002). In most species, this assembly, referred to as the nucleosome core particle (NCP) (see Fig. 2a,b), may also integrate a copy of H1 (linker histone) at the DNA entry/exit point, although H1 does not share the ubiquity of the other histone classes.
In addition, consecutive NCPs are separated by linker DNA whose length ranges from 20 to 60 bp. Indeed, chromosomes are a succession of NCPs and DNA linkers. The basic structural unit (monomer) is made of one NCP and one DNA linker, and is called the nucleosome. The number of DNA base pairs inside one nucleosome is the Nucleosome Repeat Length (NRL) (see Fig. 2c,d), which is not constant and may vary along the genome and across various tissues.
Electrostatic interactions are important because the NCP has a charge of -150e, to which DNA contributes -294e and histones +144e. The NCP is therefore not electrically neutral, so the folding of nucleosome arrays is highly dependent on the presence of positive counterions Yang and Hayes (2011); Bertin et al. (2007b). Additionally, the charge distribution in the NCP is not spatially homogeneous (see Fig. 2a).
Epigenetic marks are chemical covalent modifications of either DNA (namely DNA methylation, see Sec. V.1), or histones (so-called post-translational modifications, PTMs, see Sec. III.2). The DNA methylation state and the histone PTMs are transmitted through cell division both because they are covalent and thanks to specific mechanisms. DNA methylation is accurately transmitted by a specific molecular mechanism (see Sec. V.1). Histone PTMs are inherited in a fundamentally different way, which will be the principal subject of Sec. IV.
II.2 Large-scale picture of chromatin
Eukaryotic chromosomes are giant polymers, each formed by a huge string of nucleosomes. The conformation of this string at different length scales is generally described using an analogy with proteins: the string of nucleosomes itself can be viewed as the primary structure of chromatin; the conformation adopted by an array of a few dozen successive nucleosomes forms the secondary structure of chromatin. The 3D structural arrangement of several arrays can finally be viewed as the chromatin tertiary structure Luger et al. (2012); Pepenella et al. (2013), see Fig. 2d.
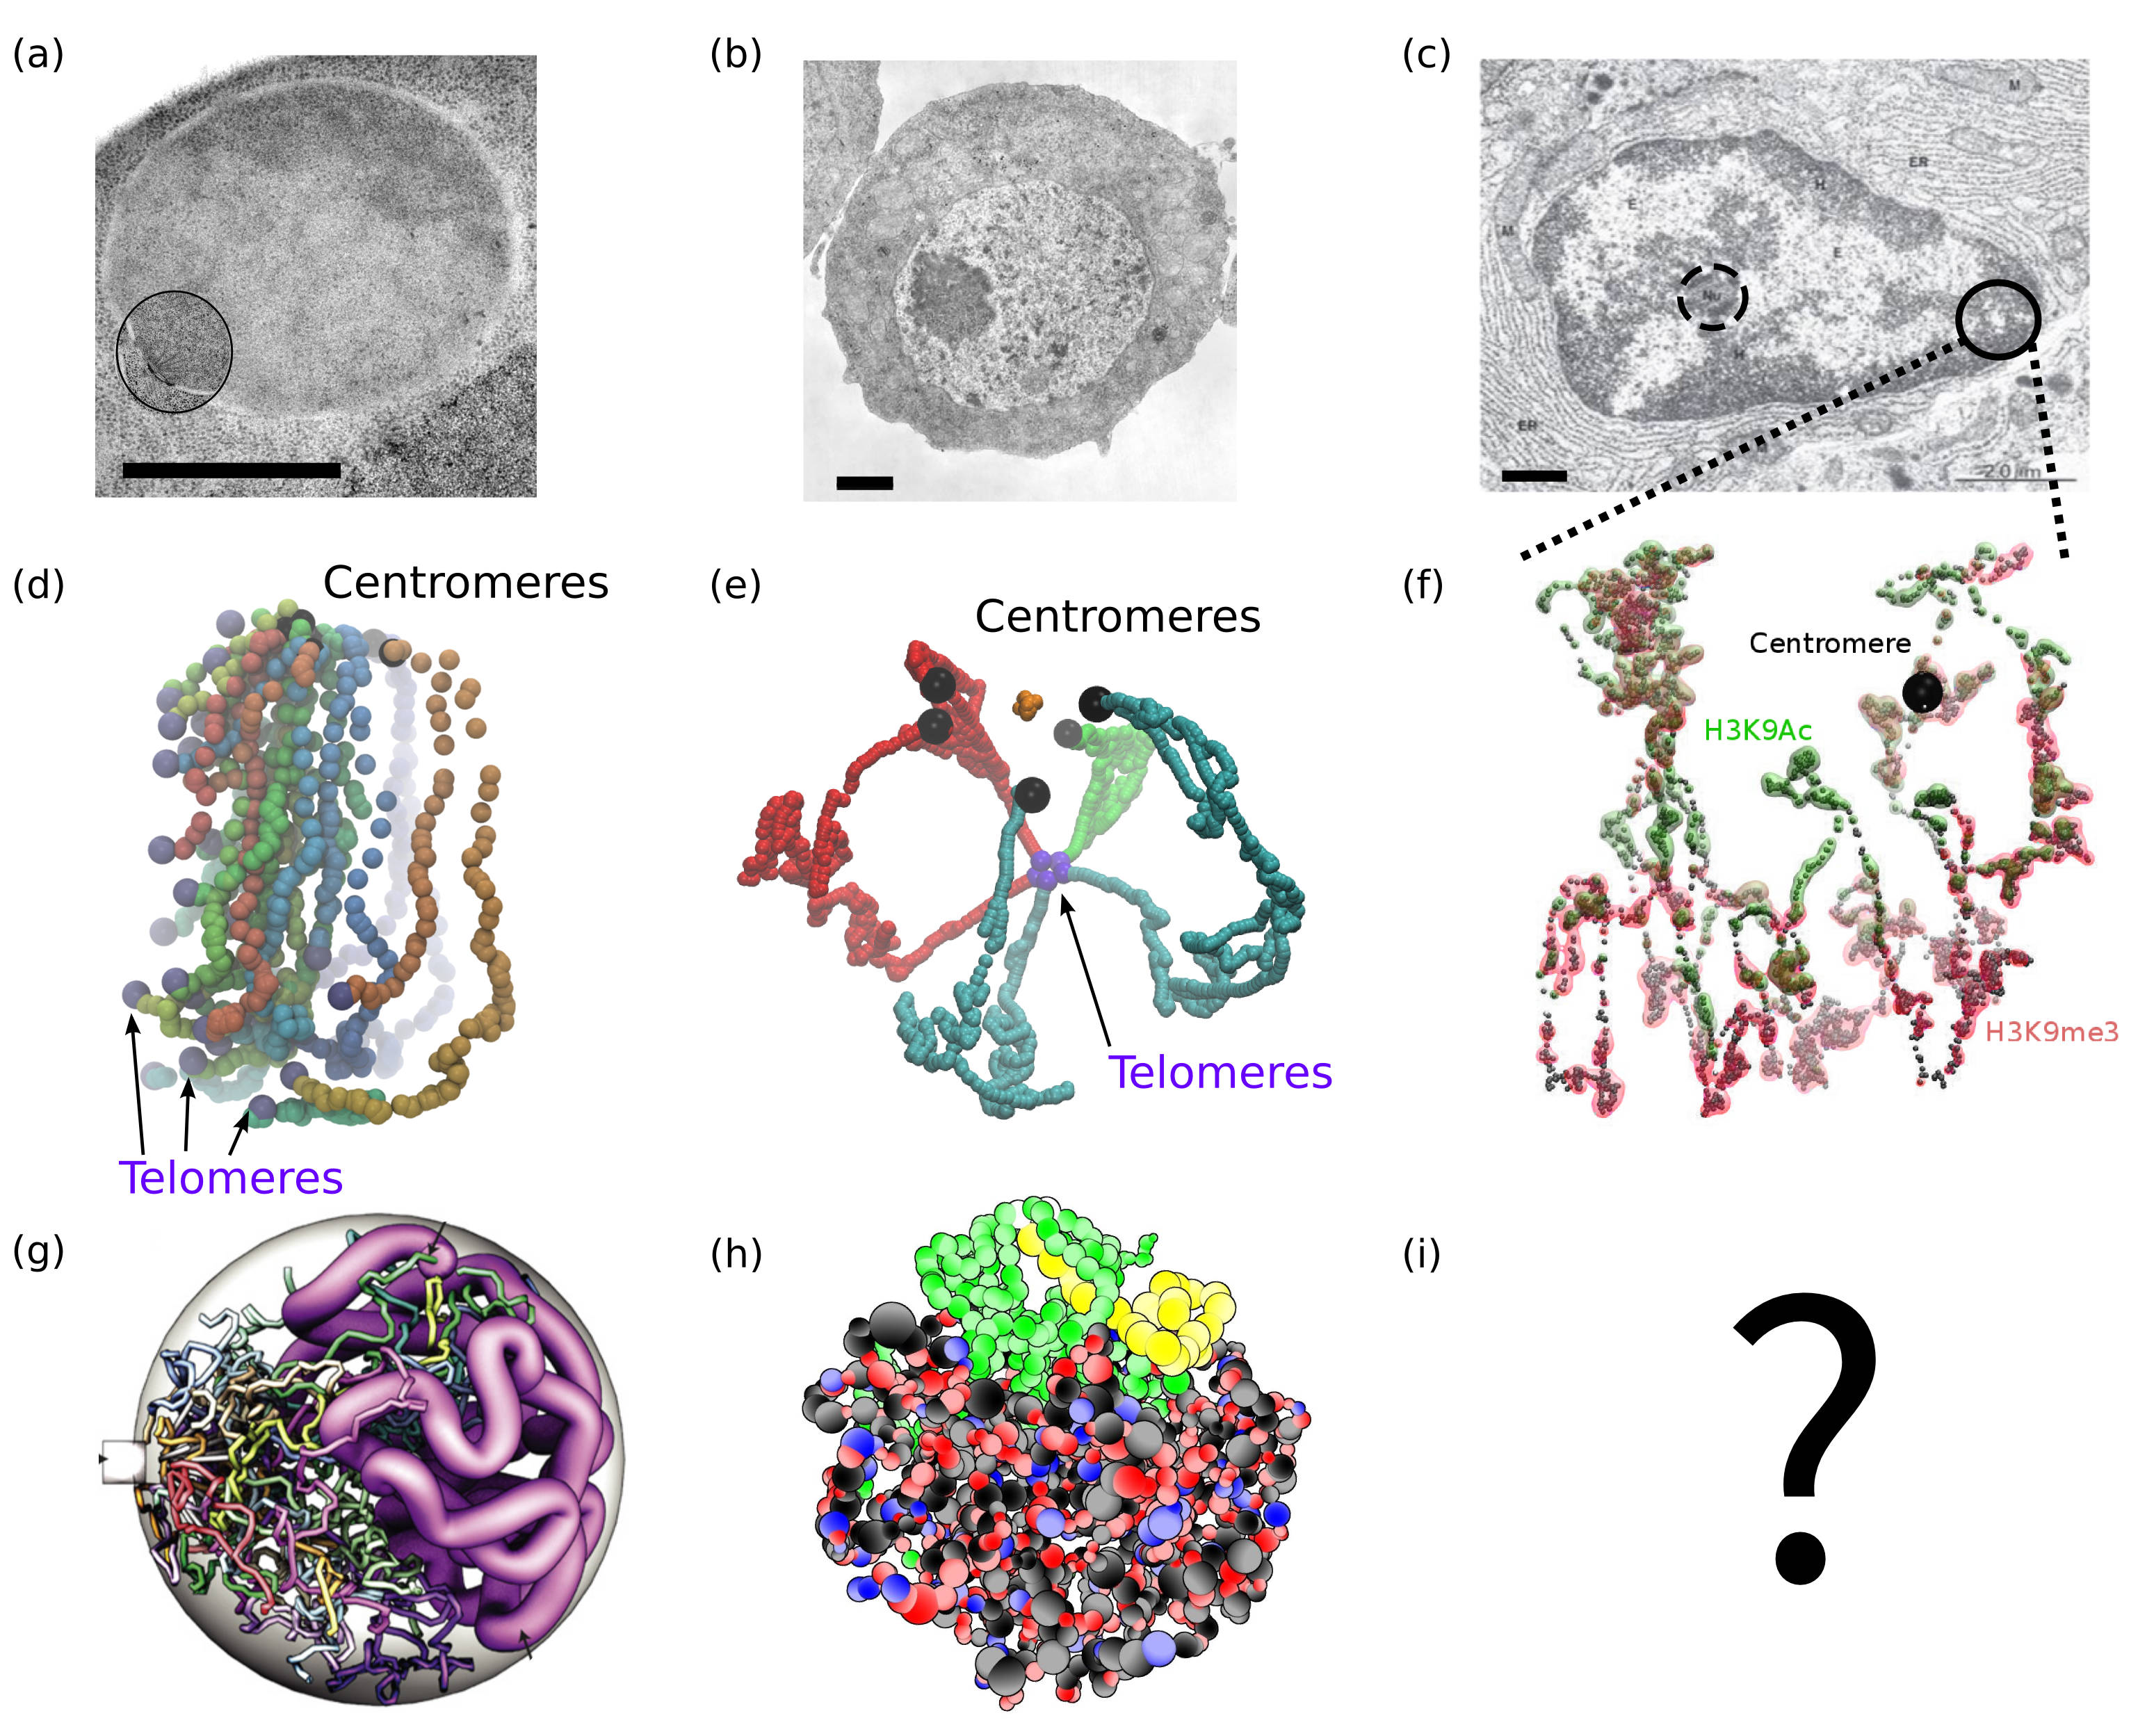
When observed by electron microscopy (see Fig. 3a,b,c), interphase chromatin appears to fill the entire nucleus volume. As genome length may vary considerably from organism to organism, the nucleus size varies accordingly: orders of magnitude go from (Mega base pairs) for a diameter of the order of 2 m in yeast (Fig. 3a), to and 4 m in drosophila fly (Fig. 3b), and up to and 10 m in mammals (Fig. 3c). These differences in size are certainly correlated with the differences in chromatin organization that can be directly deduced by simple inspection of electron microscopy images.
Yeast nuclei are the most homogeneously filled ones, with a large, denser region called the nucleolus, which is known to be the site of very intense ribosomal RNA synthesis. A smaller, dark linear body can also be seen in the inset, connected with a star-shaped structure, the spindle pole body (SPB) from which tubular proteic assemblies, microtubules, stem and “hold” chromosomes at their centromeres. In contrast with multicellular organisms, in yeast this microtubule bundle is preserved all along the cell cycle. It is a crucial organization center for the assembly of chromosomes in interphase and for chromosome segregation during mitosis (see Fig. 3a,d,g).
When the nuclei of multicellular organisms are considered (Fig. 3b,c), their most striking feature is the coexistence of distinct denser and less compact regions. These regions are persistent and are not simply the result of temporal fluctuations of chromatin density. These features have been shown to strongly correlate with the transcription activity of genes. Active genes tend indeed to gather at the center of the nucleus, in a region where chromatin is less dense and more accessible, which is called euchromatin. Inactive genes are found instead in denser regions, called heterochromatin, and tend to associate with the nuclear periphery. As a stunning example of chromatin compaction and localization changes induced by transcription, the activation of a genomic locus results in a dramatic change of its topology (Fig. 4a).
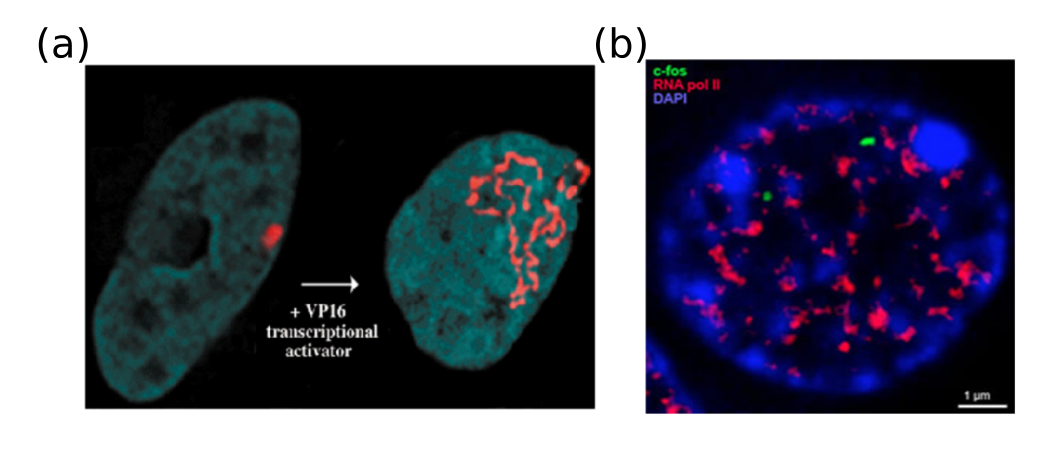
With the improvement of imaging and labeling techniques, gene transcription by the RNA polymerase PolII in multicellular organisms has been shown to occur in well-defined loci, called factories (Fig. 4b) Jackson et al. (1993). These factories are located within the euchromatin domain and each factory has a propensity to gather co-regulated genes Jackson et al. (1998). In this picture, it appears that the functional differences between cell types are related to the way the genome is folded in the nucleus of these cells.
In the last two decades, impressive advances in experimental techniques in measurements of 3D chromosomal contacts have been made, starting from the “Chromosome conformation capture” approach Dekker et al. (2002). Its genome wide derivative (Hi-C) enables the generation of contact maps at the genome scale Lieberman-Aiden et al. (2009). From these maps, it is possible to reconstruct the underlying 3D structure of the genome and such structures are represented on Fig. 3d,e,f. The results confirmed the tethering of centromeres in yeast and drosophila, but also of telomeres. In humans the reconstruction of chromosome 1 gives a visual illustration of decondensed euchromatin loops emanating from globular heterochromatin globules. These are decorated with two different specific histone marks. We will come back on the results of these investigations in Sec. III.3.1.
II.3 Chromosomes as polymers
Most of the modeling efforts addressing the question of the nuclear organization have been so far oriented by polymer physics. The question then arises as to understand whether polymer physics is the main player that drives chromosome organization.
(i) In the simplest case of yeast, where chromosomes are shorter and all anchored at the SPB by their centromeres, it seems to be the case. Indeed, several polymer simulations have been able to reproduce the structure of interphase yeast nuclei Wong et al. (2012); Tjong et al. (2012), see Fig. 3g 111Note that, in yeast, the whole genome is actively transcribing most of the time, with the only exception of the regions that govern the cell sexual behavior, called “hidden mating type loci”, and of the chromosome extremities, called telomeres, which protect the ends of the chromosome from damaging or from fusion with other chromosomes. Therefore heterochromatin is restricted to telomeres and mating type loci in this case.. Moreover, fluorescent microscopy has been used to check the dynamical behavior in vivo of given chromosomal loci, Hajjoul et al. (2013); Albert et al. (2013). Single particle tracking has revealed a quite uniform response within the genome, characteristic of polymers in confined spaces. Except for telomeres and for the highly transcribed DNA in the nucleolus, yeast chromosomes behave as a polymer brush, and are essentially organized by simple physical principles Huet et al. (2014) (see Fig. 3d,g).
(ii) In the well-studied, intermediate-size case of the drosophila, recent investigations tend to indicate that this polymer behavior is partially conserved, but with some significant changes that complexify the picture (see Fig. 3e,h). Roughly speaking, it has been proposed that euchromatin and heterochromatin have intrinsically different biochemical and physical properties, due to a deeply different protein “dressing” of the DNA molecules. More precisely, Filion and co-workers have identified five principal chromatin states, called chromatin “colors” from the analysis of 53 chromatin protein genome-binding profiles in drosophila cells Filion et al. (2010). Among these states, some essentially correspond to active, transcribing euchromatin, other to dense, repressed heterochromatin. These chromatin states result from the recruitment of DNA-binding proteins that are specific of the underlying epigenetic marks (see Sec. III.2). Note, however, that the colors are only an arbitrary choice of the authors and do not correspond to actual coloring of the chromatin, due, e. g. , to staining.
As a consequence, drosophila chromosomes are more properly described as co-polymers, i.e. polymers containing more than one type of monomer. A model of the resulting copolymer brush is depicted on Fig. 3h.
(iii) In mammals heterochromatin is mainly located at the nuclear membrane and euchromatin at the center of the nucleus (see Fig. 3c). The reconstituted 3D structure of chromosome 1 (the longest human chromosome) shows an alternance of long loops of euchromatin and dense parts of heterochromatin tethered to the nuclear membrane (see Fig. 3f).
In summary, the conformation adopted by chromatin is affected by its intrinsic structural parameters such as the NRL (the reader may find an extensive review in Boulé et al. (2015)), on top of which lies an additional layer of modulation by internucleosomal electrostatic interactions Hansen (2002); Pepenella et al. (2013) and binding of architectural proteins. This conformation is essential for gene regulation. The epigenetic marks present on DNA and histones, by mediating specific interactions between portions of chromatin, alter its conformation and hence its function. The next section will be devoted to understanding the complex relationship between epigenetic marking and genome structure and function.
III From epigenetic marks to regulation of gene expression through the 3D organization of the genome
III.1 General principles of gene silencing. The paradigm of DNA accessibility
During development, the determination of the cell type (cell fate) involves progressive restrictions in its developmental potency and results from differential gene expression. DNA methylation is a key control parameter of this process: genes that are specific for the desired tissue are kept unmethylated, whereas the others are methylated. Moreover, patterns of DNA methylation are faithfully propagated throughout successive cell divisions (see Sec. V.1). However the physics of DNA methylation is still elusive and we therefore postpone further developments on DNA methylation to the last part of this review (see Sec. V.1).
Epigenetic regulation of gene expression involves silencing, i.e. a permanent and heritable inhibition of gene transcription (transciptional gene silencing) or translation (post-transcriptional gene silencing). The current paradigm is that gene silencing is achieved through chromatin condensation, in a so-called heterochromatinization process Grewal and Moazed (2003). Can we characterize the physical properties of heterochromatin and euchromatin? What are the physical consequences of heterochromatinization in terms of structure, dynamics and how do these physical consequences turn out into functional consequences?
Histones simultaneously play a crucial role in determining the structure of chromatin; they are the substrate of a vast catalog of epigenetic markings Kouzarides (2007); Cantone and Fisher (2013), which is not a coincidence. This supports the hypothesis that epigenetic histone marks modulate gene expression through chromatin structural rearrangements at each level of the nuclear organization: nucleosome, chromatin fiber, chromatin loops, chromosome territories, whole nucleus Zhou et al. (2007); Poirier et al. (2009).
The potentially huge number of combinations of epigenetic marks has led to the hypothesis that transcription factors (TFs) might be targeted to nucleosomes endowed with specific combinations of histone tail post-translational modifications. This was coined as the “histone code” hypothesis at the beginning of the millenium and remained popular in biology for the better part of a decade.While the genetic code encodes the sequence of a protein using the four bases of the DNA, this histone code would encode the regulatory events involved in triggering its expression, and in particular the differential expression observed in cells of different types Jenuwein and Allis (2001). However, it was then realized that only a few combinations of histone marks are actually observed Lennartsson and Ekwall (2009); Rando (2012). These relevant combinations can even be reduced to 5 classes in the case of drosophila, the so called “five colors of chromatin” as identified by Filion et al. Filion et al. (2010). Moreover, it was also realized that the histone code is actually not a genuine code insofar as the correspondence between the codewords (combinations of epigenetic marks) and their meaning (the TFs they code for) is not gratuitous Lesne (2006); Kühn and Hofmeyr (2014). Instead, the correspondence is a biochemical recognition of the pattern of histone marks by the TF. This is why it was recently proposed that chromatin may have evolved as an allosteric enzyme able to mediate a gratuitous correspondence between epigenetic marks and TF binding to the underlying DNA sequence Lesne et al. (2015).
III.2 Histone modifications as chromatin structural modulators
Most epigenetic marking occurs on the histones that coat DNA. What are the physical consequences of this marking and what is its effect on chromatin organization?
III.2.1 Histone tails and their role in internucleosomal interactions
As already mentioned, nucleosomes are formed by wrapping DNA around an octameric protein assembly formed by histone proteins. The N-terminal sequences of H2A, H3 and H4 extend from the globular histone core to form the so-called histone tails (see Fig. 2b). The H3 and H4 tails consist respectively of 35 and 20 residues, of which respectively 13 and 9 are positively charged (lysines, K and arginines, R). These tails are intrinsically disordered protein domains, hence adopt a random coil configuration, as suggested by crystallographic studies Luger et al. (1997); Davey et al. (2002) and proteolytic cleavage assays. Tails contribute differently to intranucleosomal stability and internucleosomal interactions Allan et al. (1982); Arya and Schlick (2006, 2009); Zhou et al. (2007); Sinha and Shogren-Knaak (2010). The two H3 tails exit from the histone core close to the DNA entry-exit site of the nucleosome, and associate preferentially with DNA to “lock” its wrapping around the histone core. The H4 tails are known to associate with a set of seven residues referred to as the H2A/H2B acidic patch, located on the H2A-H2B interface (see Fig. 2a). A H4 tail on one nucleosome may interact with an H2A/H2B acidic patch on a adjacent nucleosome, acting as a tether connecting the two nucleosomes Kan et al. (2009); Kalashnikova et al. (2013). The H2A and H2B tails, much shorter than their H3 and H4 counterparts and the subject of a much smaller literature, do not seem to significantly contribute to internucleosome interactions, although they are required for proper nucleosome reconstitution Bertin et al. (2007a).
III.2.2 Histone tail post-translational modifications (PTMs)

Histone tails, besides their role in the structuration of nucleosome arrays, are also the support of virtually all PTMs targetting histones, which consist in replacing groups of atoms on one residue by another, chemically different one (see Fig. 5). For an historical account of their discovery, see Morange (2013). The globular histone core and the lateral surface of the nucleosome may also undergo post-translational modifications, which modulate the nucleosome stability, DNA wrapping Tropberger and Schneider (2013); Tessarz and Kouzarides (2014), hence chromatin architecture. The repertory of histone-tail PTMs is vast both in terms of types of modifications and in terms of where the modification can take place Pepenella et al. (2013); Zentner and Henikoff (2013); Fierz (2014).
In order to reach a comprehensive physical picture we oversimplify the daunting complexity of epigenetic histone PTMs Kouzarides (2007) to focus here on:
(i) lysine methylation and notably the two main histone PTMs that are involved in gene silencing: tri-methylation of the lysine 9 of H3, noted H3K9me3, which recruits HP1 and tri-methylation of the lysine 27 of H3, noted H3K27me3, which recruits the Polycomb architectural complex;
(ii) lysine acetylation and specifically the acetylation of lysine 16 of H4, H4K16ac, which is a hallmark of active chromatin (actively expressed genes).
Epigenetic marks are deposited on or removed from histone tails by dedicated enzymes, so-called “writers” and “erasers” Fierz (2014)). Writers devoted to acetylation are histone acetyltransferases (HAT), notably lysine acetyltransferases (KAT), and writers devoted to methylation are histone methyltransferases (HMT), notably lysine methyltransferases (KMT). Erasers are histone deacetyltransferases (HDAC) and histone demethyltransferases (HDM), notably lysine demethyltransferases (KDM), see Fig. 5. A comprehensive list of the known writers and erasers is given in table 1.
| Type | Family/Class | Proteins/Complexes | Targets |
|---|---|---|---|
| GNAT | HAT1 | H4(K5, K12) | |
| GNAT | PCAF | H3(K9, K14, K18) | |
| Acetyltransferases | GNAT | SAGA | H3 |
| (HAT/KAT) | CBP/p300 | CBP/P300 | H3(K14, K18), H4(K5, K8), H2AK5, H2B(K12, K15) |
| MYST | TIP60 | H4(K5,K8, K12, K16), H3K14 | |
| MYST | HB01 | H4(K5, K8, K12) | |
| MYST | MOZ,MORF,MOF | H4 | |
| Class I | HDAC1-3,8 | H3, H4 | |
| Class IIA | HDAC4,5,7,9 | H3, H4 | |
| Deacetylases | Class IIB | HDAC6,10 | H3, H4 |
| (HDAC) | Class III (sirtuins) | SIRT1-7 | H3, H4, H4K16 |
| Class IV | HDAC11 | H3, H4 | |
| none | SIN3-HDAC1,2 | H3, H4 | |
| none | N-COR/SMRT-HDAC3 | H4 | |
| SET | MLL1-5 | H3K4 | |
| SET | SET1A, SET1B | H3K4 | |
| SET | G9A/GLP | H3K9 | |
| SET | SETDB1 | H3K9 | |
| Methyltransferases | SET | SUV39H1, SUV39H2 | H3K9 |
| (HMT/KMT) | SET | EZH2 (PRC2) | H3K27 |
| SET | NSD1 | H3K36 | |
| SET | SET2 | H3K46 | |
| SET | SUV420H1, SUV420H2 | H4K20 | |
| none | DOT1L | H3K79 | |
| LSD1 | BHC110 | H3K4 | |
| LSD1 | COREST-LSD1 | H3K4 | |
| Demethylases | JmjC | JHDM1A, JHDM1B | H3K36 |
| (HDM/KDM) | JmjC | JHDM2A, JHDM2B | H3K9 |
| JmjC | JMJD2A, JHDM3A | H3(K9, K36) | |
| JmjC | JMJD2B | H3K9 |
A wealth of data exists regarding the presence of histone tail modifications in different species, development stages and cell types – the so-called epigenome – but efforts for characterizing the effect of histone PTMs are currently limited by the difficulty of examining in vivo chromatin structure. Interestingly, the two main modifications discussed here – lysine acetylation and lysine methylation – seem to act on the chromatin architecture and state of activity through rather different mechanisms. In the case of acetylation, a direct effect on nucleosome-nucleosome interactions is at play, with a certain but subtle relationship with the associated loss of a positive charge (see Sec. III.2.3). In contrast, methylation preserves electric charges, while introducing significant steric hindrance and potentially hydrophobic interactions, and mainly act on chromatin indirectly by recruiting additional architectural proteins (see Sec. III.2.5). For this reasons, acetylation mechanisms are more easily studied by in vitro experiments, while methylation effects are more generally studied in the in vivo context in presence of their multiple partners. We will now sum up some of the main experimental results and theoretical interpretations concerning both these PTMs.
III.2.3 Histone tail acetylation: direct effects on chromatin accessibility
Experiments
Experimental studies of the role of histone tail acetylation in the architecture of nucleosomal arrays are conducted using reconstituted, in vitro chromatin. In this approach, nucleosomes are reconstituted by incorporating recombinant histones with tailored aminoacid sequences on tandem repeats of a DNA sequence with very high histone affinity (the so-called “601 sequence”). The sedimentation coefficient of such arrays is then measured as a proxy for their folding propensity, comparing the sedimentation coefficient of arrays with of without combinations of histone tail acetylation Shogren-Knaak et al. (2006); Wang and Hayes (2008); Liu et al. (2011); Allahverdi et al. (2011). In addition, small-angle X-ray scattering assays on folded nucleosome arrays give estimations of internucleosome interaction energies Bertin et al. (2007c); Howell et al. (2013). Taken together, these studies show that H4 tail acetylation decreases internucleosomal intra-array associations Hizume et al. (2010).
Acetylation of lysine 16 of histone H4 (H4K16ac) has the strongest effect in this regard, and may lead to massive disruption of dense chromatin fibers in vitro Shogren-Knaak et al. (2006). Structural effects of H4K16 acetylation on chromatin compaction are also confirmed by the observation of a weakening of chromatin packing in vivo Shahbazian and Grunstein (2007), and are in general associated with actively transcribed genes (e. g. , Taylor et al. (2013)).
Surprisingly enough, histone H3 acetylation, which also reduces the charge of the tails, does not seem to modify the folding propensity of nucleosome arrays Wang and Hayes (2008) pointing to a specific mechanism of H4K16 acetylation.
Models
Experimental studies are often combined with computational models to provide deeper insights on how the electrostatic nature of histone tail PTMs influence chromatin folding.
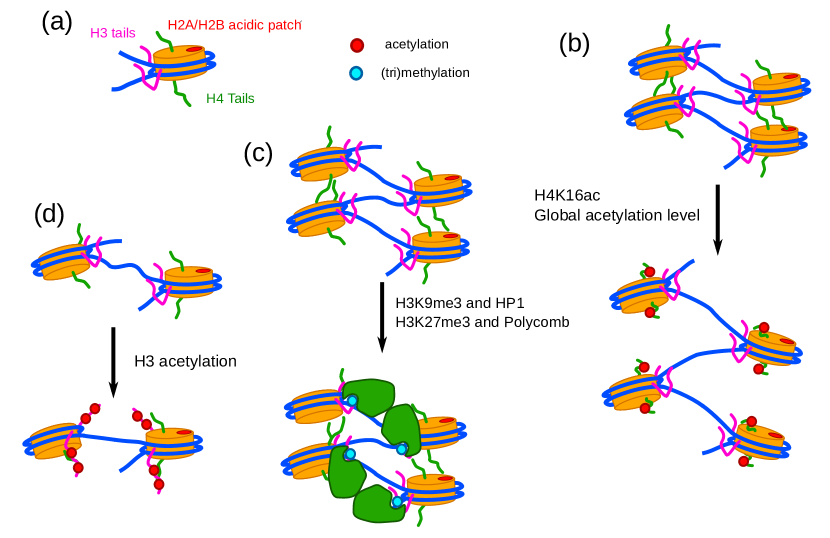
Potoyan & Papoian Potoyan and Papoian (2012) addressed the question of the decompaction induced by H4K16 acetylation, and carried out all-atom simulations in explicit solvent to compare the conformation of H4 tail with and without this modification. For the isolated histone tails, H4K16ac leads to slightly more compact and significantly more structured globular H4 tails. At this level, compaction is not surprising since the net charge reduction weakens self repulsion between the tail residues. When DNA is present, i.e. when the entire nucleosome is considered, tails have a similar behavior: acetylated tails are more compact, less fluctuating, and are more frequently bound to their own nucleosomal DNA. However the less charged acetylated tail interacts much more strongly () with DNA than the unmodified one (), in contrast to what is expected from electrostatic reasons. This counterintuitive effect is achieved thanks to an important tail reorganization that brings other lysines closer to DNA. While the overall electrostatic attraction is basically unchanged, the collapse of the tail is favored by hydrophobic interaction and entropic gain. In contrast, unmodified H4 tails are more extended and flexible. They showed a preferential interaction with linker DNA Angelov et al. (2001) and with an acidic patch exposed on the surface of next H2A/H2B dimers of neighboring nucleosomes Zhou et al. (2007) (see Figs. 2a and 6a). Hence, while modified H4 tails may contribute to the nucleosome-nucleosome attractive interaction by the so-called “tail bridging” effect Mühlbacher et al. (2006), the acetylation of lysine 16 might oppose this effect, leading to weakened nucleosome–nucleosome interactions Potoyan and Papoian (2012) (see Fig. 6b,c,d). Of note this is qualitatively consistent with experiments on the disordered C-terminal tail of the p53 protein where a significant increase of its site-specific DNA binding is observed both in vitro and in vivo when acetylated Luo et al. (2004).
Other computational models generally rely on coarse-grained approximations of the nucleosome core particle and linker DNA which integrate the mechanical dynamics of nucleosome as well as its distribution of charges. Arya & Schlick used their Discrete Surface Charge Optimization framework to provide estimations of the contribution of tails to electrostatic interaction energies, showing that H3 tails principally screen the negative charge of linker DNA, while H4 tails mediate internucleosomal interactions Arya and Schlick (2006, 2009), in agreement with previous experimental findings. However, these studies do not compare interaction energies with or without histone PTMs. Several other coarse-grained models have been used so far to specifically investigate histone tail acetylation Yang et al. (2009); Allahverdi et al. (2011); Liu et al. (2011), showing that the effect of PTMs also largely depend on the valency and the concentration of bulk counterions, consistent with sedimentation assays.
III.2.4 H4K16 deacetylation is a silencing mark in budding yeast
In budding yeast, and this is specific to budding yeast, silencing is not achieved by histone methylation. Instead heterochromatin is induced by silent information regulatory (SIR) complexes which are recruited by deacetylated nucleosomes. This mechanism is crucially relying on H4K16 Dayarian and Sengupta (2013) (see below Sec. IV.3.1 for the detailed mechanism).
III.2.5 Histone tail methylation: indirect effects on chromatin condensation
In animals, notably in drosophila and mammals, silencing is mainly achieved through histone tail methylation which, as mentioned above, does not directly induce chromatin fiber compaction (a notable exception was reported in North et al. (2014)) but leads to the recruitment of additional architectural proteins, typically heterochromatin proteins.
Importantly, such architectural proteins are included in the set of proteins that have been used to define the chromatin colors in drosophila Filion et al. (2010). Precisely, chromatin colors are specific combinations of epigenetic marks and associated proteins belonging to the following set: histone-modifying enzymes, proteins that bind specific histone modifications, general transcription machinery components, nucleosome remodelers, insulator proteins, heterochromatin proteins, structural components of chromatin, and a selection of DNA binding factors Filion et al. (2010). Histone tail methylation seems therefore to act as a (region specific) substrate to recruit (non specific) proteins. In turn, these proteins induce different chromatin-chromatin interactions in different regions, and eventually different chromatin folding leading in particular to different compaction degrees (see Sec. III.3.1).
There are various kinds of heterochromatin in animals (e.g. ‘black’, ‘blue’ and ‘green’ chromatin in drosophila; even more “colors” in mammals). We focus here on the physical mechanisms that drive the two main silencing processes in animals, namely the recruitment and spreading of HP1 (Heterochromatin Protein 1) by the H3K9me3 mark Hathaway et al. (2012); Azzaz et al. (2014) and the recruitment of the Polycomb architectural complex (PcG) by the H3K27me3 mark Tie et al. (2009). We moreover discuss the role of these architectural proteins in the physical process of heterochromatinization.
Unlike acetylation, results obtained in vitro using reconstituted chromatin arrays are not directly transferrable to in vivo contexts for at least two reasons: (i) lysine methylation has no direct physical effect (recall that, unlike lysine acetylation, lysine methylation does not change electric charges), instead, lysine methylation is recognized as a biochemical tag by dedicated chromatin proteins, either architectural Zentner and Henikoff (2013); Ong and Corces (2014); Gosalia et al. (2014); Mulligan et al. (2015) or remodeling proteins (Becker and Hörz (2002); (ii) there is considerable cross-talk among histone tail PTMs Li and Shogren-Knaak (2008); Kouzarides (2007); Bannister and Kouzarides (2011)) which can then form networks comparable to signaling pathways, eventually resulting in a structural effect. An example of such a pathway is given by Wilkins et al. (2014) in the context of budding yeast cell division where phosphorylation of Serine 10 of the H3 tail induces H4K16 deacetylation, which eventually leads to chromatin compaction.
HP1-mediated heterochromatin
The family of Heterochromatin Protein 1 (HP1) are fundamental components of heterochromatin. They are abundant at the centromeres and telomeres (which correspond roughly, as we have seen, to central and ending regions of the chromosomes, respectively) in nearly all eukaryotes.
They display high binding affinity for the H3K9me3 mark and are therefore specifically targeted to nucleosomes harboring this mark. However the spreading of HP1 along an H3K9me3 epigenetic domain is still a matter of debate. Thus in the latest special issue of JPCM Everaers and Schiessel (2015), devoted to the physics of chromatin, two contrasted models have been proposed: the group of Andrew Spakowitz Mulligan et al. (2015) claims that bridging interaction between HP1 dimers is critical for HP1 spreading, at odds with the group of Karsten Rippe Teif et al. (2015) who claims that the binding of one HP1 dimer can stabilize a stacked nucleosome conformation and facilitate the binding of a second dimer via an allosteric change of the nucleosome substrate, with no need for a direct interaction between neighboring HP1 dimers. It is to be noted that both groups could reproduce the in vitro binding curves of the yeast analog of HP1 (Swi6) on mono- and dinucleosomes as well as on arrays of nucleosomes. Moreover Spakowitz’s group claims that HP1 bridging interaction between different chromatin fibers explains the phase separation of heterochromatin and euchromatin Mulligan et al. (2015), whereas Rippe’s group evidenced a dependence of the binding stoechiometry on the NRL (nucleosome repeat length) due to allosteric cooperativity of binding for nucleosome arrays with long but not with short DNA linkers, pointing to a facilitated spreading of HP1 on long NRL substrates.
Polycomb-mediated heterochromatin
Polycomb are a family proteins that mediate transcriptional silencing Di Croce and Helin (2013); Simon and Kingston (2013). In drosophila, it was found that two distinct regulatory complexes (PRC1 and PRC2) are able to silence the Hox genes in a stable and inheritable way Paro et al. (1998); Beuchle et al. (2001). It provides a mechanism for “cellular memory” Ringrose and Paro (2004), that has been speculated to be alternative to DNA methylation Bird (2002).
The precise mechanism underlying the heritability of the repressed state of genes silenced by the Polycomb complexes is still debated. It is known that the repressive histone mark H3K27me3 (see Sec. III.2.5) is recruited by the PRC2 complex. In turn, H3K27me3 recruits PRC1, which then induces histone H2AK119 ubiquitination. However, recent studies showed that this relationship may also work in the opposite senseBlackledge et al. (2014); Cooper et al. (2014). It has also been suggested that in X chromosome inactivation (see Sec. V.3), histone ubiquitination, and Polycomb proteins are mechanistically related to propagate the silenced state de Napoles et al. (2004).
A physical modelling of the cross-talk between histone marks and the Polycomb complexes would be useful and is, to the best of our knowledge, still missing.
III.3 How epigenetic marks organize the chromosomes in the cell nucleus. General rules. Physical modeling of epigenome wide studies.
III.3.1 Epigenome wide studies
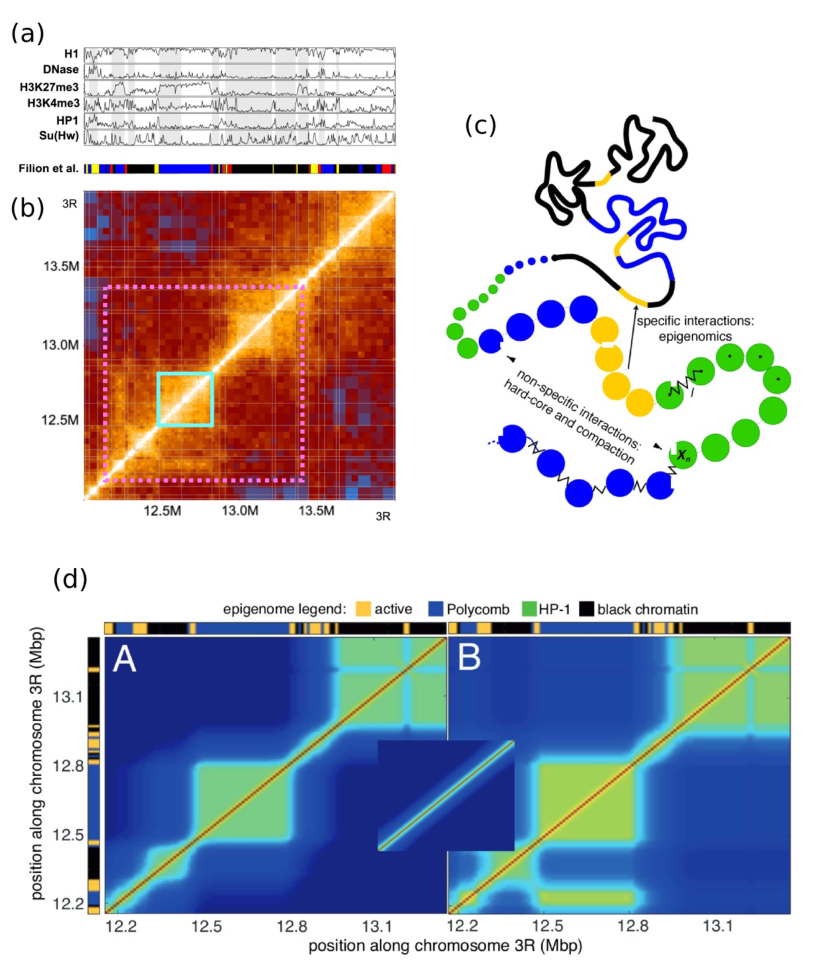
One of the current paradigms in the field is that the epigenetic landscape is driving the 3D genome folding and by extension the functional state of the cell. In order to tackle this issue at the genome scale level, epigenomic techniques based on Next Generation Sequencing (NGS) are increasingly used Rivera and Ren (2013). These techniques are commonly used to map accessibility, protein binding sites, and biochemical modification of histones or DNA along the linear genome (e.g. in drosophila Fig. 7a). A new technique, genome-wide Chromosomal Conformation Capture (Hi-C) has been developed in order to address the issue of genome 3D folding using NGS. This technique allows to the generation of a list of pair-wise contacts between distal parts of the genome in various organisms and cell types (e. g. in drosophila, Fig. 7b, Sexton et al. (2012)). A high contact probability is characterized by a bright pixel in the Hi-C contact map (see Fig. 7b, around the diagonal). The first results have confirmed the physical segregation of the genome into heterochromatin and euchromatin regions Lieberman-Aiden et al. (2009). An attractive model of chromosome folding has been proposed in this seminal paper, named “fractal globule”, which explains at the same time the existence of chromosome territories, the absence of knots in chromosomes, and the power-law decay (with exponent close to ) of the contact probability as a function of genomic distance Mirny (2011). This long-lived metastable state was introduced 20 years before on theoretical grounds Grosberg et al. (1988) for explaining the kinetics of collapse of homopolymers. At finer scales, Hi-C further led to the identification of domains along the genome in which contacts are numerous whereas very few contacts are established in between different domains. These regions are termed topologically associating domains, TADs Dixon et al. (2012); Nora et al. (2012). TADs can be seen as high intensity blocks along the diagonal of the chromosomal contact maps (Fig. 7d, cyan squares). It was then realized that chromosomes are actually block copolymers, each block corresponding to an epigenetic domain (compare Fig.7a and 7b). Combining Hi-C results with the linear epigenomic annotations of the genome (i.e. the biological information of the underlying sequences) is in principle a powerful method to comprehend the functional architecture of the genome.
Several physical models have been developed so far in order to understand the 3D folding properties of block copolymers. The main goal of these studies is to recover the chromosomal contact maps observed from the Hi-C data. Two main classes can be distinguished: simulations that explicitly compute the 3D chromosome conformations Barbieri et al. (2012); Benedetti et al. (2014) and implicit models in which average contact maps are directly computed in a self-consistent Gaussian approximation Jost et al. (2014). The different explicit models can account for the formation of TADs, either by preferential binding of co-factors along specific regions of the genome Barbieri et al. (2012) or by topological constraints Benedetti et al. (2014) but so far, the direct comparison with experimental results has only been done using the implicit approach Jost et al. (2014). In this study, the authors use the previously described colors of chromatin drosophila Filion et al. (2010), which, as discussed previously, assign to each subregion of the genome an epigenetic “color”, based on the specific protein binding and histone marks found in this region (Fig. 7a). They then assign specific pair-potentials (see also Saberi et al. (2015)) between beads of the same or different colors (Fig. 7c) and compute the corresponding contact maps using a statistical approach previously described Timoshenko et al. (1998). With well-chosen parameters, they were able to retrieve the contacts found experimentally (Fig. 7d). An important outcome of their study is that a fixed epigenetic landscape is compatible with several 3D conformations of the chain, a phenomenon which they call multistable folding (see below “the physics of TADs”). Note that these copolymer models, all at thermal equilibrium, deviate drastically from the fractal globule hypothesis.
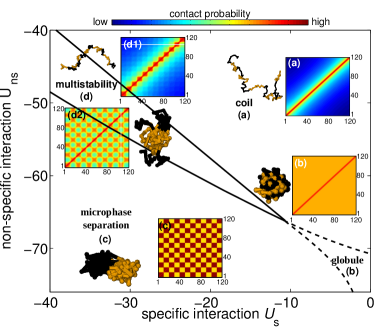
III.3.2 The physics of TADs: finite-size effects in the coil-globule transition of copolymers
Jost et al. Jost et al. (2014) show a phase diagram of a toy model copolymer as a function of the intensity of (i) block-specific and (ii) non-specific interactions, that we show in Fig. 8. On top of the coil-globule transition of the whole copolymer, there is also coil-globule transition restricted to each separate block. Importantly, both coil and globule phases coexist in a region of the phase diagram, the size of which depends on the (average) size of the blocks. This is consistent with the finite-size scaling analysis of the coil-globule transition which has been proposed in Caré et al. (2014) (see also arXiv: arXiv:cond-mat/0004273).
Let us show that both transitions, namely the coil-globule transition inside a given block and the segregation of different blocks of the same color into separated microphases, overlap in the phase diagram because of finite-size effects.
We first remember that a polymer of monomers, with monomer-monomer attractive interactions, undergoes a coil-globule transition around the critical temperature where is a dimensionless prefactor of order unity. More precisely, there is an equilibrium between coil and globule conformations over a temperature range between and where a is a dimensionless prefactor of order unity. At both coil and globule conformations are in equal proportions. Therefore, at a given temperature , longer polymers are more globular than small polymers of the same kind.
We then consider a copolymer ABAB…made of small blocks A and long blocks B. For example, the A blocks could be HP1-like heterochromatin, and the B blocks could be Polycomb-like heterochromatin. We consider monomer-monomer attractive interactions represented by an energy of interaction between monomers with epigenetic states and the following kind: , where is a non-specific term (does not depend on and ), is the Kronecker delta, and is a specific interaction term. According to the preceding results on the coil-globule transition of finite-size polymers, long blocks B go into globules when small blocks A are still coils. When lowering the temperature (or equivalently increasing the interactions), blocks B start to transiently bind together into a macroglobule: this is now the coil-globule transition of the whole copolymer which is equivalent to a chain of B globules separated by A linkers; and while this chain collapses (folds) the A linkers start to go into globules, so that both transitions overlap.
Importantly the macroglobule fluctuates between coil and globule conformations (as well as any B globule) so that it transiently dissociates thus permitting the small A blocks, even in remote locations on the genome, to come transiently into contact (see Fig. 7). This corresponds to the “multistate folding” region calculated by Jost et al. and depicted on Fig. 8. Note that the width of this multistate folding region varies as where is the typical size of the small(est) blocks.
Below the lower critical temperature all the B globules are permanently collapsed in a macroglobule with the A blocks located at the macroglobule surface (because of interfacial tension). Crucially the A blocks are still coils, hence in the euchromatin phase, so that their genomic sequence is expressed, whereas the B blocks are globular and as such in the heterochromatin phase, hence their underlying sequence is repressed Caré et al. (2015).
IV Physical mechanisms involved in the initiation, spreading, maintenance and heritability of epigenetic marks
Stem cells are capable of differentiating to the desired fate depending on the tissue. Dramatic changes in gene expression occur during development. These changes are then stabilized and become heritable. Epigenetic modifications take part in both initiating, stabilizing and propagating the patterns of gene expression. Gene regulation by epigenetic modifications is indeed stably propagated through cell divisions (and, in some cases, across generations). At each cell division, the whole DNA is replicated. Chromosomes then consist of two sister chromatids which both have identical genetic information, joined together at their centromere. Then, during mitosis, the two chromatids are separated and segregated into the two nuclei of the daughter cells.
Eukaryotic replication involves both DNA synthesis and chromatin assembly. As the two double helices are synthesized from the two single strands of the mother-cell DNA, nucleosomes on the mother-cell DNA strand should also be distributed to both daughter double helices, and completed by de novo nucleosome assembly. In order to ensure the transmission of epigenetic marks to daughter cells, mother-cell nucleosomes should be shared by both newly formed chromosomes, even if the detailed mechanisms of this distribution are still debated MacAlpine and Almouzni (2013).
While it is clear that histone modifications are involved in gene silencing, hence gene regulation, the questions of how epigenetic marking is initiated, how it may spread over specific chromosome regions (and not beyond), and how it can be stably maintained along the cell cycle and through the cell division are still under investigation. In this section, we will review the main modeling efforts that have been made in order to address these questions.
IV.1 Mathematical modelling
Many recent theoretical works addressed the question of how epigenetic marks are initiated, spread, and maintained. The main objective of these models is to reproduce a few essential features observed in vivo: (a) the multistability of the epigenetic marks; (b) their spatial patterns and (c) their heritability.
By multistability, it is generally meant that the epigenetic marks act as switches between different functional states. In the simplest case, different patterns of epigenetic marks allow to switch between two states that have a well-defined functional characterization (bistability). Such functional states are then inherited by the daughter cells through mitosis, which is what we call heritability. As observed in genome-wide studies, the epigenetic patterns correspond to distinct epigenomic domains that are separated by boundaries (see Sec. III.3).
We consider a system of nucleosomes that can be in different states. In the simplest case, and one refers to “modified” or “unmodified” states, which can be related to active or inactive genes.
The state of the system is described by the variables , where is the state of nucleosome . If we define as the number of nucleosomes in the state , then one can write the conservation of the number of nucleosomes as
| (1) |
Many theoretical works use the silenced mating-type locus of the fission yeast Schizosaccharomyces pombe (reviewed in Grewal and Elgin (2002)) as a model system. In this system, the region containing the two mating-type regions is normally “silenced”, i.e. not expressed. The expression of the mating-type genes may become bistable in mutants, flipping between a silenced state and an active state Grewal and Klar (1996); Thon and Friis (1997). Each state is stable and heritable; transition between them occurs apparently stochastically. The S. pombe HMT, HDAC and other proteins are necessary for silencing, and all may bound H3K9me directly or indirectly.
In the following, we review the models of this behavior proposed so far.
IV.2 Zero-dimensional models
In zero-dimensional models, neither the spatial organization of the nucleosomes, nor the notion of distance are introduced. In general, the model concerns rate equations on how the variables vary as a function of time, and the objective of the models is to show how bistable or multistable states can appear. In this class of models, the initiation of the epigenetic mark is implicitly defined as the initial state of the dynamical system, and the spreading is described as the time evolution of the initial state. Mitosis can be modeled as an instantaneous process in which the concentrations of all species (modified and unmodified nucleosomes) are diluted and the system restarts. The dilution is due to sharing of mother-cell nucleosomes between both daugther cells. Nucleosomes are not necessarily shared into equal parts between daughter chromosomes, but this may be assumed without loss of generality as is done for convenience in most models.
We can write a general expression for the time evolution of the variables :
| (2) |
Here, is the rate of transition of nucleosomes from the state to the state , while is the rate of transition from state to (obviously, ). In general, these coefficients are not constant, but depend on the other dynamical variables. The “noise” may be included to describe the effect of stochastic processes involved in the system.
The simplest possible model of this kind was proposed by Micheelsen et al. (2010). The authors consider the case of , that is, they consider only a modified (M) or unmodified (U) state. Using equation (1), the system may be described by only one variable , the number of modified nucleosomes. The transition rates are given by
| (3) |
This model supposes that the creation of a modified state involves a cooperative transition (as evidenced by the quadratic terms in equation (3)) or a spontaneous conversion to the unmodified state (which is described by the term). Despite its simplicity, the model can account for the emergence of bistability. The parameter (feedback to noise ratio) governs the behavior of the system. For , three fixed points emerge in the system: and , which are stable, and , which is unstable. The parameter is possibly under active control by the cell, which then can regulate its function (notably by HDAC inhibitors Dayarian and Sengupta (2013)). Heritability can be partially accounted for by this model, since one can speculate that cell division brings the system close to the unstable point, which then returns to its stable attractor.
David-Rus et al. thoroughly investigated a more general model that still has David-Rus et al. (2009). Their rates read:
| (4) |
The first interesting result they obtained is that this model can reproduce bistability only for . The simple quadratic case is a generalisation of the model of Micheelsen et al. Micheelsen et al. (2010), where the cooperative transition probability (rate) from U to M is independent from that to M to U. If the basal rates and are small, one again obtains three fixed points, with the intermediate unstable point being . Assuming now that cell divisions exactly halves the concentration of modified nucleosomes for each daugher cell, if , than the system will always fall in the basin of attraction of after a cell division, hence the only stable point is the unmodified state . Conversely, for (hence ), the system will converge to the modified state fixed point for initial conditions larger than , and bistability becomes effective.
This scenario is however modified by the presence of noise in the system. In fact, if the probability of transition from U to M is larger than the probability of transition from M to U (that is, ), then the fixed point is no longer stable. Noise drives the system out of the state, and brings it to the fully modified state. This consideration highlights the importance of asymmetric recruitment rates.
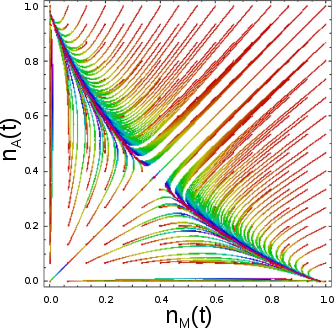
The same authors also considered the case of , which was already considered by Dodd et al. Dodd et al. (2007) in a very similar form. They consider the case of an “antimodified” state (A), that is possibly an acetylated state (active chromatin mark) that is opposed to the M state which is possibly a methylated (repressive) state (see Fig. 10a). A hypothesis is that only the and are allowed, but the transition is not (i. e. ). They write the following transition rates:
| (5) |
The study of the system in the case where the basal rates , , and vanish already shows the existence of four fixed points: two stable fixed points, and , an unstable saddle point and an unstable fixed point . The two latter points are aligned along the line and create a barrier between the two basins of attraction David-Rus et al. (2009). The phase flow diagram of such system is depicted in Fig. 9.
The last model of this class that we consider is the one proposed by Jost Jost (2014). The author considers a special case of the three-state model outlined above:
| (6) |
that is, it is the same model with and . Interestingly, this particular choice allows to map the system to the zero-dimensional Ising model, with, e.g., the correspondence A, U, M. Within this analogy, recruitment corresponds to coupling between spins and random transitions are associated with thermal fluctuations. A new observable, equivalent to the magnetizaton in the Ising model, is introduced here: .
Some known results can thus be recalled for the symmetric recruitment case . Similarly to what previously discussed, three fixed points exist. The first one, , is stable for weak recruitment, i.e. for . Above this critical value of , becomes unstable and bistability settles down with the appearence of two stable fixed points, .
The non-local character of the nucleosome-nucleosome interaction, which is the main hypothesis of the zero-order models, has been further justified by a recent work Zhang et al. (2014). The authors proposed a two-layer Potts model in which in one layer they describe the nucleosomes, and in the other they include explicitly the enzymes that modify the nucleosomes. The interaction between the nucleosomes is the effectively mediated by the modifying enzymes. Interestingly, by integrating out the effect of the modifiers, it is possible to prove the exact equivalence to the model proposed by Dodd et al. Dodd et al. (2007).
To conclude this section, we stress the main results of this comparative analysis. Bistability is obtained by this class of models in two ways: in two-state models only when including nonlinear rates, and in three-state models even having linear rates. The reason for this is that in three-state models the transitions from a modified to an antimodified state can proceed only in a two-step process, effectively requiring cooperativity, hence producing bistable states Dodd et al. (2007).
IV.3 Higher-dimensional models
An inherent limit of the models discussed above is that they cannot reproduce spatial patterning of the epigenetic marks. Hence, limitation of the mark spreading should be included by limiting the extent of the concerned domain, i.e. the total number of nucleosomes. If this assumption may be relevant e.g. for the mating-type loci in yeast, it probably fails when multicellular organisms are considered. It is known, for example, that nearly all noncentromeric H3K9me3 domains in mouse embryonic stem cells have a peaked shape, with continuously decaying mark densities on both sides Hathaway et al. (2012).
IV.3.1 One-dimensional models.
Even when mark spreading is surrounded by boundaries, the question arises how to model their presence and effects. Dodd and Sneppen realize in their 2011 work Dodd and Sneppen (2011) that positive feedback can lead to spreading of the modifications to genome regions other than the target. They refer in particular to the silent mating-type loci in budding yeast Saccharomyces cerevisiae. In this organism, the MAT (mating type) gene has two variants, MATa and MAT, and switching of the mating type occurs when the expressed MAT variant changes from one type to the other. This mechanism is possible because each of the two variants comes also with a silenced allele: the HML (hidden MAT left) carries a silenced MAT allele, and HMR (hidden MAT right) bears a silenced MATa allele. The HML and HMR are able to spontaneously flip between high and low expression states Xu et al. (2006), thereby allowing for switching of mating type. These domains are stable over up to 80 cell generations, and are surrounded by boundary elements that prevent silencing to spread out of the domains. These “barriers” are specific sequences, and may simply be target sites for certain DNA-binding proteins, strong gene promoters, or nucleosome-excluding structures. Dodd an Sneppen therefore consider a model in which all nucleosomes are explicitly treated, and the long-distance interaction between nucleosomes is modeled in a “local-local”, “local-global”, or “global-global” scheme (see Fig. 10c). To limit the long-range interaction between DNA sites one can introduce a distance dependent cooperativity, i.e. by making the reaction rate dependent on the nucleosome distance. A power law dependence, typical of the three-dimensional probability of contact, can be assumed.
Then, the confinement of silenced regions can be obtained by introducing local barriers, modeled as single nucleosomes fixed in the active (A) state. Due to the local character of the modification step, a single silencing-resistant nucleosome (e.g. H3K4me3 Venkatasubrahmanyam et al. (2007)) or a nucleosome-depleted region (notably in gene promoters Bi et al. (2004)) is enough to stop the silencing spreading, provided that the flanking regions are entirely in the active state. However, an occasional inactivation of the barrier make the silencing spread out. This effect can be limited by introducing regularly spaced weak barriers, modeled as anti-silencers (enhancers) of the U A reaction, or by implementing in the model a Michaelis-Menten saturation effect when the number of U state nucleosomes increases. The combination of both effects results in robust prevention of silencing spreading.
Focusing instead on mammal silenced regions, Hathaway et al. (2012) were able to reproduce the sharp peaks observed in the experimental modification patterns by including a “source” term in their model. This is a model in which the initiation and spreading are explicitly separated, and in turns this allows to reproduce spatial patterning. They write rates as
| (7) |
This description means that at site 0 there is an active modification source with rate , which then spreads to the neighboring nucleosomes with rate . Fitting to experimental results leads to and rates both of the order of 0.1–0.2 h-1 (in agreement with different experimental estimates of . However, as pointed out by the authors, this model fails to predict the bistable nature of the system, thus not allowing to describe this crucial feature.
In Ref. Hodges and Crabtree (2012) a more detailed study of the model is presented. The source term ensures that the resulting mark distribution are peaked at the nucleation site, as experimentally observed, provided is large enough (), with increased amplitude and formation rate for increasing .
Still referring to the mating-type loci in budding yeast, Dayarian and Sengupta (2013) consider a four-state model with site-dependent rate equations. The fourth state they consider is a double-acetlyated state, which would correspond to acetylation of two H4K16 sites. Importantly, in this model, the modified state M is supposed to be a state where nucleosomes are bound to silencing (Sir) proteins, and depends therefore on their availability (concentration). In its most general form, this is a one-dimensional model that explicitly describes cooperative transitions that involve any nucleosome pair. However, it can be simplified into a zero-dimensional model when considering uniform solutions, which again show bistability and a characteristic bifurcation diagram. Moreover, such concentration-dependent model allows for additional interesting effects, involving a fine balance between the silencing of mating-type loci, which have a definite extent, and of the telomeres, whose extent may vary depending on the protein availability Dayarian and Sengupta (2013). Interestingly, indeed, this model also allow the existence of a silenced and an active domains in stable coexistence, i.e. with an immobile boundary domain, whose position depends on the balance between environmental self-adjusting parameters as the concentration of active proteins, a mechanism that these authors explored extensively Sedighi and Sengupta (2007); Mukhopadhyay and Sengupta (2013); Dayarian and Sengupta (2013).
IV.3.2 Three-dimensional models.
Erdel et al. Erdel et al. (2013) addressed some more specific questions about the establishing of epigenetic domains, as how are the chromatin modifying enzymes targeted or excluded from given chromatin regions, and how exactly the modification can propagate from one nucleosome to another, how is this state reestablished or maintained during replication. The proposed model focuses on the permanent binding of enzymes to a scaffold, either on chromatin itself or on the nuclear membrane, this leading to the definition of a limited chromatin region allowed to interact with the enzyme by short-range diffusion. The spatial distribution of the enzyme hence may result in a spatially limited enzymatic activity, and results in the definition of epigenetic domains. This first attempt to take into account the chromatin architecture in a three-dimensional model is noteworthy, despite the difficulty in estimating many of the geometrical and physical parameters involved in the model, as the linear base-pair density along the chromatin fiber, the fiber stiffness, or the nucleosome local density. Moreover, the question of how the set up of the correct architecture in the initial enzyme binding and in defining the functional chromatin domains remains open.
It also has been recently proposed that pericentromeric heterochromatin spreads its silenced state with a “nucleation and looping” mechanism Müller-Ott et al. (2014). Chromatin-bound SUV39H1/2 complexes would act as nucleation sites and propagate a spatially confined heterochromatin domain with elevated H3K9me3 modifications via chromatin loops. It is therefore relevant to include three-dimensional structure in the theoretical modeling of the spreading of epigenetic marks.
IV.4 Biological relevance of the models
In this section we intend to examine the biological relevance of a few key points that emerged in the discussion of models of initiation and spreading of epigenetic modifications.

IV.4.1 Waddington’s epigenetic landscape revisited.
First, let us return to the discussion on the Waddington landscape that we started in the Introduction. The classical image in the original Waddington representation Waddington (1957) of a marble rolling down a hill does rather suggest a fixed landscape, leading to erroneous interpretation when one goes beyond the metaphorical level (see Fig. 1).
In the simplest model we discussed, the one by Micheelsen et al. Micheelsen et al. (2010), the authors show that the model can be reformulated by a Fokker-Planck equation for the 1D diffusion of a particle in an effective potential (see Fig. 10b). The latter accounts at a time for drift (external forces) and noise events (with a term of the type , with the diffusion coefficient and the mobility). The Waddington idea of an epigenetic landscape is translated in Micheelsen et al. (2010) in more modern terms, by defining a physically consistent energy profile. Note however than the mechanism invoked here is not an evolution along the profile of Fig. 10b toward the minimum energy states, since different values of the parameter correspond to different system parameters, hence different external constraints. In other words, the equivalent of an epigenetic landscape corresponds here to a given section of the two dimensional potential surface of Fig. 10b. This allows in turn to suppose that external constraints may be included in the parameter , which may vary as a function of metabolism (level of activity) or drug delivering of “writers” or “erasers” (see Sec. III.2), notably HDAC inhibitors Dayarian and Sengupta (2013), thus typically making the system switch from bistable to monostable conditions. As discussed by Jost Jost (2014), this may also represent a strategy to gain in system sensitivity hence plasticity during development. Note that the switching mechanism between bistable and monostable conditions can be interpreted as the result of an active process bringing the system out of bistability and favoring its switching to a different state.
We then stress that it is important to consider the asymmetry of the modification rates. Taking the notation of Ref. Jost (2014) (equations (6)), we notice that if recruitment of enzymes by modified or anti-modified marks are different, the stability diagram and the boundaries between the mono- and bistable regions can be traced as a function of the two parameters and . Bistability is observed only for strong recruitment () and small asymmetry.
The epigenetic landscape may also be viewed as a complex, multi-dimensional dynamical system in which different cell identities correspond to different dynamical attractors of the system. In one approach, such landscape is modelled to be shaped by gene regulatory networks. In a recent study, it has been proposed that stem cell differentiation may be viewed as the process of transition between steady-state attractors of genes that induce or repress cell pluripotency Zhang and Wolynes (2014). Also, it has been suggested that the cellular identities are characterized by a mixture of several states, and external signals may drive the transition from one cell state to another one. By analyzing existing data sets, Lang et al. (2014) have been able to provide direct evidence for this, demonstrating that epigenetic landscapes are a very powerful tool to understand cellular dynamics.
IV.4.2 Hysteresis
For even stronger recruitment, a typical hysteretic behavior appears that may have important biological consequences. One can expect indeed that, while for differentiated, stable cells recruitment parameters are almost symmetric, modifications of the environment might actively induce asymmetric recruitment. The increase of one recruitment parameter can thus bring the system along the metastable branch, then make it abruptly switch to the alternative state, which will then remain stable even when the recruitment parameters comes back to their initial values, thanks to the hysteretic shape of the bifurcation curve. In Fig. 10d, starting for instance from the low state and symmetric recruitment, one can increase and switch to the upper, high branch, then come back to without switching back (see also Fig. 10e-h).
Close to , the system becomes ultra-sensitive to perturbations, and highly unstable. This regime may be associated to diseases. A pathological increase in the frequency of replication, for instance, may result in an increase of the random transition rate , which in turn may bring the system close to the critical point and induce epigenetic instability and misregulation.
However, the existence of a critical region may also represent an advantage. During development, the ability to switch between two coherent states when applying a weak asymmetric signal (the developmental signal) may facilitate developmental transitions. Since the random transition rate may be increased by reducing the cell cycle, the system can be brought closer to the critical region and the switch induced by the application of a weak asymmetric signal during a finite period of time Jost (2014).
IV.5 Example: plant vernalization
The 3-state model proposed by Dodd et al. Dodd et al. (2007) has been successfully adapted to the description on vernalization, the mechanism allowing plants to flower after a prolonged cold period.
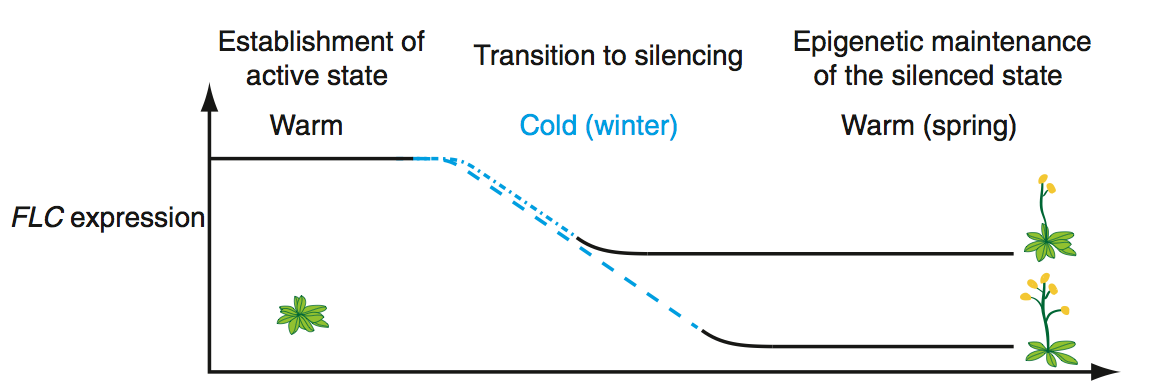
Plants have the ability to measure the duration of a cold season and to remember this prior cold exposure in the spring. In Arabidopsis thaliana, an annual plant, a prolonged cold exposure progressively triggers the H3K27me3-mediated epigenetic silencing of Flowering Locus C (FLC), a locus encoding for proteins that in turn act as flowering repressors. The accumulation of histone epigenetic marks in the FLC locus keeps increasing during the cold. This slow dynamics of vernalization, taking place over weeks in the cold, generate a level of stable silencing of FLC in the subsequent warm that depends quantitatively on the length of the prior cold. Then, once the FLC is switched off, the silencing persists at the return of the warm season, and is mitotically stable through the rest of the development (often for many months) (see Fig. 11) Song et al. (2013b). This latter feature is characteristic of annual plants, while in FLC perennial plants is repressed only transiently.
Satake and Iwasa Satake and Iwasa (2012) show that this behavior can be accounted for by means of the Dodd 3-state model Dodd et al. (2007), provided that an explicit dependence on temperature of the model parameters in included. Explicitly, the transition rates are written in this case as
| (8) | ||||
| (9) | ||||
| (10) | ||||
| (11) |
where and account for the temperature tuning and takes different values in warm conditions before vernalization, in cold conditions during vernalization, and in warm conditions after vernalization. Transition rates are in fact under the control of a series of proteins (and in particular Vernalization Insensitive 3, VIN3) whose expression is temperature dependent. Authors prove that a strong feedback, hence bistability, is necessary to reproduce the experimental observations. Interestingly, when the system evolution is simulated, the M A transition is observed at a random time during the cold, for a given system containing nucleosomes (i.e. a given cell). Different cells switch therefore to the repressed state after different delays after the change from warm to cold. However, the average over a cell population leads to a typical behavior that can be reproduced, if the cell population is large enough Satake and Iwasa (2012). The duration of winter memory is also tuned by model parameters, and in particular by those accounting for to call division rate and rapidity of deposition of epigenetic marks after vernalization. Changes in these parameters may lead to a much short memory extent (from more than one year to a few days), this potentially explaining the different behavior observed in annuals and perennials plants.
While the previous work addressed the question of bistability behavior in vernalization, the question of the establishment of epigenetic marks induced by cold is discussed by Angel at al. Angel et al. (2011), both theoretically and by experiments in Arabidopsis thaliana. These authors focus on the fact that, when subjected to cold, repression (H3K27me3, M state) only concerns a small (1 kb) nucleation region inside the FLC (8 kb), close to the first exon (coding region) after the promoter. While during the cold only the nucleation region is marked, after warm restoring the profile changed rather little in the nucleation region but rose quantitatively across the rest of the FLC locus according to the length of the cold period. They ask whether the small size of the nucleation region would be sufficient to cause a quantitative switch in the epigenetic state of the whole FLC locus after return to the warm. Experimental results are shown to be compatible with a 3-state zero-dimensional model, provided that two supplementary ingredients are included: (i) a site-specific nucleation of the silencing modification during cold, described as an increased probability to switch to the M state for a sub-ensemble of the nucleosomes, and (ii) a permanent bias in the histone dynamics towards the M modification on return to the warm. Within these assumptions simulated population-averaged levels of the M modification are found to be approximately stable up to 30 days after the cold, with a modification intensity which depend on the duration of cold, in good agreement with experiments.
Together, these two studies show that relative simple models displaying a strong bistability can be usefully employed to model epigenetic mechanisms involved in real systems as, in the case discussed here, in plants, even if real system typically includes a few additional features needed to specifically respond to the particular functional task they are designed for.
V Toward a more complex scenario: DNA methylation, role of RNAs, supercoiling in epigenetics
Up to now we have focused on histone PTMs and presented them as a crucial issue in the transmission of epigenetic information. However, the global picture is more complex. Among the additional epigenetic mechanisms, some are known since a long time, as DNA methylation (see Sec. V.1), while others have been evidenced quite recently, as chromosome coating with (long) non coding RNAs as in X inactivation (see Sec. V.3), messenger (i.e. protein-coding) RNA silencing by interaction with micro RNAs (see Sec. V.4), or the coupling between epigenetics and supercoiling (see Sec. V.5). An exhaustive description of the overall picture would represent a titanic task, well beyond the aim of this introductory review. Therefore we focus here on the main physical aspects of these biologically relevant mechanisms, drawing on a few concrete examples.
V.1 DNA methylation
Historically, DNA methylation has been the first epigenetic mark to be recognized as a “stable, inheritable chemical modification that alters gene expression and does not modify the sequence” (see Sec. I). In fact, in early days of research on DNA methylation, it was found that methylation states are propagated through mitosis Wigler et al. (1981).
DNA methylation is the substitution of a methyl () group to the carbon atom in position 5 at the cytosine base (5mC). Importantly, DNA methylation is coupled to metabolism through SAM (see Fig. 12a).
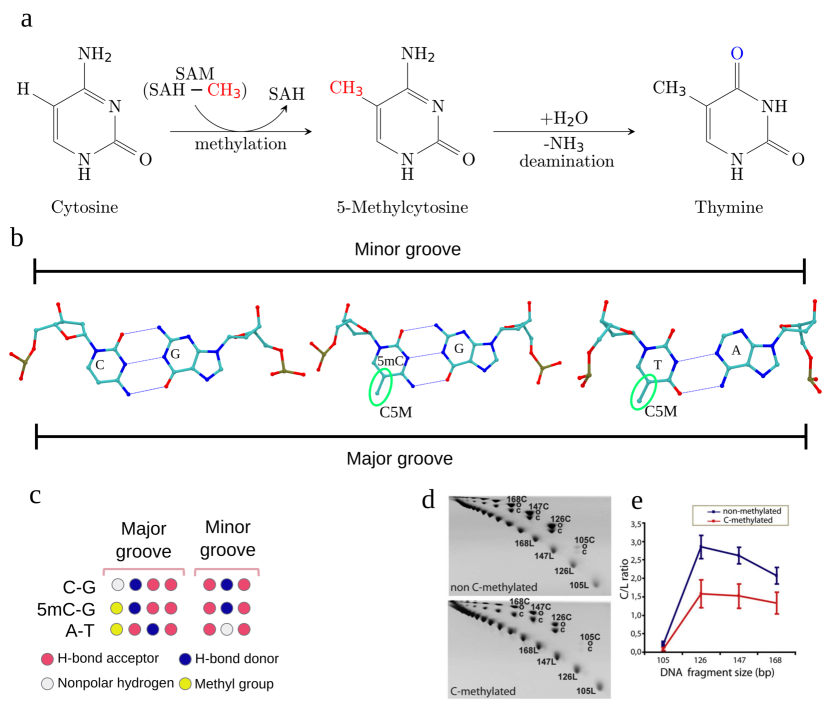
The prevalence of DNA methylation in the genome changes significantly among different organisms: it is very high in vertebrates (where one refers to a “global” methylation), very low in Drosophila, and absent in the nematode worm C. Elegans. In somatic cells, cytosine methylation occurs predominantly at CpG dinucleotides, although it has been detected in any sequence context both in plants Cokus et al. (2008) and humans Lister et al. (2009), where 70–80% of CpG dinucleotides are methylated.
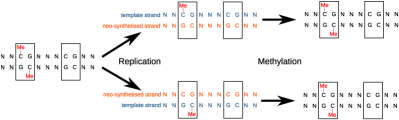
The patterns of DNA methylation in the genome are established in early development, and then faithfully propagated throughout successive cell divisions. Crucially, tissue-specific genes are kept unmethylated, whereas the others are heavily methylated. These processes are catalyzed by DNA methyltransferases (DNMTs). It is generally thought that the two methyltransferases DNMT3A and DNMT3B are responsible for establishing the methylation pattern during development (de novo methylation), and DNMT1 propagates the methylation pattern to daughter cells (maintenance methylation) Bird (2002), which we illustrate in Fig. 13. The precise mechanism behind the establishment of the initial methylation pattern during development is largely unknown. It has been proposed Khraiwesh et al. (2010) that initiation of epigenetic silencing by DNA methylation depends on the ratio of the miRNAs and their target messenger RNAs, in a so-called “RNA-directed DNA methylation”.
5-methylcytosine can convert to thymine by spontaneous de-amination (see Fig. 12a), leading to a common DNA mutation. The hydrophobic methyl group in the DNA major groove gives a structural similarity between thymine and 5mC (see Fig. 12b). It is important to notice that this allows for the possibility of a “base readout” in the major groove, as proposed by some authors Machado et al. (2015). We shall discuss the implications of this later.
From the biological point of view, the role of DNA methylation is not clearly understood. Early studies on the role of DNA methylation highlighted its importance in gene silencing McGhee and Ginder (1979); Razin and Cedar (1991), in X-chromosome inactivation Mohandas et al. (1981); Graves (1982); Venolia et al. (1982) and gene imprinting Li et al. (1993); Razin and Cedar (1994). It was later established that when CpG-island promoters are methylated, then the gene will be irreversibly silenced Jones (2012). With the advent of technologies that enable for genome-wide screening of the methylation state of DNA, it has become clear that gene silencing is not the only role of DNA methylation Lister et al. (2009); Jones (2012), and its biological role is highly dependent on the sequence context in which it may be found. For example, DNA methylation has been associated with active gene bodies Chodavarapu et al. (2010) quite the opposite of its established role of gene silencing. Detailed analyses of the differences in the methylation patterns in different cell types revealed an even richer phenomenology Lister et al. (2009); Spruijt and Vermeulen (2014); Marchal and Miotto (2015), suggesting that the role of DNA methylation is not at all limited to repression of transcription.
DNA methylation has also been implicated in a variety of human diseases (see Machado et al. (2015) for an extensive review), in particular in cancer, and has therefore received enormous attention. A challenging issue is the relation of DNA methylation to cancer progression and prediction of pre-cancerous cell state Feinberg and Tycko (2004); Timp and Feinberg (2013).
Can the change in physical properties of DNA upon cytosine methylation help understanding the variety of its roles? To address this question, we shall discuss several aspects of the physics involved in cytosine methylation. In the following, we will review the available knowledge on the following aspects: (a) the change in the elastic/mechanical properties of DNA upon cytosine methylation; (b) the role of the hydrophobic methyl group in determining DNA-protein interactions; (c) the relationship between DNA methylation and chromatin structure in vivo.
V.1.1 Mechanical properties of DNA change upon methylation
It has been recently established that the mechanical properties of DNA change when cytosine is methylated. The extent of this change is still unclear though.
A combination of all-atom molecular dynamics simulations and cyclization experiments revealed that a single cytosine methylation at a CpG dinucleotide step has a significant impact on the mechanical properties of DNA Pérez et al. (2012). Cyclization experiments allowed to prove that oligomers stiffen significantly upon methylation (see Fig. 12d-e). Moreover, the value of the base pair roll was found to increase, whereas the twist and the width of the minor groove decreased. This should lead to a bending of the base pair towards the DNA major groove, and a stiffening of the sequence. However, when a poly-dinucleotide of type d(CpG)n was methylated, no significant difference was found compared to its unmethylated counterpart. This is due to the fact that the GpC dinucleotide has a compensating effect on the change of mechanical properties of the CpG step.
The stiffening of DNA upon methylation was also predicted by another theoretical study that employed van der Waals density functional theory Yusufaly et al. (2013). There, it was shown that “Methylation of CG-rich stretches of DNA enhances the formation of the A-DNA polymorph, a helical form that is more resistant to bending deformations than B-DNA, and which also bends DNA in the opposite sense. Consequently, interactions with the histones are inhibited, and nucleosome formation is suppressed.” Moreover, by combining single-molecule cyclization experiments with all-atom molecular dynamics simulations, Ngo et al. (2016) showed that 5mC increases the DNA local rigidity, and also reached the conclusion that this destabilizes nucleosomes.
In mixed sequence DNA, no significant effect of DNA methylation was observed by cyclization of 158–180 bp fragments Hodges-Garcia and Hagerman (1995). However, when combining detailed Monte Carlo simulations with cyclization experiments of an EcoRI restriction site, Nathan and Crothers Nathan and Crothers (2002) found that methylated sequences change the flexibility and the twist rate of DNA. The emerging picture is that cytosine methylation changes local structural parameters of base pair sequences, leaving however unperturbed the global elastic and mechanical properties of DNA.
Another consequence of cytosine methylation is altered resistance to strand separation Severin et al. (2011). By combining single molecule force experiments with all-atom molecular dynamics simulations, the authors show that strand separation is strongly affected by cytosine methylation. It inhibits or facilitates strand separation, depending on the sequence context. Again, the sequence context plays an essential role in determining the direction and extent of the impact of DNA methylation.
V.1.2 Impact of cytosine methylation on DNA-protein interactions
The addition of a methyl group in the major groove of cytosine bases alters the hydrophobicity of DNA at the base pair step. In crystallographic studies, it was found that a methylated A-form DNA oligomer Mayer-Jung et al. (1998) is well hydrated, thereby allowing for the possibility of specific recognition of methylated DNA sequences, through the interaction with the tightly bound water at the methyl group.
Three classes of proteins that specifically bind to methylated DNA are known: MBD (methyl binding domain) proteins, SRA (SET and RING associated-) domain proteins, and zinc-finger proteins Buck-Koehntop and Defossez (2013). Some crystal structures of proteins that specifically recognize methylated DNA have recently become available Buck-Koehntop et al. (2012); Liu et al. (2014). The detailed analysis of the binding modes revealed that although similarities between them exist Liu et al. (2013), it is yet unclear why three distinct families of methylated DNA-binding proteins were needed in the course of evolution. The sequence flanking the methylated CpG step was shown to be important in determining the specificity of the interaction.
The structural differences between methylated and unmethylated DNA may in part explain the specificity of interactions between proteins and DNA. As shown in Fig. 12c, the DNA base pair text determines a specific pattern of chemical groups (hydrophobic, hydrogen bond donor or acceptor) in the major groove, but not in the minor groove. As a consequence, one proposed mechanism of recognition of methylated states involves a “base readout” in the major groove, that does not require strand separation Sasai et al. (2010); Zou et al. (2011).
Yet another consequence of DNA methylation is the change in base pair structural parameters such as twist, roll and minor groove width. Lazarovici et al. (2013) found that roll and minor groove width were excellent predictors of sequence specificity for DNaseI endonuclease. This mechanism of recognition of methylated sequences is termed “shape readout”. It is likely that both shape and base readout play a role in most cases Machado et al. (2015).
V.1.3 Relationship between nucleosome positioning and DNA methylation
As discussed earlier, it appears that CpG methylation locally stiffens the DNA, and it was speculated that as a consequence, nucleosome positioning would be disfavored. However, contradictory results exist, which also suggest that methylation actually favors nucleosome formation, or stabilizes DNA wrapped around a nucleosome. We discuss here the available data.
Several lines of evidence suggest that methylation affects the structure of DNA wrapped around a histone core. Using fluorescence resonance energy transfer (FRET) to measure relative displacement between two sites on nucleosomal DNA, Lee and Lee (2011) showed that methylation leads to tightening of DNA around the nucleosome. Along the same lines, Choy et al. (2010) suggest that the enhanced rigidity of methylated DNA leads to more compact and closed nucleosomes. Methylated DNA was also shown to be more difficult to remove from a nucleosome Kaur et al. (2012). By combining data from genome-wide nucleosome positioning with available DNA methylation maps, Chodavarapu et al. (2010) have shown that there is a small increase (about 1.2%, from 75 to 76.2%) in preference of nucleosome positioning for methylated DNA. This data has been contested by Felle et al. (2011), that instead showed that the nucleosome occupancy of methylated DNA was 2-fold lower compared to unmethylated sequences.
Other studies showed that the increased rigidity of methylated DNA disfavors nucleosome positioning. We already discussed the works of Yusufaly et al. (2013) and Ngo et al. (2016), but many other studies reached the same conclusions Felle et al. (2011); Pérez et al. (2012); Portella et al. (2013).
Even more recent studies have shown that methylation has a negligible influence on nucleosome stability Langecker et al. (2015).
V.1.4 Remarks and perspectives
It has been discovered that 5-methylcytosine is not the only cytosine variant. In 2009, 5-hydroxymethylcytosine was discovered in mouse brains Kriaucionis and Heintz (2009), and since then, two other forms of cytosine methylation were discovered: 5-formylcytosine (5fC), and 5-carboxymethylcytosine (5caC) (see Spruijt and Vermeulen (2014) for a review). Each of these other forms has been detected in mouse embryonic stem cells in significant amounts Song et al. (2013a), so that careful investigation of the differences between their physical properties is needed, which only very recently has begun Ngo et al. (2016).
Traditional sequencing methods for detection of cytosine methylation are not able to distinguish between 5mC, 5hmC, 5fC and 5caC. Accurate methods to identify the genome-wide map of cytosine methylation states has only very recently become available Booth et al. (2014). Much study is needed to understand the roles of these epigenetic marks.
We speculate that distinctive physical properties of these alternative forms are in part responsible for determining the variety of roles attributed to DNA methylation Spruijt and Vermeulen (2014); Schübeler (2015). We suggest that physics may help advancing our understanding of the biological aspects of this important epigenetic mark. A very recent study has also shown by all-atom molecular dynamics and single-molecule fluorescence that DNA methylation is able to promote attraction between DNA fragments mediated by polyvalent cations Yoo et al. (2016). This study suggests yet another fascinating role for the role of physics in determining the large-scale organization of DNA in cell nuclei.
Finally, there is already a vast literature on the coupling between DNA methylation and histone post-translational modifications (see Sec. III.2), which was reviewed in Cedar and Bergman (2009). However, to our knowledge there has not been yet an attempt to model this coupling from a physical point of view.
V.2 Parental imprinting
In animals, it has been observed that certain genes are expressed in a parent-of-origin-specific manner. These so-called “imprinted” genes are DNA methylated on specific sequences named Imprinting-Control Regions (ICRs). The ICR methylation of any imprinted gene occurs either on the paternally herited or on the maternally herited chromosome this gene belongs to. Remember that there is one copy of each gene on the paternal and on the maternal chromosome (except for sexual chromosomes). Both copies are generally different and are called paternal and maternal alleles. ICR methylation starts in germ cells, keeps the memory of the parental origin of the allele and drives monoallelic expression. For example, this mechanism happens on the Igf2/H19 gene locus of mouse chromosome 7 (see Ref. Lesne et al. (2015)). The ICR located upstream of the H19 gene is methylated on the paternal allele but it remains unmethylated on the maternal allele. The maternal unmethylated allele is bound by the transcriptional repressor CTCF protein (CTCF means CCCTC-binding factor; CCCTC is a DNA sequence), that prevents the interaction between regulatory sequences (enhancers) located downstream of H19 and the Igf2 gene located further upstream of the ICR. Therefore, the Igf2 gene is not activated on the maternal chromosome 7. Instead, on the paternal chromosome, the DNA methylation prevents the binding of the CTCF protein and the Igf2 gene can be activated by the regulatory sequences. This differential folding has been evidenced by Chromosome Conformation Capture (3C) experiments during mouse development Court et al. (2011).
Genomic imprinting was selected during evolution at the transition between placental (e.g. mouse) and marsupial (e.g. kangaroo) mammals. Six genes in marsupials and about a hundred in placental mammals undergo parental genomic imprinting. The reason for the selection of this unusual, epigenetic mechanism of gene regulation during mammalian evolution remains poorly understood at present.
V.3 Chromosome X inactivation
Another important and historically relevant example of epigenetic silencing is the inactivation of the X chromosome in mammal females.
The pair of sex chromosomes (XY in males, XX in females) is responsible for sex determination in mammals. While the Y is small and carries only a few genes, X chromosome is much longer and contains thousands of genes. Females thus carry twice as many X-linked genes as males, this leading to a potentially lethal dosage problem.
During early embryonic development, one of the two X chromosomes of females is thus inactivated, and condensed to form the so-called Barr body Barr and Bertram (1949).
In mice, the inactivation of the X chromosome occurs in three phases. First, the paternal X chromosome is inactivated during the preimplantation period, from the stage “two cells”. Then, it remains inactive in the peripheral cells, which will form the placenta, but it is reactivated in the cells which will form the future embryo. Finally, a second inactivation takes place, and this time it concerns, randomly in each cell, either paternal or maternal X Okamoto et al. (2004).
Intriguing questions then arise: how does the cell manage to silence only one of the two X chromosomes? How is the silenced X chosen?
The X inactivation mechanism seems to be controlled by a complex genetic locus called the X-chromosome-inactivation centre (Xic). It has been proven that starting mechanism in X inactivation is mediated by the non-coding (not translated into protein) transcript of the Xist (X-inactive specific) gene, present within Xic. Once transcribed, many copies of Xist RNA accumulate along the X chromosome (RNA coating), then induce its heterochromatinization.
This process is however under the control of a few other genes included in the Xic region. One of the crucial elements is Tsix, a non-coding RNA gene that is antisense to the Xist gene (it is transcribed from the complementary DNA strand). Due to this compementarity, the Tsix RNA-transcript duplexes with the complementary Xist RNA-transcript into a double stranded RNA which is further degraded. This mechanism prevents the accumulation of Xist, hence inhibits the X inactivation Okamoto et al. (2004).
Random selection of the inactivated X chromosome may therefore emerge from a detailed balance in the synthesis of Tsix and Xist. Recently, a model to explain this complex regulation path has been proposed Giorgetti et al. (2014), that relies on the polymer physics properties of chromatin, on its organization in topologically-associating domains (TADs, see Sec. III.3.2), and on a detailed coupling between gene expression and 3D organization at the level of the Xic center.
The Xic is composed of two topologically-associating domains (TADs, Nora et al. (2012)), called the Tsix TAD (320kb) and the Xist TAD (600kb). The 3D structure of the Tsix TAD is highly variable among cells and this variability is most probably due to fluctuations of chromatin conformation at time scales shorter than a cell cycle, as in the model proposed by Jost et al. previously discussed Jost et al. (2014). The distribution of conformations observed thanks to 5C experiments (Carbon Copy Chromosome Conformational Capture), illustrated by the Fig. 5A in Giorgetti et al. (2014), shows indeed an equilibrium between coil and globule conformations, typical of a coil-globule transition of a polymer with finite-size effects Imbert et al. (1997); Caré et al. (2014).
The model also assumes that the level of Tsix depends on the activity of two putative regulatory elements (Linx and Chic1, Nora et al. (2012)), placed inside the same Tsix TAD.
Inactivation can then be explained as a result of the chromatin conformation of the Tsix TAD, which determines the regulation of specific interactions between all these elements (regulatory elements, Tsix and Xist). The switch between globule and coil confirmations changes indeed the spatial proximity between these genes, hence their interactions. As a result, globule conformations induce higher Tsix transcription levels, while coil conformations correspond to lower Tsix levels.
Statistical fluctuations in chromatin conformation within the Tsix TAD may, then, contribute to ensuring asymmetric expression from the Xic at the onset of X chromosome inactivation, as shown by simulations Giorgetti et al. (2014). If, in a cell, Tsix TAD is similarly compacted on the two alleles, Tsix transcript levels from the two alleles are similar, with little or no heterochromatinization effect. As a fluctuation induces the coil-globule transition for the Tsix TAD on one allele, then the two transcripts tend to be differentially expressed. This mechanism may help ensuring that Xist is only transcribed from the allele with lower Tsix transcription (Fig. 6B in Giorgetti et al. (2014)).
Once established, the X inactivation is stably transmitted through mitosis along the following development. Further (and later) features of the inactive X include hypermethylation of DNA, histone deacetylation, chromatin condensation, i.e. the same general mechanisms that we have previously introduced.
V.4 Non-coding RNA and microRNA
The X inactivation is a clear example of the crucial and early role of RNA in epigenetic silencing. Together with histone and DNA modifications, non coding RNAs have (more recently) emerged as one of the main epigenetic mechanisms. Two main classes of epigenetically active non coding RNAs can be identified: small (30 nucleotides) and long (200 nucleotides). Both classes play a role in heterochromatin formation, histone modification, DNA methylation targeting, and gene silencing.
Long RNAs can complex with chromatin-modifying proteins and recruit their catalytic activity to specific sites in the genome, thereby modifying chromatin states and influencing gene expression. In the case of the X inactivation, the first described epigenetic mechanism involving a long non coding RNA (lncRNA), it has been shown that Xist RNA directly recruits chromatin-modifying factors as Polycomb repressive complex PRC2 that mediates histone H3 lysine 27 methylation, but the direct character of such interaction remains to be confirmed Brockdorff (2013), as well as the overall mechanism, including the interplay between the different RNA involved (Xist Tsix and others) Pontier and Gribnau (2011). According to a proposed model Lee (2012), long non coding RNAs may function by sequestering chromatin-modifying enzymes away from other interacting partners or by guiding chromatin modifiers to the correct locations in the genome. In other cases, the long RNA seems to works by binding and bringing together different types of proteins that can cooperate in establishing the repressive chromatin state (see Marchese and Huarte (2014) for a review on the interplay between lncRNAs and chromatin modifiers in epigenetics). Very recently, a single molecule, single cell RNA Fluorescence in situ hybridization (FISH) has allowed to quantify and categorize the subcellular localization patterns of a representative set of 61 lncRNAs in three different cell types, giving further quantitative insight in linking their putative role to their position in the cell Cabili et al. (2015). LncRNAs exhibit a diversity of localization patterns, including a dispersed distribution in the nucleus or in the cytoplasm, and condensed in nuclear foci, a configuration which may be consistent with a role for these lncRNAs in chromatin regulation, as shown for XIST and other lncRNAs involved in imprinting. Most lncRNAs present however stronger nuclear localization than most messenger RNAs. Interestingly, lncRNAs do not persist at nuclear foci during mitosis, suggesting that retention at specific regulatory regions through mitosis is likely not a mechanism of mitotic inheritance.
A whole new realm of small non-coding RNAs was discovered in the late 90s. It includes two classes of small RNAs: micro RNAs (miRNAs) and small interfering RNAs (siRNAs), which perform many functions, and in particular are involved in the so called RNA interference, a regulation pathway of gene expression at the transcriptional and post-transcriptional level. In other words, RNA interference may act either by inhibition of the target RNA transcription or by degradation of the transcript RNA. Piwi-interacting RNAs (piRNAs) represent a third, large class of lightly longer RNAs, palying a role in epigenetic and post-transcriptional gene silencing of retrotransposons and other genetic elements in germ line cells through their association with piwi proteins. Again, we note here that unnecessary and potentially deleterious genes are often under epigenetic control Cowley and Oakey (2010).
At the post-translational level, the essential repression mechanism for both miRNAs and siRNAs is through pairing to a complementary sequence of the messenger RNA transcribed from a target gene, which results in the degradation of the RNA and thus the repression of the gene. To recognize its target messenger RNA, miRNAs and siRNAs must be associated with a protein to form the RNA-induced silencing complex.
Interestingly, heterochromatinization may also be initiated by the RNA interference machinery222The RNA interference machinery includes different factors (as Dicer, Argonaute and RNA-dependent RNA polymerases), that produce the small RNAs or bind them to form functional complexes. that targets repetitive DNA sequences Grewal and J. (2007). These are DNA sequences of up to several million base pairs and consist of a large number of repetitions of a much smaller sequence, and are found, in particular, at centromeres, telomeres, and other regions that remain condensed throughout the cell cycle, referred to as constitutive heterochromatin. At the same time, heterochromatin mediates the spreading of RNA interference machinery to surrounding sequences, hence the production of siRNAs, which in turn are essential for the stable maintenance of heterochromatic structures.
A complex scenario thus emerges in which DNA sequences, RNAs, epigenetic factors and chromatin remodellers plays together in the setting up and maintenance of different functional chromatin states. DNA-methylation and histone-modifications often act together to regulate miRNA expression, while, conversely, some miRNAs can regulate the expression of epigenetic machinery, with important dysregulation effects in cancer Wang et al. (2013).
The models previously described for the spreading of epigenetic marks needs probably to include these additional features in order to reproduce the epigenetic mechanisms to a larger scale. A first step in this direction may be the study of the interplay between miRNAs and epigenetic regulators, and the particular role of post-translational regulation, as discussed by Osella et al. Osella et al. (2014). A typical basic regulatory network involving miRNAs and epigenetic regulators is the double negative feed-back loop, in which a miRNA represses an epigenetic regulator, which in turn represses the expression of the same miRNA. Starting from an approach similar to what discussed in Sec. IV, it is possible to describe the system. More precisely, the model variables are the number of miRNAs, the number of messanger RNAs that miRNAs repress, and the number of proteins (epigenetic regulator) resulting from the messenger RNA translation (and repressing, in turn, the miRNAs). The interesting input from the miRNA regulation step is its role in keeping fluctuations of gene expression under control, either by suppressing translation and by promoting RNA degradation. Both effects helps indeed in reducing the burstiness in protein production Friedman et al. (2006); Osella et al. (2014). The resulting set of rate equations includes therefore, on one hand, the highly non-linear and bistable character of epigenetic regulation and, on the other, the stabilizing effect of miRNAs regulation, this leading to an increased stability of the system, and to an increased range of bistability of the switch.
This result suggest possible reasons for the existence of regulatory pathways combining epigenetic regulators and miRNAs, although both experimental investigations and modeling of such complicated circuits are still at the embryonic stage.
V.5 Supercoilingomics: supercoiling as a physical epigenetic mark, and its role in the initiation and maintenance of epigenetic marks
DNA supercoiling was first properly described by Jerome Vinograd and colleagues Vinograd et al. (1965) and it took just some more years to James Wang to discover the first enzyme able to relax these topological constraints in vivo Wang (1971). DNA topological state is given by its linking number (), defined as the number of times that a strand of DNA winds in the right-handed direction around the helix axis when the axis is straight (or constrained to lie in a plane for a circular molecule). This integer is the sum of two geometrical parameters: twist (or twisting number , a measure of the helical winding of the DNA strands around each other, hence representing a “1D” deformation along the axis) and writhe (or writhing number Wr, a measure of the 3D coiling of the axis of the double helix). The partitioning between and for a given is determined by the free energy of DNA (itself dependent on ionic conditions) and by DNA/protein interactions that locally impose some particular DNA torsion and/or writhe. While structural proteins can only alter the ratio, enzymes such as topoisomerases or gyrases can alter Lk by catalyzing the cleavage of one or both strands of DNA, followed by the passage of a segment of DNA through this break and the resealing of the DNA break Wang (2002).
In most living organisms, DNA is negatively supercoiled, which prepares DNA for processes requiring separation of the DNA strands, such as replication or transcription. In eukaryotes, this negative supercoiling is constrained within the nucleosome, so that its removal will simultaneously favor the access and melting of previously occulted DNA, therefore facilitating transcription initiation. The distribution of nucleosomes, and notably the NRL, appears then as an important feature to propagate through mitosis, partly for topological reasons. Regarding the elongation step, as DNA is screwing through the polymerase during transcription, the negative supercoiling induced in the back of the enzyme can propagate through the chromatin fiber and trigger local DNA alterations that have been proposed to serve as a regulatory signal for molecular partners Kouzine et al. (2004); Liu et al. (2006); Kouzine et al. (2008); Belotserkovskii et al. (2013). Therefore supercoiling would act as a transient mechanotransducer as well as a physical epigenetic mark. Moreover, nucleosome conformational changes might help to smoothen the elongation process by buffering some topological constraint Bancaud et al. (2007); Recouvreux et al. (2011); Vlijm et al. (2015) and facilitate H2A/H2B dimer loss in front of the polymerase Sheinin et al. (2013). It remains to be seen how much the structural differences provided by histone variants Shaytan et al. (2015) would help to build “elongation friendly” regions that could be transmitted through cell division.
Supercoiling of DNA has been recently proposed to be considered as a true physical epigenetic mark, entering the family of “omics” data one should consider to get a comprehensive genome-wide epigenetic landscape of a cell at a given state of its development Lavelle (2014). Indeed, genome-wide maps of DNA supercoiling states have been generated Bermudez et al. (2010); Joshi et al. (2010); Kouzine et al. (2013a, b); Naughton et al. (2013); Teves and Henikoff (2014) which add to existing predicted maps of DNA melting Liu et al. (2007) or G-quartet motifs Du et al. (2009); Maizels and Gray (2013). The emerging picture is that supercoiling is associated to the structuration of chromatin topological domains, which largely overlap with TADs Naughton et al. (2013).
DNA supercoiling is a physical epigenetic mark because it may change the affinity of the underlying DNA sequence to specific transcription factors Travers and Muskhelishvili (2007). Supercoiling may also silence a whole topological domain when recruiting TFs which in turn may recruit silencing enzymes, e.g. Suv39h which eventually deposits H3K9me3 epigenetic marks Bulut-Karslioglu et al. (2012). Note that in this case, transcription factors are used to repressing instead of activating gene expression. This mechanism relies on DNA allostery, i.e. the change of DNA affinity to some transcription factors that is induced by supercoiling Lesne et al. (2015).
But how may supercoiling be initiated and herited? The distribution of topoisomerases and structural proteins such as condensins should help in transmitting some domain structuration and topological states through cell division Aragon et al. (2013); Hirano (2014).
The nucleosome repeat length (NRL, see Sec. II.1) might also be a key control parameter. We first note that the twist rate of the DNA double helix in a given topological domain is a function of (i) remodeling activity, notably through active nucleosome removal Padinhateeri and Marko (2011), and (ii) topoisomerase activity. Importantly both these ATP-consuming mechanisms are under active control of the cell metabolism. Moreover both remodeling and topoisomerase activities regulate the value of the average NRL of a given topological domain. Therefore the average NRL over some genomic domain appears to be a physical epigenetic mark of this domain. And the transmission of this average NRL through mitosis would transmit the twist rate of the domain. Interestingly the recently observed spreading mode of histone PTMs over transcription cycles Terweij and van Leeuwen (2013) might explain the spreading and maintenance of the NRL on epigenetic domains. In support of this hypothesis active remodeling processes achieved by ATP-consuming remodeling factors - and crucially through active nucleosome removal - have been shown to be essential for driving biologically relevant nucleosome positioning Padinhateeri and Marko (2011), thus fixing the average NRL. Challenging genome-wide studies are needed to further correlate supercoiling maps to cell differentiation states.
VI Conclusion and perspectives
By putting the rich and diverse biological literature under the new light of a physical approach, the emerging picture is that a limited set of general physical rules play a key role in the epigenetic regulation of gene expression. Processes at work are diffusion-limited and involve a small number of molecules, which precludes simple approaches in terms of concentrations. Instead, multi-scale approaches articulating different models at different levels of organization are to be developed.
Mainly, epigenetics display an intrication of physical mechanisms and specific biological entities, devised in the course of evolution to achieve an exquisitely coordinated and adaptable regulation of transcriptional activity. Our review demonstrates the need to take into account both aspects, within a dialogue between physics and biology, theory and living-cell experiments. Importantly, theoretical models are now amenable to experimental verification, thanks to the many technologies that are available to that end. It is worth noticing that the field of synthetic chromatin biology Keung et al. (2015), which allows to modify and manipulate epigenetic states, is a promising new avenue for putting theories to the test.
Significant and challenging issues remain:
(i) coupling nuclear architecture and epigenetic marking: understanding the interplay between 3D nucleus architecture and 1D epigenetic marking (including barrier positions);
(ii) physical signals that stimulate epigenetic marking: coupling nucleus mechanical deformations to epigenetic marking. Cells dramatically change their shape and mechanics during development by integrating physicochemical signals from the local microenvironment (morphogens gradients, cell-cell contact, adhesion to extracellular matrix) to generate lineage-specific gene expression Engler et al. (2006). Recent studies have begun to uncover the mechanisms by which these signals are integrated into the 3D spatiotemporal organization and epigenetic state of the nucleus and impact cell fate decision Shivashankar (2011); Bellas and Chen (2014); Ramdas and Shivashankar (2015). Further understanding of these transduction mechanisms is a challenging perspective;
(iii) equilibrium vs nonequilibrium physics: An implicit - yet overlooked - assumption of the models of bistability introduced by Sneppen and coworkers in the context of epigenetics Dodd et al. (2007); Micheelsen et al. (2010) is that the system is open and far from equilibrium. The nonequilibrium nature of their models lies in the asymmetry of the transitions: the recruitment of an unmarked nucleosome by a marked nucleosome does not affect the latter, in strong contrast with an equilibrium transition between two species. Indeed epigenetic marks undergo permanent recycling and biochemical transformations, so that epigenetic marks turn out to be steady states and not equilibrium states. Therefore, it is of primary importance to identify, characterize and model the various active physical mechanisms that are at work in the initiation and maintenance of epigenetic marks. In particular, it is crucial to evidence active (ATP-dependent) mechanisms that maintain epigenetic marks, for instance: metabolism, transcription, replication, ionic pumps at the cell membrane. In our opinion this is a very challenging and timely topic for biology-oriented physicists.
Acknowledgements.
The authors wish to thank all the members of the CNRS GDR 3536 for the stimulating discussions that inspired this work. Special thanks to Aurélien Bancaud, Philippe Bertrand, Pascal Carrivain, Giacomo Cavalli, Thierry Forné, Daniel Jost, and Cedric Vaillant for their help in the preparation of the manuscript. This work has been funded by the French Institut National du Cancer, grant INCa_5960 and by the French Agence Nationale de la Recherche, grant ANR-13-BSV5-0010-03.References
- Albert et al. (2013) Albert, B., J. Mathon, A. Shukla, H. Saad, C. Normand, I. Léger-Silvestre, D. Villa, A. Kamgoue, J. Mozziconacci, H. Wong, et al. (2013), The Journal of cell biology 202 (2), 201.
- Alberts et al. (2013) Alberts, B., D. Bray, K. Hopkin, A. Johnson, J. Lewis, M. Raff, K. Roberts, and P. Walter (2013), Essential cell biology (Garland Science, New York).
- Allahverdi et al. (2011) Allahverdi, A., R. Yang, N. Korolev, Y. Fan, C. A. Davey, C.-F. Liu, and L. Nordenskiöld (2011), Nucleic acids research 39 (5), 1680.
- Allan et al. (1982) Allan, J., N. Harborne, D. C. Rau, and H. Gould (1982), The Journal of Cell Biology 93 (2), 285.
- Angel et al. (2011) Angel, A., J. Song, C. Dean, and M. Howard (2011), Nature 476 (7358), 105.
- Angelov et al. (2001) Angelov, D., J. M. Vitolo, V. Mutskov, S. Dimitrov, and J. J. Hayes (2001), Proceedings of the National Academy of Sciences 98 (12), 6599.
- Aragon et al. (2013) Aragon, L., E. Martinez-Perez, and M. Merkenschlager (2013), Current opinion in genetics & development 23 (2), 204.
- Arya and Schlick (2006) Arya, G., and T. Schlick (2006), Proceedings of the National Academy of Sciences 103 (44), 16236, http://www.pnas.org/content/103/44/16236.full.pdf+html .
- Arya and Schlick (2009) Arya, G., and T. Schlick (2009), The Journal of Physical Chemistry A 113 (16), 4045, http://pubs.acs.org/doi/pdf/10.1021/jp810375d .
- Azzaz et al. (2014) Azzaz, A. M., M. W. Vitalini, A. S. Thomas, J. Price, M. J. Blacketer, D. E. Cryderman, L. N. Zirbel, C. L. Woodcock, A. H. Elcock, L. L. Wallrath, and M. A. Shogren-Knaak (2014), The Journal of biological chemistry 10.1074/jbc.M113.512137.
- Baker et al. (2001) Baker, N. A., D. Sept, S. Joseph, M. J. Holst, and J. A. McCammon (2001), Proceedings of the National Academy of Sciences 98 (18), 10037.
- Bancaud et al. (2007) Bancaud, A., G. Wagner, N. C. e Silva, C. Lavelle, H. Wong, J. Mozziconacci, M. Barbi, A. Sivolob, E. Le Cam, L. Mouawad, et al. (2007), Molecular cell 27 (1), 135.
- Bannister and Kouzarides (2011) Bannister, A. J., and T. Kouzarides (2011), Cell Research 21 (3), 381.
- Barbieri et al. (2012) Barbieri, M., M. Chotalia, J. Fraser, L.-M. Lavitas, J. Dostie, A. Pombo, and M. Nicodemi (2012), Proceedings of the National Academy of Sciences 109 (40), 16173.
- Barr and Bertram (1949) Barr, M., and E. Bertram (1949), Nature 163, 676.
- Becker and Hörz (2002) Becker, P. B., and W. Hörz (2002), Annual Review of Biochemistry 71, 247.
- Bellas and Chen (2014) Bellas, E., and C. S. Chen (2014), Current opinion in cell biology 31, 92.
- Belotserkovskii et al. (2013) Belotserkovskii, B. P., S. M. Mirkin, and P. C. Hanawalt (2013), Chemical reviews 113 (11), 8620.
- Benedetti et al. (2014) Benedetti, F., J. Dorier, and A. Stasiak (2014), Nucleic acids research 42 (16), 10425.
- Bermudez et al. (2010) Bermudez, I., J. Garcia-Martinez, J. Perez-Ortin, and J. Roca (2010), Nucleic Acids Research 38, e182.
- Bertin et al. (2007a) Bertin, A., D. Durand, M. Renouard, F. Livolant, and S. Mangenot (2007a), European biophysics journal: EBJ 36 (8), 1083.
- Bertin et al. (2007b) Bertin, A., S. Mangenot, M. Renouard, D. Durand, and F. Livolant (2007b), Biophysical journal 93 (10), 3652.
- Bertin et al. (2007c) Bertin, A., M. Renouard, J. S. Pedersen, F. Livolant, and D. Durand (2007c), Biophysical Journal 92 (7), 2633.
- Beuchle et al. (2001) Beuchle, D., G. Struhl, and J. Muller (2001), Development 128 (6), 993.
- Bi et al. (2004) Bi, X., Q. Yu, J. J. Sandmeier, and Y. Zou (2004), Molecular and cellular biology 24 (5), 2118.
- Bird (2002) Bird, A. (2002), Genes & development 16 (1), 6.
- Blackledge et al. (2014) Blackledge, N. P., A. M. Farcas, T. Kondo, H. W. King, J. F. McGouran, L. L. Hanssen, S. Ito, S. Cooper, K. Kondo, Y. Koseki, et al. (2014), Cell 157 (6), 1445.
- Booth et al. (2014) Booth, M. J., G. Marsico, M. Bachman, D. Beraldi, and S. Balasubramanian (2014), Nature chemistry 6, 435.
- Boulé et al. (2015) Boulé, J.-B., J. Mozziconacci, and C. Lavelle (2015), Journal of Physics: Condensed Matter 27 (3), 033101.
- Brockdorff (2013) Brockdorff, N. (2013), RNA 19 (4), 429, http://rnajournal.cshlp.org/content/19/4/429.full.pdf+html .
- Buck-Koehntop and Defossez (2013) Buck-Koehntop, B. A., and P.-A. Defossez (2013), Epigenetics 8 (2), 131.
- Buck-Koehntop et al. (2012) Buck-Koehntop, B. A., R. L. Stanfield, D. C. Ekiert, M. A. Martinez-Yamout, H. J. Dyson, I. A. Wilson, and P. E. Wright (2012), Proceedings of the National Academy of Sciences 109 (38), 15229.
- Bulut-Karslioglu et al. (2012) Bulut-Karslioglu, A., V. Perrera, M. Scaranaro, I. A. de la Rosa-Velazquez, S. van de Nobelen, N. Shukeir, J. Popow, B. Gerle, S. Opravil, M. Pagani, et al. (2012), Nature structural & molecular biology 19 (10), 1023.
- Cabili et al. (2015) Cabili, M. N., M. C. Dunagin, P. D. McClanahan, A. Biaesch, O. Padovan-Merhar, A. Regev, J. L. Rinn, and A. Raj (2015), Genome biology 16 (1), 20.
- Cantone and Fisher (2013) Cantone, I., and A. G. Fisher (2013), Nature structural & molecular biology 20 (3), 282.
- Caré et al. (2014) Caré, B. R., P. Carrivain, T. Forné, J.-M. Victor, and A. Lesne (2014), Communications in Theoretical Physics 62 (4), 607.
- Caré et al. (2015) Caré, B. R., P.-E. Emeriau, R. Cortini, and J.-M. Victor (2015), AIMS Biophysics 2 (201504517), 517.
- Cedar and Bergman (2009) Cedar, H., and Y. Bergman (2009), Nature Reviews Genetics 10 (5), 295.
- Chodavarapu et al. (2010) Chodavarapu, R. K., S. Feng, Y. V. Bernatavichute, P.-Y. Chen, H. Stroud, Y. Yu, J. A. Hetzel, F. Kuo, J. Kim, S. J. Cokus, et al. (2010), Nature 466 (7304), 388.
- Choy et al. (2010) Choy, J. S., S. Wei, J. Y. Lee, S. Tan, S. Chu, and T.-H. Lee (2010), Journal of the American Chemical Society 132 (6), 1782.
- Cokus et al. (2008) Cokus, S. J., S. Feng, X. Zhang, Z. Chen, B. Merriman, C. D. Haudenschild, S. Pradhan, S. F. Nelson, M. Pellegrini, and S. E. Jacobsen (2008), Nature 452 (7184), 215.
- Cooper et al. (2014) Cooper, S., M. Dienstbier, R. Hassan, L. Schermelleh, J. Sharif, N. P. Blackledge, V. De Marco, S. Elderkin, H. Koseki, R. Klose, et al. (2014), Cell reports 7 (5), 1456.
- Court et al. (2011) Court, F., J. Miro, C. Braem, M. Lelay-Taha, A. Brisebarre, F. Atger, T. Gostan, M. Weber, G. Cathala, , and T. Forné (2011), Genome Biology 12, R42.
- Cowley and Oakey (2010) Cowley, M., and R. J. Oakey (2010), Briefings in functional genomics 9 (4), 340.
- Crepaldi et al. (2013) Crepaldi, L., C. Policarpi, A. Coatti, W. T. Sherlock, B. C. Jongbloets, T. A. Down, and A. Riccio (2013), PLoS genetics 9 (8), e1003699.
- Davey et al. (2002) Davey, C. A., D. F. Sargent, K. Luger, A. W. Maeder, and T. J. Richmond (2002), Journal of Molecular Biology 319 (5), 1097.
- David-Rus et al. (2009) David-Rus, D., S. Mukhopadhyay, J. L. Lebowitz, and A. M. Sengupta (2009), Journal of theoretical biology 258 (1), 112.
- Dawson and Kouzarides (2012) Dawson, M., and T. Kouzarides (2012), Cell 150, 12.
- Dayarian and Sengupta (2013) Dayarian, A., and A. M. Sengupta (2013), Physical biology 10 (3), 036005.
- Dekker et al. (2002) Dekker, J., K. Rippe, M. Dekker, and N. Kleckner (2002), Science 295, 1306.
- Di Croce and Helin (2013) Di Croce, L., and K. Helin (2013), Nature structural & molecular biology 20 (10), 1147.
- Dixon et al. (2012) Dixon, J. R., S. Selvaraj, F. Yue, A. Kim, Y. Li, Y. Shen, M. Hu, J. S. Liu, and B. Ren (2012), Nature 485 (7398), 376.
- Dodd et al. (2007) Dodd, I. B., M. A. Micheelsen, K. Sneppen, and G. Thon (2007), Cell 129 (4), 813.
- Dodd and Sneppen (2011) Dodd, I. B., and K. Sneppen (2011), Journal of molecular biology 414 (4), 624.
- Dolinsky et al. (2007) Dolinsky, T. J., P. Czodrowski, H. Li, J. E. Nielsen, J. H. Jensen, G. Klebe, and N. A. Baker (2007), Nucleic Acids Research 35 (suppl 2), W522.
- Du et al. (2009) Du, Z., Y. Zhao, and N. Li (2009), Nucleic acids research 37 (20), 6784.
- Duan et al. (2010) Duan, Z., M. Andronescu, K. Schutz, S. McIlwain, Y. J. Kim, C. Lee, J. Shendure, S. Fields, C. A. Blau, and W. S. Noble (2010), Nature 465 (7296), 363.
- Engler et al. (2006) Engler, A. J., S. Sen, H. L. Sweeney, and D. E. Discher (2006), Cell 126 (4), 677.
- Erdel et al. (2013) Erdel, F., K. Müller-Ott, and K. Rippe (2013), Annals of the New York Academy of Sciences 1305 (1), 29.
- Everaers and Schiessel (2015) Everaers, R., and H. Schiessel (2015), Journal of Physics: Condensed Matter 27 (6), 060301.
- Feinberg and Tycko (2004) Feinberg, A., and B. Tycko (2004), Nature Reviews Cancer 4, 143.
- Felle et al. (2011) Felle, M., H. Hoffmeister, J. Rothammer, A. Fuchs, J. H. Exler, and G. Längst (2011), Nucleic acids research 39 (6956), gkr263.
- Fierz (2014) Fierz, B. (2014), ChemMedChem 10.1002/cmdc.201300487.
- Filion et al. (2010) Filion, G. J., J. G. van Bemmel, U. Braunschweig, W. Talhout, J. Kind, L. D. Ward, W. Brugman, I. J. de Castro, R. M. Kerkhoven, H. J. Bussemaker, et al. (2010), Cell 143 (2), 212.
- Friedman et al. (2006) Friedman, N., L. Cai, and X. S. Xie (2006), Physical review letters 97 (16), 168302.
- Gilbert (2012) Gilbert, S. F. (2012), International journal of epidemiology , dyr186.
- Giorgetti et al. (2014) Giorgetti, L., R. Galupa, E. P. Nora, T. Piolot, F. Lam, J. Dekker, G. Tiana, and E. Heard (2014), Cell 157 (4), 950.
- Gosalia et al. (2014) Gosalia, N., D. Neems, J. L. Kerschner, S. T. Kosak, and A. Harris (2014), Nucleic Acids Research 42 (15), 9612.
- Graves (1982) Graves, J. A. M. (1982), Experimental cell research 141 (1), 99.
- Grewal and Moazed (2003) Grewal, S., and D. Moazed (2003), Science 301 (5634), 798.
- Grewal and Elgin (2002) Grewal, S. I., and S. C. Elgin (2002), Current opinion in genetics & development 12 (2), 178.
- Grewal and Klar (1996) Grewal, S. I., and A. J. Klar (1996), Cell 86 (1), 95.
- Grewal and J. (2007) Grewal, S. I. S., and S. J. (2007), Nature Reviews Genetics 8, 35.
- Grosberg et al. (1988) Grosberg, A. Y., S. K. Nechaev, and E. I. Shakhnovich (1988), Journal de physique 49 (12), 2095.
- Haig (2004) Haig, D. (2004), in Cold Spring Harbor Symposia on Quantitative Biology, Vol. 69 (Cold Spring Harbor Laboratory Press, New York) pp. 67–70.
- Hajjoul et al. (2013) Hajjoul, H., J. Mathon, H. Ranchon, I. Goiffon, J. Mozziconacci, B. Albert, P. Carrivain, J.-M. Victor, O. Gadal, K. Bystricky, et al. (2013), Genome research 23 (11), 1829.
- Hansen (2002) Hansen, J. C. (2002), Annual Review of Biophysics and Biomolecular Structure 31, 361.
- Hathaway et al. (2012) Hathaway, N. A., O. Bell, C. Hodges, E. L. Miller, D. S. Neel, and G. R. Crabtree (2012), Cell 149 (7), 1447.
- Hirano (2014) Hirano, T. (2014), Trends in cell biology 24 (12), 727.
- Hizume et al. (2010) Hizume, K., S. Araki, K. Hata, E. Prieto, T. K. Kundu, K. Yoshikawa, and K. Takeyasu (2010), Archives of histology and cytology 73 (3), 149.
- Hodges and Crabtree (2012) Hodges, C., and G. R. Crabtree (2012), Proceedings of the National Academy of Sciences 109 (33), 13296.
- Hodges-Garcia and Hagerman (1995) Hodges-Garcia, Y., and P. J. Hagerman (1995), Journal of Biological Chemistry 270 (1), 197.
- Holliday (1994) Holliday, R. (1994), Developmental genetics 15 (6), 453.
- Howell et al. (2013) Howell, S. C., K. Andresen, I. Jimenez-Useche, C. Yuan, and X. Qiu (2013), Biophysical journal 105 (1), 194.
- Huet et al. (2014) Huet, S., C. Lavelle, H. Ranchon, P. Carrivain, J.-M. Victor, A. Bancaud, et al. (2014), International review of cell and molecular biology 307, 443.
- Humphrey et al. (1996) Humphrey, W., A. Dalke, and K. Schulten (1996), Journal of Molecular Graphics 14 (1), 33.
- Imbert et al. (1997) Imbert, J., A. Lesne, and J. Victor (1997), Physical Review E 56 (5), 5630.
- Jackson et al. (1993) Jackson, D. A., A. B. Hassan, R. J. Errington, and P. R. Cook (1993), The EMBO journal 12 (3), 1059.
- Jackson et al. (1998) Jackson, D. A., F. J. Iborra, E. M. Manders, and P. R. Cook (1998), Molecular biology of the cell 9 (6), 1523.
- Jenuwein and Allis (2001) Jenuwein, T., and C. D. Allis (2001), Science 293 (5532), 1074.
- Jones (2012) Jones, P. A. (2012), Nature Reviews Genetics 13 (7), 484.
- Joshi et al. (2010) Joshi, R. S., B. Piña, and J. Roca (2010), The EMBO journal 29 (4), 740.
- Jost (2014) Jost, D. (2014), Physical Review E 89 (1), 010701.
- Jost et al. (2014) Jost, D., P. Carrivain, G. Cavalli, and C. Vaillant (2014), Nucleic acids research 42 (15), 9553.
- Kalashnikova et al. (2013) Kalashnikova, A. A., M. E. Porter-Goff, U. M. Muthurajan, K. Luger, and J. C. Hansen (2013), Journal of the Royal Society, Interface / the Royal Society 10 (82), 20121022.
- Kan et al. (2009) Kan, P.-Y., T. L. Caterino, and J. J. Hayes (2009), Molecular and Cellular Biology 29 (2), 538.
- Kaur et al. (2012) Kaur, P., B. Plochberger, P. Costa, S. M. Cope, S. M. Vaiana, and S. Lindsay (2012), Physical biology 9 (6), 065001.
- Keung et al. (2015) Keung, A. J., J. K. Joung, A. S. Khalil, and J. J. Collins (2015), Nature Reviews Genetics 16 (3), 159.
- Khraiwesh et al. (2010) Khraiwesh, B., M. A. Arif, G. I. Seumel, S. Ossowski, D. Weigel, R. Reski, and W. Frank (2010), Cell 140 (1), 111.
- Kouzarides (2007) Kouzarides, T. (2007), Cell 128 (4), 693.
- Kouzine et al. (2013a) Kouzine, F., A. Gupta, L. Baranello, D. Wojtowicz, K. Ben-Aissa, J. Liu, T. Przytycka, and D. Levens (2013a), Nature Structural & Molecular Biology 20, 396.
- Kouzine et al. (2004) Kouzine, F., J. Liu, S. Sanford, H.-J. Chung, and D. Levens (2004), Nature structural & molecular biology 11 (11), 1092.
- Kouzine et al. (2008) Kouzine, F., S. Sanford, Z. Elisha-Feil, and D. Levens (2008), Nature structural & molecular biology 15 (2), 146.
- Kouzine et al. (2013b) Kouzine, F., D. Wojtowicz, A. Yamane, W. Resch, K.-R. Kieffer-Kwon, R. Bandle, S. Nelson, H. Nakahashi, P. Awasthi, L. Feigenbaum, et al. (2013b), Cell 153 (5), 988.
- Kriaucionis and Heintz (2009) Kriaucionis, S., and N. Heintz (2009), Science 324 (5929), 929.
- Kühn and Hofmeyr (2014) Kühn, S., and J.-H. S. Hofmeyr (2014), Biosemiotics 7 (2), 203.
- Lang et al. (2014) Lang, A. H., H. Li, J. J. Collins, and P. Mehta (2014), PLoS Computational Biology 10 (8), e1003734.
- Langecker et al. (2015) Langecker, M., A. Ivankin, S. Carson, S. Kinney, F. Simmel, and M. Wanunu (2015), Nano letters 15, 783.
- Lavelle (2014) Lavelle, C. (2014), Current opinion in genetics & development 25, 74.
- Lazarovici et al. (2013) Lazarovici, A., T. Zhou, A. Shafer, A. C. D. Machado, T. R. Riley, R. Sandstrom, P. J. Sabo, Y. Lu, R. Rohs, J. A. Stamatoyannopoulos, et al. (2013), Proceedings of the National Academy of Sciences 110 (16), 6376.
- Leblond and El-Alfy (1998) Leblond, C. P., and M. El-Alfy (1998), The Anatomical Record 252 (3), 426.
- Lee (2012) Lee, J. T. (2012), Science 338 (6113), 1435.
- Lee and Lee (2011) Lee, J. Y., and T.-H. Lee (2011), Journal of the American Chemical Society 134 (1), 173.
- Lennartsson and Ekwall (2009) Lennartsson, A., and K. Ekwall (2009), Biochimica et Biophysica Acta (BBA)-General Subjects 1790 (9), 863.
- Lesne (2006) Lesne, A. (2006), The European Physical Journal E 19 (3), 375.
- Lesne et al. (2015) Lesne, A., N. Foray, G. Cathala, T. Forné, H. Wong, and J.-M. Victor (2015), Journal of Physics: Condensed Matter 27 (6), 064114.
- Lesne et al. (2014) Lesne, A., J. Riposo, P. Roger, A. Cournac, and J. Mozziconacci (2014), Nature methods 11 (11), 1141.
- Li et al. (1993) Li, E., C. Beard, and R. Jaenisch (1993), Nature 366 (6453), 362.
- Li and Shogren-Knaak (2008) Li, S., and M. A. Shogren-Knaak (2008), Proceedings of the National Academy of Sciences of the United States of America 105 (47), 18243.
- Lieberman-Aiden et al. (2009) Lieberman-Aiden, E., N. L. van Berkum, L. Williams, M. Imakaev, T. Ragoczy, A. Telling, I. Amit, B. R. Lajoie, P. J. Sabo, M. O. Dorschner, et al. (2009), science 326 (5950), 289.
- Lim and Van Oudenaarden (2007) Lim, H. N., and A. Van Oudenaarden (2007), Nature genetics 39 (2), 269.
- Lister et al. (2009) Lister, R., M. Pelizzola, R. H. Dowen, R. D. Hawkins, G. Hon, J. Tonti-Filippini, J. R. Nery, L. Lee, Z. Ye, Q.-M. Ngo, et al. (2009), nature 462 (7271), 315.
- Liu et al. (2007) Liu, F., E. Tøstesen, J. K. Sundet, T.-K. Jenssen, C. Bock, G. I. Jerstad, W. G. Thilly, and E. Hovig (2007), PLoS computational biology 3 (5), e93.
- Liu et al. (2006) Liu, J., F. Kouzine, Z. Nie, H.-J. Chung, Z. Elisha-Feil, A. Weber, K. Zhao, and D. Levens (2006), The EMBO journal 25 (10), 2119.
- Liu et al. (2011) Liu, Y., C. Lu, Y. Yang, Y. Fan, R. Yang, C.-F. Liu, N. Korolev, and L. Nordenskiöld (2011), Journal of molecular biology 414 (5), 749.
- Liu et al. (2014) Liu, Y., Y. O. Olanrewaju, Y. Zheng, H. Hashimoto, R. M. Blumenthal, X. Zhang, and X. Cheng (2014), Nucleic acids research 42 (8), 4859.
- Liu et al. (2013) Liu, Y., X. Zhang, R. M. Blumenthal, and X. Cheng (2013), Trends in biochemical sciences 38 (4), 177.
- Luger et al. (2012) Luger, K., M. L. Dechassa, and D. J. Tremethick (2012), Nature reviews. Molecular cell biology 13 (7), 436.
- Luger et al. (1997) Luger, K., A. W. Mäder, R. K. Richmond, D. F. Sargent, and T. J. Richmond (1997), Nature 389 (6648), 251.
- Luo et al. (2004) Luo, J., M. Li, Y. Tang, M. Laszkowska, R. G. Roeder, and W. Gu (2004), Proceedings of the National Academy of Sciences of the United States of America 101 (8), 2259.
- MacAlpine and Almouzni (2013) MacAlpine, D. M., and G. Almouzni (2013), Cold Spring Harbor Perspectives in Biology 5 (8), 10.1101/cshperspect.a010207.
- Machado et al. (2015) Machado, A. C. D., T. Zhou, S. Rao, P. Goel, C. Rastogi, A. Lazarovici, H. J. Bussemaker, and R. Rohs (2015), Briefings in functional genomics 14 (1), 61.
- Maizels and Gray (2013) Maizels, N., and L. T. Gray (2013), PLoS genetics 9 (4), e1003468.
- Marchal and Miotto (2015) Marchal, C., and B. Miotto (2015), Journal of cellular physiology 230 (4), 743.
- Marchese and Huarte (2014) Marchese, F. P., and M. Huarte (2014), Epigenetics 9 (1), 21.
- Mayer-Jung et al. (1998) Mayer-Jung, C., D. Moras, and Y. Timsit (1998), The EMBO journal 17 (9), 2709.
- McGhee and Ginder (1979) McGhee, J. D., and G. D. Ginder (1979), Nature 280, 419.
- Micheelsen et al. (2010) Micheelsen, A., N. Mitarai, K. Sneppen, and I. Dodd (2010), Physical Biology 7, 026010.
- Mirny (2011) Mirny, L. A. (2011), Chromosome research 19 (1), 37.
- Mohandas et al. (1981) Mohandas, T., R. Sparkes, and L. Shapiro (1981), Science 211 (4480), 393.
- Morange (2013) Morange, M. (2013), Journal of biosciences 38 (3), 451.
- Mühlbacher et al. (2006) Mühlbacher, F., C. Holm, and H. Schiessel (2006), EPL (Europhysics Letters) 73 (1), 135.
- Mukhopadhyay and Sengupta (2013) Mukhopadhyay, S., and A. M. Sengupta (2013), PLoS Comput Biol 9 (7), e1003121.
- Müller-Ott et al. (2014) Müller-Ott, K., F. Erdel, A. Matveeva, J.-P. Mallm, A. Rademacher, M. Hahn, C. Bauer, Q. Zhang, S. Kaltofen, G. Schotta, et al. (2014), Molecular systems biology 10 (8), 746.
- Mulligan et al. (2015) Mulligan, P. J., E. F. Koslover, and A. J. Spakowitz (2015), Journal of Physics. Condensed Matter: An Institute of Physics Journal 27 (6), 064109.
- Nanney (1958) Nanney, D. (1958), Proceedings of the National Academy of Sciences of the United States of America 44 (7), 712.
- de Napoles et al. (2004) de Napoles, M., J. E. Mermoud, R. Wakao, Y. A. Tang, M. Endoh, R. Appanah, T. B. Nesterova, J. Silva, A. P. Otte, M. Vidal, et al. (2004), Developmental cell 7 (5), 663.
- Nathan and Crothers (2002) Nathan, D., and D. M. Crothers (2002), Journal of molecular biology 316 (1), 7.
- Naughton et al. (2013) Naughton, C., N. Avlonitis, S. Corless, J. Prendergast, I. Mati, P. Eijk, S. Cockroft, M. Bradley, B. Ylstra, and N. Gilbert (2013), Nature Structural & Molecular Biology 20, 387.
- Ngo et al. (2016) Ngo, T. T., J. Yoo, Q. Dai, Q. Zhang, C. He, A. Aksimentiev, and T. Ha (2016), Nature communications 7.
- Nora et al. (2012) Nora, E. P., B. R. Lajoie, E. G. Schulz, L. Giorgetti, I. Okamoto, N. Servant, T. Piolot, N. L. van Berkum, J. Meisig, J. Sedat, et al. (2012), Nature 485 (7398), 381.
- Norregaard et al. (2013) Norregaard, K., M. Andersson, K. Sneppen, P. E. Nielsen, S. Brown, and L. B. Oddershede (2013), Proceedings of the National Academy of Sciences 110 (43), 17386.
- North et al. (2014) North, J. A., M. Šimon, M. B. Ferdinand, M. A. Shoffner, J. W. Picking, C. J. Howard, A. M. Mooney, J. van Noort, M. G. Poirier, and J. J. Ottesen (2014), Nucleic Acids Research 42 (8), 4922.
- Okamoto et al. (2004) Okamoto, I., A. P. Otte, C. D. Allis, D. Reinberg, and E. Heard (2004), Science 303 (5658), 644.
- Olins and Olins (2003) Olins, D. E., and A. L. Olins (2003), Nature Reviews. Molecular Cell Biology 4 (10), 809.
- Ong and Corces (2014) Ong, C.-T., and V. G. Corces (2014), Nature Reviews. Genetics 15 (4), 234.
- Osella et al. (2014) Osella, M., A. Riba, A. Testori, D. Corà, and M. Caselle (2014), Frontiers in Genetics 5.
- Padinhateeri and Marko (2011) Padinhateeri, R., and J. F. Marko (2011), Proceedings of the National Academy of Sciences 108 (19), 7799.
- Paro et al. (1998) Paro, R., H. Strutt, and G. Cavalli (1998), in Novartis Foundation Symposium 214-Epigenetics (Wiley Online Library) pp. 51–66.
- Pepenella et al. (2013) Pepenella, S., K. J. Murphy, and J. J. Hayes (2013), Chromosoma 10.1007/s00412-013-0435-8, PMID: 23996014.
- Pérez et al. (2012) Pérez, A., C. L. Castellazzi, F. Battistini, K. Collinet, O. Flores, O. Deniz, M. L. Ruiz, D. Torrents, R. Eritja, M. Soler-López, et al. (2012), Biophysical journal 102 (9), 2140.
- Poirier et al. (2009) Poirier, M. G., E. Oh, H. S. Tims, and J. Widom (2009), Nature Structural & Molecular Biology 16 (9), 938.
- Pontier and Gribnau (2011) Pontier, D. B., and J. Gribnau (2011), Human Genetics 130 (2), 223.
- Portella et al. (2013) Portella, G., F. Battistini, and M. Orozco (2013), PLoS computational biology 9 (11), e1003354.
- Potoyan and Papoian (2012) Potoyan, D. A., and G. A. Papoian (2012), Proceedings of the National Academy of Sciences 109 (44), 17857, http://www.pnas.org/content/109/44/17857.full.pdf+html .
- Ramdas and Shivashankar (2015) Ramdas, N. M., and G. Shivashankar (2015), Journal of molecular biology 427 (3), 695.
- Rando (2012) Rando, O. J. (2012), Current opinion in genetics & development 22 (2), 148.
- Razin and Cedar (1991) Razin, A., and H. Cedar (1991), Microbiological reviews 55 (3), 451.
- Razin and Cedar (1994) Razin, A., and H. Cedar (1994), Cell 77 (4), 473.
- Recouvreux et al. (2011) Recouvreux, P., C. Lavelle, M. Barbi, N. C. e Silva, E. Le Cam, J.-M. Victor, and J.-L. Viovy (2011), Biophysical journal 100 (11), 2726.
- Ringrose and Paro (2004) Ringrose, L., and R. Paro (2004), Annu. Rev. Genet. 38, 413.
- Rivera and Ren (2013) Rivera, C. M., and B. Ren (2013), Cell 155 (1), 39.
- Rozijn and Tonino (1964) Rozijn, T. H., and G. Tonino (1964), Biochimica et Biophysica Acta 91 (1), 105.
- Saberi et al. (2015) Saberi, S., P. Farré, O. Cuvier, and E. Emberly (2015), BMC bioinformatics 16 (1), 171.
- Sadakierska-Chudy and Filip (2014) Sadakierska-Chudy, A., and M. Filip (2014), Neurotoxicity Research 27 (2), 172.
- Sapountzi and Côté (2011) Sapountzi, V., and J. Côté (2011), Cellular and molecular life sciences: CMLS 68 (7), 1147.
- Sasai et al. (2010) Sasai, N., M. Nakao, and P.-A. Defossez (2010), Nucleic acids research 38 (15), 5015.
- Satake and Iwasa (2012) Satake, A., and Y. Iwasa (2012), Journal of Theoretical Biology 302 (0), 6 .
- Schübeler (2015) Schübeler, D. (2015), Nature 517 (7534), 321.
- Sedighi and Sengupta (2007) Sedighi, M., and A. M. Sengupta (2007), Physical Biology 4 (4), 246.
- Severin et al. (2011) Severin, P. M., X. Zou, H. E. Gaub, and K. Schulten (2011), Nucleic acids research 39, 8740.
- Sexton et al. (2012) Sexton, T., E. Yaffe, E. Kenigsberg, F. Bantignies, B. Leblanc, M. Hoichman, H. Parrinello, A. Tanay, and G. Cavalli (2012), Cell 148 (3), 458.
- Shahbazian and Grunstein (2007) Shahbazian, M. D., and M. Grunstein (2007), Annual review of biochemistry 76, 75.
- Shaytan et al. (2015) Shaytan, A. K., D. Landsman, and A. R. Panchenko (2015), Current opinion in structural biology 32, 48.
- Sheinin et al. (2013) Sheinin, M. Y., M. Li, M. Soltani, K. Luger, and M. D. Wang (2013), Nature communications 4.
- Shivashankar (2011) Shivashankar, G. (2011), Annual review of biophysics 40, 361.
- Shogren-Knaak et al. (2006) Shogren-Knaak, M., H. Ishii, J.-M. Sun, M. J. Pazin, J. R. Davie, and C. L. Peterson (2006), Science 311 (5762), 844.
- Simon and Kingston (2013) Simon, J. A., and R. E. Kingston (2013), Molecular cell 49 (5), 808.
- Sinha and Shogren-Knaak (2010) Sinha, D., and M. A. Shogren-Knaak (2010), The Journal of Biological Chemistry 285 (22), 16572.
- Song et al. (2013a) Song, C.-X., K. E. Szulwach, Q. Dai, Y. Fu, S.-Q. Mao, L. Lin, C. Street, Y. Li, M. Poidevin, H. Wu, et al. (2013a), Cell 153 (3), 678.
- Song et al. (2013b) Song, J., J. Irwin, and C. Dean (2013b), Current Biology 23 (17), R807.
- Spruijt and Vermeulen (2014) Spruijt, C. G., and M. Vermeulen (2014), Nature structural & molecular biology 21 (11), 949.
- Struhl (1999) Struhl, K. (1999), Cell 98 (1), 1.
- Taylor et al. (2013) Taylor, G. C., R. Eskeland, B. Hekimoglu-Balkan, M. M. Pradeepa, and W. A. Bickmore (2013), Genome research 23 (12), 2053.
- Teif et al. (2015) Teif, V. B., N. Kepper, K. Yserentant, G. Wedemann, and K. Rippe (2015), Journal of Physics: Condensed Matter 27 (6), 064110.
- Terweij and van Leeuwen (2013) Terweij, M., and F. van Leeuwen (2013), Frontiers in Life Science 7 (1-2), 63.
- Tessarz and Kouzarides (2014) Tessarz, P., and T. Kouzarides (2014), Nature Reviews. Molecular Cell Biology 15 (11), 703.
- Teves and Henikoff (2014) Teves, S. S., and S. Henikoff (2014), Nature structural & molecular biology 21 (1), 88.
- Thon and Friis (1997) Thon, G., and T. Friis (1997), Genetics 145 (3), 685.
- Tie et al. (2009) Tie, F., R. Banerjee, C. A. Stratton, J. Prasad-Sinha, V. Stepanik, A. Zlobin, M. O. Diaz, P. C. Scacheri, and P. J. Harte (2009), Development (Cambridge, England) 136 (18), 3131.
- Timoshenko et al. (1998) Timoshenko, E., Y. A. Kuznetsov, and K. Dawson (1998), Physical Review E 57 (6), 6801.
- Timp and Feinberg (2013) Timp, W., and A. Feinberg (2013), Nature Reviews Cancer 13, 497.
- Tjong et al. (2012) Tjong, H., K. Gong, L. Chen, and F. Alber (2012), Genome research 22 (7), 1295.
- Travers and Muskhelishvili (2007) Travers, A., and G. Muskhelishvili (2007), EMBO reports 8 (2), 147.
- Tropberger and Schneider (2013) Tropberger, P., and R. Schneider (2013), Nature structural & molecular biology 20 (6), 657.
- Tumbar et al. (1999) Tumbar, T., G. Sudlow, and A. S. Belmont (1999), The Journal of cell biology 145 (7), 1341.
- Venkatasubrahmanyam et al. (2007) Venkatasubrahmanyam, S., W. W. Hwang, M. D. Meneghini, A. H. Y. Tong, and H. D. Madhani (2007), Proceedings of the National Academy of Sciences 104 (42), 16609.
- Venolia et al. (1982) Venolia, L., S. Gartler, E. Wassman, P. Yen, T. Mohandas, and L. Shapiro (1982), Proceedings of the National Academy of Sciences 79 (7), 2352.
- Vinograd et al. (1965) Vinograd, J., J. Lebowitz, R. Radloff, R. Watson, and P. Laipis (1965), Proceedings of the National Academy of Sciences of the United States of America 53 (5), 1104.
- Vlijm et al. (2015) Vlijm, R., M. Lee, J. Lipfert, A. Lusser, C. Dekker, and N. H. Dekker (2015), Cell reports 10, 216.
- Waddington (1942) Waddington, C. H. (1942), Endeavor 1, 18, reprinted in the International Journal of Epidemiology 2012; 41:10-13.
- Waddington (1957) Waddington, C. H. (1957), The strategy of the genes (London: Allen).
- Wang (1971) Wang, J. C. (1971), Journal of molecular biology 55 (3), 523.
- Wang (2002) Wang, J. C. (2002), Nature Reviews Molecular Cell Biology 3 (6), 430.
- Wang and Hayes (2008) Wang, X., and J. J. Hayes (2008), Molecular and Cellular Biology 28 (1), 227.
- Wang et al. (2013) Wang, Z., H. Yao, S. Lin, X. Zhu, Z. Shen, G. Lu, W. S. Poon, D. Xie, M. C. mi Lin, and H. fu Kung (2013), Cancer Letters 331 (1), 1 .
- Wigler et al. (1981) Wigler, M., D. Levy, and M. Perucho (1981), Cell 24 (1), 33.
- Wilkins et al. (2014) Wilkins, B. J., N. A. Rall, Y. Ostwal, T. Kruitwagen, K. Hiragami-Hamada, M. Winkler, Y. Barral, W. Fischle, and H. Neumann (2014), Science (New York, N.Y.) 343 (6166), 77.
- Wolffe and Hayes (1999) Wolffe, A. P., and J. J. Hayes (1999), Nucleic Acids Research 27 (3), 711.
- Wong et al. (2012) Wong, H., H. Marie-Nelly, S. Herbert, P. Carrivain, H. Blanc, R. Koszul, E. Fabre, and C. Zimmer (2012), Current Biology 22 (20), 1881.
- Xu et al. (2006) Xu, E. Y., K. A. Zawadzki, and J. R. Broach (2006), Molecular cell 23 (2), 219.
- Yang and Seto (2007) Yang, X.-J., and E. Seto (2007), Oncogene 26 (37), 5310.
- Yang et al. (2009) Yang, Y., A. P. Lyubartsev, N. Korolev, and L. Nordenskiöld (2009), Biophysical Journal 96 (6), 2082.
- Yang and Hayes (2011) Yang, Z., and J. J. Hayes (2011), Biochemistry 50 (46), 9973.
- Yoo et al. (2016) Yoo, J., H. Kim, A. Aksimentiev, and T. Ha (2016), Nature Communications 7.
- Yusufaly et al. (2013) Yusufaly, T. I., Y. Li, and W. K. Olson (2013), The Journal of Physical Chemistry B 117 (51), 16436.
- Zentner and Henikoff (2013) Zentner, G. E., and S. Henikoff (2013), Nature structural & molecular biology 20 (3), 259.
- Zhang and Wolynes (2014) Zhang, B., and P. G. Wolynes (2014), Proceedings of the National Academy of Sciences 111 (28), 10185.
- Zhang et al. (2014) Zhang, H., X.-J. Tian, A. Mukhopadhyay, K. Kim, and J. Xing (2014), Physical review letters 112 (6), 068101.
- Zhou et al. (2007) Zhou, J., J. Y. Fan, D. Rangasamy, and D. J. Tremethick (2007), Nature structural & molecular biology 14 (11), 1070.
- Zou et al. (2011) Zou, X., W. Ma, I. A. Solov’yov, C. Chipot, and K. Schulten (2011), Nucleic acids research 40 (6), 2747.