A new constraint on the molecular oxygen abundance at
Abstract
We report Karl G. Jansky Very Large Array (VLA) and Atacama Large Millimeter Array (ALMA) spectroscopy in the redshifted molecular oxygen (O2) 56.265 GHz and 424.763 GHz transitions from the gravitational lens towards PKS 183021. The ALMA non-detection of O2 424.763 GHz absorption yields the upper limit cm-2 on the O2 column density, assuming that the O2 level populations are thermalized at the gas kinetic temperature of 80 K. The VLA spectrum shows absorption by the CH3CHO 56.185 GHz and 56.265 GHz lines, with the latter strongly blended with the O2 56.265 GHz line. Since the two CH3CHO lines have the same equilibrium strength, we used the known CH3CHO 56.185 GHz line profile to subtract out the CH3CHO 56.265 GHz feature from the VLA spectrum, and then carried out a search for O2 56.265 GHz absorption in the residual spectrum. The non-detection of redshifted O2 56.265 GHz absorption in the CH3CHO-subtracted VLA spectrum yields cm-2. Our limits on the O2 abundance relative to H2 are then (VLA) and (ALMA). These are times lower than the best previous constraint on the O2 abundance in an external galaxy. The low O2 abundance in the absorber may arise due to its high neutral carbon abundance and the fact that its molecular clouds appear to be diffuse or translucent clouds with low number density and high kinetic temperature.
Subject headings:
Galaxies: individual (PKS183021) — quasars: absorption lines — ISM: abundances1. Introduction
Molecular oxygen (O2) has long been identified as a critical species for the understanding of cooling and energy balance in molecular clouds, and of interstellar chemistry (e.g. Goldsmith & Langer 1978; Goldsmith et al. 2011). In standard models of chemistry, the O2 abundance relative to that of molecular hydrogen is expected to rise to , comparable to the carbon monoxide abundance, at times beyond years (e.g. Herbst & Klemperer 1973; Marechal et al. 1997). Remarkably, despite numerous searches with the Submillimeter Wave Astronomy Satellite, and the Odin and Herschel satellites, O2 has been detected in only two directions in the Galaxy, towards Oph A (Larsson et al. 2007; Liseau et al. 2012) and Orion H2 Peak 1 (Goldsmith et al. 2011; Chen et al. 2014), with abundances (Oph A; Larsson et al. 2007; Liseau et al. 2012) and (Orion H2 Peak 1, whose relatively high abundance has been explained as arising due to a low-velocity C-type shock, with a modest far-ultraviolet radiation field Goldsmith et al. 2011; Chen et al. 2014; Melnick & Kaufman 2015). The majority of searches have yielded low O2 abundances in both diffuse and dark clouds, (e.g. Pagani et al. 2003; Yıldız et al. 2013), two orders of magnitude lower than expected. Although many attempts have been made to explain the paucity of O2 (e.g. Bergin et al. 2000; Charnley et al. 2001; Quan et al. 2008; Hollenbach et al. 2009; Whittet 2010), the low O2 abundances in molecular clouds remain a serious problem for models of chemistry.
For cosmologically-distant galaxies, the O2 lines are redshifted outside the telluric bands and can be observed with ground-based telescopes. Unlike satellite-based O2 emission searches, where the large telescope beam means that the derived is an average over multiple molecular clouds, searches for O2 in absorption towards compact radio sources provide estimates of in individual clouds along the sightline. Such observations are especially interesting for high- systems as they allow studies of interstellar chemistry in much younger galaxies.
The two best targets for a search for redshifted O2 in absorption are the spiral gravitational lenses at and towards B0218+357 and PKS183021, respectively, which show absorption in a variety of molecular species (e.g. Wiklind & Combes 1995, 1996, 1998; Combes & Wiklind 1997; Chengalur et al. 1999; Kanekar et al. 2003; Henkel et al. 2005; Muller et al. 2014). Molecular absorption studies of these galaxies have been used to determine physical conditions in the absorbing clouds (e.g. Henkel et al. 2008; Menten et al. 2008), to estimate the temperature of the microwave background (e.g. Muller et al. 2013), and even to constrain changes in the fundamental constants of physics (e.g. Kanekar 2011; Bagdonaite et al. 2013; Kanekar et al. 2015).
Searches for O2 absorption have been carried out at towards B0218+357 in the O2 368 GHz and 424 GHz transitions (Combes & Wiklind 1995) and the O2 56 GHz and 119 GHz transitions (Combes et al. 1997). These yielded the upper limit cm-2 on the O2 column density, where we have updated the results of Combes et al. (1997) for an O2 excitation temperature equal to the inferred gas kinetic temperature (55 K; Henkel et al. 2005). The H2 column density of the absorber is cm-2 (Gerin et al. 1997; Kanekar & Chengalur 2002); this yields , three orders of magnitude poorer than the limits from Galactic studies (e.g. Pagani et al. 2003).
We have used the Karl G. Jansky Very Large Array (VLA) and the Atacama Large Millimeter Array (ALMA) to search for redshifted O2 absorption in the spiral lens towards PKS183021. In this Letter, we report results from our observations, which yield stringent constraints on the O2 abundance in this galaxy.
2. Observations, data analysis and results
2.1. VLA observations
The Ka-band receivers of the VLA were used in July 2010 to carry out a search for O2 56.2648 GHz absorption at towards PKS 183021 (proposal AK725). The observations used the WIDAR correlator as the backend, with a single 128 MHz band, sub-divided into 256 channels, centred at the redshifted O2 line frequency of 29.835 GHz, and two circular polarizations. Observations of 3C286 and the bright sources 3C273 and J2253+1608 were used to calibrate the flux density scale and the system bandpass, respectively. The total on-source time was 2 hours, with 19 working antennas in the VLA C-configuration
The VLA data were analysed in “classic” aips using standard procedures. Note that PKS 183021 is unresolved by our 19-antenna VLA C-array at Ka-band. After initial calibration, the tasks uvsub and uvlin were used to subtract the image of PKS 183021 from the calibrated visibilities, and then to subtract out any residual continuum by fitting a linear baseline to line-free channels. The residual visibilities were then imaged and the final spectrum covering the redshifted O2 56.265 GHz transition obtained by taking a cut through the spectral cube at the location of PKS 183021.
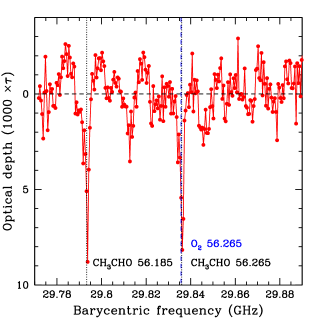
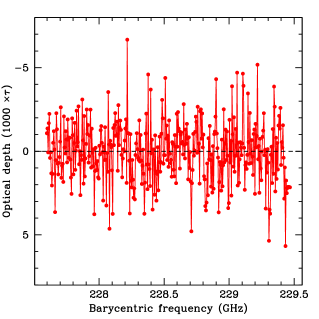
The final VLA spectrum is shown in the left panel of Fig. 1, with optical depth against the S-W image component of PKS 183021 plotted versus heliocentric frequency, in GHz. The root-mean-square (RMS) noise on the spectrum is per 5 km s-1 channel, in optical depth units (assuming that the S-W component contains % of the total flux density of PKS 183021 at these frequencies; e.g. Muller et al. 2011). A strong absorption feature, with an integrated optical depth of km s-1, is clearly visible at the expected frequency of the redshifted O2 56.265 GHz line (indicated by the dashed vertical line). However, it was realized that there is a CH3CHO transition ( E) at a rest frequency of 56.2652 GHz that would be strongly blended with the O2 56.265 GHz line, and that might cause the observed absorption. Further, a second absorption feature is visible at GHz, which could be redshifted CH3CHO absorption, in the A++ transition. If the two features indeed arise from CH3CHO, it would be difficult to draw conclusions about the O2 abundance (although see below). We hence carried out an ALMA search for redshifted O2 424 GHz absorption, to test whether the VLA absorption feature indeed arises from the O2 56.265 GHz line.
2.2. ALMA observations
The Band-6 receivers of ALMA were used in March 2014 to search for redshifted O2 424.7631 GHz absorption at towards PKS 183021. The observations used four 1.875 GHz intermediate frequency (IF) bands, each sub-divided into 3840 channels, and with 2 polarizations. The four IF bands were centred at 225.780 GHz (covering the redshifted O2 424 GHz line frequency), 228.530 GHz, 241.033 GHz and 243.733 GHz. Observations of Titan, J17331304, J19232104, and a few calibrators were used to calibrate the flux density scale and the system bandpass and gain. The total on-source time was hours, with 25 ALMA antennas.
The ALMA data were analysed in two stages, first using the casa pipeline to carry out the initial calibration procedure, and then self-calibrating the data of PKS 183021 in aips. The flux density scale was calibrated using the short-baseline data on Titan, and this was then extended to longer baselines by bootstrapping the data of J19232104. The data of J17331304 and J19232104 were, respectively, used to calibrate the system bandpass and initial gain. After applying the initial calibration in casa, a standard self-calibration procedure was used in aips, with a few rounds of phase-only self-calibration followed by a single round of amplitude-and-phase self-calibration. The final image has a synthesized beam of (with the two strong image components of PKS 183021 marginally resolved), and an RMS noise of mJy/Beam. The task jmfit was used to measure the flux densities of the N-E and S-W image components, via a 2-Gaussian fit to the final image; this yielded flux densities of mJy (N-E) and mJy (S-W). The continuum image of PKS 183021 was then subtracted from the calibrated visibilities of each IF band using the task uvsub, and the residual visibilities of each band were then imaged to produce a spectral cube, after shifting the data to the heliocentric frame. The spectrum for each IF band was then produced via a cut through the cube at the location of the S-W image component. The final spectra have an RMS noise of mJy at the re-sampled velocity resolution of km/s.
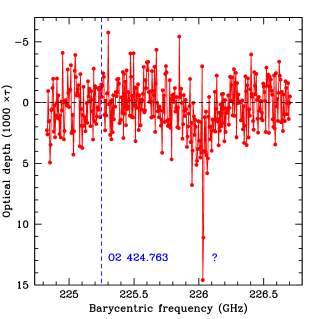
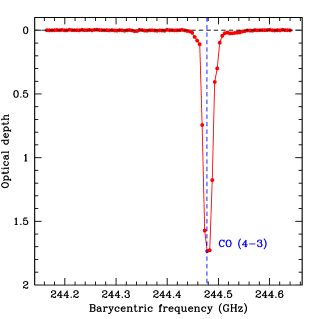
The final Hanning-smoothed and re-sampled spectra from the four ALMA IF bands (after subtracting a second-order baseline) against the S-W component are shown in the four panels of Fig. 2, with optical depth plotted versus heliocentric frequency, in GHz. All spectra are shown after smoothing to, and re-sampling at, a velocity resolution of km s-1 the resolution at which the search for redshifted O2 424 GHz absorption was carried out. No evidence for O2 424 GHz absorption can be discerned in the spectrum in the top left panel of Fig. 2. The final RMS noise on the spectrum is per 6.5 km s-1 channel, in optical depth units.
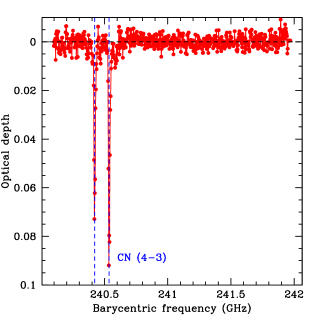
In passing, we note that four absorption features were clearly detected in the ALMA spectra; three of these correspond to the CO (4–3) and two CN (4–3) transitions (see Fig. 2). However, we have been unable to identify the fourth transition, at GHz, i.e. at rest-frame frequencies of 426.257 GHz (at , the absorber being studied here), 792.698 GHz (at , the redshift of PKS 183021; Lidman et al. 1999) or 269.567 GHz (at , the redshift of another known absorber towards PKS 183021; Lovell et al. 1996). The line width is km s-1, similar to that of other high-frequency transitions from the absorber. It appears that this is not a known low-energy transition of a species expected to be abundant in the ISM.
3. Discussion
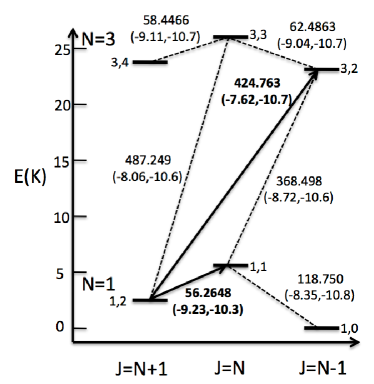
The first question is whether the absorption feature seen at GHz in the VLA spectrum of PKS 183021 arises from O2 or from CH3CHO (or, indeed, some other transition). The lower energy level of the O2 56 GHz and O2 424 GHz transitions is the same (the state; see Fig. 3), permitting a direct comparison between the expected optical depths in the two lines. Of course, the ratio of the line strengths depends on the respective excitation temperatures. In the case of the absorber, the number density and kinetic temperature of the molecular gas have been estimated to be cm-3 and K (Henkel et al. 2008, 2009). For number densities cm-3 and K, the O2 line populations are expected to be thermalized (e.g. Goldsmith et al. 2000), i.e. . For K, the 424 GHz line is expected to be slightly stronger than the 56 GHz line, . Our ALMA limit on the integrated O2 424 GHz optical depth is km s-1, a factor of 5 lower than the integrated optical depth ( km s-1) of the 29.836 GHz absorption feature in the VLA spectrum. We can thus conclusively rule out the possibility that the VLA absorption feature arises from the O2 56 GHz transition. The feature is most likely to arise from the CH3CHO E transition.
The ALMA upper limit to the O2 424 GHz optical depth can be used to place a limit on the total O2 column density. For K, this gives cm-2, at significance.
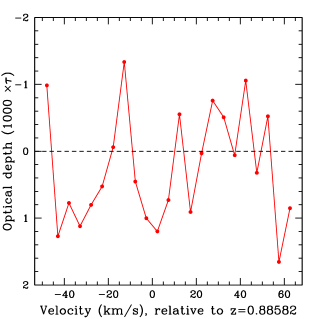
Interestingly, the two CH3CHO transitions ( E and A) seen in the VLA spectrum at, respectively, 29.836 GHz and 29.793 GHz, have the same line strengths. One can hence subtract one from the other to search for any additional absorption arising from the O2 56 GHz line. This was done by using two-point interpolation to resample the CH3CHO A line profile at the measured velocities of the CH3CHO E line, and then subtracting out the resampled line profile from the latter spectrum. This procedure is unlikely to yield any systematic effects, as both CH3CHO line profiles are well-sampled, with at least 3 independent spectral points detected at significance. No absorption is detected in the residual VLA spectrum, yielding an integrated O2 56 GHz optical depth of km s-1, again at significance, against the S-W component of PKS 183021. Again using K, this yields cm-2, a factor of more stringent than the ALMA upper limit.
The H2 column density of the lens has been estimated to be cm-2 (Gerin et al. 1997; Wiklind & Combes 1998). These are broadly consistent with estimates of the total hydrogen column density towards both lensed images from Chandra and ROSAT X-ray spectroscopy, N(H) cm-2 (Mathur & Nair 1997; Dai et al. 2006). Note that, while Muller & Guélin (2008) argue that the H2 column density may be an order of magnitude larger than the above values to account for the detection of species such as HC17O+ and HC15N in absorption, such a high value of appears to be ruled out by the X-ray data. Using a value of cm-2 yields O2 abundances of and from the VLA (CH3CHO-subtracted) O2 56 GHz and the ALMA O2 424 GHz non-detections, respectively. Of course, if the higher H2 column density estimate of Muller et al. (2011) is correct, then our constraints on the O2 abundance would be more stringent by an order of magnitude, i.e. .
Prior to this work, the strongest constraint on the O2 abundance outside the Milky Way was in the absorber towards B0218+357 (see Section 1; Combes et al. 1997). Our VLA upper limit on the O2 abundance in the absorber towards PKS 183021 is a factor of lower than this, and comparable to the measured O2 abundance towards the Orion H2 Peak 1 (Goldsmith et al. 2011). However, our limit is nearly two orders of magnitude weaker than the constraints on, or measurements of, O2 abundances in the Milky Way (e.g. Pagani et al. 2003; Larsson et al. 2007; Liseau et al. 2012). Unfortunately, the high gas kinetic temperatures in the two gravitational lenses, K in the absorber and K in the absorber, imply that it will not be easy to improve upon our present constraint and achieve an O2 abundance sensitivity comparable to those in the Milky Way.
While our O2 abundance constraints for the absorber are less stringent than those in the Galaxy, these are by far the most sensitive constraints in an external galaxy. Further, the Galactic estimates stem from emission studies with differing angular resolution in the O2 and CO lines. The derived abundances are hence an average over multiple molecular clouds with different excitation conditions; this can imply large uncertainties in , of upto two orders of magnitude (e.g. Liseau et al. 2010). The resolution of the present interferometric absorption study is determined by the size of the background radio continuum at the observing frequency. For PKS 183021, the emission from the S-W image at high frequencies ( GHz) arises in a compact source of size mas (Jin et al. 2003; Sato et al. 2013), i.e. transverse size pc at . The O2 abundance estimates are hence likely to be reliable here, as both the O2 and the H2 column densities are inferred from absorption studies probing the same pencil beam towards the S-W image.
Finally, it is clear that we rule out O2 abundances of at significance in the lens towards PKS 183021. As noted earlier, the O2 abundance is expected to reach about this level, comparable to the CO abundance, in standard models of molecular chemistry within years (e.g. Herbst & Klemperer 1973; Marechal et al. 1997). The low O2 abundance thus appears a conundrum, even for the absorber. A possible explanation lies in the high derived abundance of neutral carbon in this system by Bottinelli et al. (2009), who obtain N(C)/N(H2) , somewhat larger than the CO abundance. In typical molecular clouds, O2 is destroyed by the reactions , , and . The high carbon abundance in the absorber is thus unfavourable for the survival of O2, and can account for its low abundance. Bottinelli et al. (2009) also note that the high carbon abundance relative to CO suggests that the absorbing gas arises in translucent clouds, or clouds in an early phase of the transition from diffuse to dense gas, with low densities and mild-UV fields. This is consistent with the high gas kinetic temperature, ( K), and relatively low densities ( cm-3) obtained by Henkel et al. (2009), implying that the absorber at does not arise in a classical dark cloud.
In summary, we have used the VLA and ALMA to obtain tight constraints on the O2 abundance (relative to H2), , in the spiral gravitational lens towards PKS 183021. This is a factor of more stringent than the best previous constraint on the O2 abundance in an external galaxy. We argue that the low O2 abundance in the lens may arise due to its high neutral carbon abundance (resulting in the efficient destruction of O2), and the fact that the absorbing clouds are probably not dark clouds, but instead diffuse or translucent clouds, with relatively low number density and high gas kinetic temperature.
References
- Bagdonaite et al. (2013) Bagdonaite, J., Jansen, P., Henkel, C., et al. 2013, Science, 339, 46
- Bergin et al. (2000) Bergin, E. A., Melnick, G. J., Stauffer, F. R., et al. 2000, ApJ, 539, L129
- Bottinelli et al. (2009) Bottinelli, S., Hughes, A. M., van Dishoeck, E. F., et al. 2009, ApJL, 690, L130
- Charnley et al. (2001) Charnley, S. B., Rodgers, S. D., & Ehrenfreund, P. 2001, A&A, 378, 1024
- Chen et al. (2014) Chen, J.-H., Goldsmith, P. F., Viti, S., et al. 2014, ApJ, 793, 111
- Chengalur et al. (1999) Chengalur, J. N., de Bruyn, A. G., & Narasimha, D. 1999, A&A, 343, L79
- Combes & Wiklind (1995) Combes, F. & Wiklind, T. 1995, A&A, 303, L61
- Combes & Wiklind (1997) —. 1997, ApJ, 486, L79
- Combes et al. (1997) Combes, F., Wiklind, T., & Nakai, N. 1997, A&A, 327, L17
- Dai et al. (2006) Dai, X., Kochanek, C. S., Chartas, G., & Mathur, S. 2006, ApJ, 637, 53
- Drouin et al. (2010) Drouin, B. J., Yu, S., Miller, C. E., Müller, H. S. P., Lewen, F., Brünken, S. & Habara, H. 2010, JQSRT, 111, 1167
- Gerin et al. (1997) Gerin, M., Phillips, T. G., Benford, D. J., et al. 1997, ApJ, 488, L31
- Goldsmith et al. (2011) Goldsmith, P. F., Liseau, R., Bell, T. A., et al. 2011, ApJ, 737, 96
- Goldsmith & Langer (1978) Goldsmith, P. F. & Langer, W. D. 1978, ApJ, 222, 881
- Goldsmith et al. (2000) Goldsmith, P. F., Melnick, G. J, Bergin, E. A., et al. 2000, ApJ, 539, L123
- Henkel et al. (2008) Henkel, C., Braatz, J. A., Menten, K. M., & Ott, J. 2008, A&A, 485, 451
- Henkel et al. (2005) Henkel, C., Jethava, N., Kraus, A., et al. 2005, A&A, 440, 893
- Henkel et al. (2009) Henkel, C., Menten, K. M., Murphy, M. T., et al. 2009, A&A, 500, 725
- Herbst & Klemperer (1973) Herbst, E. & Klemperer, W. 1973, ApJ, 185, 505
- Hollenbach et al. (2009) Hollenbach, D., Kaufman, M. J., Bergin, E. A., & Melnick, G. J. 2009, ApJ, 690, 1497
- Jin et al. (2003) Jin, C., Garrett, M. A., Nair, S., et al. 2003, MNRAS, 340, 1309
- Kanekar (2011) Kanekar, N. 2011, ApJ, 728, L12
- Kanekar & Chengalur (2002) Kanekar, N. & Chengalur, J. N. 2002, A&A, 381, L73
- Kanekar et al. (2003) Kanekar, N., Chengalur, J. N., de Bruyn, A. G., & Narasimha, D. 2003, MNRAS, 345, L7
- Kanekar et al. (2015) Kanekar, N., Ubachs, W., Menten, K. M., et al. 2015, MNRAS, 448, L104
- Larsson et al. (2007) Larsson, B., Liseau, R., Pagani, L., et al. 2007, A&A, 466, 999
- Lidman et al. (1999) Lidman, C., Courbin, F., Meylan, G., Broadhurst, T., Frye, B., & Welch, W. J. W. 1999, ApJ, 514, L57
- Lique (2010) Lique, F. 2010, J. Chem. Phys., 132, 044311
- Liseau et al. (2012) Liseau, R., Goldsmith, P. F., Larsson B., et al. 2012, A&A, 541, A73
- Liseau et al. (2010) Liseau, R., Larsson, B., Bergman, P., et al. 2010, A&A, 510, A98
- Lovell et al. (1996) Lovell, J. E. J., Reynolds, J. E., Jauncey, D. L. et al. 1996, ApJ, 472, L5
- Marechal et al. (1997) Marechal, P., Pagani, L., Langer, W. D., & Castets, A. 1997, A&A, 318, 252
- Mathur & Nair (1997) Mathur, S. & Nair, S. 1997, ApJ, 484, 140
- Melnick & Kaufman (2015) Melnick, G. J. & Kaufman, M. J. 2015, ApJ, 806, 227
- Menten et al. (2008) Menten, K. M., Güsten, R., Leurini, S., et al. 2008, A&A, 492, 725
- Muller et al. (2013) Muller, S., Beelen, A., Black, J. H., et al. 2013, A&A, 551, 109
- Muller et al. (2011) Muller, S., Beelen, A., Guélin, M., et al. 2011, A&A, 535, 103
- Muller et al. (2014) Muller, S., Combes, F., Guélin, M., et al. 2014, A&A, 566, A112
- Muller & Guélin (2008) Muller, S. & Guélin, M. 2008, A&A, 491, 739
- Pagani et al. (2003) Pagani, L., Olofsson, A O. H., Bergman, P., et al. 2003, A&A, 402, L77
- Pickett et al. (1998) Pickett, H. M., Poynter, R. L., Cohen, E. A., Delitsky, M. L., Pearson, J. C. & Müller, H. S. P. 1998, JQSRT., 60, 883
- Quan et al. (2008) Quan, D., Herbst, E., Millar, T. J., et al. 2008, ApJ, 681, 1318
- Remijan et al. (2007) Remijan, A. J., Markwick-Kemper, A., & the ALMA Working Group on Spectral Line Frequencies 2007, Bull. Am. Astr. Soc., 39, #132.11
- Sato et al. (2013) Sato, M., Reid, M. J., Menten, K. M., & Carilli, C. L. 2013, ApJ, 764, 132
- Schöier et al. (2005) Schöier, F. L., van der Tak, F. .F. S., van Dishoeck, E. F. & Black, J. .H. 2005, A&A, 432, 369
- Whittet (2010) Whittet, D. C. B. 2010, ApJ, 710, 1009
- Wiklind & Combes (1995) Wiklind, T. & Combes, F. 1995, A&A, 299, 382
- Wiklind & Combes (1996) —. 1996, A&A, 315, 86
- Wiklind & Combes (1998) —. 1998, ApJ, 500, 129
- Yıldız et al. (2013) Yıldız, U. A., Acharyya, K., Goldsmith, P. F., et al. 2013, A&A, 558, 58