Open charm Spectroscopy and exotic states at LHCb
Antimo Palano111on behalf of the LHCb Collaboration.
INFN and University of Bari, Italy
We present a summary of new experimental results on the status of the charm spectroscopy using inclusive approaches and Dalitz plot analyses of and decays. We also report on a new determination of the quantum numbers.
PRESENTED AT
The 7th International Workshop on Charm Physics (CHARM 2015)
Detroit, MI, 18-22 May, 2015
1 Introduction: Charm meson spectroscopy
The quark model predicts many states with different quantum numbers in limited mass regions [1, 2]. New progress in the understanding of the and spectra in LHCb experiment come from:
-
•
Inclusive studies: study of the reactions ;
-
•
Exclusive studies in Dalitz plot analyses of and decays.
In the following, we remind that states having are defined as having “Natural Parity”, while states having are defined as having “Unnatural Parity”. A resonance decaying to has “Natural Parity”. Labeled with . The system can access to both “Natural Parity” and “Unnatural Parity” states, except for which is forbidden.
In the following, inclusive studies make use of 1 while Dalitz analyses of 3 integrated luminosities.
2 Results on mesons spectroscopy
2.1 Inclusive studies
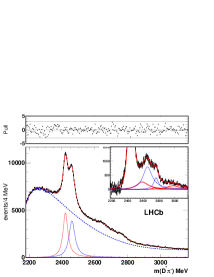
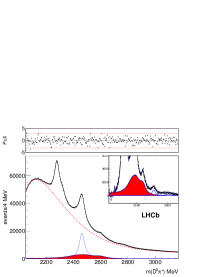
The BaBar [3] and LHCb [4] experiments observe two new natural parity resonances, and , both decaying to and . While the parameters of the are consistent within the two experiments, the mass of the state is shifted down by 40 MeV in the BaBar analysis due to different handling of the feedthrough into the final states. The two states are candidates for being the and .
Adding statistical and systematic uncertainties in quadrature, we obtain a weighted mean values for parameters.
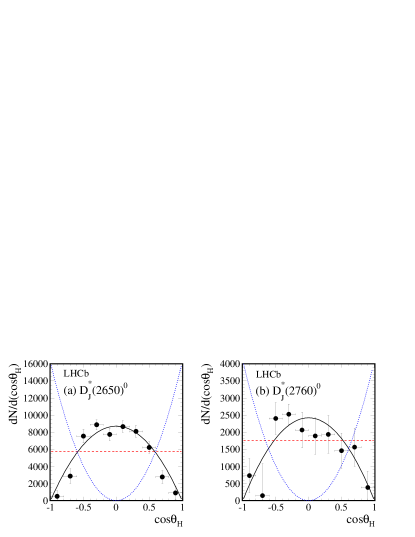
The angular distributions in terms of the helicity angle for the and are shown in fig. 2. They are well fitted by the functions and therefore are consistent with having natural parity.
LHCb experiment also observes three unnatural parity states, , , and , whose angular distributions are shown in fig. 3.
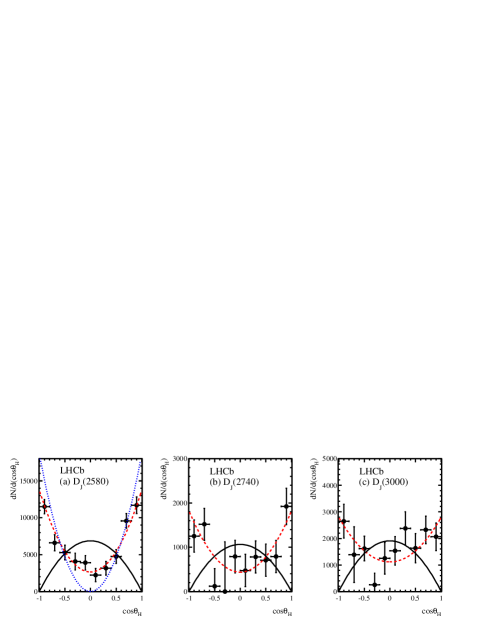
The weighted mean values for parameters, consistent with a assignment, are
The weighted mean values for the parameters are
and is a candidate for being a state. The broad structures observed in the 3000 MeV mass region could be a superposition of several states.
2.2 First observation and Dalitz plot analysis of
To obtain a high signal purity we make use of neural network’s trained by control samples, especially the final state which contains events and shown in fig. 4 (Right). We perform a standard Dalitz plot analysis of the system. In this final state, resonance production can only occur in the system. We plot, in fig. 5, the efficiency corrected and background subtracted mass spectrum, weighted by Legendre polynomial moments and compare with Dalitz plot fit results.
We note that is related to the S-P interference, while is related to the P-D interference. We also observe, as expected, a Clear D-wave in due to the . In the Dalitz analysis a better fit is obtained introducing virtual , and nonresonant contributions. We also observe a clear spin-2 signal and a spin-1 resonance. The resulting resonance parameters and fitted fractions are given in Table 1.
| Resonance | Spin | Parameters | Fit fraction |
|---|---|---|---|
| 0 | PDG | ||
| 2 | , | ||
| 1 | , |
The fit projection with fit result is shown in Fig. 6.
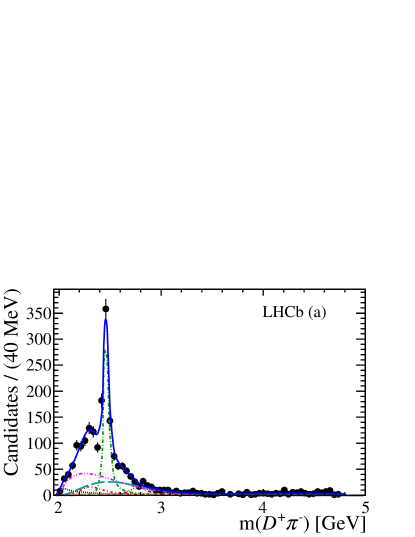
No evidence for a spin-3 resonance is found in this final state.
2.3 Dalitz plot analysis of
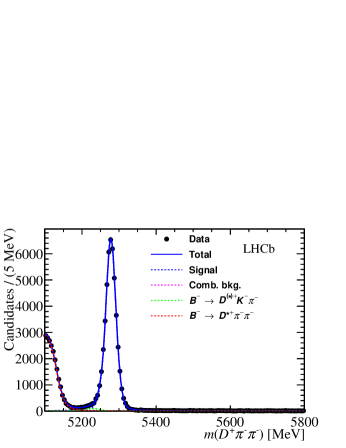
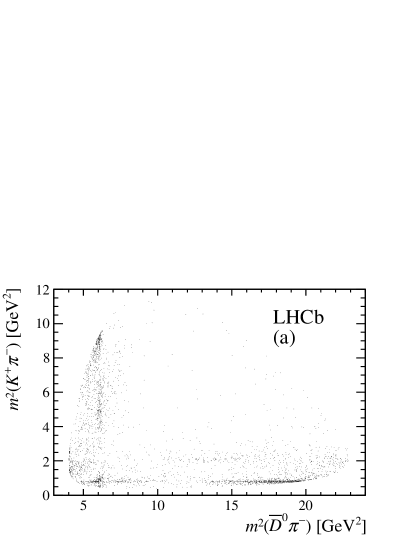
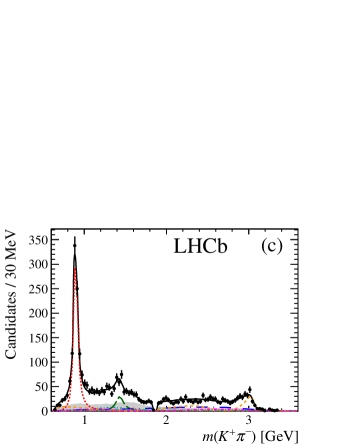
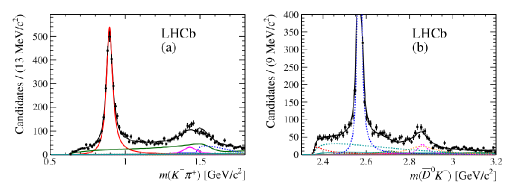
The mass spectrum is shown in Fig. 7 (Left) [6]. The signal contains 9565 events with 97.8% purity. The Dalitz plot is shown in Fig. 7 (Right).
We observe the spin-2 signal along the axis and the spin-1 signal along the axis. The Dalitz plot analysis has been performed using the isobar model and a K-matrix description of the S-wave. Both methods give a good description of the data. The fit projection are shown in Fig. 8. We observe a signal of interference.
The fit projection is shown in Fig. 9.
The decay is dominated, in the system, by S-wave ()% and ()%. In the system, the largest contribution comes from the resonance ()%.
The Dalitz plot analysis requires the presence of an additional resonance with a K-matrix model fitted fraction of ()%. The fitted resonances parameters are given in Table 2.
| Isobar | K-matrix | ||
|---|---|---|---|
Comparing the parameters between inclusive and decays production, we observe some disagreement. Both and resonances are expected in this mass region and inclusive data cannot separate the two natural parity contributions.
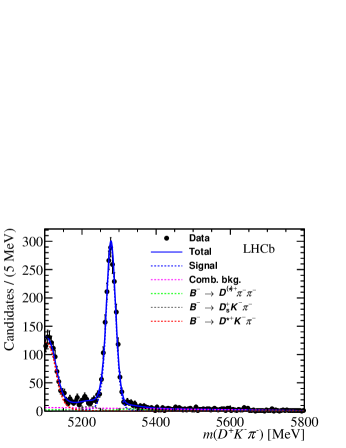
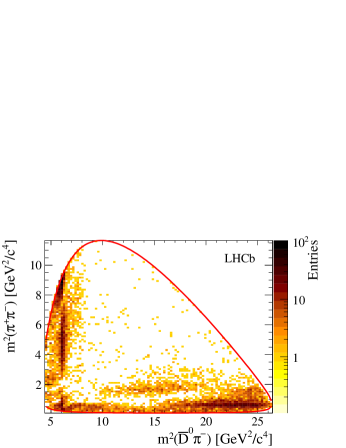
2.4 Dalitz plot analysis of
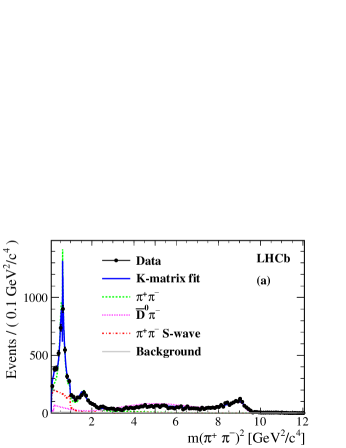
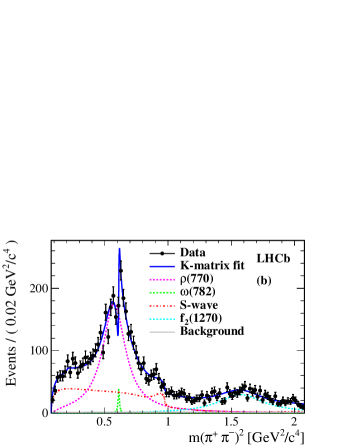
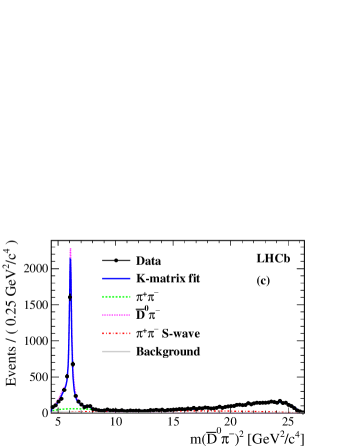
The mass spectrum is shown in Fig. 10(Left) [7]. The signal region contains 2344 events. The fit projections are shown in Fig. 11.
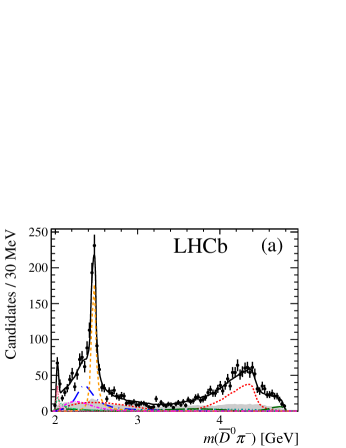
The decay is dominated by intermediate resonance production of ()%, ()% and ()%. These Dalitz analyses obtain new parameters for the broad resonance which are summarized in Table 3.
| Final state | Method | Mass | Width |
|---|---|---|---|
| Free | |||
| Free | |||
| (PDG) |
No evidence is found for additional spin-1 or spin-3 resonances.
3 Results on mesons spectroscopy
3.1 Inclusive studies
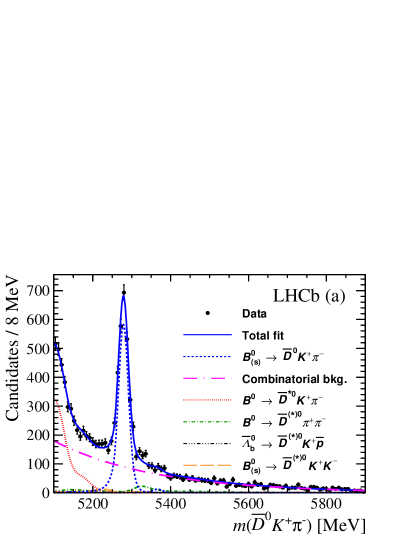
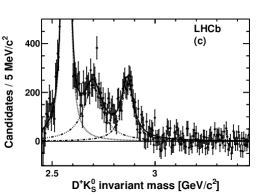
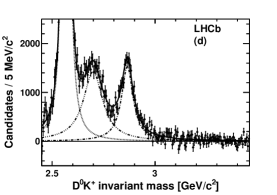
Using samples of and inclusive candidates, the and have been observed with parameters consistent with previous measurements [8]. The background subtracted and mass spectra are shown in Fig. 12.
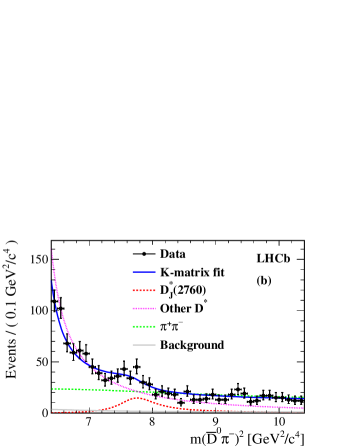
3.2 Dalitz plot analysis of
The Dalitz analysis shows that the largest components are: (), (), S-wave (LASS) () nonresonant (). A signal present in the 2860 MeV mass region which is described by a superposition of a spin-1 and a spin-3 resonance. The fitted resonances parameters are: .
3.3 Determination of the quantum numbers
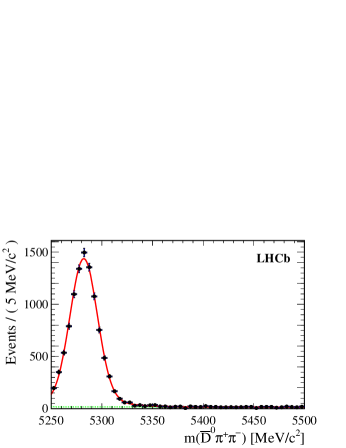
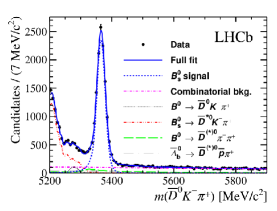
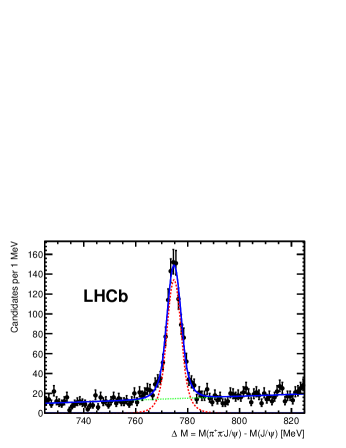
We study the decay with [10] [10]. The quantum numbers of have been determined to be . However it was assumed that the decay is dominated by the lowest values of angular momentum between the decay products. The analysis is repeated here using 3-times the statistics and without any assumption on . The signal for is shown in Fig. 14. The signal for contains with 80% signal purity.
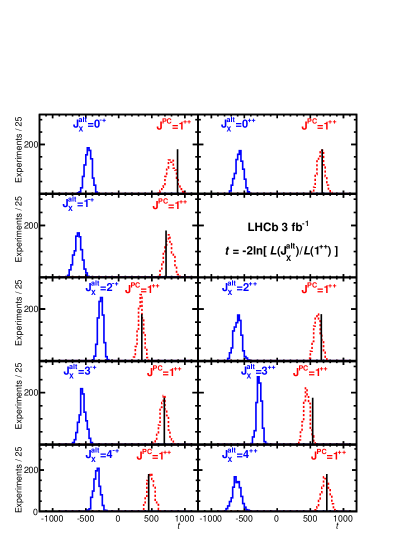
The distributions of the test statistic , for the simulated experiments under the hypothesis and under the hypothesis are shown in Fig. 14 The hypothesis gives the highest Likelihood value with an upper limit of -wave contribution of 4% at 95% C.L.
References
- [1] Godfrey and Isgur, Phys.Rev. D32,189 (1985).
- [2] S. Godfrey and I. T. Jardine, Phys. Rev. D89, 074023 (2014).
- [3] BaBar collaboration, P. del Amo Sanchez, P. et al., Phys. Rev. D82, 111101 (2010).
- [4] LHCb collaboration, R. Aaij et al., JHEP 09, 145 (2013).
- [5] LHCb collaboration, R. Aaij et al., Phys. Rev. D91, 092002 (2015).
- [6] LHCb collaboration, R. Aaij et al., Phys. Rev. D92, 032002 (2015).
- [7] LHCb collaboration, R. Aaij et al., Phys. Rev. D92, 032002 (2015).
- [8] LHCb collaboration, R. Aaij et al., JHEP 1210, 151 (2012).
- [9] LHCb collaboration, R. Aaij et al., Phys. Rev. D 90, 072003 (2014).
- [10] LHCb collaboration, R. Aaij et al., Phys.Rev. bf D92, 011102 (2015)