Ultrafast cooling and heating scenarios for the laser induced phase transition in CuO
Abstract
The multiferroic compound CuO exhibits low temperature magnetic properties similar to antiferromagnetic iron oxides, while the electronic properties have much more in common with the high cuprate superconductors. This suggests novel possibilities for the ultrafast optical excitation of magnetism. On the basis on atomistic spin dynamics simulations, we study the effect of phonon-assisted multimagnon absorption and photodoping on the spin dynamics in the vicinity of the first-order phase transition from collinear to spin-spiral magnetic order. Similar as in recent experiments, we find that for both excitations the phase transition can proceed on the picosecond timescale. Interestingly, however, these excitation mechanisms display very distinct dynamics. Following photodoping, the spin system first cools down on sub-ps timescales, which we explain as an ultrafast magnetocaloric effect. Opposed to this, following phonon-assisted multimagnon excitation the spin systems rapidly heats up and subsequently evolves to the noncollinear phase even under the influence of isotropic exchange interactions alone.
pacs:
75.30.Sg, 75.78.Jp, 75.85.+t, 77.80.BI Introduction
The exploration of the speed limits of phase transitions between macroscopically ordered phases of condensed matter systems has evolved into a central branch of physics, including the study of magnetic phase transitions Kirilyuk et al. (2010); Radu et al. (2011); Li et al. (2013), metal-insulator transitions Rini et al. (2007); Aetukuri et al. (2013); de Jong et al. (2013); Borroni et al. and light-induced superconductivity Fausti et al. (2011); Mankowsky et al. (2014). Moreover, recently, this investigation has even been extended to multiferroic systems, which already in the ground state can exhibit both electric and magnetic order and the coupling between them can give rise to highly non-trivial dynamics, such as large amplitude spin-cycloid rotation Kubacka et al. (2014), colossal dynamical magnetoelectric effect Takahashi et al. (2011), and optically driven ultrafast transition from collinear antiferromagnetic (AFM) to spiral states in the multiferroic CuO Johnson et al. (2012).
Gaining microscopic understanding of laser-induced ultrafast phase transitions is in general a highly challenging computational problem since it requires the modeling of the effect of laser absorption, which implies the simulation of coupled time-evolution of the charge, spin and lattice degrees of freedom. Nevertheless, important insights can be obtained by breaking this problem into smaller parts. For example, laser-induced demagnetization in ferromagnetic (FM) metals was successfully modelled by assuming that the laser pulse heats the electrons far above the Curie temperature on femtosecond (fs) timescales Beaurepaire et al. (1996); Koopmans et al. (2005); Atxitia et al. (2007); Kazantseva et al. (2008); Koopmans et al. (2010); Evans et al. (2015). Moreover, when different FM metals are coupled antiferromagnetically, even laser-heating alone was found to be sufficient to cause spin switching Radu et al. (2011); Mentink et al. (2012); Ostler et al. (2012). On the other hand, the vast majority of intrinsic antiferromagnetic materials are insulating, and for excitation below the charge transfer gap such ultrafast electronic heating is not possible. Nevertheless, ultrafast laser-induced spin-reorentation phase transitions have been observed in iron oxides, for example, and were explained by the coexistence of two metastable spin-orientation phases enabling a spin-inertia driven spin switching mechanism Kimel et al. (2009); Afanasiev et al. (2016) and by laser-induced heating of the phonons Kimel et al. (2004); de Jong et al. (2012).
Here we focus on a different type of spin-reorentation transition: the transition from the collinear AFM phase to the spin-spiral phase in CuO. Opposed to iron oxides, the electronic structure of CuO has much in common with the cuprate high-temperature superconductors, yielding different possible excitation mechanisms. First, in these materials it is well-known that the optical absorption below the charge transfer gap is dominated by phonon-assisted multimagnon (MM) excitation Lorenzana and Sawatzky (1995a, b). Second, for these Mott-insulating materials it was recently predicted that photo doping (PD) can cause an ultrafast modification of the exchange interaction, with an effect comparable to chemical doping Mentink and Eckstein (2014). The latter is particularly interesting since recent investigations show that chemical doping dramatically reduces the temperature at which the antiferromagnetic to spin-spiral phase in CuO occurs Hellsvik et al. (2014). Hence, both MM excitation and PD suggest distinct and rather direct ways to induce this phase transition, which so far have not been explored.
In this article we investigate systematically phonon-assisted MM excitation and PD as mechanisms for the laser-induced phase transition in CuO on the basis of atomistic spin dynamics (ASD) simulations. We demonstrate that both excitation mechanisms can induce the phase transition on picosecond (ps) timescales. Intriguingly, we find that different excitation mechanisms nevertheless induce qualitatively very different dynamics in which the spin system either cools down or heats up on sub ps timescales. In addition, we find that the fastest phase transition occurs for phonon-assisted MM excitation and demonstrate that only in this case the phase transition proceeds even in the absence of anisotropy and dissipation. This suggest that exchange interactions between the spins alone are sufficient to drive the system across the transition, which explains why it can be faster than the dynamics caused by PD.
The paper is organized as follows: The properties of CuO are discussed in Sec. II. The model for CuO and the semiclassical equation of motion method are introduced in Sec. III. The different excitation mechanisms are treated in Sec. IV and we discuss how they are modelled within the ASD simulations. The results from such simulations are presented in Sec. V and compared with the results reported from ultrafast time resolved pump-probe measurements Johnson et al. (2012). A discussion and outlook is given in Sec. VI.
II Magnetic properties of CuO
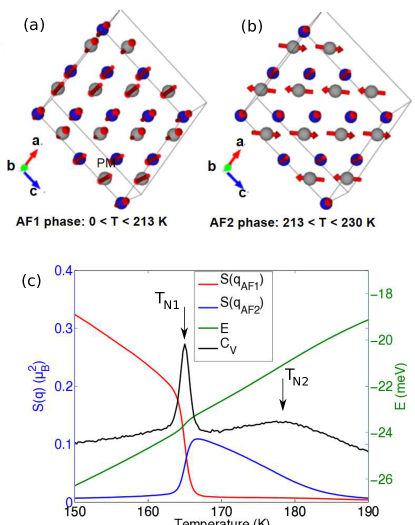
CuO is a Mott insulator and spin compound with a strongly dominant exchange interaction along the crystallographic axis. At high temperatures it is effectively a one-dimensional quantum spin chain with fermionic spinon excitations Jung et al. (2009). Below a weakly first order transition at K, a three dimensional magnetic ordering (AF2) sets in, which over a 17 K temperature span down to K, is an incommensurate spin ordering with nearest neighbour spins at nearly 90 degrees to each other [Fig. 1(b)]. This phase has been identified as multiferroic by Kimura and collaborators Kimura et al. (2008).
Below the first order phase transition at , a commensurate collinear ordering (AF1) is found [Fig. 1(a)]. The ordering of the AF1 and AF2 phases and the overall temperature dependence of the phase diagram [Fig. 1(c)] can be understood in terms of a competition between the frustration among the Heisenberg couplings, which promotes the AF2 configuration, with the biquadratic exchange couplings, which suppresses the non-collinear ordering for temperatures up to Yablonskii (1990); Hellsvik et al. (2014).
The unusually high temperature of the AF2 multiferroic phase has been a strong driving force for experimental and theoretical activity Giovannetti et al. (2011); Jin et al. (2012); Tolédano et al. (2011); Rocquefelte et al. (2013); Villarreal et al. (2012); Staub et al. (2014); Jones et al. (2014a, b); Cao et al. (2015) on cupric oxide, CuO. In this phase the canted magnetism drives improper ferroelectricityGiovannetti et al. (2011); Jin et al. (2012); Tolédano et al. (2011); Rocquefelte et al. (2013); Villarreal et al. (2012); Hellsvik et al. (2014). Whereas the understanding of the equilibrium phase diagram has progressed, it is unclear how the phases evolve into each other upon laser excitation.
Using a free electron laser as source for the probe beam, time-resolved diffraction experiments revealed an ultrafast optically driven phase transition in CuO from the AF1 phase to the AF2 phase Johnson et al. (2012). The diffraction signal gave immediate insight into the evolution in time of the magnetic ordering upon excitation. Measurements were performed at K, slightly below . The process was fluency-dependent up to a saturation fluency for which a minimum transition time of 400 fs was reported. In the next section we discuss the model and methods we use to simulate the dynamics between these two phases.
III Model and methods
The phase competition between the AF1 and AF2 phases in CuO can be captured by a classical spin Hamiltonian which includes the competition between bilinear Heisenberg exchange and biquadratic exchange Yablonskii (1990); Villarreal et al. (2012); Hellsvik et al. (2014).
In recent theoretical studies, density functional theory calculations have been pursued to parametrise these exchange interactions from the total energies for different spin configurations Filippetti and Fiorentini (2005); Jin et al. (2012); Rocquefelte et al. (2013); Hellsvik et al. (2014). For the present investigations the Hamiltonian
is used, where the first term is Heisenberg exchange (exch), the second term is biquadratic exchange (bq) and the third term is anisotropic exchange (ani) and is a classical spin of magnitude .
With the set of parameters reported in Ref. Hellsvik et al. (2014) classical Monte Carlo simulations of Eq. III produce a phase diagram with a first order phase transition at K, and a weakly first order phase transition to the paramagnetic phase at K. In Figure 1(c) is shown the structure factor for the ordering vectors and in a temperature interval around the phase transition at . To go from the commensurate AF1 phase to the incommensurate AF2 phase latent heat needs to be supplied represented by the sharp peak in the specific heat. Except for the underestimation of the Néel temperatures, the phase diagram is in excellent agreement with experiment for the nature of the phases, wave-vector and nature of the order parameters, etc Hellsvik et al. (2014).
Given the good agreement for the equilibrium phase diagram, we will use ASD simulations based on the Hamiltonian Eq. (III) as minimal approach for studying the nonequilibrium spin dynamics across the AF1-AF2 phase transition. Within ASD, the dynamics of a spin system is modelled semiclassically by the stochastic Landau-Lifshitz equation (SLL)
| (2) |
which describe the motion of the classical spins in an effective magnetic field , calculated from . is a stochastic magnetic field with a Gaussian distribution. By the fluctuation-dissipation theorem, the magnitude of is related to the dimensionless damping parameter .
We note that the dynamics we investigate are at temperatures high enough to allow for the assumption of a classical renormalised regime Chakravarty et al. (1989) which renders Eq. (2) applicable even for a spin system.
To characterise the dynamics across the phase transition we focus on two observables. First, we compute the equal time correlation function where is the spin-spin correlation function for spins displaced by the vector . indicate averaging over the cell and over different realisations of the initial spin excitations and the heat bath. shows two peaks at and which we use to monitor the evolution from one phase to the other.
Second, we monitor the evolution of the temperature of the spin system. To this end, we sample the energy defined as the difference
| (3) |
between the instantaneous total energy and the total energy when spin is relaxed keeping all other spins fixed. The energy is minimised, for fixed orientation of the other spins , with a gradient descent algorithm. The temperature is then obtained by fitting the histogram of to the Boltzmann distribution
| (4) |
where is the Boltzmann constant and is the inverse temperature. The method of fitting the histograms of to a Boltzmann distribution assumes that the spins are close to the local equilibrium state and is therefore only applicable for moderate temperatures. We have investigated the range of applicability in more detail in Appendix A, including a quantitative comparison with an alternative approach for computing the spin temperature Ma et al. (2010), and found our approach to be sufficiently accurate to capture the temperature regime studied below.
IV Excitation mechanisms
In general, the light-matter interaction in the optical regime relies on the electric dipole approximation. This makes the direct excitation of the magnetic degrees of freedom in materials with inversion symmetry weak or even forbidden. In addition, different from magnetic metals, in which the rapid heating of the electrons turns out to be very efficient for driving (sub) picosecond phase transitions Mentink et al. (2012); Ostler et al. (2012), CuO is insulating and photon absorption does not seem to be relevant on first sight. Below, however, we discuss three distinct mechanisms which indirectly couple light to the magnetic degrees of freedom. All mechanisms rely, on one way or the other, on modulation of exchange interactions , either by joint excitation of a phonon (phonon assisted infrared absorption), by changing the electronic distribution (photodoping) or by modulating with an electric field (two-magnon Raman scattering). We then estimate their efficiency based on literature values and explain how we effectively include these excitation mechanisms within atomistic spin dynamics simulations.
IV.1 Infrared absorption
In materials with inversion symmetry, such as CuO in the AF1 phase, the excitation of magnons by absorption of infrared photons is in principle electric dipole forbidden. However, the inversion symmetry can be broken by the excitation of a phonon which enables simultaneous excitation of an even number of magnons Lorenzana and Sawatzky (1995a, b). This mechanism dominates for infrared absorption in CuO layers and similar magnetically ordered insulators and is described by the Hamiltonian:
| (5) |
Here describes the electric field of light, the phonon displacements and the exchange interaction modified by the electric field and the phonon displacements. Further indicates nearest neighbor sites with respect to site , while and are the phonon dipole moment and phonon Hamiltonian, respectively.
Expanding the Hamiltonian to linear order in the electric field and the ionic displacement one obtains the dipole moment for Cartesian component ,
Neglecting the small ferroelectric effects in the multiferroic phase the second term is zero in the presence of inversion symmetry. The third term is the one responsible for the phonon-assisted absorption of magnons.
We observe that the phonon breaks the inversion symmetry as required for non-vanishing electric-dipole transitions. We note that opposed to the AF1 phase, the AF2 phase exhibits a ferroelectric dipole moment which in principle facilitates a direct coupling of the electric field component of the laser pulse to the magnetic degrees of freedom through the second term of Eq. (IV.1). However, such coupling is only effective once the system is already in the AF2 phase, whereas we want to address how fast the reorientation of the spin system from the collinear AF1 phase to the incommensurate spin spiral AF2 phase can occur. In any case, we expect spontaneous inversion symmetry effects to be much smaller since the involved dipoles are minute. Indeed, they are beyond the sensibility of X-ray experiments, for example, and are only detected through the macroscopic polarization.
Clearly, it would be very interesting to study the complete dynamics of the spin and lattice degrees of freedom that follow from Eq. (5). This, however, is very challenging since it requires at least to go beyond the semi-classical description for the spin dynamics. In addition, augmenting classical phonon dynamics and their coupling to ASD would only slightly change the spin dynamics in the regard that displacement (spin) correlations renormalize the magnon (phonon) frequencies, but this spin-phonon coupling is not strong enough to change the order of time-scales of the transversal spin reorientation. Therefore, here we focus exclusively on the classical spin dynamics following phonon-assisted MM excitation and omit solving directly the time evolution during the excitation of magnons and phonons.
To effectively take this excitation into account we assume each absorbed photon creates a phonon plus multiple two-magnon excitations. We neglect the first and simulate the second by an exchange process. Namely, we interchange a fraction of nearest neighbor spins along the -direction, which has the dominant exchange coupling in CuO Jung et al. (2009); Hellsvik et al. (2014). To estimate the fraction of spin pairs that are interchanged, we use that in middle-IR absorption measurements with photon energies below the charge transfer gap, the absorption coefficient of CuO was determined to be of the order 200 cm-1 (Ref. Moskvin et al. (1994)), with corresponding skin penetration depth cm. Defining the average number of absorbed photons per unit volume , the number of absorbed photons per Cu atom can be computed through the expression
| (7) |
with taking values for laser fluency 7 mJ/cm2 (28 mJ/cm2). Each absorbed photon cause multiple phonon assisted magnons pairs Perkins et al. (1998); Lorenzana and Sawatzky (1995a, b). Therefore, in the simulations that are presented in Sec. V, a fraction in the range of randomly chosen pairs of spins are interchanged. This yields a small but finite probability also for four magnon scattering which take place when two pairs of exchanged spins are in the immediate vicinity of each other.
IV.2 Photo doping
Photon absorption at frequencies comparable to the gap can cause PD, in which the electronic distribution is changed, which subsequently can modify the exchange couplings and spin ordering Li et al. (2013); Mentink and Eckstein (2014). For Mott-insulators like CuO, PD comprises the creation of holon-doublon pairs (h-d pairs) and their relaxation within the Hubbard bands causes a rapid reduction of the ordered spin moment and the exchange parameter within a few tens of the hopping time Mentink and Eckstein (2014). Since electron hopping occurs on the fs time scale, PD has the potential of being fast enough for launching spin dynamics that lead to the phase transition on (sub) picosecond time scales. In a classical picture, a simplified way to account for the presence of h-d pairs is by introducing vacancies. Alternatively, one can introduce reduced local moments [similarly to a reduction of ], in conjunction with reduced exchange parameters. For small concentrations we have checked these approaches produce qualitatively very similar results. In the simulation results presented below, we have therefore restricted ourselves to the introduction of vacancies. Note that, we could also let the next nearest neighbor (NNN) couplings of the vacancy be changed, in line with the second order Henley effect in Ref. Hellsvik et al. (2014), but for simplicity we limited ourselves to the introduction of vacancies alone. In addition, we assume that the vacancies persist over time scales longer than the ASD simulation time ( ps), in order to isolate purely the effect of PD alone. For the concentration of vacancies, values in the range have been used (c.f. the case of phonon assisted MM excitation). We concentrate on short times and assume a long life time of the holon-doublon pairs. The later decay of the holon-doublon pairs through MM decay Lenarčič and Prelovšek (2013); Golež et al. (2014); Dal Conte et al. (2015) constitutes another channel for driving the spin dynamics, which we neglected for simplicity.
IV.3 Two-magnon Raman scattering
For comparison to the above mentioned absorption mechanisms, we also discuss briefly the two-magnon Raman scattering. Here an incoming photon scatters inelastically in an interaction where two magnons with opposite momenta are created Fleury and Loudon (1968). For high cuprate superconductors, the assignment of the spectral weight to two-magnon scattering has been used to determine the values of the leading exchange interactions in the CuO4 planes Lyons et al. (1988). For CuO, two-magnon scattering was discussed as contributions to the broad peak features around 1100 and 2000 cm-1 Irwin et al. (1990). The fraction of spins which are excited in CuO through two-magnon Raman scattering during a pump pulse can be estimated from the cross-sections known from spontaneous Raman scattering on chemically related copper oxides Knoll et al. (1996). For YBa2Cu3O6.0 it was reported Knoll et al. (1996) a two-magnon Raman cross section cm per unit volume of sample. In the pump probe experiment of Johnson et al. (2012) the pump laser wave length nm corresponds to a photon energy of eV. The intensity of the pump laser was such that over the 40 fs FWHM pulse lengths, a fluency of , 14 or 28 mJ/cm2 were incident on the sample. The 4 atom primitive cell of CuO has volume nm3. The total number of photons per unit area impinging the surface of the sample during one pulse is given by . Multiplying by and by the volume per Cu, and integrating over sr we obtain the total number of spin flips created per Cu.
| (8) |
For a fluency mJ/cm2 a fraction of two-magnon spin flips is obtained, a value too small to allow inelastic scattering to be of relevance for driving the spin system from the AF1 to the AF2 phase. Therefore, below we restrict ourselves to the spin dynamics that follows from the absorption of light.
V Simulation results
In this section we present simulations results in which spin system is excited with a varying a fraction of interchanged spin-pairs and photo-induced vacancies, simulating phonon-assisted MM excitation and PD, respectively. In addition, for comparison we simulate the response to sudden changes of the temperature, mimicking phonon-heating. For each case, we have followed the evolution in time of . All simulations have been performed with the UppASD software Skubic et al. (2008) for a supercell with periodic boundary conditions. For this cell size has peaks for and and we use the values for these wave vectors to follow the time evolution of the magnetic ordering. We approximate the excitations to be instantaneous, i.e at time we swap a fraction of pairs of spins or include a fraction of vacancies in the system. This is a simplification of the actual optical excitation process which takes place for an incident laser pulse that is few tenths of femtoseconds long and the photon-matter interaction developing over multiples of electronic hopping times.
In order to clarify the microscopic origin of the observed dynamics, below we will present simulations with and without coupling to the heat bath. The latter gives undamped () evolution. Under the isotropic Hamiltonian , both angular momentum and total energy are constants of motion, but energy redistribution between different degrees of freedom can still give rise to non-trivial dynamics. At finite damping, , energy can dissipate to the environment, enabling the system to relax back to the initial state.
We also note that, despite CuO being an antiferromagnet, at finite temperature there is anyhow a small but finite net magnetic moment, given the circumstance that the thermally fluctuating spins do not fully compensate each other to give identically zero total magnetic moment. In equilibrium at K, the magnetic moment in Langevin dynamics at times ps fluctuates with an amplitude . Using the semi-implicit solver SIB Mentink et al. (2010) for the Landau-Lifshitz equation, the total magnetic moment and its vector components are conserved to in evolution over the simulation interval ps. The total energy of the spin system is conserved to meV over the same simulation time.
The protocol for the simulations has been the following: Starting from the K AF1 configuration the spins are relaxed to be in equilibrium with a finite temperature. The system then evolves for times ps, to check that spontaneous AF1-AF2 transitions do not occur, before it is excited at and subsequently evolved to extract the spin dynamics caused by photo-excitation.
V.1 Phonon-assisted multimagnon excitation
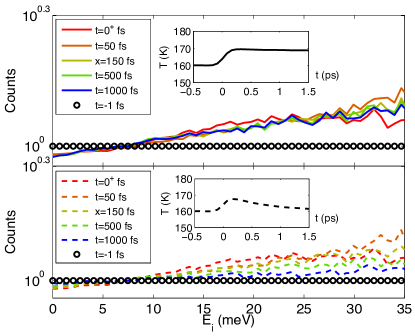
In this section results are reported from simulations of phonon assisted MM excitation, which dominates for photon energies below the charge transfer gap. First, we focus on simulations at low temperature K, to show that this causes a nonequilibrium distribution of the spins which are elucidated by histograms of energies. Second, we show simulation results for the initial temperature K, from which MM excitation turns out to be sufficient to drive the system in the AF2 phase.
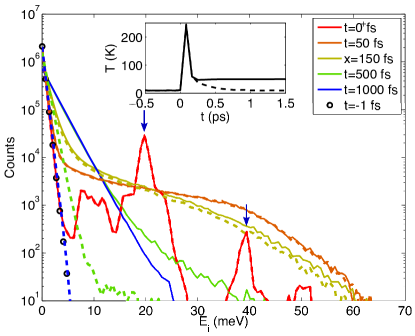
In Figure 2 is shown the (full lines) and (dashed lines) evolution in time of the energy histogram after an excitation of (the concentration of pairs of spins exchanged) of two-magnon excitations of a spin system initially in thermal equilibrium at K. Upon excitation, energy is injected to the spin system which is brought to a non-equilibrium state. The black symbols display the energy distribution before pump when the spin system is in equilibrium. The red lines for fs (after pump) have distinct peaks (marked out with blue arrows) indicating the energy and the intensities of two- and four-magnon excitations. The insets show the evolution of the temperature of the system, with the first few data points displaying least mean square values of the temperature in a non-equilibrium regime in which temperature is not well defined. After ps the system has equilibrated to a new temperature of K. We note that this relaxation to a Boltzmann distribution took place in microcanonical evolution. For an isolated spin system this kind of equilibration can occur due to the non-linearities inherit in the Landau-Lifshitz equation, but it is not possible for e.g. for an integrable system like an isolated system of coupled harmonic oscillators.
For the case of evolution with finite damping (dashed lines), the excitation energy added to the system dissipates as the system relax to be in equilibrium with the heat bath. For times up to fs, the evolution of the energy distribution is very similar to the system with undamped dynamics. At ps, the equilibration is essentially complete and the system has reached a temperature of K.
We emphasize that at low temperature distinct peaks corresponding to two- and four-magnon excitation can be seen, indicated by arrows in Figure 2. Below we study MM excitation at much higher temperatures. In that case, there is already a large fraction of spins that have energies that are of the same magnitude as the energy of a MM excitation event and therefore such sharp features are absent. From this we understand that the average energy given to the spins by MM excitation is in itself temperature dependent. It will take a higher value at low temperatures where the spins are close to perfectly collinear, but a reduced value at intermediate and high temperatures where the effective fields are reduced by thermal fluctuations.
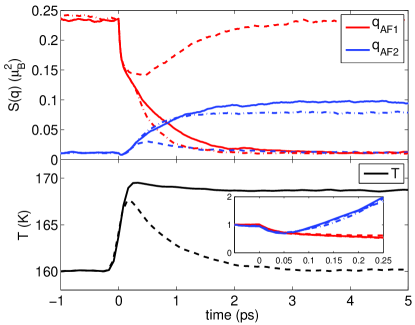
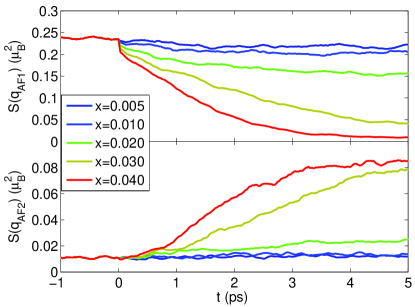
The excitation did not bring enough energy to push the K system into the AF2 regime, which over few ps relaxed to 50 (10) K for undamped (damped) dynamics. The situation changes if the excitation takes place closer to . In Figure 3 is shown the results of a simulation where the spin system, initially in thermal equilibrium at K is excited with an excitation intensity of and evolved in undamped (full lines) and damped (dashed lines) dynamics. For the system undergoes a phase transition from AF1 to AF2 and reaches new equilibrium values of the order parameters after approximately 4 ps. An initial decay can be observed for and also for , due to the circumstance that the sublattice magnetization is reduced abruptly in the two-magnon excitation. This can be observed more directly in the inset, in which the normalised quantities and are plotted. We note that within the insets time window of 0.25 ps, the and dynamics depart only slightly from each other. As expected the decrease of is monotonous, but also decay over the first 50 fs. For times fs, is increasing as the spin system enters the transition into the AF2 phase.
For a system in equilibrium at K, the change to the shape of the energy histogram on two-magnon excitation is much less drastic as compared to the K case shown in Fig. 2. We visualize the deviation from the thermal equilibrium distribution by plotting the relative histogram , where is the bin count of the :th bin, as shown in Fig. 5 for [Fig. 5(a)] and [Fig. 5(b)]. This clearly demonstrates that, similar as in the K case, MM spin flips cause high energy excitations in the spin system. The quota becomes very noisy at at energies larger than 35 meV, given the overall low bin counts in this energy range. Therefore is shown for the energy interval 0 to 35 meV.
The lower panel of Figure 3 showns the evolution in time of the temperature which for the case of undamped dynamics initially peaks at K. In the subsequent evolution the temperature decreases to K as latent heat is necessary to enter the AF2 phase. As can be seen in Fig. 4, the energy injected by the initial excitation brings the average spin energy to the value which in thermal equilibrium corresponds to a temperature K. For the order parameters and display a transient reduction and enhancement respectively, and the system relaxes back to K within 4 ps.
In order to analyse how large influence anisotropic terms in the Hamiltonian have on the phase transition, we have pursued simulations for the isotropic Hamiltonian . The instantaneous excitation of the spin system at in form of swaps of neighboring spins, inject energy but conserve the angular momentum since the swap operator is rotationally invariant. The dash-dotted lines in Fig. 3 show the evolution in time of and respectively in simulation of . Interestingly, we find that the transition between the AF1 phase and the AF2 phase after the initial injection of energy by MM excitation, can proceed solely through redistribution of energy between the isotropic degrees of freedom.
Johnson et al. Johnson et al. (2012) investigated the dependence of a switching delay time , defined as the onset time at which the ratio would start to grow, on the pump fluency. Starting from lower fluencies decreased with increasing fluency, but it was not possible to push it below fs. In the present model for phonon assisted MM excitation, the analogue of pump fluency is the concentration of initial spin pairs flipped. Results from simulations with initial concentration in the range are presented in Fig. 6 and we make the following observations: i) In the interval fs, the rate of growth of is very similar in the fluency ranges , with being the concentration that for ps has given the highest value of . For fluencies and the spin system is over pumped and brought closer towards the paramagnetic region. ii) The inset displays the evolution for the first 250 fs and reveal that the time , at which start to grow after the initial dip, takes the value fs independent of fluency.
For the excitation it can be observed in the inset of Fig. 3, that the onset time is not affected by damping . This can be understood from the following considerations: With the AF1 as reference spin configuration, the highest precession frequencies occur when summing up the exchange interactions to meV for THz, which gives for the corresponding frequency of damping motion THz, or a minimum relaxation time fs. Thus, damping motion will give significant influence only after hundreds of fs, but will for be negligible for the first few hundred fs of evolution, constituting a regime of exchange interaction driven dynamics Mentink et al. (2012); Baryakhtar et al. (2013).
V.2 Photodoping induced dynamics
The energy of the incident 800 nm laser pump pulse used in Johnson et al. (2012) coincide with the charge transfer (CT) gap of CuO. In this regime one can expect that in addition to the previous mechanism also PD to be an important excitation mechanism. Photodoping will have two effects. If the incident energy is larger than the CT gap the excited particle hole pairs will relax by the emission of magnon and phonon excitations until they reach the minimum possible unbound CT energy or an excitonic bound state. This transfer of energy can be modelled as a heating of the phononic system or the magnetic system and in our simulations corresponds to a rise of the bath temperature in the damped dynamics. On the other hand, as we will show below, there is a magnetocaloric effect due to the sudden change in the magnetic Hamiltonian. We will analyze this effect in detail neglecting the heating effect, which can be minimized by tuning the incoming laser to the minimum CT energy. The temperature induced dynamics is discussed below.
As discussed in detail in Ref. Hellsvik et al. (2014), in equilibrium one of the main effects of dilution of the spin system is to shift the magnetic phase diagram to lower temperatures. Below we present nonequilibrium studies in which we follow the dynamics after sudden dilution. The concentration of vacancies is chosen in a similar range as the pairs of interchanged spins discussed with results of phonon assisted MM excitation.
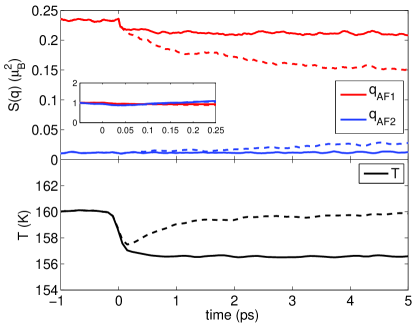
In Fig. 7 is shown the evolution of the order parameters and following on PD that introduces vacancies. Full lines show evolution at . The ordering experience an abrupt step as the sublattice moment is reduced, correlated with the reduced number of spins in the system. After this initial drop, levels out to a slightly reduced value and is, over the time scale of 5 ps, not affected. Interestingly, the temperature of the system experiences a rapid drop from K to 157 K. We explain this drop as an ultrafast magnetocaloric effect, where the role of the external magnetic field is replaced by the change of the effective exchange field on the spins by photo-doping.
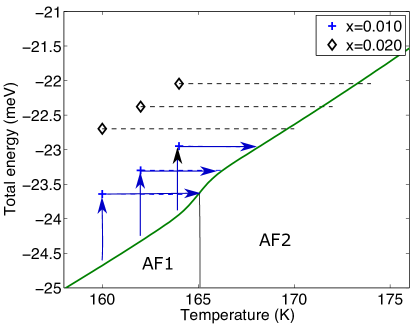
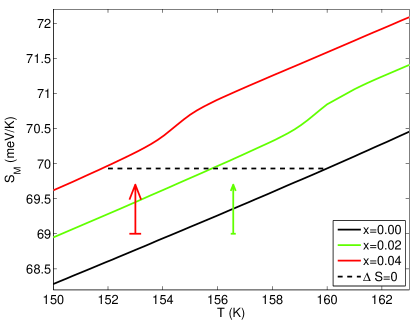
To substantiate our interpretation of a magnetocaloric effect we computed the equilibrium entropy per spin as a function of for different vacancy concentrations , and the magnetic heat capacity is computed from the energy fluctuations . Here the total entropy is divided by the actual number of spins in the sample, not the number of sites. To obtain an accurate account of the entropy differences, we matched to in the high-temperature paramagnetic phase at K, while K.
The curves shown in Fig. 8 are qualitatively similar to what would be obtained for independent spins in a uniform magnetic field, with the upper curves corresponding to lower magnetic field. The reason is that both the magnetic field and the interaction constrain the spin motion, effectively reducing the fluctuating phase space and lowering the entropy. Taking a reference spin, after a sudden quench of the magnetic field (classical magnetocaloric effect) or after a neighbor is eliminated (present simulation) the spin finds itself in a state which is much more ordered than what it should be at the initial temperature. This corresponds to the adiabatic jump shown in Fig. 8 with the dashed line. The vertical arrows show the temperatures obtained in spin dynamics simulations after internal equilibration in dynamics, with the error bars stemming from the temporal fluctuations and the measurement of the temperature (see Appendix A). We can observe that in the spin dynamics simulations the temperatures are lowered almost but not quite as much as the constant entropy jump implies.
Similar rapid drops in the temperature are obtained with changing the strength of the Heisenberg exchange interaction (data not shown). In this case we can estimate the effective field seen by a single spin simply from , with the dominant Heisenberg exchange interaction Hellsvik et al. (2014), yielding T at and an efficiency of 0.15 K/T. This is comparable but slightly lower than the efficiencies reported in Ma and Dudarev (2014) and references therein, which is understandable since our results are obtained deep in the ordered phase of CuO.
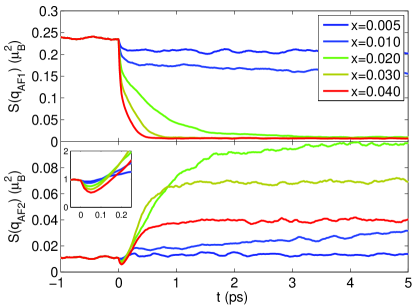
Although the system thermalizes even at , is not affected on the time scale of the simulation. Hence, despite the fact that the introduction of vacancies reduces , our simulations do not show the evolution to a different phase. We can understand this since the shift in is smaller than the magnetocaloric effect. Indeed, already at we obtain a reduction to K from the magnetocaloric effect, while the lowering of to a similar value requires a higher vacancy concentration, Hellsvik et al. (2014). This observation implies that the phase transition due to the lowering of is possible when the system is kept in contact with the bath at the original temperature K after the introduction of vacancies. To confirm this, we have carried out simulations at , shown by dashed lines in Fig. 7. In this case is further reduced after the fast initial drop, while increases. For vacancy concentration , the growth of is still modest over the first ps, probably because the system is still to close to and the transition is broadened due to finite size effects. As shown in Fig. 9, a stronger response can be seen for doping up to , for which also decays completely and we are thus able to see the full transition on the time scale of our simulation. These results demonstrate that, opposed to the case of phonon-assisted MM excitation, the timescale at which the transition can occur is limited by the coupling to the bath and is therefore slower.
V.3 Temperature induced dynamics
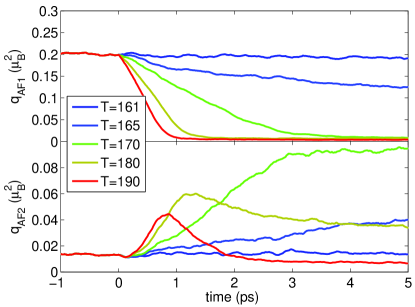
For comparison, we also simulated direct heat-induced spin dynamics, mimicking a rapid rise of the phonon temperature by laser absorption. One can also take the bath to be excited e-h pairs in which case, in first approximation, this effect should be added to the one of the PD computed above. The response of the spin system to an abrupt change of temperature at is shown in Fig. 10. For simplicity, we consider a stepwise change of temperature which should give an indication of how fast the system react to heating. Unlike the case of phonon assisted MM excitation and PD, there is no instantaneous drop in the sublattice magnetization, so that and are continuous at . This absence of instantaneous decrease in the structure factor is in contrast with the diffraction data in Johnson et al. (2012). We conclude that this mechanism is not playing an important role in those experiments.
The speed of the response to heating is parametrically dependent on the strength of the damping parameter Hellsvik et al. (2008). Among the set of temperatures included in Fig. 10, the highest value of occur for K. Unlike the case of phonon assisted MM excitation, the rate with which grows, is increasing for stronger pump fluence.
VI Conclusions
In summary, we have explored how excitation with femtosecond pulses of near infrared laser light can drive a phase transition in CuO. On the basis of atomistic spin dynamics simulations we have found that photo-doping causes an ultrafast cooling of the spin system which can be understood as a magnetocaloric effect, where the collinear antiferromagnetic order drops rapidly and the spiral phase grows at a much slower rate due to the photo-induced reduction of . Phonon-assisted MM excitation increase the temperature of the spin system on sub-picosecond timescales and a rapid drop of both collinear and spin spiral order is found, while only the spiral order grows gradually after this rapid drop. The phonon-assisted MM excitation is found to cause the fastest phase transition and we argue that this is related to the fact that only for this case the phase transition can proceed by pure exchange-driven spin dynamics Mentink et al. (2012); Baryakhtar et al. (2013) alone. In addition, estimates of the quantum mechanical efficiency of inelastic light scattering was found to be too low to play any significant role in driving the phase transition, while a purely temperature driven dynamics cannot reproduce the initial abrupt reduction of the order parameters observed in Johnson et al. (2012).
Finally, by comparing our results with experiments, we observe that only phonon-assisted MM absorption captures the experimentally observed saturation with the pump fluence and the simultaneous initial drop of both collinear and spin-spiral order. On the other hand, in the experiments the timespan over which this simultaneous drop takes place is a factor of 8 larger than in our simulations. There are several reasons for this discrepancy. First, the simulations assume an instantaneous excitation, whereas experimental laser pulses in Johnson et al. (2012) had a FWHM maximum of 40 fs. Moreover, in the experiment the laser pump pulse coincided with the band gap of the material, wherefore both PD decay and phonon assisted MM excitation are possible excitation mechanisms. On the level of ASD simulations, it is not straightforward to realistically model of the interplay between these processes. In addition, we assume that concentration of vacancies remains constant on the timescale considered, while the eventual decay of the photo-excited holon-doublon pairs can also proceed through MM excitation Lenarčič and Prelovšek (2013); Golež et al. (2014); Dal Conte et al. (2015). Such decay can therefore drive the spin dynamics across the phase transition in a similar fashion as phonon-assisted MM excitation. Our simulations also show that these processes are not captured by a simple increase of the bath temperature. Similar to the absorption of photons we expect that an initial state with MM excitation captures this effect more realistically. Clearly, modeling the simultaneous charge and spin dynamics goes beyond the semi-classical approach employed here and would be very interesting to pursuit in future investigations. It would be also interesting to repeat the experiments varying the laser wave-length to the middle-IR region to verify our predictions in the pure MM regime.
Acknowledgements.
We acknowledge fruitful discussions with D. Bossini, M. Eckstein, A. V. Kimel, R. V. Mikhaylovskiy, and S. Bonetti. J. H. is supported by the Swedish Research Council. J. H. M acknowledges funding from the Nederlandse Organisatie voor Wetenschappelijk onderzoek (NWO) by a Rubicon and VENI Grant and from the European Research Council (ERC) Advanced Grant No. 338957 FEMTO/NANO. J.L was partially supported by the Italian MIUR under project PRINRIDEIRON-2012X3YFZ2. We acknowledge computational resources and support from CINECA and from SNIC.Appendix A Measuring temperature
In this appendix we compare two different methods to sample the temperature of a spin system: the method developed by Ma et al. Ma et al. (2010) and our own construction based on energy histograms. The former has the advantage that a closed expression is used to measure the spin temperature (Eq. 16 of Ref. Ma et al. (2010), in the following referred to as the MDSW equation), whereas an advantage of the latter is that the histograms also indicate how long it takes before the spin system is in internal equilibrium as signified by deviations from a Boltzmann distribution.
In Figure 11(a) are shown in log-linear graphs the histograms for , and 300 K. For K the bin count deviate from a straight line only for the highest energies, and the histogram can be fitted to a Boltzmann distribution with temperature K. At K the deviation is more pronounced and the fitted temperature is slightly underestimated, K. At higher temperatures the deviation is even more pronounced.
For the bilinear in spin Hamiltonian , i.e. omitting the biquadratic interaction , the MDSW equation measures the temperature accurately also in the paramagnetic phase, as shown in the lower inset of Fig. 11(b). However, for our full Hamiltonian the histogram method works better and does at a K undershoot with only 1 K. The deviations of the two methods from the heat bath temperatures are displayed in the upper inset of Fig. 11(b). For the simulations discussed in Sec. V, temperatures are in the range K and the histogram method is expected to be sufficiently accurate.

References
- Kirilyuk et al. (2010) A. Kirilyuk, A. V. Kimel, and T. Rasing, Rev. Mod. Phys. 82, 2731 (2010).
- Radu et al. (2011) I. Radu, K. Vahaplar, C. Stamm, T. Kachel, N. Pontius, H. A. Dürr, T. A. Ostler, J. Barker, R. F. L. Evans, R. W. Chantrell, A. Tsukamoto, A. Itoh, A. Kirilyuk, T. Rasing, and A. V. Kimel, Nature 472, 205 (2011).
- Li et al. (2013) T. Li, A. Patz, L. Mouchliadis, J. Yan, T. A. Lograsso, I. E. Perakis, and J. Wang, Nature 496, 69 (2013).
- Rini et al. (2007) E. G. Rini, M. N. Rao, S. L. Chaplot, N. K. Gaur, and R. K. Singh, Phys. Rev. B 75, 214301 (2007).
- Aetukuri et al. (2013) N. B. Aetukuri, A. X. Gray, M. Drouard, M. Cossale, L. Gao, A. H. Reid, R. Kukreja, H. Ohldag, C. A. Jenkins, E. Arenholz, K. P. Roche, H. A. Dürr, M. G. Samant, and S. S. P. Parkin, Nat. Phys. 9, 661 (2013).
- de Jong et al. (2013) S. de Jong, R. Kukreja, C. Trabant, N. Pontius, C. F. Chang, T. Kachel, M. Beye, F. Sorgenfrei, C. H. Back, B. Bräuer, W. F. Schlotter, J. J. Turner, O. Krupin, M. Doehler, D. Zhu, M. A. Hossain, A. O. Scherz, D. Fausti, F. Novelli, M. Esposito, W. S. Lee, Y. D. Chuang, D. H. Lu, R. G. Moore, M. Yi, M. Trigo, P. Kirchmann, L. Pathey, M. S. Golden, M. Buchholz, P. Metcalf, F. Parmigiani, W. Wurth, A. Föhlisch, C. Schüßler-Langeheine, and H. A. Dürr, Nat. Mater. 12, 882 (2013).
- (7) S. Borroni, E. Baldini, A. Mann, C. Arrell, F. van Mourik, J. Teyssier, J. Lorenzana, and F. Carbone, arXiv:1507.07193 [cond-mat.mtrl-sci] .
- Fausti et al. (2011) D. Fausti, R. I. Tobey, N. Dean, S. Kaiser, A. Dienst, M. C. Hoffmann, S. Pyon, T. Takayama, H. Takagi, and A. Cavalleri, Science 331, 189 (2011).
- Mankowsky et al. (2014) R. Mankowsky, A. Subedi, M. Först, S. O. Mariager, M. Chollet, H. T. Lemke, J. S. Robinson, J. M. Glownia, M. P. Minitti, A. Frano, M. Fechner, N. A. Spaldin, T. Loew, B. Keimer, A. Georges, and A. Cavalleri, Nature 516, 71 (2014).
- Kubacka et al. (2014) T. Kubacka, J. A. Johnson, M. C. Hoffmann, C. Vicario, S. de Jong, P. Beaud, S. Grübel, S.-W. Huang, L. Huber, L. Patthey, Y.-D. Chuang, J. J. Turner, G. L. Dakovski, W.-S. Lee, M. P. Minitti, W. Schlotter, R. G. Moore, C. P. Hauri, S. M. Koohpayeh, V. Scagnoli, G. Ingold, S. L. Johnson, and U. Staub, Science 343, 1333 (2014).
- Takahashi et al. (2011) Y. Takahashi, R. Shimano, Y. Kaneko, H. Murakawa, and Y. Tokura, Nat. Phys. 8, 121 (2011).
- Johnson et al. (2012) S. L. Johnson, R. A. de Souza, U. Staub, P. Beaud, E. Möhr-Vorobeva, G. Ingold, A. Caviezel, V. Scagnoli, W. F. Schlotter, J. J. Turner, O. Krupin, W.-S. Lee, Y.-D. Chuang, L. Patthey, R. G. Moore, D. Lu, M. Yi, P. S. Kirchmann, M. Trigo, P. Denes, D. Doering, Z. Hussain, Z.-X. Shen, D. Prabhakaran, and A. T. Boothroyd, Phys. Rev. Lett. 108, 037203 (2012).
- Beaurepaire et al. (1996) E. Beaurepaire, J.-C. Merle, A. Daunois, and J.-Y. Bigot, Phys. Rev. Lett. 76, 4250 (1996).
- Koopmans et al. (2005) B. Koopmans, J. J. M. Ruigrok, F. Dalla Longa, and W. J. M. De Jonge, Phys. Rev. Lett. 95, 1 (2005).
- Atxitia et al. (2007) U. Atxitia, O. Chubykalo-Fesenko, N. Kazantseva, D. Hinzke, U. Nowak, and R. W. Chantrell, Appl. Phys. Lett. 91, 232507 (2007).
- Kazantseva et al. (2008) N. Kazantseva, D. Hinzke, U. Nowak, R. Chantrell, U. Atxitia, and O. Chubykalo-Fesenko, Phys. Rev. B 77, 184428 (2008).
- Koopmans et al. (2010) B. Koopmans, G. Malinowski, F. Dalla Longa, D. Steiauf, M. Fähnle, T. Roth, M. Cinchetti, and M. Aeschlimann, Nat. Mater. 9, 259 (2010).
- Evans et al. (2015) R. F. L. Evans, U. Atxitia, and R. W. Chantrell, Phys. Rev. B 91, 144425 (2015).
- Mentink et al. (2012) J. H. Mentink, J. Hellsvik, D. V. Afanasiev, B. A. Ivanov, A. Kirilyuk, A. V. Kimel, O. Eriksson, M. I. Katsnelson, and T. Rasing, Phys. Rev. Lett. 108, 057202 (2012).
- Ostler et al. (2012) T. A. Ostler, J. Barker, R. F. L. Evans, R. W. Chantrell, U. Atxitia, O. Chubykalo-Fesenko, S. El Moussaoui, L. Le Guyader, E. Mengotti, L. J. Heyderman, F. Nolting, A. Tsukamoto, A. Itoh, D. Afanasiev, B. A. Ivanov, A. M. Kalashnikova, K. Vahaplar, J. Mentink, A. Kirilyuk, T. Rasing, and A. V. Kimel, Nat. Commun. 3, 666 (2012).
- Kimel et al. (2009) A. V. Kimel, B. A. Ivanov, R. V. Pisarev, P. A. Usachev, A. Kirilyuk, and T. Rasing, Nat. Phys. 5, 727 (2009).
- Afanasiev et al. (2016) D. Afanasiev, B. A. Ivanov, A. Kirilyuk, T. Rasing, R. V. Pisarev, and A. V. Kimel, Phys. Rev. Lett. 116, 1 (2016).
- Kimel et al. (2004) A. Kimel, A. Kirilyuk, A. Tsvetkov, R. Pisarev, and T. Rasing, Nature 429, 2 (2004).
- de Jong et al. (2012) J. A. de Jong, I. Razdolski, A. M. Kalashnikova, R. V. Pisarev, A. M. Balbashov, A. Kirilyuk, T. Rasing, and A. V. Kimel, Phys. Rev. Lett. 108, 157601 (2012).
- Lorenzana and Sawatzky (1995a) J. Lorenzana and G. A. Sawatzky, Phys. Rev. Lett. 74, 1867 (1995a).
- Lorenzana and Sawatzky (1995b) J. Lorenzana and G. A. Sawatzky, Phys. Rev. B 52, 9576 (1995b).
- Mentink and Eckstein (2014) J. Mentink and M. Eckstein, Phys. Rev. Lett. 113, 057201 (2014).
- Hellsvik et al. (2014) J. Hellsvik, M. Balestieri, T. Usui, A. Stroppa, A. Bergman, L. Bergqvist, D. Prabhakaran, O. Eriksson, S. Picozzi, T. Kimura, and J. Lorenzana, Phys. Rev. B 90, 014437 (2014).
- Giovannetti et al. (2011) G. Giovannetti, S. Kumar, A. Stroppa, J. van den Brink, S. Picozzi, and J. Lorenzana, Phys. Rev. Lett. 106, 026401 (2011).
- Jung et al. (2009) S. Jung, J. Kim, E. Choi, Y. Sekio, T. Kimura, and J. Lorenzana, Phys. Rev. B 80, 140516 (2009).
- Kimura et al. (2008) T. Kimura, Y. Sekio, H. Nakamura, T. Siegrist, and A. P. Ramirez, Nat. Mater. 7, 291 (2008).
- Yablonskii (1990) D. Yablonskii, Phys. C Supercond. 171, 454 (1990).
- Jin et al. (2012) G. Jin, K. Cao, G.-C. Guo, and L. He, Phys. Rev. Lett. 108, 187205 (2012).
- Tolédano et al. (2011) P. Tolédano, N. Leo, D. D. Khalyavin, L. C. Chapon, T. Hoffmann, D. Meier, and M. Fiebig, Phys. Rev. Lett. 106, 257601 (2011).
- Rocquefelte et al. (2013) X. Rocquefelte, K. Schwarz, P. Blaha, S. Kumar, and J. van den Brink, Nat. Commun. 4, 2511 (2013).
- Villarreal et al. (2012) R. Villarreal, G. Quirion, M. L. Plumer, M. Poirier, T. Usui, and T. Kimura, Phys. Rev. Lett. 109, 167206 (2012).
- Staub et al. (2014) U. Staub, R. A. de Souza, P. Beaud, E. Möhr-Vorobeva, G. Ingold, A. Caviezel, V. Scagnoli, B. Delley, W. F. Schlotter, J. J. Turner, O. Krupin, W.-S. Lee, Y.-D. Chuang, L. Patthey, R. G. Moore, D. Lu, M. Yi, P. S. Kirchmann, M. Trigo, P. Denes, D. Doering, Z. Hussain, Z. X. Shen, D. Prabhakaran, a. T. Boothroyd, and S. L. Johnson, Phys. Rev. B 89, 220401 (2014).
- Jones et al. (2014a) S. P. P. Jones, S. M. Gaw, K. I. Doig, D. Prabhakaran, E. M. Hétroy Wheeler, A. T. Boothroyd, and J. Lloyd-Hughes, Nat. Commun. 5, 3787 (2014a).
- Jones et al. (2014b) S. P. P. Jones, N. C. Wurz, M. Failla, D. Prabhakaran, C. F. McConville, and J. Lloyd-Hughes, Phys. Rev. B 90, 064405 (2014b).
- Cao et al. (2015) K. Cao, F. Giustino, and P. G. Radaelli, Phys. Rev. Lett. 114, 197201 (2015).
- Filippetti and Fiorentini (2005) A. Filippetti and V. Fiorentini, Phys. Rev. Lett. 95, 086405 (2005).
- Chakravarty et al. (1989) S. Chakravarty, B. I. Halperin, and D. R. Nelson, Phys. Rev. B 39, 2344 (1989).
- Ma et al. (2010) P.-W. Ma, S. L. Dudarev, A. A. Semenov, and C. H. Woo, Phys. Rev. E 82, 031111 (2010).
- Moskvin et al. (1994) A. S. Moskvin, N. N. Loshkareva, Y. Sukhorukov, M. A. Sidorov, and A. A. Samokhvalov, J. Exp. Theor. Phys. 78, 518 (1994).
- Perkins et al. (1998) J. D. Perkins, R. J. Birgeneau, J. M. Graybeal, M. A. Kastner, and D. S. Kleinberg, Phys. Rev. B 58, 9390 (1998).
- Lenarčič and Prelovšek (2013) Z. Lenarčič and P. Prelovšek, Phys. Rev. Lett. 111, 016401 (2013).
- Golež et al. (2014) D. Golež, J. Bonča, M. Mierzejewski, and L. Vidmar, Phys. Rev. B 89, 165118 (2014).
- Dal Conte et al. (2015) S. Dal Conte, L. Vidmar, D. Golež, M. Mierzejewski, G. Soavi, S. Peli, F. Banfi, G. Ferrini, R. Comin, B. M. Ludbrook, L. Chauviere, N. D. Zhigadlo, H. Eisaki, M. Greven, S. Lupi, A. Damascelli, D. Brida, M. Capone, J. Bonča, G. Cerullo, and C. Giannetti, Nat. Phys. 11, 421 (2015).
- Fleury and Loudon (1968) P. Fleury and R. Loudon, Phys. Rev. 166, 514 (1968).
- Lyons et al. (1988) K. B. Lyons, P. A. Fleury, J. P. Remeika, A. S. Cooper, and T. J. Negran, Phys. Rev. B 37, 2353 (1988).
- Irwin et al. (1990) J. Irwin, J. Chrzanowski, T. Wei, D. Lockwood, and A. Wold, Phys. C Supercond. 166, 456 (1990).
- Knoll et al. (1996) P. Knoll, M. Mayer, W. Brenig, and C. Waidacher, J. Low Temp. Phys. 105, 383 (1996).
- Skubic et al. (2008) B. Skubic, J. Hellsvik, L. Nordström, and O. Eriksson, J. Phys. Condens. Matter 20, 315203 (2008).
- Mentink et al. (2010) J. H. Mentink, M. V. Tretyakov, A. Fasolino, M. I. Katsnelson, and T. Rasing, J. Phys. Condens. Matter 22, 176001 (2010).
- Baryakhtar et al. (2013) V. G. Baryakhtar, V. I. Butrim, and B. A. Ivanov, JETP Lett. 98, 289 (2013).
- Ma and Dudarev (2014) P.-W. Ma and S. L. Dudarev, Phys. Rev. B 90, 024425 (2014).
- Hellsvik et al. (2008) J. Hellsvik, B. Skubic, L. Nordström, B. Sanyal, O. Eriksson, P. Nordblad, and P. Svedlindh, Phys. Rev. B 78, 144419 (2008).