An Application of the Stereoscopic Self-Similar-Expansion Model to the Determination of CME-Driven Shock Parameters
keywords:
Coronal Mass Ejections, Interplanetary, Solar Wind, Shock Waves1 Introduction
Introduction
Coronal mass ejections (CME) are large–scale eruptions of plasma and magnetic-field that originate from the Sun and propagate in the interplanetary medium.
They arise above photospheric bipolar regions and travel outwards with speeds between a few hundreds and more than (Yashiro et al., 2004; Cremades and
Bothmer, 2004).
When the speed of the CME in the rest frame of the solar-wind exceeds the local Alfvén speed, a magnetohydrodynamics (MHD) shock is driven ahead of the
CME leading edge. Turbulence is generated in the post–shock region, the shock sheath, resulting in fluctuations of the magnetic-field and plasma parameters
(Gosling and McComas, 1987).
Already in the 1970s, by comparing CME speeds at a few solar radii above the Sun to the Alfvén speed at those heights,
it was realized that CMEs can drive shocks in the corona (see, e.g, Vourlidas and
Ontiveros 2009 and references therein).
With the help of today’s advanced coronagraphs, under suitable circumstances, these shocks can be detected in white-light images due to the density compression ahead of the CME (Vourlidas, 2006).
Although indirect evidence of the presence of shocks can be identified, for example, in metric Type–II radio bursts and in
observations of deflected ambient streamers, it was not until 2003 that the first direct detection of a CME-driven shock was announced.
Vourlidas
et al. (2003) employed an MHD model of the observed event, and they were able to show that the bright feature in the coronagraph images
indeed corresponds to a shock in their simulation. Ontiveros and
Vourlidas (2009) subsequently reported the analysis of LASCO fast events (),
showing that in of the cases CME-driven shocks could be detected in the white-light images. Remote sensing observations of shocks can be exploited to determine shock
parameters, such as compression ratio and Mach number (Maloney and Gallagher, 2011), and even further to estimate the coronal magnetic-field strength
(Gopalswamy and
Yashiro, 2011; Poomvises
et al., 2012).
These estimates rely on early models for location of the Earth’s bow shock derived by Spreiter, Summers, and
Alksne (1966) and
Seiff (1962), and subsequently modified and extended to the low-Mach-number regime (Farris and
Russell, 1994;
Russell and
Mulligan, 2002). Gopalswamy and
Yashiro (2011) and Poomvises
et al. (2012) derived the quantities necessary
for the calculation of the shock parameters via forward modeling using respectively a circular geometry and the graduated-cylindrical-shell (GCS) model by Thernisien, Howard, and
Vourlidas (2006).
In the present work, we employ inverse-modeling techniques to verify whether they allow the determination of the heliospheric-shock parameters and a prediction of their in-situ values.
For this purpose we analyze white-light observations from the Sun Earth Connection Coronal and Heliospheric Investigation (SECCHI) suite onboard the NASA
Solar Terrestrial Relations Observatory mission (STEREO: Kaiser et al., 2008; Howard et al., 2008) of the 03 April 2010 CME and its associated shock
(Möstl
et al., 2010; Liu et al., 2011). We separately determine the CME and shock kinematics and the time evolution of the
standoff distance, the compression ratio, and the Mach number. Their values are then extrapolated to , where they can be compared to in-situ Advanced Composition Explorer
measurements (ACE: Stone et al., 1998).
The data processing and analysis techniques employed are presented in Section
\irefImage_processing. Section \irefMethods describes the models used in this work for the CME and shock kinematics and for the calculation of the shock parameters;
their application to the 03 April 2010 CME is illustrated in Section \irefResults. In Section \irefdiscussion we discuss the applicability of the SSSEM for the derivation of the shock parameters.
Section \irefconclusions provides a summary and conclusions.
2 Data and Image Processing
Image_processing
The NASA/STEREO mission, launched on 25 October 2006, consists of the twin spacecraft,
STEREO-A (Ahead) and -B (Behind) orbiting the Sun at 1 AU. STEREO-A precedes the Earth in its orbit, while STEREO-B follows it. The separation angle
between each spacecraft and Earth increases by about per year. A package of five telescopes, the SECCHI suite,
is mounted onboard both STEREO-A and -B, and provides observations of the solar corona from the solar disk to distances beyond 1 AU (Howard et al., 2008).
The EUVI instrument images the Sun’s atmosphere in four different wavelengths, from the upper chromosphere to the corona; COR1 and COR2 are two nested
coronagraphs with fields of view covering respectively the ranges from to , and from to . HI1 and HI2 are heliospheric
imagers observing the inner heliosphere up to distances larger than 1 AU. HI1 has a field of , centered at from the Sun
along the Sun–Earth line; HI2 has a field of view of , centered at along the Sun–Earth line.
Combined observations from the instruments of the SECCHI suite allow us
to follow the evolution of solar-wind features from their origin near the solar surface up to beyond 1 AU (Davis et al., 2009).
Multi–point observations, moreover, provide an unprecedented insight on the three-dimensional structure and evolution of CMEs,
and allow the determination of their kinematics free from projection effects.
In order to use STEREO data for scientific analysis, processing of the images is required.
Flat–field and vignetting correction, CCD bias subtraction, and correction for optical distortion are some of the calibration procedures
applied to COR2 observations (for a complete description of COR images processing visit hesperia.gsfc.nasa.gov/ssw/stereo/secchi/doc/cor_prep.html).
For HI1 and HI2 observations, background stray-light removal is necessary to reveal the presence of CMEs (Davies
et al., 2009; Eyles et al., 2009).
The visibility of faint features in white-light observations can be enhanced by image differencing, a technique in which each image is obtained by subtracting two subsequent snapshots
(Sheeley et al., 1999). What is shown in difference images is the change in brightness between
two consecutive snapshots: white features lead black ones in the direction of motion, the former corresponding to plasma which, in the later image, has propagated
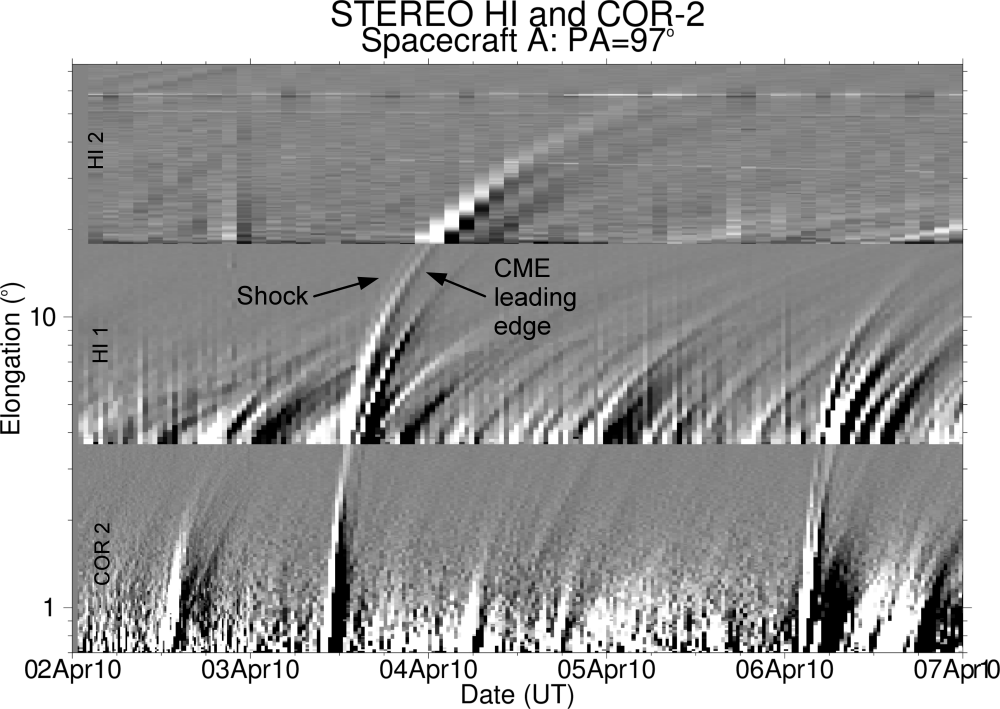
further away from the Sun. Time–elongation plots (also known as j-maps) are built by stacking slices of difference images cut at a fixed position angle, and they can be used to determine the
kinematics of CMEs (Davies
et al., 2009); structures propagating in the imagers’
field of view appear as curved tracks in time–elongation plots (see Figure \ireffig:Jmap). In the interpretation of Sheeley et al. (1999) the shape of such curves is due to the apparent
acceleration/deceleration seen by an observer measuring the angular distance (i.e. the elongation ) of a feature that propagates away from the Sun at constant speed.
3 Methods
Methods
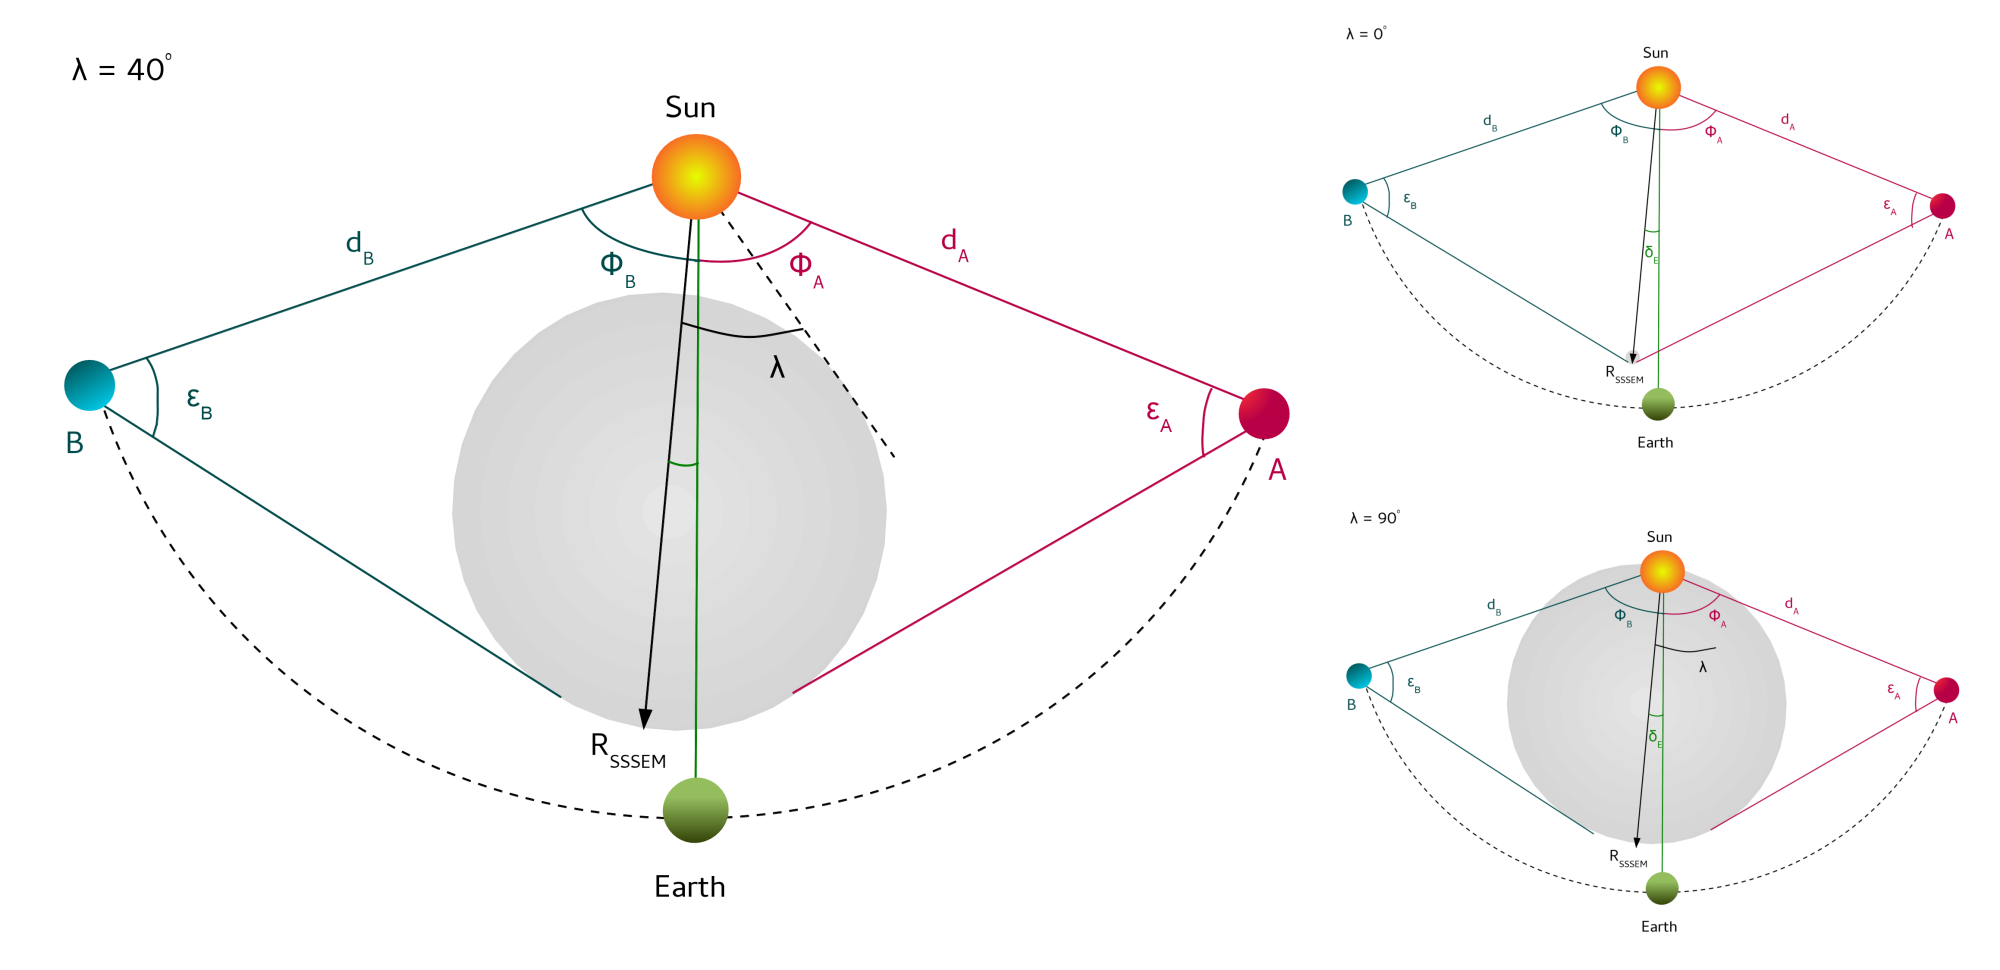
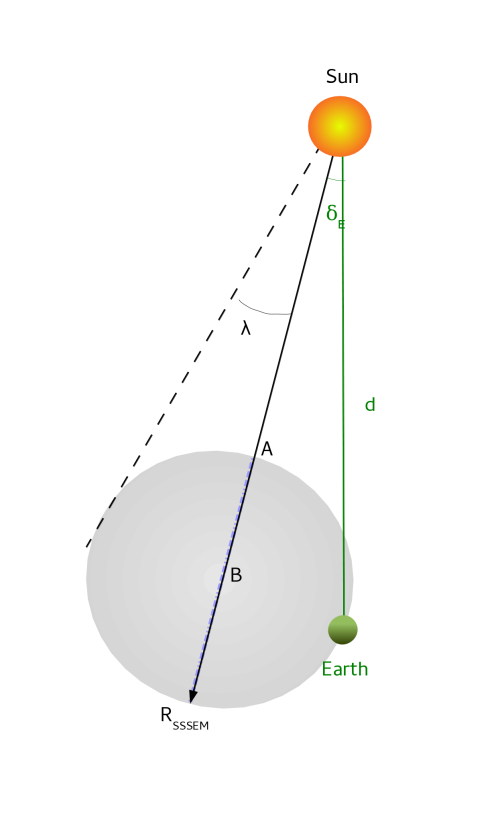
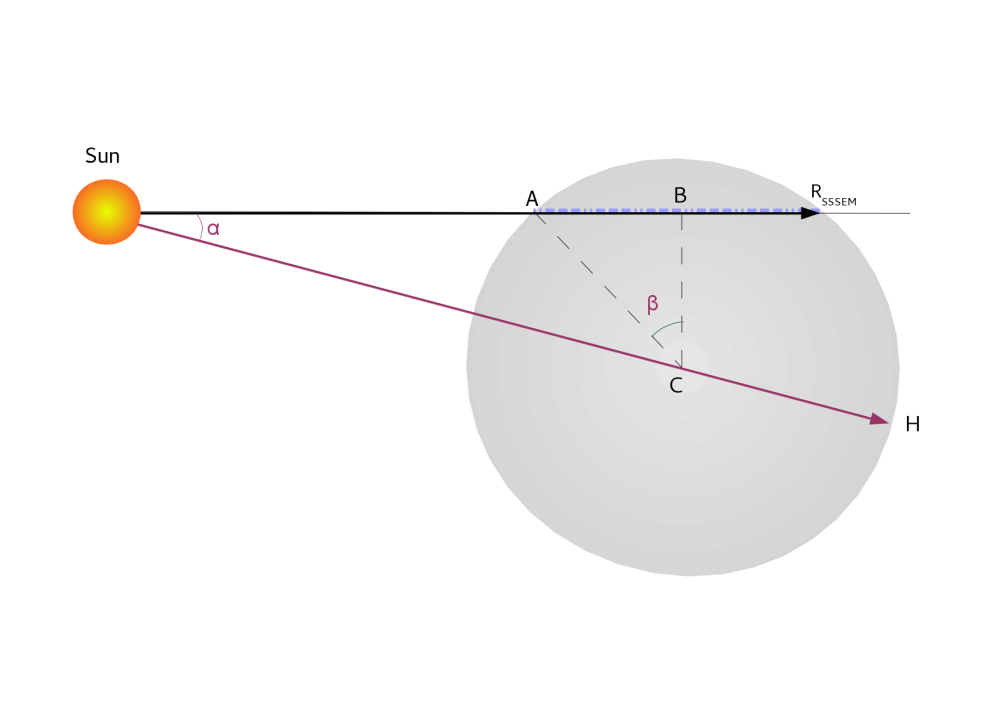
In order to determine the CME and shock kinematics we build j-maps from cuts of STEREO-A and -B difference images along the Ecliptic plane (see Figure \ireffig:Jmap). This allows us to determine the temporal evolution of the CME and shock height, speed, and direction of propagation in the Ecliptic plane. The results can therefore be directly compared to ACE measurements. Manual selection of points along the curved tracks visible in the j-maps yields the evolution of the features’ elongation angles as a function of time. The time–elongation profile thus obtained can be transformed to distances from the Sun provided a set of assumptions on the CME geometry. In this article we use the stereoscopic self-similar expansion model (SSSEM) developed by Davies et al. (2012, 2013), which represents the CME front as a circular front expanding at a fixed angular width (Figure \ireffig:SSEM). Via geometrical arguments it is possible to show that at each instant of time, for each spacecraft , the distance from the Sun of the propagating feature is related to the measured elongation via
| (1) |
with being the Sun–spacecraft distance, the elongation angle obtained from the j-maps, and being the direction of propagation of the white-light feature with respect to the Sun–spacecraft line, while is an input parameter of the model. With the additional constraint
| (2) |
where is the (known) separation angle between the two spacecraft, simultaneous STEREO-A and -B observations allow us to directly solve
Equations (\irefRSSSEM) for , and and derive the kinematic properties of solar-wind features.
The direction of propagation with respect to the Sun–Earth line is simply derived as the difference between the Sun–spacecraft angle
and the direction of propagation with respect to the Sun–spacecraft line determined from the SSSEM .
The speed is obtained, using a quadratic Lagrangian interpolation, as the numerical time derivative of the radial profile (Davies
et al., 2013).
It should be noted that Equation \irefgamma
is only valid when STEREO-A, STEREO-B the CME, Sun, and Earth lie in the same plane. This
condition is satisfied in our study since we follow the propagation of the CME and the shock in the Ecliptic plane.
The model has two limiting cases: for it coincides with the fixed- approximation (Sheeley et al.,
1999; Rouillard
et al., 2008),
which represents the CME as a point source. As in Equation (\irefRSSSEM), is the direction of propagation with respect to
the Sun–observer line. The case , instead, corresponds to the harmonic mean geometry, describing the CME as a sphere anchored at the Sun (Lugaz et al., 2010).
It is then possible, from time series of white-light observations, to determine the temporal evolution of outward moving features in the spacecraft field of view.
If the CME and the shock are visible and distinguishable in white-light images and time–elongation plots, application of the SSSEM allows to separately
derive the CME and shock kinematics.
We applied the SSSEM for different values of to the time–elongation profiles manually derived from the j-maps. We studied the interval between
and varying in steps of .
The errors in the determined height and direction of propagation are obtained using the approach of Liu et al. (2010b).
These are calculated via the following relations:
| (3) |
| (4) |
Following the approach of Liu et al. (2010b), we assign an uncertainty of ten pixels to the measured elongation angles,
corresponding to for points in COR2, for points in HI1, and for points in HI2.
The derived errors are a function of the direction of propagation , the height, the half-width , the positions of the spacecraft, and the instruments’ resolution.
The errors in the speed and in the shock parameters are obtained by propagating the errors in and .
In order to infer the in-situ arrival time and speed we fit the height–time profile to a linear
function. The method also yields the eruption time.
The fit is restricted to points in the HI1 field of view, where both the CME and the shock velocity can be approximated as constant. A discussion on the accuracy of constant-velocity fits to the observed elongation profiles has been given by Möstl
et al. (2014).
The comparison between arrival time and speed prediction based on remote-sensing observations and in-situ measurements shows that,
independently of the fitting method (FP, HM, SSEM), the predicted arrival speeds are higher than the observed ones, and the corresponding arrival times are earlier.
This is supported by Lugaz and
Kintner (2013), who argue that solar-wind drag, which has the effect of decelerating fast CMEs towards the solar-wind speed,
has a substantial impact on the accuracy of arrival-time predictions. For this reason we also perform a quadratic fit to the height profile in the HI1 field
of view, to verify whether the inclusion of deceleration improves the accuracy of the in-situ extrapolations. Arrival times and speeds are corrected accounting for the CME and shock geometry
and direction of propagation following Möstl and
Davies (2013). When the CME or the shock hit ACE,
at a distance from the Sun, the position of their apex is determined from the angle of propagation and the half width according to:
| (5) |
The importance of the correction increases with increasing and . We remind the reader that and ,
with corresponding to propagation along the Sun–Earth line.
The upstream Mach number and the compression ratio can be derived from the standoff distance, i.e. the distance between the shock front and the CME leading edge, by employing
models initially developed for the Earth’s bow shock.
Seiff (1962) and Spreiter, Summers, and
Alksne (1966), based on hydrodynamic theory and experimental data, showed that for the Earth’s bow shock,
in the high-Mach-number regime, the standoff distance primarily depends on the ratio between upstream and downstream solar-wind densities according to
| (6) |
is the standoff distance and is the position of the nose of the magnetosphere measured from Earth, i.e the size of the dayside magnetosphere in a frame of reference with its
origin at Earth (Farris and
Russell, 1994).
Using hydrodynamic relations (Landau and Lifshitz, 1959) it can be shown that the density compression ratio
can be related to the upstream Mach number via
| (7) |
with being the adiabatic index. We adopted the value , as in Farris and
Russell (1994).
Farris and
Russell (1994) modified Spreiter’s relation, replacing the size in Equation (\irefSpreiter_standoff) with the radius of curvature ,
| (8) |
arguing that the shock location would be more sensitive to the local shape of the magnetosphere, represented by the radius of curvature, rather than to its size alone. The change in the proportionality parameter between Equations (\irefSpreiter_standoff) and (\irefFarriss_standoff) results from the fact that Farris and Russell (1994) estimated for the magnetosphere . Furthermore, they introduced a term in the denominator on the right hand side of Equation (\irefLandau_Mach),
| (9) |
extending the applicability of Equations (\irefSpreiter_standoff) and (\irefLandau_Mach) to the low-Mach-number regime: the presence of the term, in
fact, allows the shock to move to infinity as the Mach number approaches unity.
Although a full MHD approach would be required to completely describe the CME–shock system, as well as the interaction between the solar-wind and the Earth’s magnetosphere,
it has been shown that the above approach yields good results in the high-Mach-number regime, for (Spreiter, Summers, and
Alksne, 1966). It is also a good approximation
in the low-Mach-number regime, provided that is substituted for the fast magnetosonic Mach number. When the Alfvén speed substantially exceeds the sound
speed, moreover, the magnetosonic Mach number is not too different from the Alfvénic Mach number (Fairfield
et al., 2001), and can be replaced by .
Equation (\irefFarriss_Mach) has been used to derive CME and shock properties based on in-situ (Russell and
Mulligan, 2002) and remote-sensing observations
(Gopalswamy and
Yashiro, 2011; Poomvises
et al., 2012;Maloney and Gallagher,
2011).
The analysis of white-light images, in particular, allows the determination of shock parameters, and even of the magnetic-field strength, at distances from the
Sun where no direct plasma measurements are available.
In this work we derive the standoff distance as the difference between the shock and the CME height determined via the SSSEM.
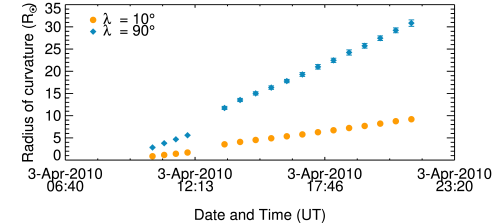
The SSSEM, moreover, yields the CME radius of curvature as a function of the CME half-width , according to
| (10) |
The temporal evolution of the compression ratio and the Mach number can therefore be derived using Equations (\irefFarriss_standoff) and (\irefFarriss_Mach) via an analysis of j-maps.By assuming propagation at constant velocity or constant acceleration it is possible to extrapolate these quantities to the position of the ACE spacecraft, and compare them with in-situ measurements. We remind the reader that, in order to determine the standoff distance at , we have to take the difference between the shock and CME height corrected according to Equation (\irefCorrection).
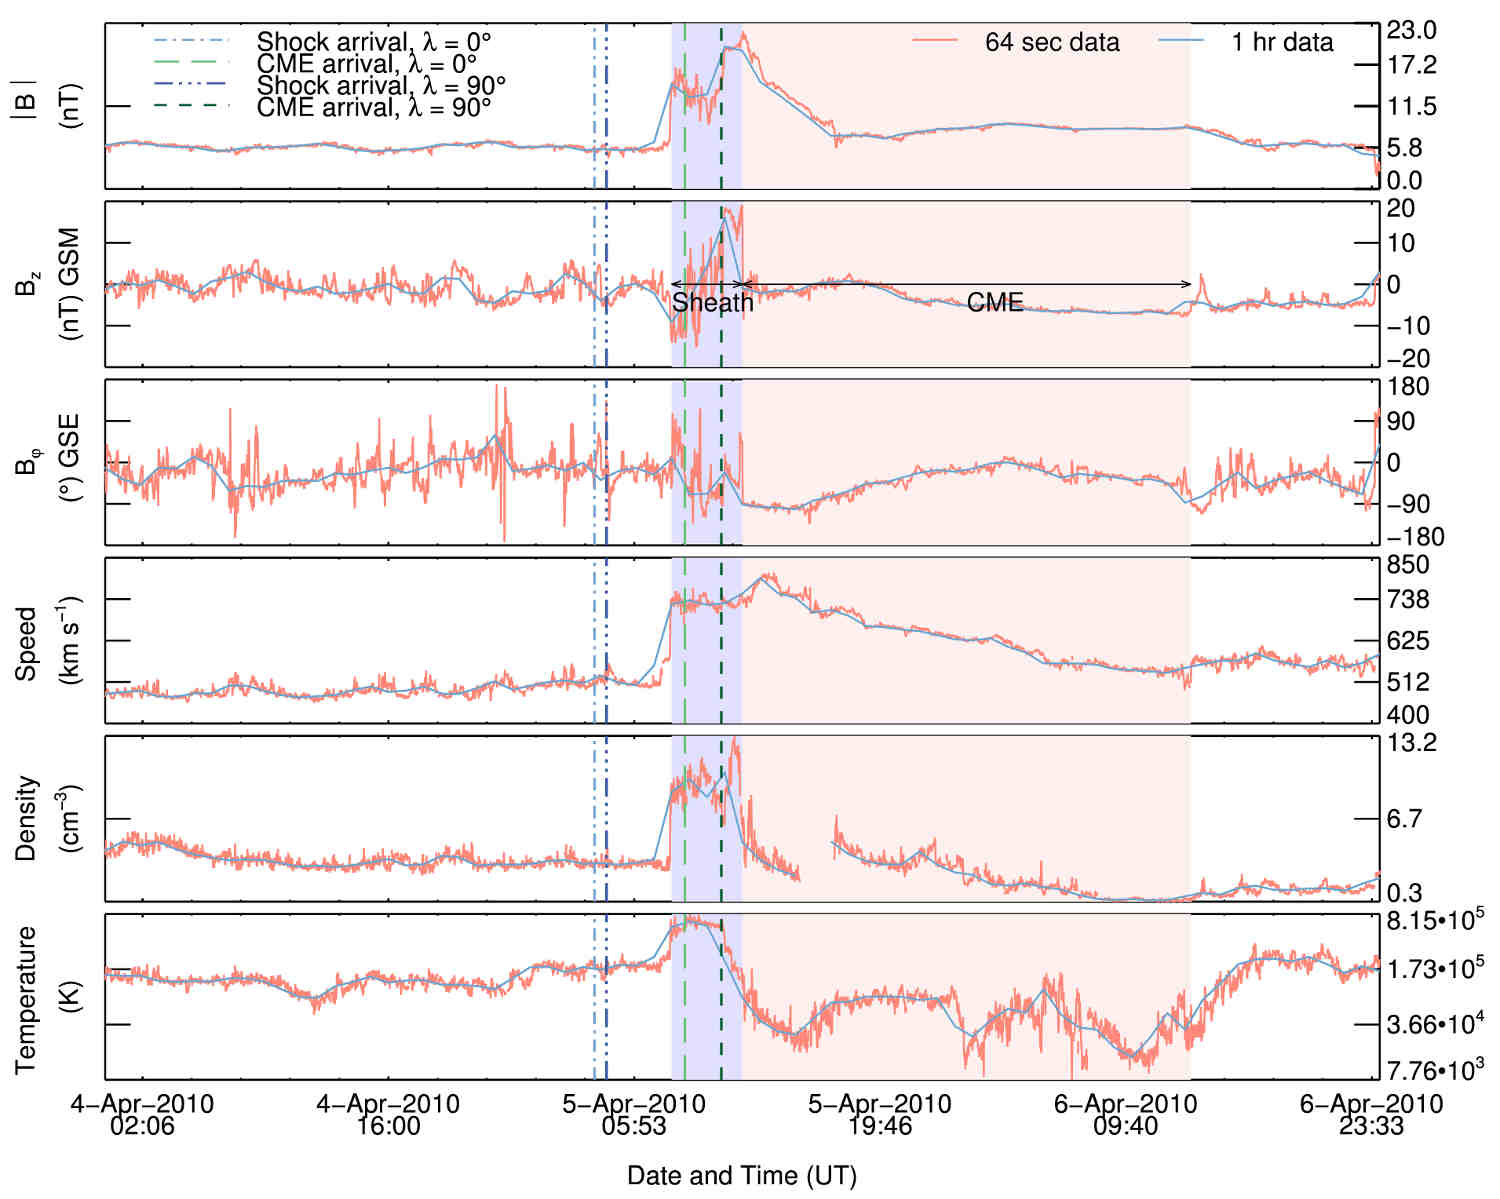
The vertical lines represent the CME and shock-arrival times estimated via a second-degree fit to the stereoscopic self-similar expansion model. The light and dark dashed green lines mark the CME arrival for and , respectively. The light black dot–dashed line corresponds to the shock-arrival time for , and the dark black dot–dashed line to the shock arrival for .\ilabelfig:inSitu
4 Results
Results
The event analyzed in this work erupted from NOAA Active Region (S W) on 03 April 2010.
The CME eruption was associated with a B7.4 flare detected by GOES at 09:04 UT, and resulted in a geomagnetic storm with Kp 8- on 05 April 2010
(Möstl
et al., 2010; Liu et al., 2011).
The separation angles between the STEREO-A and -B spacecraft and Earth at the time of observations are and respectively (Figure \ireffig:SSEM).
In-situ measurements of the CME and its associated shock are provided by the ACE spacecraft: the shock passage, marked by the sudden increase in velocity
and density, is detected on 05 April 2010 at about 08:00UT.
It is followed after about four hours by the CME. Its signatures can be identified, for instance,
in the decreasing velocity profile, in the variation of the component of the magnetic-field, associated to a smooth rotation of
the field itself, and in the lower temperature compared to the solar-wind (Figure \ireffig:inSitu).
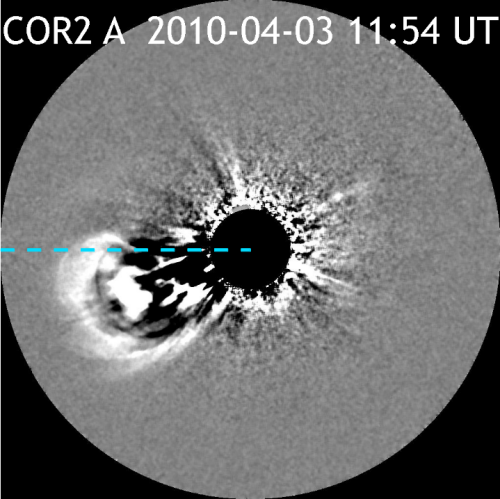
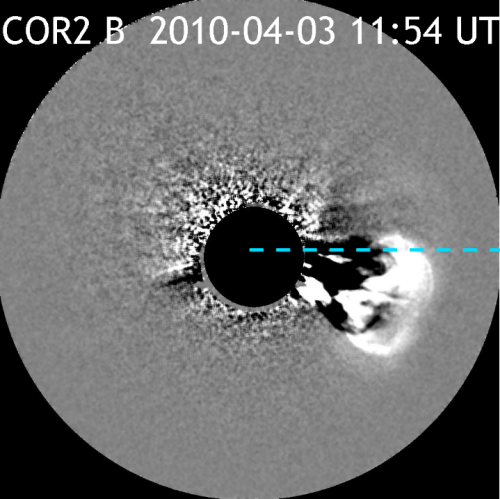
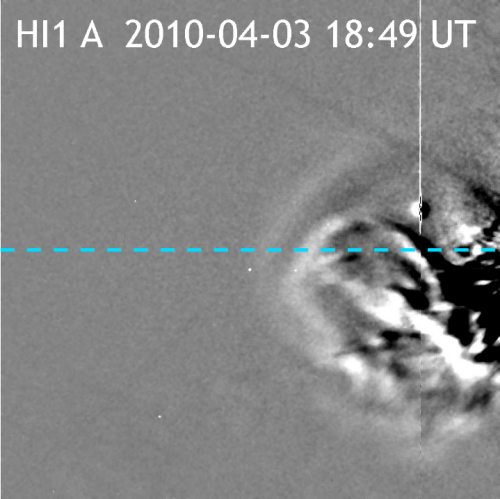
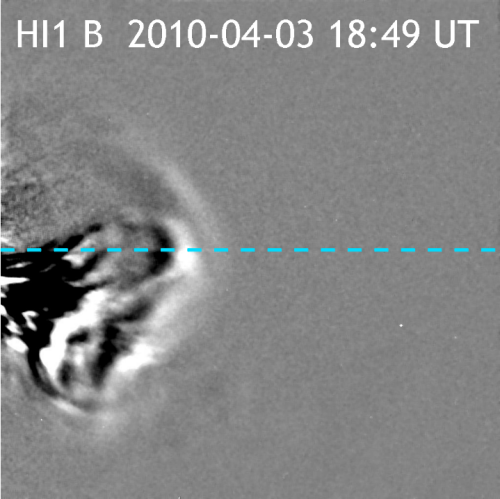
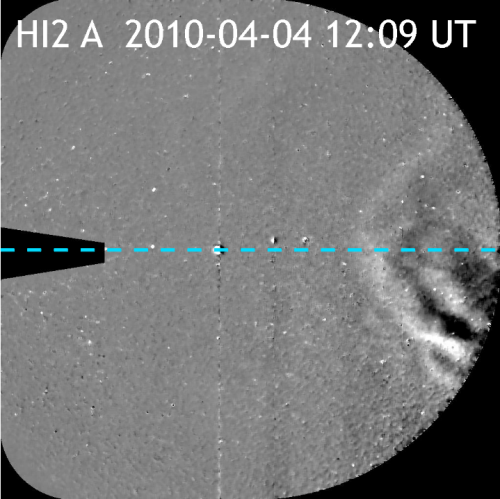
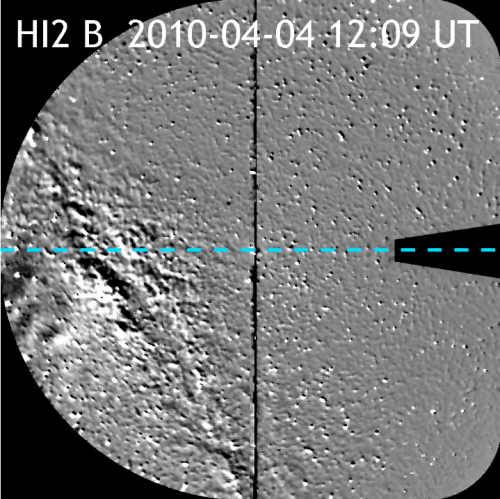
Figure \ireffig:Evolution shows difference images obtained from STEREO-A and -B COR2, HI1, and HI2 observations.
HI2B images are subject to high levels of background noise due to the transit of the Milky Way through the instrument’s field of view.
Stereoscopic observations of the transient are therefore only available up to 24 degrees in elongation, corresponding to the outer field of view of the HI1 imager.
The CME morphology seems to be preserved during its outward propagation. Although the images in Figure \ireffig:Evolution are orthogonal to the Ecliptic plane,
where we determine the CME and shock kinematics, the absence of significant distortion is a good indication that self-similar-expansion is a reasonable assumption for the event under study.
This is because what we observe in white-light is the integrated election density along the line of sight.
A region of enhanced density ahead of the CME, corresponding to compressed plasma downstream of the shock, can be detected in difference images of the event.
It is especially bright in HI1 observations, and it remains visible even in the near-Earth environment imaged by HI2 A.
Figure \ireffig:Jmap shows the j-map for the event analyzed in this work. It was obtained by juxtaposing cuts of STEREO-A images along the Ecliptic plane for observations obtained
between 02 April 2010 and 07 April 2010. The elongation range in the axis covers the fields of view of COR2, which extends up to , HI1 and HI2, respectively
between about and , and and .
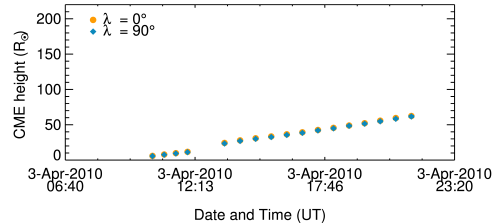
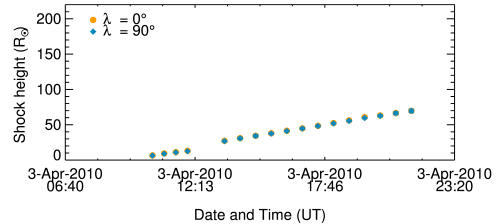
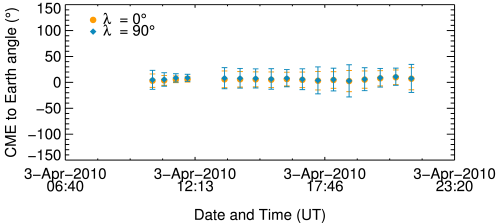
The bright, extended curve appearing on 03 April 2010 at about 09:24 UT follows the evolution of the CME leading edge. A second, fainter curve preceding the
CME can be identified in elongation range observed by the HI instrument. It corresponds to the propagation of the faint feature ahead of the CME
visible in HI1 images (see Figure \ireffig:Evolution), which we associate with compressed plasma downstream of the shock.
Since the two tracks are distinguishable from one another in the j-maps obtained from both STEREO-A and -B observations (the latter is not shown), the CME and shock kinematics could be separately determined.
This was done by applying the SSSEM to the time–elongation profile derived in the range corresponding to the COR2 and HI1 fields of view.
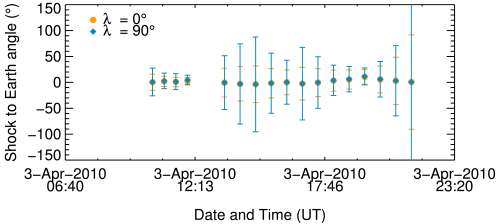
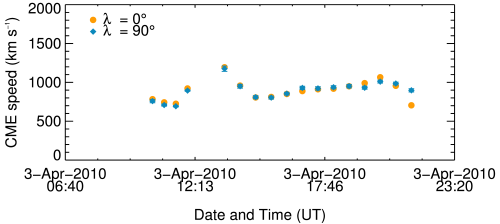
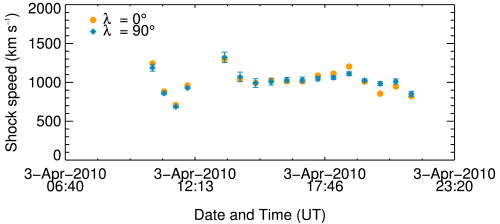
Figure \ireffig:ShockCMEkinematics illustrates the CME and shock height, speed, and direction of propagation with respect to Earth for the cases
and . Solutions for the intermediate values of lie between the two sets of points in each plot, and are therefore not shown.
The average direction of propagation of the CME with respect to the Sun–Earth line, for and for
, is compatible with radial evolution (in the Ecliptic plane) from its source region, located at W latitude on the solar disk.
These results do not differ much from the findings of Möstl
et al. (2010), who determined for and
for , and from geometrical forward modeling.
Eruption time and arrival time and speed at the location of ACE are inferred by applying a first- and a second-degree fit to the CME and shock heights in the range imaged by HI1 only.
Table \ireftab:ShockCMEkinematics2 shows a comparison between fits and observations.
Eruption times show an excellent agreement with the time of the GOES flare detection and the time of the CME first appearance in the COR1 field of view, at 09:15 UT for both the linear and the quadratic fit.
The overestimation of the propagation speed for both the CME and the shock in the constant-velocity fit leads to estimated arrival times earlier than the observed ACE crossing.
Including deceleration significantly improves the arrival-time and speed predictions, particularly for the case.
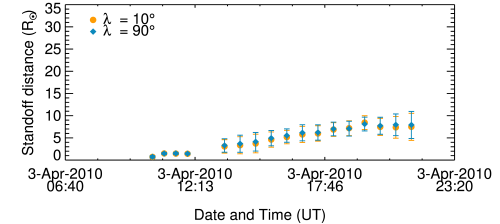
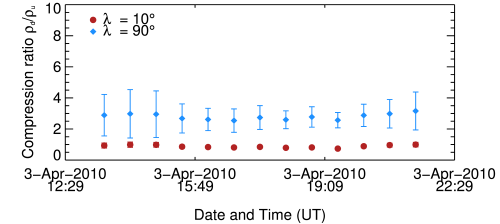
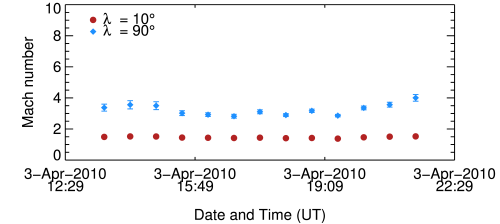
Based on the CME and shock heights obtained from the SSSEM results, the standoff distance, the compression ratio, and the Mach number can be computed according
to Equations (\irefFarriss_standoff), (\irefFarriss_Mach), and (\irefRcurvSSEM), substituting . Their time profiles and the evolution of
the standoff distance and the radius of curvature are shown in Figure \ireffig:StandoffMach for and .
| ACE+EUVI | 1st degree fit | 1st degree fit | |
|---|---|---|---|
| CME eruption time | 03 Apr. 2010 09:04 | 03 Apr. 2010 08:24 | 03 Apr. 2010 08:32 |
| Shock arrival time | 05 Apr. 2010 07:56 | 05 Apr. 2010 00:26 | 05 Apr. 2010 00:19 |
| Shock arrival speed | 750 | 1025 | 1033 |
| CME arrival time | 03 Apr. 2010 12:24 | 05 Apr. 2010 05:24 | 05 Apr. 2010 06:05 |
| ACE+EUVI | 2nd degree fit | 2nd degree fit | |
| CME eruption time | 03 Apr. 2010 09:04 | 03 Apr. 2010 08:27 | 03 Apr. 2010 08:12 |
| Shock arrival time | 05 Apr. 2010 07:56 | 05 Apr. 2010 03:38 | 05 Apr. 2010 04:19 |
| Shock arrival speed | 750 | 867 | 851 |
| CME arrival time | 03 Apr. 2010 12:24 | 05 Apr. 2010 08:44 | 05 Apr. 2010 10:48 |
The case is excluded, as the corresponding zero curvature leads to a singularity in Equation (\irefFarriss_standoff). It should be pointed out that the compression ratio plotted in Figure (\ireffig:StandoffMach) is the inverse of the ratio on the left-hand side of Equations (\irefSpreiter_standoff) and (\irefFarriss_standoff). Both the density compression and the Mach number appear to be roughly constant during the CME evolution, in agreement with the results found by Maloney and Gallagher (2011). The increase of the standoff distance is also in good agreement with observations, which show the shock progressively moving away from its driver.
\ilabelfig:StandoffMach
An extrapolation of the standoff distance, the compression ratio, and the Mach number to the location of ACE was performed assuming again propagation at constant speed as well as at constant acceleration.
The correction in Equation (\irefCorrection) was applied to the CME and shock heights to determine the standoff distance at .
For the case we find an unphysical compression ; this can be caused by the overestimated value of the standoff distance, or the
small CME curvature associated to this value of the half width.
Validation is necessary for the extrapolated values of compression ratio and the Mach number at 1 AU. The in-situ standoff distance is calculated directly
from the CME and shock-arrival time and speed as measured by ACE. The extrapolated values of the density compression ratio and the Mach number are instead
compared to the results published on the interplanetary (IP) shock database of the Harvard-Smithsonian Center for Astrophysics (www.cfa.harvard.edu/shocks/).
The shock parameters are determined applying different analysis methods and principles such as, e.g, the magnetic and velocity coplanarity theorem and the solution of the
Rankine–Hugoniot equations, to the ACE and Wind plasma and magnetic-field measurements. We use the average of the results
obtained with the different methods.
Table \ireftab:MachStandoff1 shows the values of the standoff distance, Mach number, and density compression extrapolated to 1 AU
via linear and quadratic fit to the SSSEM results, as well as those calculated from in-situ data.
The in-situ standoff distance is . A comparison with the linear and quadratic fits to the SSSEM results,
shows that for all the values of the extrapolated standoff distance, ranging from to , overestimates
the observed one. This is easily recognizable in Figure \ireffig:inSitu, where the measured and the extrapolated magnetosheath thicknesses can be directly compared.
The in-situ value of the Mach number, falls within the ranges determined via the linear and quadratic fit, and ,
respectively. The same is true for the compression ratio, whose in-situ value is contained in the intervals
derived from first and second-degree fits, , .
The value of that best approximates the in-situ Mach number and compression is for both the linear and quadratic fit to the SSSEM height. For the
linear fit we find , and , while for the quadratic fit we find , and .
As for the arrival time we find a significant improvement in the in-situ extrapolations when deceleration is included in our fits.
| ACE | 1st degree fit | 1st degree fit | |
| Standoff distance | 19 | ||
| Mach number | |||
| Compression ratio | |||
| ACE | 2nd degree fit | 2nd degree fit | |
| Standoff distance | |||
| Mach number | |||
| Compression ratio |
5 On the Errors Associated to Off-Ecliptic Propagation
discussion
In order to derive the Mach number and the compression ratio using the relations in Equations (\irefFarriss_standoff) and (\irefFarriss_Mach), the standoff distance
has to be measured at the CME nose. Therefore attention should be paid to the direction of propagation of the CME when employing the SSSEM for the determination of shock parameters.
If the direction of propagation of the CME with respect to the Ecliptic plane is not small the determination of shock parameters using the SSSEM might lead to incorrect results. The standoff
distance would be measured at the wrong location and the SSSEM radius of curvature might not well represent the one at the nose of the CME. Furthermore, in order to compare the SSSEM results to in-situ data,
we computed the standoff distance from the SSSEM heights corrected according to Equation (\irefCorrection). In this way we determined the shock parameters from
the standoff distance calculated along the Sun–Earth line. It is now necessary to estimate how much these values deviate from those computed at the CME nose.
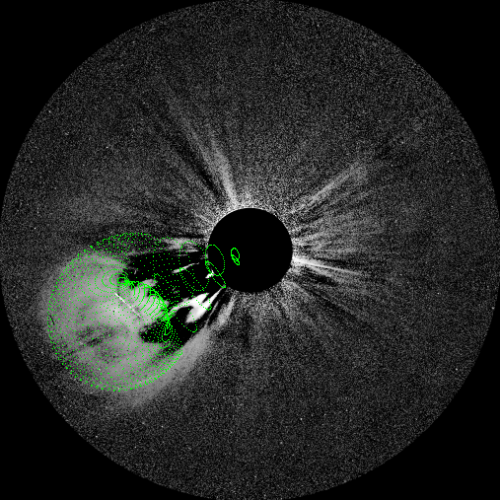
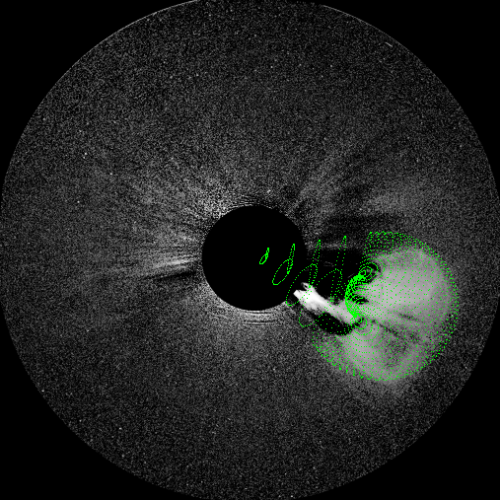
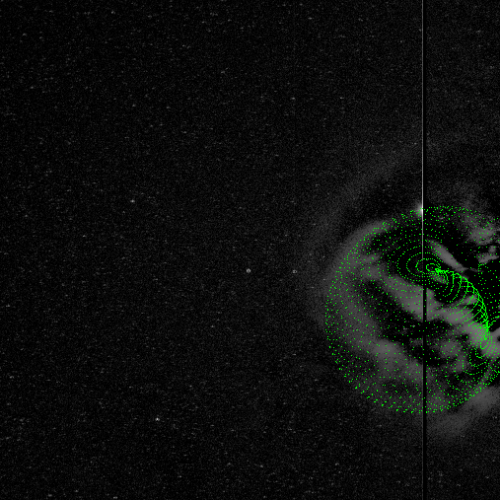
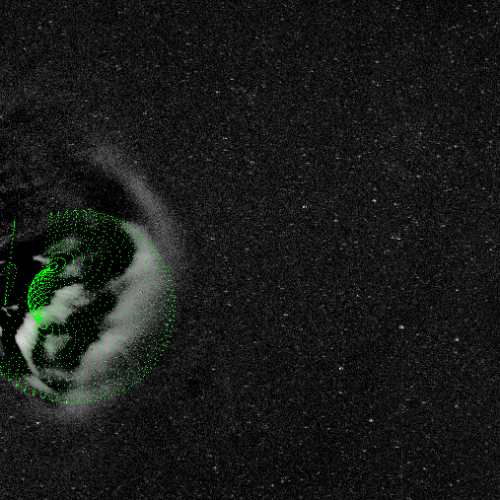
From STEREO observations (see Figure \ireffig:Evolution) it is evident that the CME propagates southwards both in COR2 and in HI1. To estimate its direction of propagation in 3D we model the CME
and the shock with the graduated-cylindrical-shell (GCS) model by Thernisien, Howard, and
Vourlidas (2006). The model, which describes the CME as a croissant-shaped flux rope expanding self-similarly,
has previously been employed to determine the shock parameters (Poomvises
et al. (2012)). We start from results obtained in COR2, and extend them to the HI1 fields of view.
We expand the GCS flux rope keeping the aspect ratio and the half angle constant, i.e. assuming self-similar propagation. We find that the CME propagates southwards at an angle of with the Ecliptic plane
(see Figure \irefGCS), and at an angle of about with respect to the Sun–Earth line. This is in agreement with our SSSEM results, which yield for the shock
and for the CME. No deflection is observed during the CME propagation, i.e. the CME longitude and latitude
are the same in the COR2 and HI fields of view. We use the value of determined from the GCS model and that of obtained from the SSSEM to estimate the difference between the standoff distance
and the CME curvature computed at the nose and
the ones derived from the SSSEM. We assume to be the same for the CME and the shock. Finally, we determine the Mach number and compression ratio at the CME nose and compare them to the results
in Table \ireftab:MachStandoff1.
To estimate the value of the standoff distance at the CME nose we assume that the CME is a sphere of radius , as this is the straightforward extension of the
SSSEM to three-dimensional space. We assume that the intersection of the sphere with the Ecliptic plane is the SSSEM circle (see Figure \irefSSSEM_corrections).
We now consider the plane formed by the CME height vector (i.e. the vector originating at the Sun and ending at ) and perpendicular to the ecliptic.
The plane cuts the sphere at the poles, so that the projection of the sphere on this is a circle of radius (see Figure \irefSSSEM_corrections2).
The SSSEM circle in this plane degenerates to a segment of length , where is the radius of the SSSEM circle, i.e.
| (11) |
The radius of the sphere, which corresponds to the “true”CME curvature, is given in terms of according to
| (12) |
(see Figure \irefSSSEM_corrections2).
The angle can be determined considering that , with , and that
, with . We get
| (13) |
Finally, the CME apex is at a distance given by
| (14) |
At a fixed latitude, the error in neglecting the off-Ecliptic propagation will decrease with increasing , i.e. with increasing size of the CME.
This is because the horizontal axis in Figure \irefSSSEM_corrections2 will slice the sphere closer to its Equator for larger CMEs. At fixed , on
the other hand, the error will increase with increasing , as the slice will be cut closer to the poles, i.e. further away from the apex.
It is possible then to derive the standoff distance and the CME curvature at the CME nose, compute the shock parameters, and compare them to our in-situ extrapolations.
The results are summarized in Table \ireftab:sssemcorr for the case , which corresponds to our best fit to the data.
For each parameter in the Table (i.e. standoff distance, curvature, compression ratio, and Mach number) we report the value of
, being the parameter calculated at the CME apex.
| Relative error for: | 1st degree fit | 2nd degree fit |
|---|---|---|
| Standoff distance | ||
| Curvature | ||
| Mach number | ||
| Compression ratio |
The radius of curvature is the quantity that is affected the most by neglecting the off-Ecliptic propagation of the CME and the shock. The apex value of the standoff distance is at most 5 bigger than the one we determined with the SSSEM. The difference between the SSSEM values of the Mach number and compression ratio computed at the CME nose and via the SSSEM are between 23 and 13, with the second-degree fit being affected the most. This indicates that the results we obtained by computing the standoff distance via the SSSEM do not deviate dramatically from those obtained calculating the standoff distance and the curvature of the CME at its nose.
6 Summary and Conclusions
conclusions
It has been long believed that fast CMEs can drive shocks in the corona, and that their signatures could be observed in coronagraph images due to the
density compression across the shock.
Thanks to the increasing instrument sensitivity it is now possible to detect CME-driven shocks in a vast number of events
(Ontiveros and
Vourlidas, 2009). Stereoscopic observations, moreover, provide an unprecedented insight into the 3D properties of coronal mass ejections, and
allow the determination of CME kinematics without the need to assume constant velocity and strictly radial propagation (Liu et al., 2010a;
2010b). In this work we present the analysis of the fast CME that erupted on 03 April 2010,
associated with an interplanetary shock detected by ACE on 05 April 2010. The results of this work show that the shock was already present in the corona below ,
and was visible in white-light images throughout the whole evolution towards Earth. Exploiting the fact that the CME and the shock are visible and distinguishable
in time–elongation plots, we derived the CME and shock kinematics independently, employing the SSSEM for different values of the angular width.
To our knowledge, this is the first time that the analysis of j-maps has been applied separately to a CME and its driven shock.
The results of our study show that the CME evolved radially in the Ecliptic plane from the eruption site located at S W on the solar disk. Linear and second-degree fits to
the height profile were performed, showing that the latter yields better estimates for arrival times and speeds.
The standoff distance, the compression ratio, and the Mach number evolution were derived; their values were extrapolated to the location of
ACE by exploiting a linear and a quadratic fit to the CME and shock heights. In order to validate these results,
the standoff distance was computed based on the in-situ CME and shock arrival times and speeds.
The values of the Mach number and the compression ratio were compared to results published on the CfA IP shock database,
computed from ACE plasma and magnetic-field data, according to which and .
We found the case to best match observations. If constant velocity is assumed, , and .
When deceleration is assumed to take place in the CME propagation, we find , and .
Although the CME apex was at an angle with respect to the Ecliptic plane, an assessment of the error associated
to the use of the SSSEM to determine the shock parameters showed that their values at the CME nose do not substantially differ from those obtained via the SSSEM.
The methods presented in this work allow the determination of CME-driven shock properties from remote-sensing observations, where in-situ measurements
are not available. Magnetic-field strength estimates are also possible based on such results (Gopalswamy and
Yashiro, 2011), which overcome the
difficulty of directly measuring the coronal magnetic-field.
The study shows that it is possible to use inverse-modeling techniques to determine the time evolution of CME-driven shock parameters and to predict
their in-situ values.
The NASA Solar Probe Plus mission to be launched in 2018 will explore the near Sun environment at distances
up to , i.e. at AU, and the ESA Solar Orbiter mission, also to be launched in 2018, will orbit the Sun at a distance of
. The white-light observations from the Wide-Field Imager on Solar PRobe Plus (WISPR: Vourlidas
et al., 2015) and Solar Orbiter Heliospheric Imager
(SoloHI: Howard et al., 2013)
cameras coupled with in-situ measurements will provide unprecedented knowledge about the coronal plasma and magnetic-field properties at locations
unexplored so far.
Application of the models employed in this work to CME images acquired by WISPR and SoloHI will give
insight on the spatial variation of CME-driven shock properties. At the same time, a deeper knowledge of the plasma and magnetic-field characteristics at the same locations will help to further validate the model results.
Acknowledgments
The authors acknowledge funding by Deutsche Forschungsgemeinschaft (DFG) under grant SFB 963/1, project A2. They are further grateful for support in the analysis of STEREO SECCHI data by Jackie Davies and Richard Harrison from Rutherford Appleton Laboratory, Didcot, Chilton, UK, for the information on shock databases provided by Luciano Rodriguez from the Royal Observatory of Belgium, Bruxelles, and for the GCS modeling in COR2 by Eckhard Bosman from the University of Göttingen. Volker Bothmer acknowledges support of the CGAUSS (Coronagraphic German And US Solar Probe Plus Survey) project for WISPR by the German Space Agency DLR under grant 50 OL 1201.
References
- Cremades and Bothmer (2004) Cremades, H., Bothmer, V.: 2004, On the three-dimensional configuration of coronal mass ejections. A&A 422, 307. DOI. ADS.
- Davies et al. (2009) Davies, J.A., Harrison, R.A., Rouillard, A.P., Sheeley, N.R., Perry, C.H., Bewsher, D., Davis, C.J., Eyles, C.J., Crothers, S.R., Brown, D.S.: 2009, A synoptic view of solar transient evolution in the inner heliosphere using the Heliospheric Imagers on STEREO. Geophys. Res. Lett. 36, 2102. DOI. ADS.
- Davies et al. (2012) Davies, J.A., Harrison, R.A., Perry, C.H., Möstl, C., Lugaz, N., Rollett, T., Davis, C.J., Crothers, S.R., Temmer, M., Eyles, C.J., Savani, N.P.: 2012, A Self-similar Expansion Model for Use in Solar Wind Transient Propagation Studies. ApJ 750, 23. DOI. ADS.
- Davies et al. (2013) Davies, J.A., Perry, C.H., Trines, R.M.G.M., Harrison, R.A., Lugaz, N., Möstl, C., Liu, Y.D., Steed, K.: 2013, Establishing a Stereoscopic Technique for Determining the Kinematic Properties of Solar Wind Transients based on a Generalized Self-similarly Expanding Circular Geometry. ApJ 777, 167. DOI. ADS.
- Davis et al. (2009) Davis, C.J., Davies, J.A., Lockwood, M., Rouillard, A.P., Eyles, C.J., Harrison, R.A.: 2009, Stereoscopic imaging of an Earth-impacting solar coronal mass ejection: A major milestone for the STEREO mission. Geophys. Res. Lett. 36, 8102. DOI. ADS.
- Eyles et al. (2009) Eyles, C.J., Harrison, R.A., Davis, C.J., Waltham, N.R., Shaughnessy, B.M., Mapson-Menard, H.C.A., Bewsher, D., Crothers, S.R., Davies, J.A., Simnett, G.M., Howard, R.A., Moses, J.D., Newmark, J.S., Socker, D.G., Halain, J.-P., Defise, J.-M., Mazy, E., Rochus, P.: 2009, The Heliospheric Imagers Onboard the STEREO Mission. Sol. Phys. 254, 387. DOI. ADS.
- Fairfield et al. (2001) Fairfield, D.H., Cairns, I.H., Desch, M.D., Szabo, A., Lazarus, A.J., Aellig, M.R.: 2001, The location of low Mach number bow shocks at Earth. J. Geophys. Res. 106, 25361. DOI. ADS.
- Farris and Russell (1994) Farris, M.H., Russell, C.T.: 1994, Determining the standoff distance of the bow shock: Mach number dependence and use of models. J. Geophys. Res. 99, 17681. DOI. ADS.
- Gopalswamy and Yashiro (2011) Gopalswamy, N., Yashiro, S.: 2011, The Strength and Radial Profile of the Coronal Magnetic Field from the Standoff Distance of a Coronal Mass Ejection-driven Shock. ApJ 736, L17. DOI. ADS.
- Gosling and McComas (1987) Gosling, J.T., McComas, D.J.: 1987, Field line draping about fast coronal mass ejecta - A source of strong out-of-the-ecliptic interplanetary magnetic fields. Geophys. Res. Lett. 14, 355. DOI. ADS.
- Howard et al. (2008) Howard, R.A., Moses, J.D., Vourlidas, A., Newmark, J.S., Socker, D.G., Plunkett, S.P., Korendyke, C.M., Cook, J.W., Hurley, A., Davila, J.M., Thompson, W.T., St Cyr, O.C., Mentzell, E., Mehalick, K., Lemen, J.R., Wuelser, J.P., Duncan, D.W., Tarbell, T.D., Wolfson, C.J., Moore, A., Harrison, R.A., Waltham, N.R., Lang, J., Davis, C.J., Eyles, C.J., Mapson-Menard, H., Simnett, G.M., Halain, J.P., Defise, J.M., Mazy, E., Rochus, P., Mercier, R., Ravet, M.F., Delmotte, F., Auchere, F., Delaboudiniere, J.P., Bothmer, V., Deutsch, W., Wang, D., Rich, N., Cooper, S., Stephens, V., Maahs, G., Baugh, R., McMullin, D., Carter, T.: 2008, Sun Earth Connection Coronal and Heliospheric Investigation (SECCHI). Space Sci. Rev. 136, 67. DOI. ADS.
- Howard et al. (2013) Howard, R.A., Vourlidas, A., Korendyke, C.M., Plunkett, S.P., Carter, M.T., Wang, D., Rich, N., McMullin, D.R., Lynch, S., Thurn, A., Clifford, G., Socker, D.G., Thernisien, A.F., Chua, D., Linton, M.G., Keller, D., Janesick, J.R., Tower, J., Grygon, M., Hagood, R., Bast, W., Liewer, P.C., DeJong, E.M., Velli, M.M.C., Mikic, Z., Bothmer, V., Rochus, P., Halain, J.-P., Lamy, P.L.: 2013, The solar and heliospheric imager (SoloHI) instrument for the solar orbiter mission. In: Society of Photo-Optical Instrumentation Engineers (SPIE) Conference Series, Society of Photo-Optical Instrumentation Engineers (SPIE) Conference Series 8862, 0. DOI. ADS.
- Kaiser et al. (2008) Kaiser, M.L., Kucera, T.A., Davila, J.M., St. Cyr, O.C., Guhathakurta, M., Christian, E.: 2008, The STEREO Mission: An Introduction. Space Sci. Rev. 136, 5. DOI. ADS.
- Landau and Lifshitz (1959) Landau, L.D., Lifshitz, E.M.: 1959, Fluid mechanics, Pergamon Press, Oxford. ADS.
- Liu et al. (2010a) Liu, Y., Davies, J.A., Luhmann, J.G., Vourlidas, A., Bale, S.D., Lin, R.P.: 2010a, Geometric Triangulation of Imaging Observations to Track Coronal Mass Ejections Continuously Out to 1 AU. ApJ 710, L82. DOI. ADS.
- Liu et al. (2010b) Liu, Y., Thernisien, A., Luhmann, J.G., Vourlidas, A., Davies, J.A., Lin, R.P., Bale, S.D.: 2010b, Reconstructing Coronal Mass Ejections with Coordinated Imaging and in Situ Observations: Global Structure, Kinematics, and Implications for Space Weather Forecasting. ApJ 722, 1762. DOI. ADS.
- Liu et al. (2011) Liu, Y., Luhmann, J.G., Bale, S.D., Lin, R.P.: 2011, Solar Source and Heliospheric Consequences of the 2010 April 3 Coronal Mass Ejection: A Comprehensive View. ApJ 734, 84. DOI. ADS.
- Lugaz and Kintner (2013) Lugaz, N., Kintner, P.: 2013, Effect of Solar Wind Drag on the Determination of the Properties of Coronal Mass Ejections from Heliospheric Images. Sol. Phys. 285, 281. DOI. ADS.
- Lugaz et al. (2010) Lugaz, N., Hernandez-Charpak, J.N., Roussev, I.I., Davis, C.J., Vourlidas, A., Davies, J.A.: 2010, Determining the Azimuthal Properties of Coronal Mass Ejections from Multi-Spacecraft Remote-Sensing Observations with STEREO SECCHI. ApJ 715, 493. DOI. ADS.
- Maloney and Gallagher (2011) Maloney, S.A., Gallagher, P.T.: 2011, STEREO Direct Imaging of a Coronal Mass Ejection-driven Shock to 0.5 AU. ApJ 736, L5. DOI. ADS.
- Möstl and Davies (2013) Möstl, C., Davies, J.A.: 2013, Speeds and Arrival Times of Solar Transients Approximated by Self-similar Expanding Circular Fronts. Sol. Phys. 285, 411. DOI. ADS.
- Möstl et al. (2010) Möstl, C., Temmer, M., Rollett, T., Farrugia, C.J., Liu, Y., Veronig, A.M., Leitner, M., Galvin, A.B., Biernat, H.K.: 2010, STEREO and Wind observations of a fast ICME flank triggering a prolonged geomagnetic storm on 5-7 April 2010. Geophys. Res. Lett. 37, 24103. DOI. ADS.
- Möstl et al. (2014) Möstl, C., Amla, K., Hall, J.R., Liewer, P.C., De Jong, E.M., Colaninno, R.C., Veronig, A.M., Rollett, T., Temmer, M., Peinhart, V., Davies, J.A., Lugaz, N., Liu, Y.D., Farrugia, C.J., Luhmann, J.G., Vršnak, B., Harrison, R.A., Galvin, A.B.: 2014, Connecting Speeds, Directions and Arrival Times of 22 Coronal Mass Ejections from the Sun to 1 AU. ApJ 787, 119. DOI. ADS.
- Ontiveros and Vourlidas (2009) Ontiveros, V., Vourlidas, A.: 2009, Quantitative Measurements of Coronal Mass Ejection-Driven Shocks from LASCO Observations. ApJ 693, 267. DOI. ADS.
- Poomvises et al. (2012) Poomvises, W., Gopalswamy, N., Yashiro, S., Kwon, R.-Y., Olmedo, O.: 2012, Determination of the Heliospheric Radial Magnetic Field from the Standoff Distance of a CME-driven Shock Observed by the STEREO Spacecraft. ApJ 758, 118. DOI. ADS.
- Rouillard et al. (2008) Rouillard, A.P., Davies, J.A., Forsyth, R.J., Rees, A., Davis, C.J., Harrison, R.A., Lockwood, M., Bewsher, D., Crothers, S.R., Eyles, C.J., Hapgood, M., Perry, C.H.: 2008, First imaging of corotating interaction regions using the STEREO spacecraft. Geophys. Res. Lett. 35, 10110. DOI. ADS.
- Russell and Mulligan (2002) Russell, C.T., Mulligan, T.: 2002, On the magnetosheath thicknesses of interplanetary coronal mass ejections. Planet. Space Sci. 50, 527. DOI. ADS.
- Seiff (1962) Seiff, A.: 1962, Gas Dynamics in Space Exploration. In: The NASA University Conference on the Science and Technology of Space Exploration, NASA SP 24, NASA, Washington DC, 19.
- Sheeley et al. (1999) Sheeley, N.R., Walters, J.H., Wang, Y.-M., Howard, R.A.: 1999, Continuous tracking of coronal outflows: Two kinds of coronal mass ejections. J. Geophys. Res. 104, 24739. DOI. ADS.
- Spreiter, Summers, and Alksne (1966) Spreiter, J.R., Summers, A.L., Alksne, A.Y.: 1966, Hydromagnetic flow around the magnetosphere. Planet. Space Sci. 14, 223. DOI. ADS.
- Stone et al. (1998) Stone, E.C., Frandsen, A.M., Mewaldt, R.A., Christian, E.R., Margolies, D., Ormes, J.F., Snow, F.: 1998, The Advanced Composition Explorer. Space Sci. Rev. 86, 1. DOI. ADS.
- Thernisien, Howard, and Vourlidas (2006) Thernisien, A.F.R., Howard, R.A., Vourlidas, A.: 2006, Modeling of Flux Rope Coronal Mass Ejections. ApJ 652, 763. DOI. ADS.
- Vourlidas (2006) Vourlidas, A.: 2006, Detections of CME-Driven Shocks with LASCO. In: Lacoste, H., Ouwehand, L. (eds.) SOHO-17. 10 Years of SOHO and Beyond, ESA SP SP-617, ESA, Noordwijk, 23. ADS.
- Vourlidas and Ontiveros (2009) Vourlidas, A., Ontiveros, V.: 2009, A Review of Coronagraphic Observations of Shocks Driven by Coronal Mass Ejections. In: Ao, X., Burrows, R., Zank, G. (eds.) Shock Waves in space and astrophysical environments, AIP CS 1183, AIP, ???, 139. DOI.
- Vourlidas et al. (2003) Vourlidas, A., Wu, S.T., Wang, A.H., Subramanian, P., Howard, R.A.: 2003, Direct Detection of a Coronal Mass Ejection-Associated Shock in Large Angle and Spectrometric Coronagraph Experiment White-Light Images. ApJ 598, 1392.
- Vourlidas et al. (2015) Vourlidas, A., Howard, R.A., Plunkett, S.P., Korendyke, C.M., Thernisien, A.F.R., Wang, D., Rich, N., Carter, M.T., Chua, D.H., Socker, D.G., Linton, M.G., Morrill, J.S., Lynch, S., Thurn, A., Van Duyne, P., Hagood, R., Clifford, G., Grey, P.J., Velli, M., Liewer, P.C., Hall, J.R., DeJong, E.M., Mikic, Z., Rochus, P., Mazy, E., Bothmer, V., Rodmann, J.: 2015, The Wide-Field Imager for Solar Probe Plus (WISPR). Space Sci. Rev.. DOI. ADS.
- Yashiro et al. (2004) Yashiro, S., Gopalswamy, N., Michalek, G., St. Cyr, O.C., Plunkett, S.P., Rich, N.B., Howard, R.A.: 2004, A catalog of white light coronal mass ejections observed by the SOHO spacecraft. J. Geophys. Res. (Space Phys.) 109, 7105.