Strong Coupling Superconductivity in the Vicinity of the Structural Quantum Critical Point in (CaxSr1-x)3Rh4Sn13
Abstract
The family of the superconducting quasi-skutterudites (CaxSr1-x)3Rh4Sn13 features a structural quantum critical point at , around which a dome-shaped variation of the superconducting transition temperature is found. Using specific heat, we probe the normal and the superconducting states of the entire series straddling the quantum critical point. Our analysis indicates a significant lowering of the effective Debye temperature on approaching , which we interpret as a result of phonon softening accompanying the structural instability. Furthermore, a remarkably large enhancement of and beyond the Bardeen-Cooper-Schrieffer (BCS) values is found in the vicinity of the structural quantum critical point. The phase diagram of (CaxSr1-x)3Rh4Sn13 thus provides a model system to study the interplay between structural quantum criticality and strong electron-phonon coupling superconductivity.
pacs:
65.40.Ba, 74.40.Kb, 74.25.-q, 74.62.-cThe interplay between superconductivity and structural instability has been an important theme in condensed matter physics. The proximity to structural instability has been suggested to play a role in several superconductors with relatively high transition temperature () Testardi1957 ; Hinks1988 ; Shanks1974 ; Kim2006 ; Gauzzi2007 ; Weller2005 ; Emery2005 , with recent examples including IrTe2 Yang2012 ; Pyon2012 ; Fang2013 as well as Fe- and Ni-based superconductors Cruz2008 ; Yoshi2012 ; Niedziela2011 ; Kudo2012 ; Hirai2012 . To examine the prospect of stabilising or even enhancing superconductivity near structural instability, access to superconducting systems featuring a second-order structural phase transition, which can be tuned away, is highly desirable.
A large family of superconducting stannides Remeika1980 ; Espinosa1980 with composition A3T4Sn13, where A=La,Sr,Ca and T=Rh,Ir, has recently attracted considerable attention Yang10 ; Kase11 ; Hayamizu11 ; Wang2012 ; Klintberg2012 ; Zhou2012 ; Gerber2013 ; Liu13 ; Slebarski14 ; Tompsett14 ; Kuo14 ; Biswas14 ; Sarkar14 ; Fang14 ; Goh14 ; XChen15 . in these compounds are typically less than 10 K, and the superconducting gap function is established to be nodeless at the Fermi surface Kase11 ; Hayamizu11 ; Wang2012 ; Zhou2012 . What makes these systems interesting is the discovery of an additional second-order structural phase transition at in some of the compositions Kuo14 ; Klintberg2012 ; Goh14 . Systematic variation of has been observed when the unit cell volume of the crystal is varied via chemical substitution or applied pressure, resulting in phase diagrams suggestive of a strong interplay between the structural and superconducting orders, which is in striking resemblance to the phase diagrams of heavily studied superconductors found on the border of magnetism Mathur1998 ; Gegenwart2008 ; Paglione2010 ; Ishida2009 ; Hashimoto2012 ; Shibauchi2014 .
Sr3Ir4Sn13 and Sr3Rh4Sn13 are two prominent members of the family which exhibit both and . Clear lambda-like jump in the specific heat can be seen at K and 138 K in Sr3Ir4Sn13 Kuo14 and Sr3Rh4Sn13Goh14 , respectively. Crucially, can be suppressed rapidly by applying pressure, or substituting calcium by strontium Klintberg2012 ; Goh14 . In the Ir substitution series, i.e. (CaxSr1-x)3Ir4Sn13, reaches as low as 33 K when . Full suppression of can only be achieved by applying 18 kbar to Ca3Ir4Sn13Klintberg2012 . In the Rh substitution series, can be fully suppressed solely with calcium substitution, giving rise to a structural quantum critical point (QCP) at ambient pressure at Goh14 . Concurrent with the suppression of , rises gently in both Ir- and Rh-series, and reaches the maximum value near where Klintberg2012 ; Goh14 .
A second-order structural phase transition involves the softening of the phonon mode that is responsible for the structural order Cowley1980 ; Dovebook . This will inevitably affect the low energy excitations of the system. In addition, the nodeless nature of the superconducting gap function suggests a conventional Cooper pairing mechanism mediated by phonons, allowing the discussion of the coupling strength. The tunability of the (CaxSr1-x)3Rh4Sn13 series across the structural QCP without applying high pressure offers an important opportunity to understand the underlying lattice dynamics and the relationship between structural and superconducting orders. In this Letter, we report the results of our heat capacity measurements on (CaxSr1-x)3Rh4Sn13 for seven Ca concentrations, spanning the range from to . The data enable us to extract important parameters relevant to both superconducting and structural phase transitions, which reveal a remarkable trend on approaching the structural QCP.
Single crystals of (CaxSr1-x)3Rh4Sn13 were synthesized by Sn flux method using similar parameters as described in ref. Yang10 . Heat capacity was measured in a Physical Property Measurement System (Quantum Design) using a standard pulse relaxation method. The background heat capacity of the sample platform and Apiezon N-grease, which was used as adhesive, was carefully measured from room temperature down to the lowest attainable temperature. To accurately determine the normal state heat capacity of the samples, additional background measurements were performed at high magnetic field ( 5 T). The mass of the samples ranges from 5 mg to 50 mg.
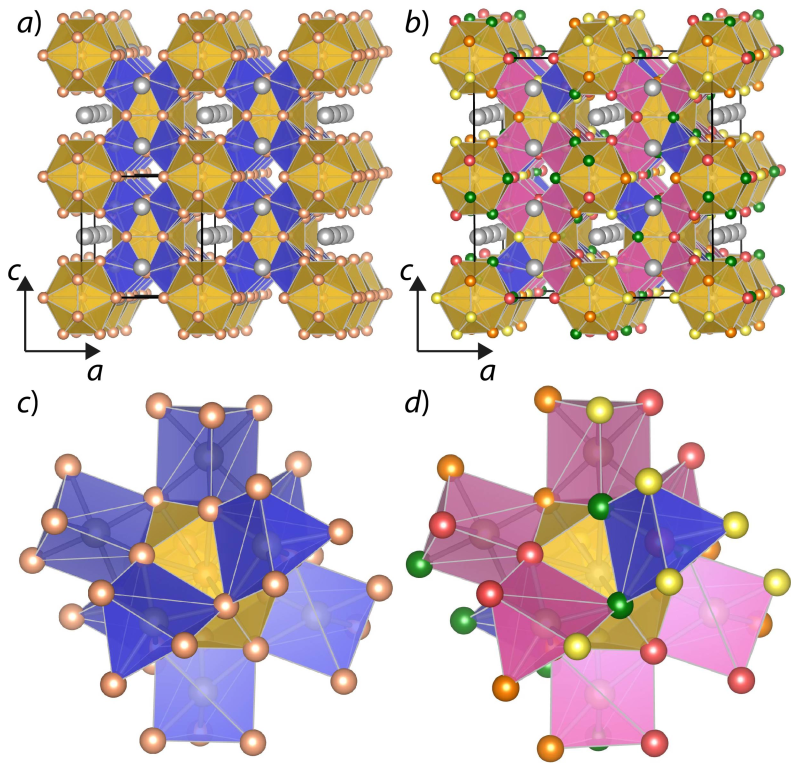
Above , Sr3Rh4Sn13 adopts a cubic structure (Fig. 1(a)) featuring Sn(1)Sn(2)12 icosahedra connected via RhSn(2)6 trigonal prisms, with the Sr cations occupying the space between icosahedra. In this high temperature centrosymmetric phase, the bond lengths in the Sn(1)Sn(2)12 icosahedra are identical. Below , these icosahedra distort leading to each having four groups of Sn(1)-Sn(2) bonds of different lengths Goh14 . This requires six of the eight trigonal prisms around an icosahedra to tilt, with only those along the [111] direction remaining untilted. This results in a symmetry lowering to a non-centrosymmetric cubic structure with a doubled unit cell (see Fig. 1(b)).
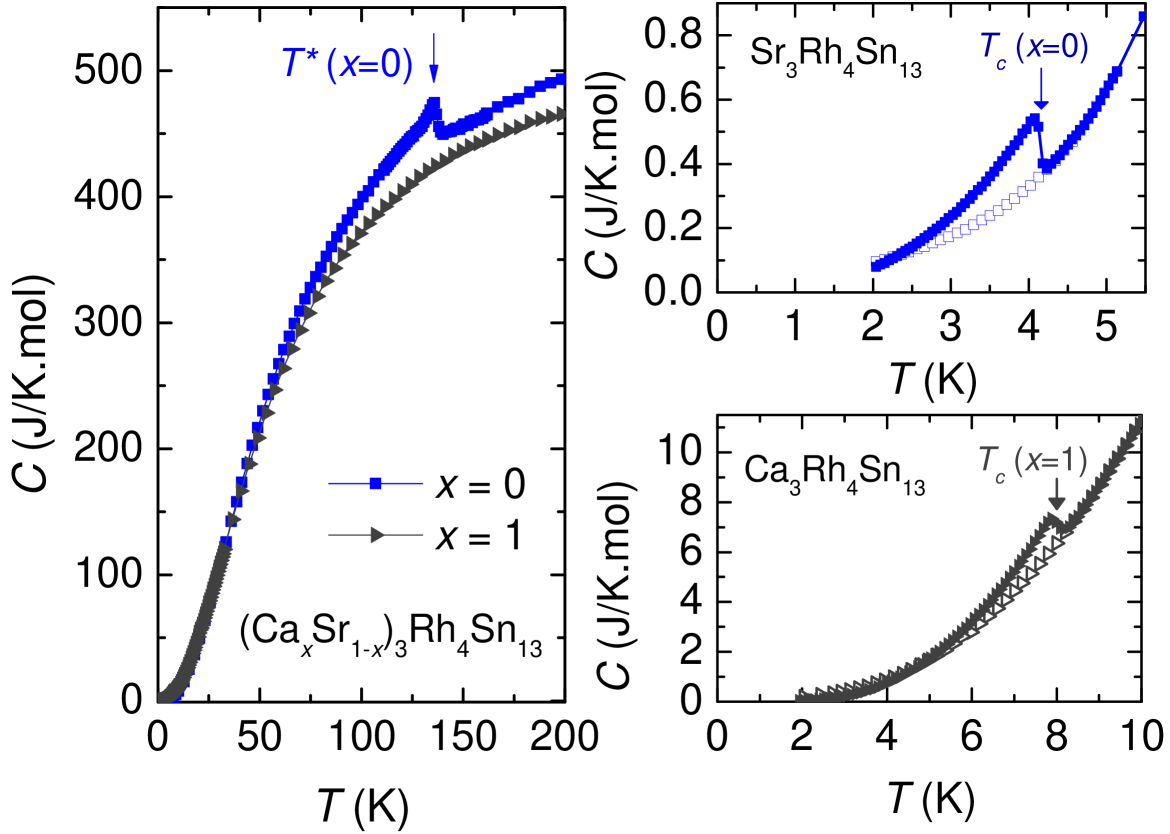
Fig. 2 shows the temperature dependence of the specific heat for Sr3Rh4Sn13 and Ca3Rh4Sn13. In Sr3Rh4Sn13, a lambda-like jump in the specific heat occurs at 138 K, which corresponds to a second-order structural phase transition Goh14 . At low temperatures, another jump in the specific heat is detected (see the right panel of Fig. 2), which marks and is in excellent agreement with previous electrical resistivity measurement Goh14 (see Fig. S1 of Supplemental Material). In Ca3Rh4Sn13, the specific heat varies smoothly except at K. This is again consistent with electrical resistivity measurement which did not detect any evidence of (Fig. S1).
The specific heat jump at can be suppressed by magnetic field, thereby exposing the normal state. The low temperature specific heat in the normal state can be adequately described by the following model:
| (1) |
where the first term is the contribution from conduction electrons, the second and the third terms are due to phonons with dispersion relations (Debye) and -independent (Einstein), respectively. is the Einstein temperature Gopalbook . In the inset to Fig. 3(a) where is plotted against , the lowest temperature data follow a straight line and the value of and could be extracted. The excess specific heat at higher temperatures is attributed to the Einstein term. Using this model, we successfully described the low temperature specific heat of all compositions studied (main panel of Fig. 3(a) and Fig. S6-S7 in Supplemental Material).
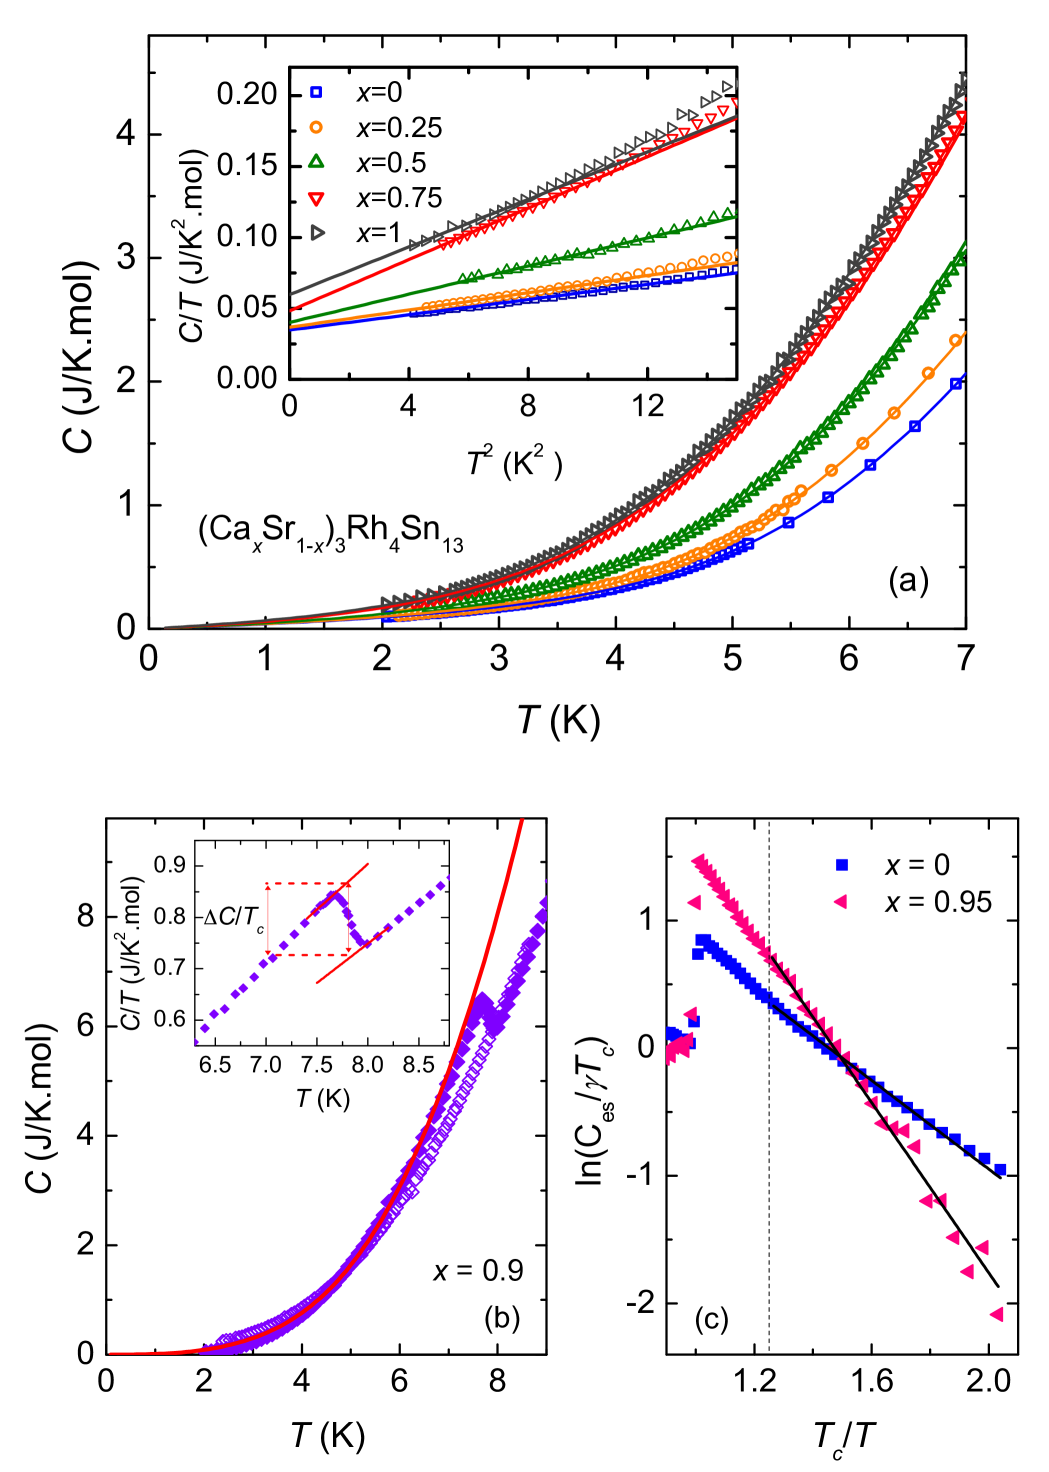
Next, we extract the parameters relevant to superconductivity. We take the midpoint of the specific heat anomalies at low temperatures as . Following the scheme shown in the inset to Fig. 3(b), we estimated the normalized specific heat jump with the value of obtained from the analysis of described above. In addition, we estimate the superconducting gap by analysing the zero field heat capacity data well below using
| (2) |
The phonon contributions from the the second and the third terms in are assumed to be identical to that in . Hence, and are the only adjustable parameters in the fitting. The usage of a single -wave gap is justified based on previous studies, in which no evidence of low energy quasiparticle excitation was detected in the superconducting state, indicating a nodeless superconducting gap function Kase11 ; Hayamizu11 ; Wang2012 ; Zhou2012 ; Biswas14 . For , the BCS theory predicts that the gap closes in a fashion BCS1 ; BCS2 . Therefore, we fit the zero field heat capacity data below with Eq. (2) for all seven samples (see Fig. 3(b) for , and Fig. S2-S8 for others). The validity of our model is clearly demonstrated in Fig. 3(c) where the electronic part of the specific heat at zero field, , is plotted on the logarithmic scale as a function of , with the solid lines drawn using the values of extracted from the analysis of alphamodel .
The results of these analyses are summarised in Fig. 4. In Fig. 4(a), we overlay and determined from the current heat capacity measurement on the universal phase diagram constructed earlier Goh14 . For , the anomaly becomes significantly smeared out in specific heat, although it is still visible in electrical resistivity. For all compositions studied here, values are in excellent agreement with previous reports Kase11 ; Goh14 . The phase diagram constructed clearly shows the suppression of with increasing Ca content, giving rise to a structural QCP at . A broad dome-like variation in is found to peak around the QCP.
We adopt the viewpoint that the second-order structural phase transition is accompanied by the softening of the relevant phonon mode frequency on approaching from , and hence the branch of on which this mode lies will be affected. In Landau’s theory, plays the role of the inverse generalised susceptibility Cowley1980 ; Dovebook . Below , the structure relaxes to a new stable configuration, and will harden again. This temperature dependence of the soft phonon mode frequency across a structural transition has been most clearly observed in ferroelectric compounds, e.g. SrTiO3 Cowley1969 ; Shirane1969 ; Fleury1968 . For the present system, K at the QCP. Consequently, at the QCP, at 0 K and we are left with an abundance of low-lying phonon modes at low temperatures.
First evidence of the existence of the soft mode comes from the electrical resistivity measurements of both (CaxSr1-x)3Rh4Sn13 and (CaxSr1-x)3Ir4Sn13. At the structural QCP, namely in (Ca0.9Sr0.1)3Rh4Sn13 at ambient pressure and Ca3Ir4Sn13 under 18 kbar, a distinct linear-in- variation of the electrical resistivity was observed over a wide temperature range, which was attributed to a strong coupling to the soft phonon modes Klintberg2012 ; Goh14 . Lattice dynamics calculations further revealed that the soft mode is located at M(0.5, 0.5, 0) Tompsett14 ; Goh14 , which is consistent with the structural refinement performed using data from x-ray diffraction studies Klintberg2012 ; Goh14 , and a recent inelastic scattering results in Ca3Ir4Sn13Mazzone2015 . In Ca3Rh4Sn13, which is beyond the structural QCP and hence does not undergo a structural transition, the soft mode frequency is THz Goh14 . Since is a local minimum at M, we can Taylor-expand around , and obtain , where is the wavevector measured from M. We emphasise that the lattice dynamics calculations were performed for 0 K. Thus, to induce a structural quantum phase transition from the quantum disorder side, one needs to reduce to zero, resulting in a phonon dispersion relation . Hence, at the QCP, an additional, acoustic-like phonon branch emerges at M.
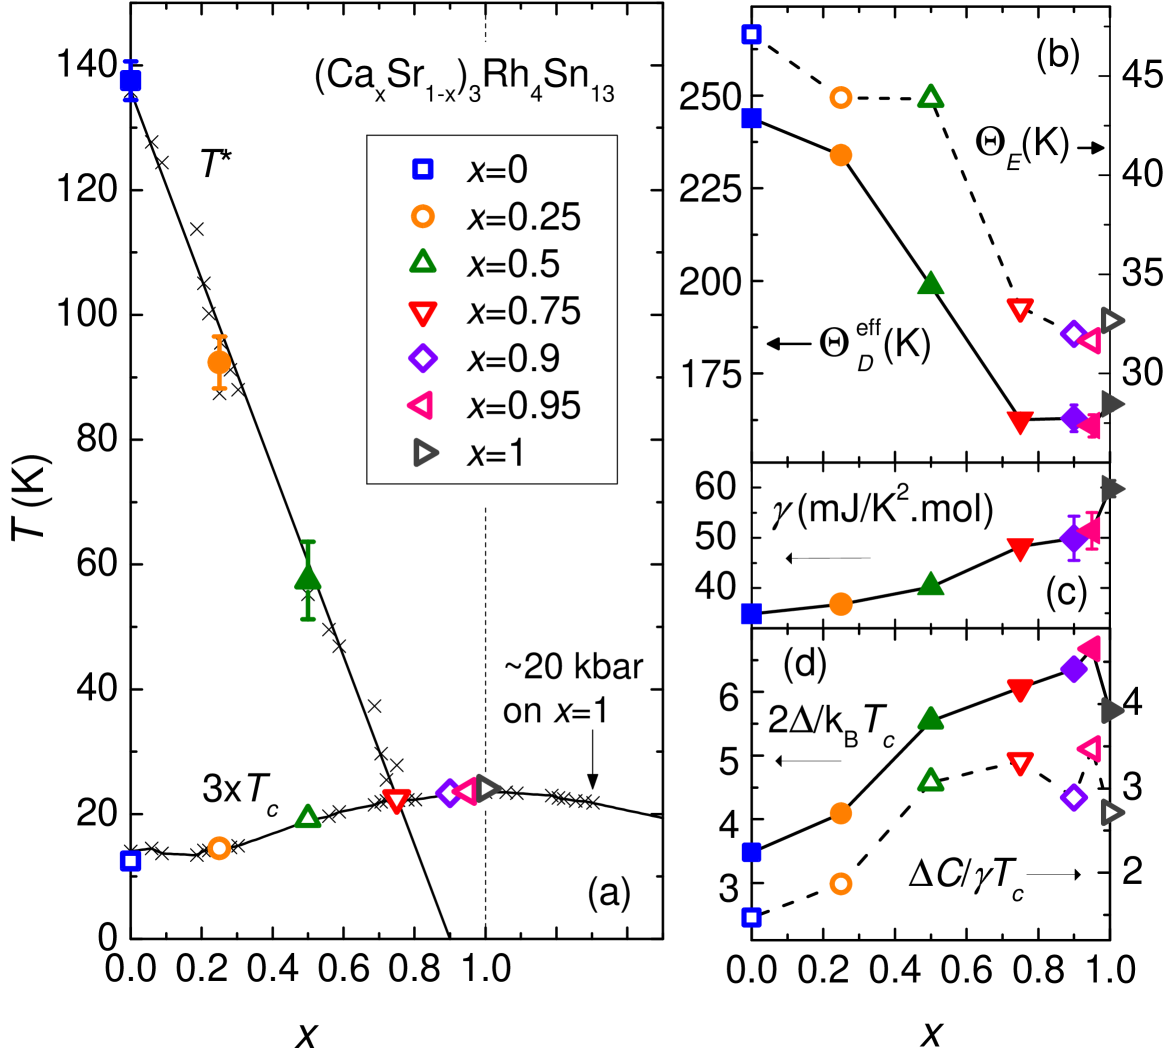
We are now in the position to explain the -dependence of the remaining quantities as shown in Fig. 4, and to put the results in the context of structural quantum criticality associated with this system. First of all, the contribution of the additional acoustic-like branch to the specific heat will be proportional to , following Debye’s treatment. Indeed, we found that (c.f. Eq. (1)) is significantly larger, or equivalently, the effective Debye temperature is considerably suppressed, at around effectivedebye . Our analysis indicates a rapid decrease in as increases, with a broad minimum around where is lower than that at . Concurrent with the strong variation of , a qualitatively similar variation is observed in . This is consistent with our expectation that an abundance of low-energy phonon modes become readily populated as a result of the softening of .
From Fig. 4(d), we see that in addition to an enhancement in with increasing , both and are appreciably larger on the Ca-rich end of the phase diagram. Criticality in can be clearly observed near the structural QCP at . Except for , is noticeably larger than the BCS value of 1.43 BCS1 ; BCS2 ; Poolebook for all samples studied, and reaches a value as high as 3.47 at . Note that both and increase with increasing (Figs. 4(a) and (c)), therefore the enhancement in is accompanied by a much larger . Moreover, also experiences a sizeable enhancement near the structural QCP, reaching a remarkably high value of 6.67 at . In fact, theory of strong coupling superconductivity give and Carbotte1990 , which are both smaller than our observed values near the structural QCP. Similar observation has recently been reported from SR studies, which found a large of near the pressure-induced structural quantum critical point in the sister compound Ca3Ir4Sn13 Biswas2015 .
Combining all parameters relevant to the normal and superconducting states from systematic studies across the phase diagram of (CaxSr1-x)3Rh4Sn13, an intriguing picture emerges: at , we have a superconductor close to the weak coupling limit, with both and close to the expected ratios in the BCS theory BCS1 ; BCS2 ; Poolebook . This is in stark contrast to the Ca-rich end, in the vicinity of the structural QCP, where these ratios are significantly enhanced. Thus, the phase diagram can be regarded as the outcome of fine tuning the coupling strength, which ultimately give rise to the intricate interplay between the phases observed.
In summary, we have analysed the heat capacity data of (CaxSr1-x)3Rh4Sn13, in the normal and superconducting states, for seven values straddling across the structural QCP at . The effective Debye temperature and the Einstein temperature are found to be significantly reduced near , which we attributed to the softening of a phonon mode responsible for the structural transition. Additionally, is found to peak near , accompanied by a remarkable enhancement in and far beyond the BCS values. (CaxSr1-x)3Rh4Sn13 thus serves as an unprecedented model system for studying the intricate interplay between structural instability and strong coupling superconductivity.
Acknowledgements.
Acknowledgement. We thank Takasada Shibauchi, David Tompsett, Malte Grosche, Yuji Matsuda and Jeff Tallon for helpful discussion. We acknowledge funding support from the CUHK (Startup Grant, Direct Grant No. 4053071), UGC Hong Kong (ECS/24300214), Grants-in-Aid from MEXT (22350029 and 23550152), and Glasstone Bequest, Oxford.References
- (1) L. R. Testardi, Rev. Mod. Phys. 47, 637 (1975).
- (2) D. G. Hinks, D. R. Richards, B. Dabrowski, D. T. Marx, and A. W. Mitchell, Nature 335, 419 (1988).
- (3) H. R. Shanks, Solid State Commun. 15, 753 (1974).
- (4) J. S. Kim, L. Boeri, R. K. Kremer, and F. S. Razavi, Phys. Rev. B 74, 214513 (2006).
- (5) A. Gauzzi, S. Takashima, N. Takeshita, C. Terakura, H. Takagi, N. Emery, C. Herold, P. Lagrange, and G. Loupias, Phys. Rev. Lett. 98, 067002 (2007).
- (6) T. E. Weller, M. Ellerby, S. S. Saxena, R. P. Smith, and N. T. Skipper, Nat. Phys. 1, 39 (2005).
- (7) N. Emery, C. Hérold, M. d’Astuto, V. Garcia, Ch. Bellin, J. F. Marêché, P. Lagrange, and G. Loupias, Phy. Rev. Lett. 95, 087003 (2005).
- (8) J. J. Yang, Y. J. Choi, Y. S. Oh, A. Hogan, Y. Horibe, K. Kim, B. I. Min, and S-W. Cheong, Phy. Rev. Lett. 108, 116402 (2012).
- (9) S. Pyon, K. Kudo, and M. Nohara, J. Phys. Soc. Jpn. 81, 053701 (2012).
- (10) A. F. Fang, G. Xu, T. Dong, P. Zheng, and N. L. Wang, Scientific Reports 3, 1153 (2013).
- (11) Clarina de la Cruz, Q. Huang, J. W. Lynn, Jiying Li, W. Ratcliff II, J. L. Zarestky, H. A. Mook, G. F. Chen, J. L. Luo, N. L. Wang, and Pengcheng Dai, Nature 453, 899 (2008).
- (12) M. Yoshizawa, D. Kimura, T. Chiba, S. Simayi, Y. Nakanishi, K. Kihou, C.-H. Lee, A. Iyo, H. Eisaki, M. Nakajima, and S. -chi Uchida, J. Phys. Soc. Jpn. 81, 024604 (2012).
- (13) J. L. Niedziela, D. Parshall, K. A. Lokshin, A. S. Sefat, A. Alatas, and T. Egami, Phys. Rev. B 84, 224305 (2011).
- (14) K. Kudo, M. Takasuga, Y. Okamoto, Z. Hiroi, and M. Nohara, Phys. Rev. Lett. 109, 097002 (2012).
- (15) D. Hirai, F. von Rohr, and R. J. Cava, Phys. Rev. B 86, 100505(R) (2012).
- (16) J.P. Remeika, G.P. Espinosa, A.S. Cooper, H. Barz, J.M. Rowell, D.B. McWhan, J.M. Vandenberg, D.E. Moncton, Solid State Commun. 34, 923 (1980).
- (17) G. P. Espinosa, Mater. Res. Bull. 15, 791 (1980).
- (18) J. Yang, B. Chen, C. Michioka, and K. Yoshimura, J. Phys. Soc. Jpn. 79, 113705 (2010).
- (19) N. Kase, H. Hayamizu, and J. Akimitsu, Phys. Rev. B 83, 184509 (2011).
- (20) H. Hayamizu, N. Kase, and J. Akimitsu, J. Phys. Soc. Jpn. 80, SA114 (2011).
- (21) K. Wang and C. Petrovic, Phys. Rev. B 86, 024522 (2012).
- (22) S. Y. Zhou, H. Zhang, X. C. Hong, B. Y. Pan, X. Qiu, W. N. Dong, X. L. Li, and S. Y. Li, Phys. Rev. B 86, 064504 (2012).
- (23) S. Gerber,J. L. Gavilano, M. Medarde, V. Pomjakushin, C. Baines, E. Pomjakushina, K. Conder, and M. Kenzelmann, Phys. Rev. B 88, 104505 (2013).
- (24) H. F. Liu, C. N. Kuo, C. S. Lue, K.-Z. Syu, and Y. K. Kuo, Phys. Rev. B 88, 115113 (2013).
- (25) A. Ślebarski, M. Fijałkowski, M. M. Maáka, M. Mierzejewski, B. D. White, and M. B. Maple, Phys. Rev. B 89, 125111 (2014).
- (26) D. A. Tompsett, Phys. Rev. B 89, 075117 (2014).
- (27) P. K. Biswas, A. Amato, R. Khasanov, H. Luetkens, Kefeng Wang, C. Petrovic, R. M. Cook, M. R. Lees, and E. Morenzoni, Phys. Rev. B 90, 144505 (2014).
- (28) R. Sarkar, F. Brückner, M. Günther, C. Petrovic, Kefeng Wang, P. K. Biswas, H. Luetkens, E. Morenzoni, A. Amato, and H-H. Klauss, arXiv:1406.3544 (2014).
- (29) A. F. Fang, X. B. Wang, P. Zheng, and N. L. Wang, Phys. Rev. B 90, 035115 (2014).
- (30) C. N. Kuo, H. F. Liu, C. S. Lue, L. M. Wang, C. C. Chen, and Y. K. Kuo, Phys. Rev. B 89, 094520 (2014).
- (31) L. E. Klintberg, S. K. Goh, P. L. Alireza, P. J. Saines, D. A. Tompsett, P. W. Logg, J. Yang, B. Chen, K. Yoshimura, and F. M. Grosche, Phys. Rev. Lett. 109, 237008 (2012).
- (32) S. K. Goh, D. A. Tompsett, P. J. Saines, H. C. Chang, T. Matsumoto, M. Imai, K. Yoshimura, and F. M. Grosche, Phys. Rev. Lett. 114, 097002 (2015).
- (33) X. Chen, S. K. Goh, D. A. Tompsett, L. Klintberg, H. Tan, J. Yang, B. Chen, M. Imai, K. Yoshimura, M. B. Gamza, F. M. Grosche, M. L. Sutherland, arXiv:1509.02791 (2015).
- (34) N. D. Mathur, F. M. Grosche, S. R. Julian, I. R. Walker, D. M. Freye, R. K. W. Haselwimmer, and G. G. Lonzarich, Nature 394, 39 (1998).
- (35) P. Gegenwart, Q. Si, and F. Steglich, Nat. Phys. 4, 186 (2008).
- (36) J. Paglione and R. L. Greene, Nat. Phys. 6, 645 (2010).
- (37) K. Ishida, Y. Nakai, and H. Hosono, J. Phys. Soc. Jpn. 78, 062001 (2009).
- (38) K. Hashimoto, K. Cho, T. Shibauchi, S. Kasahara, Y. Mizukami, R. Katsumata, Y. Tsuruhara, T. Terashima, H. Ikeda, M. A. Tanatar, H. Kitano, N. Salovich, R. W. Giannetta, P. Walmsley, A. Carrington, R. Prozorov, Y. Matsuda, Science 336, 1554 (2012).
- (39) T. Shibauchi, A. Carrington, and Y. Matsuda, Annu. Rev. Condens. Matter Phys. 5, 113(2014).
- (40) R. A. Cowley, Adv. Phys. 29, 1 (1980).
- (41) M. T. Dove, Structure and Dynamics: An atomic view of materials (Oxford University Press, 2010).
- (42) E. S. R. Gopal, Specific heats at low temperatures (Plenum Press, 1966).
- (43) J. Bardeen, L. N. Cooper, and J. R. Schrieffer, Phys. Rev. 106, 162 (1957).
- (44) J. Bardeen, L. N. Cooper, and J. R. Schrieffer, Phys. Rev. 108, 1175 (1957).
- (45) See Supplemental Material at [url], which includes Ref. Tinkham04 . (i) We compared the heat capacity data up to with the more elaborate model Pad1937 ; Johnston13 (Fig. S9). The extracted values of and from this model for and agree with those from the fit using Eq. 2. For near the structural QCP, the fits to the data with the model are less satisfactory, although the ratio does not deviate much from the results of Eq. 2. Therefore, we used the result from Eq. 2, which is valid for well below , to study the trend for all the seven compositions. (ii) To further confirm the validity of our phonon model and the values, we performed a thorough entropy analysis on all samples (Section IV of Supplemental Material).
- (46) M. Tinkham, Introduction to Superconductivity: Second Edition (Dover Publication, 2004).
- (47) H. Padamsee, J. E. Neighbor, and C. A. Shiffman, J. Low. Temp. Phys. 12, 387 (1973).
- (48) D. C. Johnston, Supercond. Sci. Technol. 26, 115011 (2013).
- (49) R.A. Cowley, W.J.L. Buyers, and G. Dolling, Solid State Commun. 7 181 (1969).
- (50) G Shirane and Y Yamada, Phys. Rev. 177, 858 (1969).
- (51) P. A. Fleury, J. F. Scott, J. M. Worlock, Phys. Rev. Lett. 21, 16 (1968).
- (52) D. G. Mazzone, S. Gerber, J. L. Gavilano, R. Sibille, M. Medarde, B. Delley, M. Ramakrishnan, M. Neugebauer, L. P. Regnault, D. Chernyshov, A. Piovano, T. M. Fernandez-Diaz, L. Keller, A. Cervellino, E. Pomjakushina, K. Conder, M. Kenzelmann, Phys. Rev. B 92, 024101 (2015).
- (53) C. Poole, H. Farach, R. Creswick, and R. Prozorov, Superconductivity (Academic Press, 2007).
- (54) The notion of the ‘effective Debye temperature’ stems from the fact that the contribution of the acoustic-like branch at M is taken into account in the conversion from to , which is different from the original Debye picture where at most three acoustic branches are contributing.
- (55) J. P. Carbotte, Rev. Mod. Phys. 62, 1027 (1990).
- (56) P. K. Biswas, Z. Guguchia, R. Khasanov, M. Chinotti, L. Li, Kefeng Wang, C. Petrovic, and E. Morenzoni, arXiv:1506.04995 (2015).