Gamma-ray flare activity from PSR B1259–63 during 2014 periastron passage and comparison to its 2010 passage
Abstract
PSR B1259–63/LS 2883 is a gamma-ray binary system containing a radio pulsar in a highly elliptical 3.4-year orbit around a Be star. In its 2010 periastron passage, multiwavelength emission from radio to TeV was observed, as well as an unexpected GeV flare measured by the Fermi Large Area Telescope (LAT). Here, we report the results of LAT monitoring of PSR B1259–63 during its most recent 2014 periastron passage. We compare the gamma-ray behavior in this periastron with the former in 2010 and find that PSR B1259–63 shows a recurrent GeV flare. The similarities and differences in the phenomenology of both periastron passages are discussed.
Subject headings:
gamma rays: stars — pulsars: individual (PSR B1259–63) — X-rays: binaries1. Introduction
Gamma-ray binaries constitute a small subgroup of X-ray binaries hosting O/B stellar companions (Dubus 2013). They emit modulated radiation at the orbital period. In fact, the gamma-ray emission from these systems dominates their spectral energy distributions. Among all members in this group, PSR B1259–63 is the only one for which the compact object’s nature is known: a 47.76 ms radio pulsar orbiting a Be star (LS 2883) with a period of days. It is located at a distance of 2.3 kpc (Johnston et al. 1992, 1994; Negueruela et al. 2011; Shannon et al. 2014). Because of the high inclination angle () between the pulsar orbital plane and the Be star circumstellar disk (, Melatos et al. 1995), the circumstellar disk is crossed twice when the pulsar moves in one full highly elliptical (e 0.87) orbit. During these crossings, multiwavelength emission results from the interaction between the relativistic pulsar wind and the stellar wind of the companion (Chernyakova et al. 2006, 2009, 2014; Aharonian et al. 2009; Abdo et al. 2011).
Around the 2010 periastron passage of PSR B1259–63 (2010 December 14), enhanced gamma-ray emission as well as a month-long GeV flare were observed (Abdo et al. 2011; Tam et al. 2011). During the GeV flare, PSR B1259–63 was characterized by an extremely high conversion efficiency of the pulsar spin-down power into gamma-ray emission. The physical origin of the flare is still under debate (e.g., Khangulyan et al. 2012; Kong et al. 2012; Dubus & Cerutti 2013; Chernyakova et al. 2014). After its 3.4-year orbit period, PSR B1259–63 approached periastron again (2014 May 4). We now report the observation of a flare following the 2014 periastron at a time compatible with the extrapolated expectation following the 2010 periastron. The initiation of the flare was reported in Astronomer’s Telegrams111http://www.astronomerstelegram.org/ by Malyshev et al. (2014); Tam et al. (2014); Wood et al. (2014). Detailed results of our monitoring campaign in GeV and X-rays, analyzing the Fermi Large Area Telescope (LAT; Atwood et al. 2009) data and Swift/XRT data, respectively, are given. We also provide a comparison with a reanalysis of the 2010 periastron data using the latest LAT instrument response functions (IRF) and diffuse models.222In the process of preparing this paper, a similar study by Tam et al. (2015) was presented. While their main results are consistent with ours, we have included a more detailed comparison between 2010 and 2014 flares as well as pulsar timing analysis.
2. Observations and data analysis
The analysis of Fermi-LAT data was performed using the Fermi Science Tools333http://fermi.gsfc.nasa.gov/ssc/, 09-34-01 release. For the 2010 and 2014 periastron passages the analysis was carried out with Pass 7 reprocessed data belonging to the SOURCE event class444http://fermi.gsfc.nasa.gov/ssc/data/analysis/documentation/Pass7REP_usage.html.
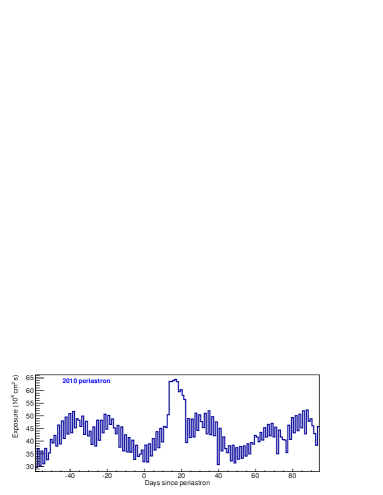
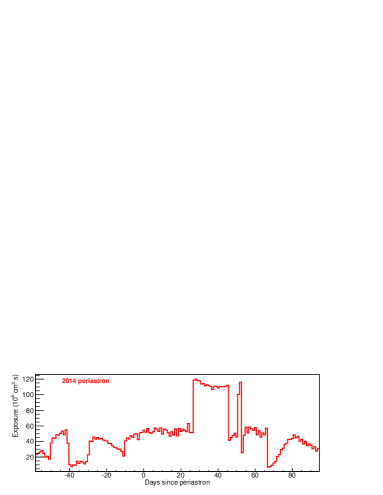
All gamma-ray photons within an energy range of 0.1–100 GeV and within a circular region of interest (ROI) of 10° radius centered on PSR B1259–63 were used for this analysis. To reject contaminating gamma rays from the Earth’s limb, we selected events with zenith angle 100°. Fermi-LAT had triggered Target of Opportunity (ToO) observations in 2014 starting 27 days after the periastron, and lasting 19 days. During the ToO, the exposure of PSR B1259–63 was increased by a factor of 2 compared to normal observations (Figure 1, panel b). In contrast, during the 2010 periastron passage a modified sky survey had commenced 13 days after periastron. In this mode, which lasted 10 days, the southern hemisphere receives 30% extra exposure (Figure 1, panel a). The gamma-ray flux and spectral results of PSR B1259–63 presented in this work were calculated by performing a binned maximum likelihood fit using the Science Tool gtlike. The spectral-spatial model constructed to perform the likelihood analysis includes Galactic and isotropic diffuse emission components as well as known gamma-ray sources within 15° of PSR B1259–63 based on a catalog internal to the collaboration (now released as the 3FGL catalog; Acero et al. 2015). The spectral parameters were fixed to the catalog values, except for the sources within 3° of PSR B1259–63555http://fermi.gsfc.nasa.gov/ssc/data/analysis/scitools/source_models.html. For these latter sources, the flux normalization was left free. We verified that changing 3° to 5° produced consistent results. PSR B1259–63 itself was modeled as a single power-law with all spectral parameters allowed to vary. The contribution of the Galactic and isotropic diffuse emissions within the analyzed ROI was estimated performing a preliminary maximum likelihood fit. For the 2010 periastron event, this fit included data from 5 months prior to 1 year after periastron. For 2014, this fit included data from 5 months prior to periastron. The resulting scale factors of the isotropic and Galactic diffuse templates were kept fixed in the analysis that follows. The 2010 and 2014 periastron times used in this paper are MJD 55544.693781 (2010 December 14 16:39:02.678) and MJD 56781.418307 (2014 May 4 10:02:21.725), which were derived from the most recent measurement of the binary system’s orbital parameters (Shannon et al. 2014).
Swift/XRT also monitored PSR B1259–63 during the 2014 periastron passage in Photon Counting (PC) and Window Timing (WT) modes666https://www.swift.psu.edu/xrt/software.html. We selected PC data with event grades 0–12 and WT data with event grades 0–2 (Burrows et al. 2005). Source events were accumulated within a circular region with a radius of 30 pixels (1 pixel = 2.36 arcsec). Background events were accumulated within a circular, source-free region with a radius of 60 pixels. Exposure maps were generated with the task XRTEXPOMAP. Ancillary response files were generated with XRTMKARF, which accounts for different extraction regions, vignetting, and point spread function corrections. We analyzed the Swift/XRT 0.1–10 keV data by HEAsoft version 6.14, 777http://heasarc.nasa.gov/lheasoft/ and spectral fitting was performed using XSPEC V.12.8.1.
3. Light curve
3.1. GeV flares
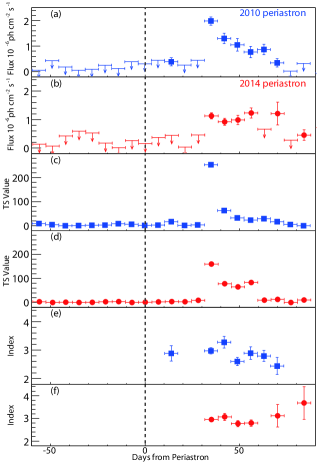
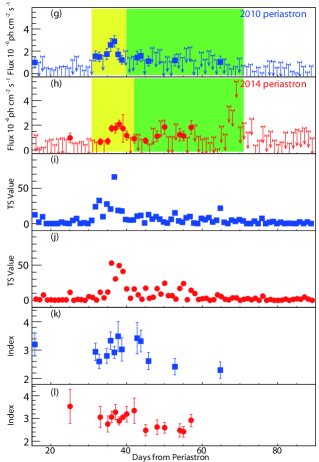
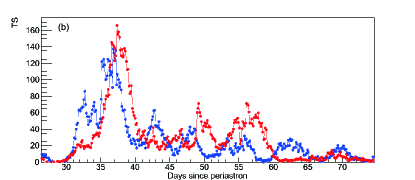
During PSR B1259–63’s 2010 periastron passage, bright GeV emission was observed 30–80 days after periastron (Abdo et al. 2011). In the 2014 periastron passage, we monitored the gamma-ray emission from PSR B1259–63 on daily and weekly timescales starting 60 days before periastron. For the time periods when PSR B1259–63 was not detected with the LAT (Test Statistic (TS)888The Test Statistic is defined as TS=, where is the maximum likelihood value for a model without an additional source (the “null hypothesis”) and is the maximum likelihood value for a model with the additional source at a specified location. A larger TS indicates that the null hypothesis is incorrect (i.e., a source really is present). As a basic rule of thumb, the square root of the TS is approximately equal to the detection significance for a given source. value 9), we placed a 95 confidence upper limit on the photon flux above 100 MeV, as evaluated with Helene’s method (Helene 1983). A rapid GeV flux and TS value increase was observed beginning 2014 June 6 (31 days after periastron, Figure 2, red points). The GeV flare is apparent to the eye when plotted in a weekly timescale (Figure 2b). The detailed daily light curve of the 2014 flare is shown in Figure 2h, 2j & 2l. A large variability is observed in the 0.1–100 GeV band, with multiple peaks in a daily timescale. To compare the 2010 flare and 2014 flare, we reanalyzed the data from the 2010 periastron passage. The weekly and daily light curves showed consistent results with those reported in Abdo et al. (2011), in which the analysis was carried out with Pass 6 data and P6V3 IRF999http://fermi.gsfc.nasa.gov/ssc/data/analysis/documentation/Cicerone/Cicerone_LAT_IRFs/IRF_overview.html.
In spite of obvious similarities, the two flares show different time evolution. The light curves of the 2010 (blue) and 2014 (red) periastron passage are plotted together in Figure 2. It is apparent to the eye that in the weekly light curve, the 2010 flare has a higher peak flux and a rapid decreasing evolution (Figure 2a). The 2014 flare has a lower peak flux, which then persists rather than falling rapidly. The daily light curves show these same trends. The 2010 flare consists of a large outburst in the beginning followed by several weaker flares. The 2014 flare is composed of several sub-flares with similar flux levels.
We calculated the cross-correlation using crosscor101010https://heasarc.gsfc.nasa.gov/xanadu/xronos/help/crosscor.html in HEASOFT with the daily flux of the 2010 and 2014 flares (30 days to 80 days after periastron), which reflects the difference of general trend. We found that the 2014 flare is days delayed from the 2010 flare. The error is estimated with 10000 simulations by sampling the daily light curve fluxes within the errors and calculating the cross-correlation for each one.
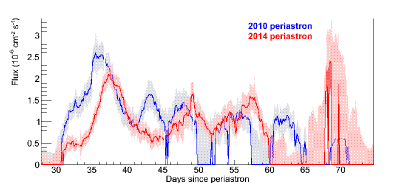
In order to better visualize similarities and differences between the 2014 and 2010 flare profiles, their smoothed light curves are plotted in Figure 3. The smoothed light curves were produced using a sliding window technique. We chose time windows of 3 days, whose starting times lag the previous one by 3 hours. For each time window, a binned likelihood analysis was performed. The spectral index of PSR B1259–63 was allowed to vary between the values 2.0 and 3.5. With the sliding window technique the smoothing is due to the correlation of the points at a time distance smaller than the time window.
Figure 3a & 3b show the flux and the TS smoothed light curves of the 2010 and 2014 periastron passages. In Figure 3a the shaded areas around the solid lines correspond to the statistical error of the flux calculation. When the TS value is low (TS 9), the smoothed light curve points are represented as null flux with shaded areas showing the upper limits of 95 confidence. In the TS smoothed light curves, the onset of the flaring activity in 2010 and 2014 periastron start approximately at the same time, days after periastron. After the onset, the 2010 periastron smoothed flux steeply increases up to its maximum at days. However, in 2014 the increase is delayed by forming a short plateau until days, after which the flux rises up to the peak (at days). The main peak of the 2014 profile is delayed by days with respect to the 2010 flare, which is consistent with the result of flux cross-correlation. A further significant difference is that in 2010 the main peak is followed by a marked second peak (at days), which in the 2014 light curve is substituted by a smooth valley. Finally, the 2014 flaring activity ends with a possible peak at days, which is consistent with the last high flux bin of the weekly light curve and high upper limits of the daily light curve (see Figure 2). However, the daily exposure time of this possible peak is 5 times less than the main peak, which leads to low TS values and makes this peak insignificant, preventing further analysis.
We searched for gamma-ray pulsations from PSR B1259–63 following the same weighted H-test procedures described in Abdo et al. (2011) and Hou et al. (2014), using a radio ephemeris internal to the collaboration measured at Parkes Observatory. All LAT observations available excluding periastron passages (from 60 days before periastron until 120 days after periastron) were taken into consideration. Neither a statistically significant detection of a pulsation, nor a detection of the source was found. We also searched for gamma-ray pulsation around the 2009 and 2012 apastron passages (from 2, 4 and 6 month intervals centered on apastron). Neither pulsation nor the source itself were significantly detected in these periods. Gamma-ray pulsations in the timeframe around the 2010 and 2014 periastron passages (from 60 days before periastron until 120 days after periastron) were also searched for, but without a detection.
3.2. Multiwavelength view of both periastra
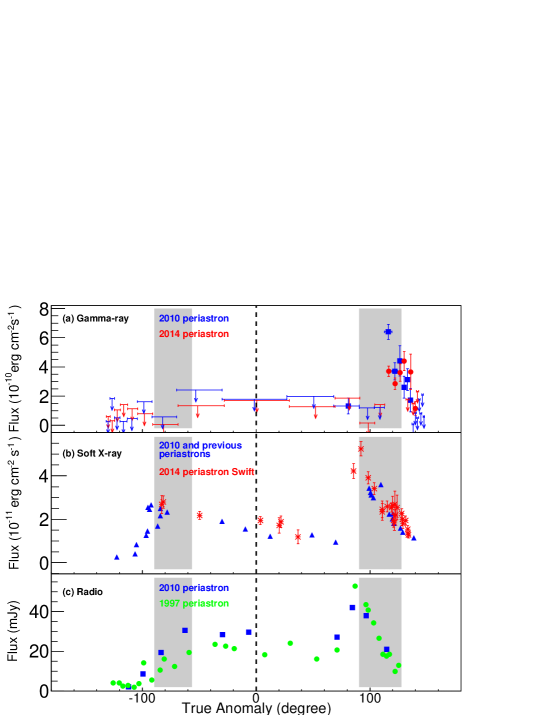
PSR B1259–63 was monitored by Swift/XRT during its 2014 periastron. No significant flux increase on timescales shorter than 4 days was observed in soft X-rays during the GeV flare (Chernyakova et al. 2015). The light curve follows the general trend of previous periastron measurements (Figure 4b). X-ray measurements of PSR B1259–63 during 2014 and previous periastra, and radio measurements during 2010 and 1997 periastra all show a double peaked structure (Figure 4b & 4c), which is expected when the pulsar crosses the companion’s circumstellar disk twice each orbit (Cominsky et al. 1994; Chernyakova et al. 2006, 2009; Abdo et al. 2011). In Figure 4 the position of the Be circumstellar disk is shown with shaded areas as proposed in Chernyakova et al. (2006)
In the 2010 and 2014 first crossings of the Be circumstellar disk, the gamma-ray flux measurements are upper limits because of the low TS value. Although the 2010 and 2014 flares are within the second crossings of the Be circumstellar disk, they are not in line with X-ray and radio activities (Figure 4a).
| Photon index | Flux(100 MeV) | ||
|---|---|---|---|
| 10-7 ph cm-2 s-1 | |||
| Average | 2.93 0.07 | 9.8 0.7 | |
| 2014 flare | Peak interval | 2.99 0.10 | 11.3 1.0 |
| Tail interval | 2.87 0.09 | 8.6 0.9 | |
| Average | 2.90 0.07 | 11.8 0.9 | |
| 2010 flare | Peak interval | 2.98 0.10 | 18.8 1.5 |
| Tail interval | 2.83 0.09 | 8.8 1.1 |
3.3. Spectral analysis
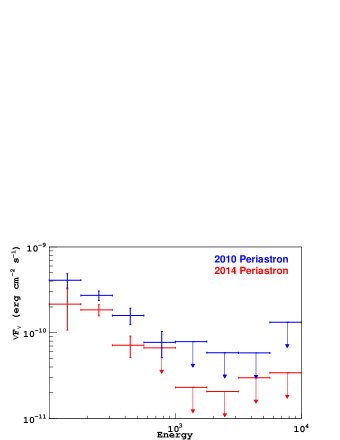
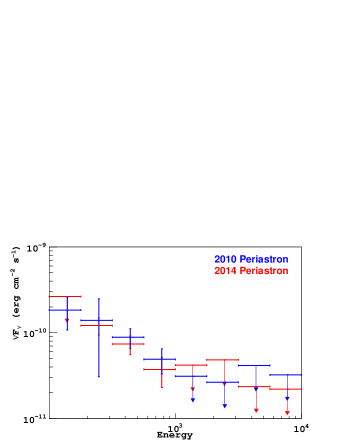
On the basis of the smoothed light curves we defined two time intervals of the flare profiles. The first interval includes the initial peak (labeled “Peak” interval). All the rest of the flare constitutes the second interval (labeled “Tail” interval). The transitions from Peak to Tail are set when TS values in Figure 3 reach the lowest value soon after the peak. For the 2010 flare, the transition from Peak to Tail occurred 40 days after the periastron while for the 2014 flare this transition occurred 42 days after periastron (Figure 2g & h). The beginnings of both flares occur at 31 days, which is the start of the TS value & flux rising in Figure 3. The ends of both flares occur at 71 days, which is the time when the TS values in Figure 3 finally drop below 10.
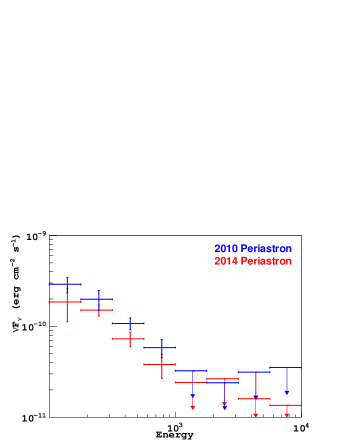
The average spectra of the whole flares, as well as the spectra of the Peak and Tail intervals were evaluated performing a binned likelihood analysis. The results are shown in Table 1 and Figure 5 . The average spectra during the 2010 and 2014 GeV flare periods are modeled by a single power law and a power law with an exponential cutoff. The spectra are shown in Figure 5a. We compare the two models utilizing the likelihood ratio test (Mattox et al. 1996). The TS between the two models is less than 9, which indicates that the significance of the spectral cutoffs for 2010 and 2014 flares are less than 3. Thus, a power law with an exponential cutoff does not significantly improve the fitting over the simpler power-law model. The fitted parameters of a single power law model are shown in Table 1. The two flares show comparable average flux levels and spectral shape (Table 1; Figure 5b & 5c). No spectral variability is seen above 3 during both 2010 and 2014 flares. The flux of the Peak interval in the 2010 flare is significantly higher than in the 2014 flare (Figure 5b), while the Tail intervals have similar fluxes (Figure 5c). In both flares the spectral slope is steeper in the Peak interval than in the Tail, but the variations are not significant.
4. Discussion
We have observed the GeV flare during the 2014 periastron passage of PSR B1259–63 with Fermi-LAT. These are our main results:
-
•
We confirm a recurrent flaring behavior in gamma rays, a phenomenon that is associated with the periastron passages.
-
•
The 2014 GeV flare exhibits a similar average flux level and spectral shape with the 2010 flare.
-
•
The two GeV flares showed different flux evolution.
-
•
The 2014 GeV flare peak is about 2 days delayed from the 2010 flare.
-
•
No GeV pulsations from PSR B1259–63 have been detected in any part of its orbit.
We have shown that the 2010 and 2014 periastron passages of PSR B1259–63 produces some striking similarities in their gamma-ray emission. At the same time, there are also certain differences that may be due to inhomogeneities in the shape, density, or extent in the circumstellar disk of the Be star. The two flares were characterized by a high efficiency in the conversion of pulsar spin-down power into gamma-ray emissions. The 2014 periastron highest day-average flux was erg cm-2 s-1 with a photon index of 3.1. Though it is lower than the peak day-average flux of the 2010 periastron, erg cm-2 s-1, it corresponds to an isotropic gamma-ray luminosity of erg s-1, equaling of the pulsar spin-down luminosity, erg s-1 (Johnston et al. 1992), without considering possible beaming effects. Gamma-ray conversion efficiency of most gamma-ray emitting pulsars is below (Abdo et al. 2013). Though we have now observed two similar GeV flares from PSR B1259–63, the origin of these events is still unclear. Khangulyan et al. (2012) account for the GeV flare by the upscattering of the circumstellar disk IR photons by the unshocked pulsar wind electrons, which will increase after the pulsar exits the second crossing of the disk. Kong et al. (2012) explain the GeV flare as the Doppler boosted synchrotron emission in the bow-shock tail, which could accommodate the high conversion efficiency of pulsar spin-down power. Dubus & Cerutti (2013) adopted upscattering of X-ray photons from the pulsar wind nebula, which would produce correlated X-ray and gamma-ray emission. Such correlation was not observed, which could be due to Doppler boosting or a realistic scattering geometry of the system. The unresolved nature and competing models of GeV flares will motivate future observations dedicated to PSR B1259–63 and hopefully improve our understanding of its unique phenomenology.
Acknowledgments
The Fermi LAT Collaboration acknowledges generous ongoing support from a number of agencies and institutes that have supported both the development and the operation of the LAT as well as scientific data analysis. These include the National Aeronautics and Space Administration and the Department of Energy in the United States, the Commissariat à l’Energie Atomique and the Centre National de la Recherche Scientifique / Institut National de Physique Nucléaire et de Physique des Particules in France, the Agenzia Spaziale Italiana and the Istituto Nazionale di Fisica Nucleare in Italy, the Ministry of Education, Culture, Sports, Science and Technology (MEXT), High Energy Accelerator Research Organization (KEK) and Japan Aerospace Exploration Agency (JAXA) in Japan, and the K. A. Wallenberg Foundation, the Swedish Research Council and the Swedish National Space Board in Sweden.
Additional support for science analysis during the operations phase is gratefully acknowledged from the Istituto Nazionale di Astrofisica in Italy and the Centre National d’Études Spatiales in France.
The Parkes radio telescope is part of the Australia Telescope which is funded by the Commonwealth Government for operation as a National Facility managed by CSIRO. We thank our colleagues for their assistance with the radio timing observations. J.L. and D.F.T. acknowledge support from the grants AYA2012-39303, SGR 2014-1073 and support from the National Natural Science Foundation of China via NSFC-11473027. D.F.T. further acknowledges the Chinese Academy of Sciences visiting professorship program 2013T2J0007. Work by C.C.C. at NRL is supported in part by NASA DPR S-15633-Y.
References
- Abdo A. et al. (2009) Abdo, A. A., Ackermann, M., Ajello, M., et al. 2011, ApJ, 736, 11
- Abdo A. et al. (2009) Abdo, A. A., Ajello, M., Allafort, A, et al. 2013, ApJS, 208, 17
- Abdo A. et al. (2009) Acero, F., Ackermann, M., Ajello, M. et al. 2015, ApJS, 218, 23
- Abdo A. et al. (2009) Aharonian, F. A., Akhperjanian, A. G., Anton, G., et al. 2009, A&A 507, 389
- Abdo A. et al. (2009) Atwood, W. B., Abdo, A. A., Ackermann, M., et al. 2009, ApJ, 697, 1701
- Abdo A. et al. (2009) Burrows, D. N., Hill, J. E., Nousek, J. A., et al. 2005, Space Sci. Rev., 120, 165
- Abdo A. et al. (2009) Chernyakova, M., Neronov, A., Lutovinov, A., et al. 2006, MNRAS, 367, 1201
- Abdo A. et al. (2009) Chernyakova, M., Neronov, A., Aharonian, F. A., Uchiyama, Y., & Takahashi, T., 2009, MNRAS, 397, 2123
- Abdo A. et al. (2009) Chernyakova, M., Abdo, A. A., Neronov, A., et al. 2014, MNRAS, 439, 432
- Abdo A. et al. (2009) Chernyakova, M., Neronov, A., van Soelen, B., et al. 2015, submitted; arXiv:1508.01339
- Abdo A. et al. (2009) Cominsky, L., Roberts, M., & Johnston, S., 1994, ApJ, 427, 978
- Dubus (2006) Dubus, G., 2013, A&ARv, 21, 64
- Dubus (2006) Dubus, G. & Cerutti, B., 2013, A&A, 557, 127
- Dubus (2006) Helene, O., 1983, NIMPR, 212, 319
- Abdo A. et al. (2009) Hou, X., Smith, D. A., Guillemot, L., et al., 2014, A&A, 570, 44
- Abdo A. et al. (2009) Johnston, S., Manchester, R. N., Lyne, A. G., et al., 1992, ApJ, 387, L37
- Abdo A. et al. (2009) Johnston, S., Manchester, R. N., Lyne, A. G., Nicastro, L., & Spyromilio, J., 1994, MNRAS, 268, 430
- Dubus (2006) Khangulyan, D., Aharonian, F. A., Bogovalov, S. V. & Ribó, M., 2012, ApJL 752, L17
- Dubus (2006) Kong, S. W., Cheng, K. S., & Huang, Y. F., 2012, ApJ 753, 127
- Abdo A. et al. (2009) Malyshev, D., Neronov, A., Chernyakova, M., 2014, ATel 6204, 1
- Abdo A. et al. (2009) Mattox, J. R., Bertsch, D. L., Chiang, J., et al., 1996, ApJ, 461, 396
- Dubus (2006) Melatos A., Johnston S., & Melrose, D. B., 1995, MNRAS, 275, 381
- Abdo A. et al. (2009) Negueruela, I., Ribó M., Herrero, A., et al., 2011, ApJ, 732, L11
- Abdo A. et al. (2009) Shannon, R. M., Johnston, S., Manchester, R. N., 2014, MNRAS, 437, 3255
- Abdo A. et al. (2009) Tam, P. H. T., Huang, R. H. H., Takata, J., et al, 2011, ApJ, 736, L10
- Abdo A. et al. (2009) Tam, P. H. T., Kong, A. K. H., & Leung, G. C. K., 2014, ATel 6216, 1
- Tam et al. (2015) Tam, P. H. T., Li, K. L., Takata, J., et al. 2015, ApJ, 798, L26
- Abdo A. et al. (2009) Wood, K. S., Caliandro, G. A., Cheung, C. C., et al. 2014, ATel 6225, 1