A New Approach to Phonon Anharmonicity
Abstract
An approach to compute the anharmonic peaks of the phonon dispersion curves through the ab initio calculated Hellmann-Feynman forces from a series of supercells with realistic atomic displacements of all atoms, which correspond to a given temperature, is reported. Obtained phonon dispersion bands are able to represent the positions and shapes of the anharmonic peaks. As example, the approach to cubic PbTe and perovskite MgSiO3 crystals is applied.
pacs:
63.20.Ry, 63.20.D-, 63.20.dkThe conventional treatment of anharmonicity in crystals relies on the expansion of the potential energy with respect to atomic displacements up to orders higher then quadratic terms. Typically, third and fourth orders expansion terms are used cowley , in spite of existence of powerful perturbation methods being able to sum part of expansion diagrams amaradudin ; barron . Unfortunately, these methods are computational very expensive.
The anharmonicity is required for derivation of the thermal conductivity of materials, specially thermoelectrics, which efficiency to transfer heat to electricity increases with lowering the heat transfer. Moreover, the high pressures thermal conductivity is important to understand heat transfer in the Earth interior.
In this Letter a new approach to handle crystals anharmonicity is proposed. It relies in probing the potential energy landscape of the crystal with atomic vibration. Then, the vibrations are transformed and classified in the wavevector reciprocal space, similar to harmonic case. The expansion of the potential energy is not needed.
The existing density functional theory (DFT) codes provide sufficiently accurate Hellmann-Feynman (HF) forces to calculate the phonon frequencies and properly describe related phenomena. The DFT approach requires to approximate the crystal as a supercell, which is a parallelepiped construction made of primitive unit cells. By definition periodic boundary conditions are imposed on the supercell.
To compute harmonic phonons, the ab initio force constant approach formulated by Parlinski, Li, Kawazoe, in 1997 prlparlinski , can be used. This method has been already applied for several hundreds of crystals and the results show good agreement with the measured phonon data. The computing method relies in using the relation between harmonic forces , induced by atoms displaced by from the equilibrium position
| (1) |
where , label the primitive unit cells in the supercell, and , number atoms within these cells. The are harmonic force constants between marked atoms and they determine the conventional dynamical matrix maradudin . The eigenvalue equation of this Hermitian matrix provides phonon frequencies , and eigenvectors . In Ref. prlparlinski was proposed to decouple each force constant matrix into a product
| (2) |
where matrix is rearranged to matrix, is a matrix, and is a matrix. The is entirely determined by crystal symmetry, and does not involve potential parameters. The parameter matrix depends on potential details only, and index denotes number of independent parameters of the force constant in question. Rearranging the three components of displacement vector into matrix , Eq.(1) becomes
| (3) |
where the symmetry adapted displacement matrix has been determined as
| (4) |
The matrix is known from used atomic displacements and crystal symmetry. For small atomic displacements of order of 0.03Å, the harmonic forces can be obtained from ab initio calculated HF forces. These data permit to find all unknown independent parameters , and from Eq. (2), all force constants within the supercell.
Single atomic displacements in the primitive unit cell is sufficient to create single HF force field for that atom. A force field is a set of HF forces obtained for the run in ab initio code with a single displaced atom. Here, denotes the number of atoms in the supercell. Usually a single HF force field is not sufficient. A minimum number of HF force fields is equal to the number of non-equivalent atoms of primitive unit cell, supplemented by a number of non-equivalent directions of the displacements. Finally we have equation of kind (3) to be solved simultaneously. Collecting these equations to a global form, the system of equations for the harmonic force constant parameters can be written as
| (5) |
where , and are , and dimensional matrices, respectively, where is now the total number of independent parameters needed for all force constants within a supercell. In this system of equations the number of HF forces is greater then the number of potential parameters, , therefore, this is an overdetermined system. To solve it, the singular value decomposition method (SVD) numericalrecipies to matrix is applied prlparlinski . Then the potential parameters can be found from HF force . This SVD method provides a solution, which is the best approximation in the least square sense. The above procedure delivers very effective method to find harmonic phonons, their frequencies, polarization vectors, phonon dispersion curves, phonon density of states, and many other phonon dependent quantities.
The global form of system of equations, Eq. (5), permits to add other conditions to be fulfilled. The simple example are the translational-rotational invariants maradudin , which can be reformulated to a form of matrix of dimensions using Eq.(2). Then, Eq.(5) becomes
| (6) |
where is adjusting the strength to satisfy the translational-rotational conditions. Eq. (6) is solved by SVD method.
To compute anharmonic effects one may use a similar approach. Any DTF calculations of HF forces contain an information on the anharmonicity. This means that there is an access to anharmonic landscape of the crystal potential energy. Generally, a HF force acting on an atom can be treated as originating either from harmonic , or from anharmonic contributions. In the pure harmonic regime the matrices , Eq.(1), do not depend on the amplitude of atomic displacements, hence they are temperature independent. It follows from linear dependence between harmonic forces and atom displacements.
The anharmonic potential has a many-body character, involving at a given temperature a lot of atoms simultaneously displaced. Additionally, all atoms of the crystal move in time, varying the displacements around the equilibrium position, and at a given time moment all atoms of the supercell create pattern of displacement , denoted as . One may treat also the displacement pattern as coming at the same time from different locations of the crystal. Each displacement pattern allows to calculate one HF anharmonic force field . Knowing the displacement patterns and force fields , we supplement the Eq.(6) by anharmonic contributions, formulating in this way a global anharmonic form of system of equations
| (7) |
where runs over displacement patterns.
The SVD solution of Eq.(7), corresponding to single displacement pattern, gives a single set of dispersion curves of index . Since in space, or in time the displacement pattern changes, for a realistic modelling of anharmonic effects one should select a sequence of N such patterns (), and compute dispersion curves for all these patterns. From set to set, probing different anharmonic environments, the phonon dispersion curves are slightly different due to variation of potential energy reached now by displaced atoms. Indeed, in the absence of anharmonicity, for example with negligible amplitudes of atomic displacements, all sets of phonon dispersion curves will be identical to harmonic case within the accuracy of a computational noise and approximate SVD solution. In anharmonic case all phonon dispersion curves, form bands, which reflect the anharmonic character of the potential energy landscape, caused by the atomic displacements around the global potential minima.
To stay consistent with the supercell concept, the displacement patterns must preserve the periodic boundary conditions. Thus, a displacement pattern must be a superposition of the allowed phonon displacement waves. Hence, each phonon displacement wave must be commensurate with the supercell size and shape. Its amplitude can be estimated from the harmonic theory as
| (8) |
where the mean square amplitude of the wave is determined by
| (9) |
and are the harmonic phonon frequencies at wavevector , and phonon branch . The phase factor could be taken at random to mimic different displacement patterns. The temperature displacement variation, Eq.(8) depends on the thermal occupation factor, Eq.(9). The HF forces calculated for a displacement pattern include contributions arising from many atoms displaced simultaneously. The approximation relies on using only displacement waves of a few hundreds discreet wavevectors. We remark that the displacement patterns may also be obtained in another way, for example, as snapshots of atomic motion traced during molecular dynamic simulation. But even in this case the confinements imposed by selecting only commensurate displacement waves holds as well.
The crystal symmetry is determined by the crystallographic space group. In harmonic regime all fluctuations - atomic displacements - are described and classified by the phonon modes. To each phonon mode an irreducible representation of the crystal space group is assigned. The above classification applies to phonon modes derived from force constants being a solution of Eq.(6), and each set of global system of equations, Eq.(7). Then, it follows that the current anharmonic phonon bands are characterized by the same irreducible representations as the irreducible representations of corresponding phonon dispersion relations of the harmonic case. However, the anharmonic phonon bands have much larger chances to overlap. Therefore, a systematic method to select out a single anharmonic peak from phonon bands is required.
Now the projection method to select out a particular anharmonic mode is proposed. The conventional assignment of irreducible representations to harmonic phonons is considered as a reference to classify the anharmonic peaks. Then, diagonalization of the dynamical matrix, delivers orthonormalized eigenvectors , and of harmonic phonons curves and anharmonic phonon bands relevant for all displacement patterns , where and label phonon modes for the same wavevector , respectively. Each eigenvector involved in the anharmonic peak can be expanded over complete set of harmonic eigenvectors
| (10) |
Applying the orthonormality relation , the expansion coefficients of Eq.(10) can be found as . At fixed wavevector the anharmonic mode of phonon density of states, denoted by , as a function of frequency , can be found from the histogram
| (11) |
where . The histogram bin is defined by the function , if , or otherwise. The summation runs over all displacement patterns . The coefficients select out from all bands only those phonon intensities which resemble the vibrations determined by harmonic eigenvectors . Each anharmonic mode of phonon density of states determines a single anharmonic mode of symmetry . The referred method is able to select out all single anharmonic peaks, even if they overlap.
The above approach is illustrated with two examples: PbTe and MgSiO3 crystals. Our intention, however, is not to provide a deep physical analysis of the samples, but to show what kind of results can be obtained. All numerical calculations were performed within DFT method using VASP code vasp , and applying GGA-PAW approach issued with this code. Phonons were calculated with PHONON code prlparlinski . Displacements of were used to generate the lists of harmonic HF forces.
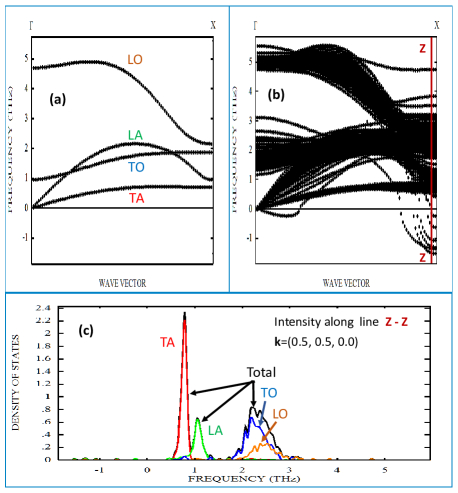
The anharmonicity of cubic PbTe semiconductor has been extensively studied in Ref. delaire . For PbTe, the space group , supercell with atoms, and -point mesh were used. The optimized lattice constant for pressure was . The effective charges of and electronic dielectric constant were taken from Ref.zhang . The harmonic phonon dispersion relations are shown on Fig.1a along wavevector path. The computed eigenvectors specify uniquely transverse (T), longitudinal (L), acoustic (A), and optical (O) polarizations, indicated as TA, LA, TO, LO modes on the plot.
For temperature , 100 displacement patterns were generated using in each case phonon waves with wavelengths commensurate with supercell. For each pattern the phonon phase was taken at random. The average atomic displacements over all patterns were 0.16 and 0.12 , and from analytical Eq.(9,) with harmonic density of states were 0.15 and 0.12 , for Pb and Te, respectively. Displaced atoms increase the potential energy of the pattern with respect to state by . Average value of , calculated from the harmonic form of the potential energy derived using the same force constant as involved in phonon bands, and on other hand from the energy excess provided by VASP, were pretty close, and read 75.37 and 74.13 meV/prim.unit cell, respectively. Moreover, the displaced patterns, according to VASP, created a pressure of 0.828 GPa in the supercell with the same lattice constant as in , namely . It is natural since the calculation at and were done at the same supercell volume.
Fig.1b shows plots of phonon bands calculated for 100 displacement patterns. Each band consists of 100 phonon curves (200 curves for doubly degenerate modes) of the same symmetry. There are regions were bands overlap. Having 600 modes for each wavevector one may construct a histogram of the anharmonic mode phonon density of states. Such a histogram, plotted for a single wavevector (line z-z), is presented on Fig.1c. It shows total mode phonon density of states and its separation into four specific anharmonic modes TA, LA, TO, and LO. The TA and LA modes look rather sharp, while TO and LO are much wider. Since the shape of each anharmonic peak is known, there is no problem to establish peak position and width. Without any additional ab initio calculations, but for the same and , the anharmonic peaks for any wavevector can be found. One notices that on Fig.1b imaginary (negative) phonon branches appear, however, they are very rare, and their contributions to anharmonic mode of phonon density of states, Fig.1c, is negligible.
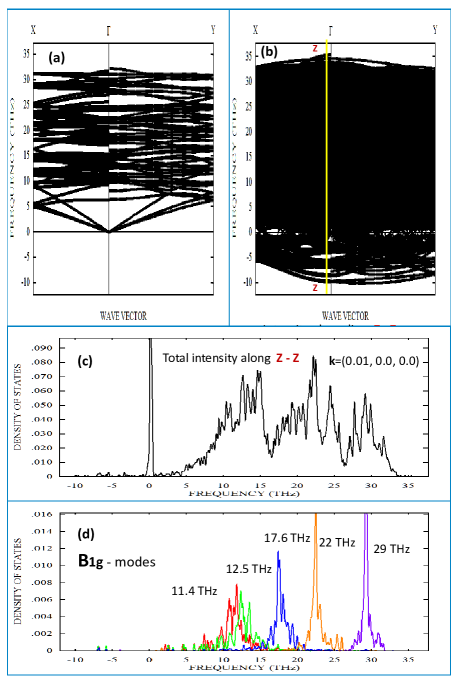
The anharmonicity of MgSiO3 has already been carried on with respect to thermodynamical properties and thermal conductivity dekura of the Earth lower mantle, where high and persist. The perovskite MgSiO3 belongs to orthorhombic space group , No=62. For all runs the supercell, and -point mesh were selected. For effective charges the formal charges were chosen. The anharmonic calculations started from optimization of the supercell at pressure of and . Hence, the lattice constants , , were found. The harmonic phonon dispersion relations were plotted along wavevector path, and are shown on Fig.2a. Since the primitive unit cell contains 20 atoms, therefore there appears 60 phonon dispersion curves.
For the anharmonic analysis temperature of was chosen, and 100 displacement patterns was generated. Each pattern used 117 phonon waves with wavelength commensurate to the supercell size. The average atomic displacements over all patterns were slightly anisotropic, but the average values of them were: 0.125, 0.105, 0.128, and 0.089 , and from analytical Eq.(9,) with harmonic density of states were 0.110, 0.105, 0.127 and 0.087 , for O1, O2, Mg and Si atoms , respectively. The potential energy increased due to presence of the atomic displacements. The energy excess calculated directly from force constants and from VASP were 6.049 and 6.727 eV/primitive unit cell, respectively. The displacement patters created the pressure for the same volume as used in .
Next, the anharmonic properties for and were calculated. Fig.2b shows plots of phonon bands calculated along similar wavevector path as for harmonic phonon curves. Each band consists of 100 phonon curves of the same symmetry. There is so many bands that they overlap, and the information becomes obscure. Moreover, there are observed phonon curves which exists in the imaginary frequency region, although their intensities were negligible. Having 6000 modes for each wavevector one may construct a histogram of the total anharmonic mode phonon density of states. Such a histogram, plotted for a single wavevector close to (line z-z at (b) plot), is presented on Fig.1c. Applying the projection method, Eqs (10,11) to the total anharmonic mode phonon density of states, the separation of all 60 anharmonic peaks could be done. For example, choosing from 60 -modes one kind, for example and projecting the anharmonic eigenvectors onto harmonic eigenvectors, the anharmonic peaks were found and plotted on Fig.2d. All peaks are well defined, and could be used to determine their positions and widths, and hence the phonon lifetimes. Such a procedure of selection anharmonic modes can be applied to any wavevector.
In conclusions we turn attention on several aspects: (i) the phonon lifetime is usually found from the width of the anharmonic peak , where operator denotes a procedure to elucidate the width from fitted Gaussian, Lorentzian, or similar function. Some of the peaks may contain low intensity tails, which influence the phonon lifetime. (ii) the ab initio code typically is handling phonon-phonon, electron-phonon, and magnetic-phonon interactions, and these effects are included in the present method. (iii) the anharmonicity is measured by spectroscopic methods. The description of the cross sections are as a rule supplemented by certain form factor, and corresponding theoretical expression can be derived for phonon bands. It means that the expected spectroscopic spectra can be determined from phonon bands. (iv) for the Raman scattering, or infrared absorption the current method offer to include changes of Raman tensor itself, or effective charges itself due to atomic displacements in the patterns, respectively. This effects might influence the Raman or infrared spectra. (v) anharmonic displacement patterns offer full parallelization, The CPU time on the cluster for MgSiO3 example was about 10 hours only.
The author acknowledges discussions with P.Piekarz, A.Oleś, U.Wdowik, J.Jochym, M.Sternik and J.Łażewski who also helped to run some calculations.
References
- (1) R.A.Cowley, Rep. Prog. Phys. 31 123 (1968).
- (2) A.A.Maradudin, and A.E.Fein, Phys.Rev. 128 2589 (1962).
- (3) A.A.Maradudin, in Dynamical Properties of Solids, edited by G.K.Horton, and A.A.Maradudin (North-Holland, Publishing Company, Amsterdam, American Elsevier Publishing Company, Inc, New York, 1974) Vol. 1, p. 1.
- (4) T.H.K.Barron, and M.L.Klein, in Dynamical Properties of Solids, edited by G.K.Horton, and A.A.Maradudin (North-Holland, Publishing Company, Amsterdam, American Elsvier Publishing Company, Inc, New York, 1974) Vol. 1, p. 391.
- (5) K.Parlinski, Z.Q.Li, and Y.Kawazoe, Phys.Rev.Lett. 78, 4063 (1997).
- (6) W.H.Press, S.A.Teukolsky, W.T.Vetterling, and B.P.Flannery, Numerical Recipes (Cambridge University Press, Cambridge, England, 1992), p.670
- (7) G.Kresse, and J.Furthmüller, Phys.Rev. B 54, 11169 (1996); Comput. Mater. Sci. 6, 15 (1996).
- (8) O.Delaire, J.Ma, K.Marty, A.F.May, M.A.McGuire, M-H.Du, D.J.Singh, A.Podlesnyak, G.Ehlers, M.D.Lumsden and B.C.Sales, Nature Materials 10, 614 (2011).
- (9) Y.Zhang, X.Ke, C.Chen, C.Yang, J.Yang, and P.R.C.Kent, Phys.Rev. B 80, 024304 (2009).
- (10) H.Dekura, T.Tsuchiya, and J.Tsuchiya, Phys.Rev.Lett. 110, 025904 (2013).