The Early ALMA View of the FU Ori Outburst System
Abstract
We have obtained ALMA Band 7 observations of the FU Ori outburst system at 0.60.5 resolution to measure the link between the inner disk instability and the outer disk through sub-mm continuum and molecular line observations. Our observations detect continuum emission which can be well modeled by two unresolved sources located at the position of each binary component. The interferometric observations recover the entire flux reported in previous single-dish studies, ruling out the presence of a large envelope. Assuming that the dust is optically thin, we derive disk dust masses of M⊙ and M⊙, for the north and south components respectively. We place limits on the disks’ radii of 45 AU. We report the detection of molecular emission from 12CO(3-2), HCO+(4-3) and from HCN(4-3). The 12CO appears widespread across the two binary components, and is slightly more extended than the continuum emission. The denser gas tracer HCO+ peaks close to the position of the southern binary component, while HCN appears peaked at the position of the northern component. This suggests that the southern binary component is embedded in denser molecular material, consistent with previous studies that indicate a heavily reddened object. At this angular resolution any interaction between the two unresolved disk components cannot be disentangled. Higher resolution images are vital to understanding the process of star formation via rapid accretion FU Ori-type episodes.
1 Introduction
It is well understood that stars acquire most of their material through an accretion disk that is fed, at least at early times, by a surrounding envelope. Once the bulk of the envelope is dissipated, the accretion rates tend to approach or M⊙ yr-1. A small percentage of young stars – FU Orionis or FU Ori objects – exhibit rapid optical brightening of several magnitudes over timescales as short as one year (Herbig, 1966). During the outburst phase, the accretion rates increase by factors of or more relative to the quiescent periods, reaching rates as high as M⊙ yr-1. This high state can last for 100 years and deposit a significant amount of disk material (0.01 M⊙) onto the young star in a short period (Hartmann & Kenyon, 1996, and references therein).
The cause of these outbursts is not well understood. Different mechanisms have been proposed as possible origin for the outburst (Audard et al., 2014): 1) thermal instability (Bell & Lin, 1994), 2) coupling of gravitational and magnetorotational instabilities (Armitage et al., 2001; Zhu et al., 2009), 3) disk fragmentation (Vorobyov & Basu, 2006; Zhu et al., 2012), and 4) tidal interactions between the disk and either planets (Lodato & Clarke, 2004) or stellar companions (Bonnell & Bastien, 1992).
Connecting infrared studies which probe inside radii of 1-10 AU to the main mass reservoirs in the outer disk and/or envelope is particularly important if a full understanding of the phenomenon is to be achieved. For instance, it remains unclear whether the reservoir of material feeding the enhanced accretion rate is distributed in a circumstellar disk, in a larger envelope, or both. The only way to accurately recover the surface density distribution of the gas and dust around FU Ori objects is via resolved imaging of the disk at, preferably multiple, (sub)millimeter wavelengths and/or transitions where the emission is most likely optically thin.
If the disk is small, and if there is no reservoir of material from which to replenish it, if it continues to accrete at Myr-1, the disk may be quickly dying. If the disk is indeed more massive and/or larger than previous submillimeter observations indicate, it is then a counterpart to the more massive disks seen in nearer star forming regions and we are simply seeing one outburst of potentially many. Clearly, resolving the source and determining the mass is key.
FU Ori
Despite being the prototype of the FU Ori class and one of the nearest such objects, at a distance of 450 pc (Murdin & Penston, 1977), little is known about the global properties of the accretion disk surrounding FU Ori itself. The estimated age of the system is 2 Myr (Beck & Aspin, 2012). Early interferometric studies at 1.3 mm by McMuldroch (1995) found an unresolved (at 3.5″resolution, or 1500 AU ) disk with 13CO(2-1) emission spanning 8.1-13.3 km s-1 with a total integrated intensity of 1.4 Jy. Studies with the JCMT by Sandell & Weintraub (2001) show an unresolved continuum source (5″in diameter) and a flux of 66 and 400 mJy at 850 and 450 m, respectively. These results suggest there is no envelope bigger than 1500 AU around the source.
Significant progress has been made towards understanding the inner disk of FU Ori objects in general and FU Ori specifically (see papers by e.g. Zhu et al., 2009; Eisner & Hillenbrand, 2011). The region of rapid accretion for FU Ori itself has been shown to be occurring over a radius of 1 AU, or 0.005″, in diameter. Given the size of the region involved, thermal instability alone cannot explain the outburst and appeals to other outbursts mechanisms must be made.
FU Ori was discovered to be a binary system by (Wang et al., 2004), with the newly discovered binary component (FU Ori South, or FU Ori S hereafter) located 0.5″to the South of the brighter principal component, FU Ori. Recent studies indicate FU Ori S is actually the more massive star in the system (1.2 M⊙; Beck & Aspin, 2012), heavily embedded in obscuring material (Pueyo et al., 2012). A number of FU Ori type objects have now been identified as having binary components (e.g., L1551 IRS5, RNO 1B/C, AR 6A/B Pueyo et al., 2012, and references therein), triggering discussion on whether the rapidly accreting FU Ori phenomenon could be caused by close-companion interaction. However, at least in the case of FU Ori itself, this hypothesis remains inconclusive (e.g. see the discussion in Beck & Aspin, 2012).
Sandell & Weintraub (2001) suggest an upper limit for the disk mass at 0.02 M⊙. There are a variety of ways to constraint the dust, gas and total mass of the disk, all of which involve obtaining resolved imaging to determine the optically thick contribution and model fits (Andrews & Williams, 2007; Eisner et al., 2008). Below we present new observations of FU Ori with sufficient resolution to constrain the masses of disks around FU Ori N and S.
2 Observations and data reduction
FU Ori Band 7 observations were acquired on December 2nd 2012 using 24 antennas. The dataset provides baselines from 15 to 381 meters. During the observations the precipitable water vapor in the atmosphere was stable between 1.3 and 1.7 mm with clear sky conditions, resulting in median system temperature of 190 K. The ALMA correlator was configured in the Frequency Division Mode (FDM) to provide 468.75 MHz bandwidth in each of four different spectral windows at 122 kHz (0.1 km s-1) resolution per channel. Three spectral windows were positioned to target the 12CO , HCN and HCO+ transitions at 345.79599, 354.50547 and 356.73424 GHz, respectively. The fourth spectral window was positioned in a region devoid of line emission for detecting the continuum dust emission (centered at 345.78359 GHz). Callisto was observed as flux calibrator, while the quasars J0522-364 and J0532+075 were observed for bandpass and phase calibration respectively (J0532+075 is located 3.5 degrees away from the science target). Observations of the phase calibrator were alternated with the science target every 5 minutes to calibrate the time-dependent variations of the complex gains. The total time spent on-source was 16.9 minutes. A secondary phase calibrator, J053056+13322, was also observed regularly (located 5.7 degrees away).
All the data were calibrated using the Common Astronomy Software Applications package (CASA111http://casa.nrao.edu/; McMullin et al., 2007) in a standard fashion, which included offline Water Vapor Radiometer (WVR) calibration, system temperature correction, as well as bandpass, phase and amplitude calibrations. After flagging for problematic antennas, a total of 21 antennas were used for imaging. The fluxes derived for J0522-364, J0532+075 and J053056+133220 were 7.5, 1.1 and 0.5 Jy respectively. During Cycle 0, the absolute flux calibration of the data is estimated to be accurate to within 10 to 15.
Imaging of the continuum and molecular emission lines was performed using the CLEAN task in CASA. Using natural weighting resulted in a synthesized beam size of 0.630.51 at PA degrees. Continuum subtraction in the visibility domain was performed prior to imaging of each molecular line. After CLEANing the images, an RMS noise level of 25.0 mJy beam-1 per 0.22 km s-1 channel was reached (in the 12CO line). CLEANing of the dust continuum was performed after combining the line-free channels from all four spectral windows (adding to a total bandwidth of 1.759 GHz centered at 351.33 GHz), for which an RMS of 0.64 mJy beam-1 was obtained. After a single iteration of phase-only self-calibration the RMS of the continuum image was reduced to 0.31 mJy beam-1.
3 Results
3.1 Dust Continuum
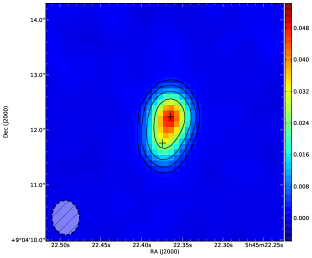
Figure 1 shows the ALMA Band 7 continuum image of FU Ori after self-calibration. The continuum emission at 0.854 mm (351.33 GHz) is detected at a signal-to-noise ratio (SNR) of 150. The emission is resolved, with the peak roughly coinciding with the position of the northern binary component (FU Ori). We used the CASA task IMFIT to fit the observed emission using a single component 2-D Gaussian, but inspection of the residual image shows that a single-component fit fails to match data. Using two unresolved sources provides a much better fit to the observed emission (with residuals down to the image noise levels). The total fluxes of each component are 50.1 mJy and 21.2 mJy respectively.
The parameters of the Gaussian components determined using IMFIT are detailed in Table 1. The positions of each Gaussian component are shown in Figure 1. The position of the brighter component coincides within 0.1” of the optical position of FU Ori (as listed in 2MASS), whilst the fainter disk is located 0.5” to the South-East (0.48” to the South and 0.14 to the East). This is similar to the separation between the FU Ori and FU Ori S, as reported in previous near-IR observations (e.g. Wang et al., 2004; Monnier et al., 2009; Beck & Aspin, 2012; Pueyo et al., 2012, and references therein).
3.2 Line emission
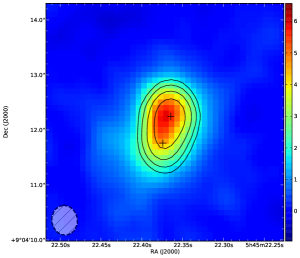
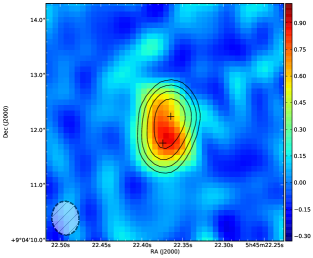
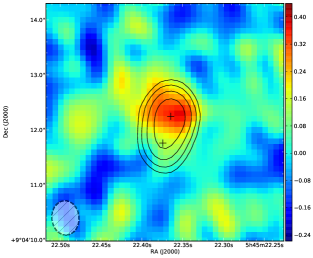
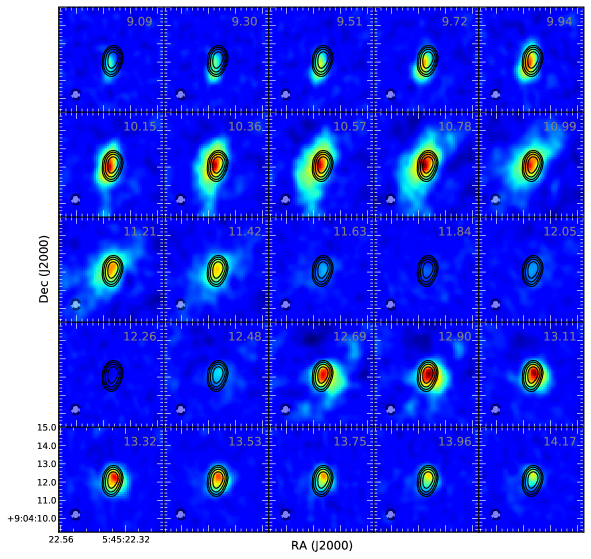
We detect emission from 12CO , HCO+ and HCN molecules at SNR levels (peak/rms) of 47, 12 and 5 respectively. Figure 1 and Figure 2 show the integrated emission maps for each molecule. The integrated line emissions are 31.61, 2.14 and 0.37 Jy km s-1 respectively. Figure 3 shows the 12CO channel maps towards FU Ori. The integrated intensity maps of the three molecules are strikingly different. 12CO is more extended compared to the continuum (extending up 1” from FU Ori, and covering the two binary components), and peaks east-ward from FU Ori. On the other hand, HCO+ peaks close to the position of the southern binary component (FU Ori S), whilst HCN appears to peak closer to FU Ori.
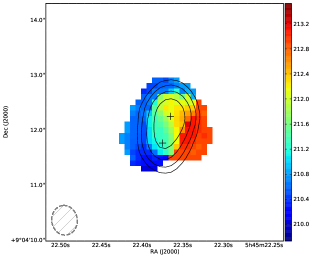
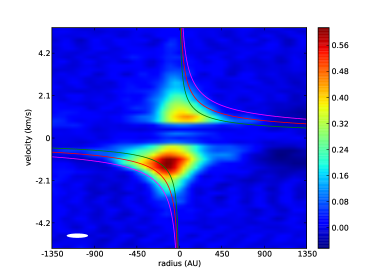
Figure 3 shows the 12CO channel maps towards FU Ori. There is significant cloud contamination in the central channels, making the interpretation of the 12CO spectrum difficult. The velocity of the channels with no 12CO emission (11.8 km s-1) is very similar to the velocity channels where strong 12CO(1-0) emission was previously detected with the NRAO 11m telescope (Kutner et al., 1982). This suggests that unresolved emission and/or absorption from the larger Orion molecular clouds contaminates the emission in the central channels of the ALMA spectrum. Nevertheless, a velocity gradient can be perceived in the channel maps and in the first moment map of the 12CO (Figure 4). Figure 4 shows the position-velocity diagram taken in the East-West direction (where the velocity gradient appears to be larger), which suggests there is gas in keplerian rotation around the system.
4 Discussion
We detect continuum emission towards both binary components, suggesting they both harbour circumstellar disks. The disks are unresolved at the 0.60.5 resolution of our observations (or 225 AU at FU Ori’s 450 pc distance), placing upper limits on the disk radial sizes. To be consistent with the Gaussian fit, the disks must have radial sizes smaller than 0.1” (45 AU). At the projected separation of the binary system (225 AU), the disks radii are predicted to be truncated at 0.2 to 0.5 times the binary separation (Artymowicz & Lubow, 1996). The deconvolved disk sizes of 45 AU coincide with 0.2 times the binary separation.
Our ALMA data rule out the presence of a large envelope around the two stars, since our observations would have detected any extended emission smaller than ” (3000 AU) in diameter. Our observations also place limits on the presence of a possible circumbinary ring orbiting the system. Assuming a 0.5” wide ring, starting at 1.5” (given the minimal truncation radius for the projected binary orbit; e.g. Artymowicz & Lubow, 1996), the ring would need to have a dust mass smaller than M⊙ to remain undetected by our observations (at 3-, assuming a dust temperature of 20 K). This is similar to recent ALMA results from Akeson & Jensen (2014) in which no circumbinary emission was detected in any of the 17 binary stars of their sample.
Assuming a dust temperature of 50 K for the individual disks around FU Ori and FU Ori S, a gas-to-dust ratio of 100, and a 345 GHz dust opacity of 1.5 cmg-1, we can compute a coarse estimate of the disks’ total masses (e.g. Beckwith et al., 1990). Under these assumptions, the ALMA 854 m fluxes correspond to disk dust masses of M⊙ and M⊙, for the north and south components respectively. The total mass of the combined disks is comparable to the mass estimated from unresolved observations (Sandell & Weintraub, 2001). These mass estimates are, however, subject to the assumption that the dust emission is optically thin. For the disks to be optically thick, the average disk dust temperature would have to be higher than 80 K. Assuming a dependence for the disk temperature, an average T 80 K is reached if the temperature at 45 AU is greater than 60 K. This is high for a typical T Tauri disk, but it corresponds roughly to the radiative equilibrium temperature for a source with a luminosity larger than about 4 L⊙. This is perfectly feasible for FU Ori, where the outburst luminosity much larger than the photospheric luminosity. We conclude that the disks could be marginally optically thick, although higher resolution imaging would be required to accurately constrain this.
According to Beck & Aspin (2012) the masses of FU Ori and FU Ori S are 0.3 M⊙, and 1.2 M⊙ respectively. Assuming an effective temperature of 4000-6500 K and an optical extinction of AV=8-12, Pueyo et al. (2012) estimate a minimum mass for FU Ori S of 0.5 M⊙. Both studies agree that FU Ori S is the most massive star in the system. In this scenario FU Ori S would be the primary star in the system. Unfortunately, our line data lacks the angular resolution to resolve the velocity gradients across each disk, which could be used to confirm these stellar masses.
Theoretical models predict that the circumprimary disks should be the most massive disks in the system (e.g. Bate, 2000). However, recent submillimeter surveys of binary systems show no clear relationship between disk masses and stellar mass ratios (Harris et al., 2012; Akeson & Jensen, 2014). As noted by these authors, the predictions from these theoretical models only consider the initial conditions of the binary disks and do not take into account the dynamical evolution of the disks (e.g. viscous accretion and other dissipative processes). Assuming that both disks have the same average dust temperature, we find that in the FU Ori system the brightest and most massive disk orbits the less massive star. We note that this scenario may be different if the southern disk is cooler than the northern disk. For instance, if the southern disk has an average dust temperature of 20 K, its mass would be higher than the M⊙ dust mass derived for the northern disk.
The denser gas tracer HCO+ peaks in the position of the most massive star FU Ori S, and is not detected in the direction of FU Ori. Since HCO+ is a higher density gas tracer, this suggests that FU Ori total disk mass is probably lower than FU Ori S’s disk. On the other hand, HCN is detected only toward FU Ori. HCN forms at large heights above the midplane, where the temperature are higher and the densities are lower compared to the midplane (e.g. Walsh et al., 2010). Therefore, the HCN detection around FU Ori and not FU Ori S’s could support the idea that the disk around FU Ori has a higher dust temperature compared to the disk around FU Ori S. As noted above, an average dust temperature below 20 K for FU Ori S would make it the most massive of the two disks, which would be in agreement with the interpretation of the HCO+ detection.
Based on the stellar photospheric absorption features Beck & Aspin (2012) estimate the accretion rate of FU Ori S in M⊙ yr-1. For FU Ori the accretion rate derived by Zhu et al. (2007) is M⊙ yr-1. However this is highly model dependent is likely to correspond to the maximum accretion rate during the peak periods of episodic accretion. It is unlikely that FU Ori’s high accretion rate can continue for long. If FU Ori continues to accrete at M⊙ yr-1, its submillimeter flux would decrease by a factor of ten within a decade. To sustain the disk dust mass we infer from our ALMA observations, the stellar accretion rate must be highly variable.
5 Conclusions
We obtained ALMA Band 7 observations of the FU Ori binary system at 0.60.5′′ resolution in Cycle 0. Our observations detect continuum emission from two unresolved sources at the position of each binary component. This indicates that both binary components have disks. Under simple assumptions, these observations suggest that the most massive disk orbits the less massive star (FU Ori).
The interferometric observations recover the entire flux reported in previous single-dish studies, ruling out the presence of a large envelope for replenishing the disks. The dust disks were unresolved in our observations, implying that they are significantly smaller than non FU Ori objects such as e.g. AB Aur, HL Tau and HD 163296.
We report the detection of molecular emission from 12CO(3-2), HCO+(4-3) and from HCN(4-3). Whilst the 12CO appears widespread across the two binary components , HCO+ peaks close to the position of the southern binary component. This suggests that the southern binary component is embedded in dense molecular material, which is consistent with infrared studies that indicate that this is a heavily reddened object. Is this clump the reservoir of material feeding the outburst of the northern binary component? At this angular resolution the interaction between the two unresolved disk cannot be disentangled.
Observations at higher spatial resolution are mandatory to investigate whether interactions between the disks or other mechanisms (e.g. disk fragmentation) are causing the outburst.
Acknowledgments
This paper makes use of the following ALMA data: ADS/JAO.ALMA.2011.0.00538.S. ALMA is a partnership of ESO (representing its member states), NSF (USA) and NINS (Japan), together with NRC (Canada) and NSC and ASIAA (Taiwan), in cooperation with the Republic of Chile. The Joint ALMA Observatory is operated by ESO, AUI/NRAO and NAOJ. The National Radio Astronomy Observatory is a facility of the National Science Foundation operated under cooperative agreement by Associated Universities, Inc. This research made use of Astropy, a community-developed core Python package for Astronomy (Astropy Collaboration et al., 2013). JAE acknowledges support from NSF AAG grant 1311910. L.A.C. was supported by ALMA-CONICYT grant number 31120009 and CONICYT-FONDECYT grant number 1140109. L.A.C. also acknowledges support from the Millennium Science Initiative (Chilean Ministry of Economy), through grant ”Nucleus RC130007”.
References
- Akeson & Jensen (2014) Akeson, R. L., & Jensen, E. L. N. 2014, ApJ, 784, 62
- Andrews & Williams (2007) Andrews, S. M., & Williams, J. P. 2007, ApJ, 659, 705
- Armitage et al. (2001) Armitage, P. J., Livio, M., & Pringle, J. E. 2001, MNRAS, 324, 705
- Artymowicz & Lubow (1996) Artymowicz, P., & Lubow, S. H. 1996, ApJ, 467, L77
- Astropy Collaboration et al. (2013) Astropy Collaboration, Robitaille, T. P., Tollerud, E. J., et al. 2013, A&A, 558, AA33
- Audard et al. (2014) Audard, M., Ábrahám, P., Dunham, M. M., et al. 2014, Protostars and Planets VI, 387
- Bate (2000) Bate, M. R. 2000, MNRAS, 314, 33
- Beck & Aspin (2012) Beck, T. L., & Aspin, C. 2012, AJ, 143, 55
- Beckwith et al. (1990) Beckwith, S. V. W., Sargent, A. I., Chini, R. S., & Guesten, R. 1990, AJ, 99, 924
- Bell & Lin (1994) Bell, K. R., & Lin, D. N. C. 1994, ApJ, 427, 987
- Bonnell & Bastien (1992) Bonnell, I., & Bastien, P. 1992, ApJ, 401, L31
- Eisner et al. (2008) Eisner, J. A., Plambeck, R. L., Carpenter, J. M., et al. 2008, ApJ, 683, 304
- Eisner & Hillenbrand (2011) Eisner, J. A., & Hillenbrand, L. A. 2011, ApJ, 738, 9
- Evans et al. (1994) Evans, N. J., II, Balkum, S., Levreault, R. M., Hartmann, L., & Kenyon, S. 1994, ApJ, 424, 793
- Harris et al. (2012) Harris, R. J., Andrews, S. M., Wilner, D. J., & Kraus, A. L. 2012, ApJ, 751, 115
- Hartmann & Kenyon (1996) Hartmann, L., & Kenyon, S. J. 1996, ARA&A, 34, 207
- Herbig (1966) Herbig, G. H. 1966, Vistas in Astronomy, 8, 109
- Kutner et al. (1982) Kutner, M. L., Leung, C. M., Machnik, D. E., & Mead, K. N. 1982, ApJ, 259, L35
- Lodato & Clarke (2004) Lodato, G., & Clarke, C. J. 2004, MNRAS, 353, 841
- McMuldroch (1995) McMuldroch, S. 1995, Ph.D. Thesis,
- McMullin et al. (2007) McMullin, J. P., Waters, B., Schiebel, D., Young, W., & Golap, K. 2007, Astronomical Data Analysis Software and Systems XVI, 376, 127
- Monnier et al. (2009) Monnier, J. D., Tuthill, P. G., Ireland, M., et al. 2009, ApJ, 700, 491
- Murdin & Penston (1977) Murdin, P., & Penston, M. V. 1977, MNRAS, 181, 657
- Pueyo et al. (2012) Pueyo, L., Hillenbrand, L., Vasisht, G., et al. 2012, ApJ, 757, 57
- Sandell & Weintraub (2001) Sandell, G., & Weintraub, D. A. 2001, ApJS, 134, 115
- Skinner et al. (2010) Skinner, S. L., Güdel, M., Briggs, K. R., & Lamzin, S. A. 2010, ApJ, 722, 1654
- Vorobyov & Basu (2006) Vorobyov, E. I., & Basu, S. 2006, ApJ, 650, 956
- Walsh et al. (2010) Walsh, C., Millar, T. J., & Nomura, H. 2010, ApJ, 722, 1607
- Wang et al. (2004) Wang, H., Apai, D., Henning, T., & Pascucci, I. 2004, ApJ, 601, L83
- Zhu et al. (2007) Zhu, Z., Hartmann, L., Calvet, N., et al. 2007, ApJ, 669, 483
- Zhu et al. (2009) Zhu, Z., Espaillat, C., Hinkle, K., et al. 2009, ApJ, 694, L64
- Zhu et al. (2012) Zhu, Z., Hartmann, L., Nelson, R. P., & Gammie, C. F. 2012, ApJ, 746, 110
| Component | Gaussian 1 | Gaussian 2 |
|---|---|---|
| Position (Ra, Dec) | (05:45:22.36,+09.04.12.24) | (05:45:22.37,+09.04.11.75) |
| Major axis (mas) | 662.3 3.4 | 636.3 9.0 |
| Minor axis (mas) | 536.84.3 | 517.9 8.9 |
| Position angle (deg) | 0.8 0.7 | 9.9 2.3 |
| Peak Intensity (mJy beam-1) | 45.20.3 | 20.9 0.3 |
| Integrated Flux (mJy) | 50.1 0.3 | 21.2 0.4 |