The MeSsI (Merging Systems Identification) Algorithm & Catalogue.
Abstract
Merging galaxy systems provide observational evidence of the existence of dark matter and constraints on its properties. Therefore, statisticaly uniform samples of merging systems would be a powerful tool for several studies.
In this work we present a new methodology for the identification of merging systems and the results of its application to galaxy redshift surveys.
We use as a starting point a mock catalogue of galaxy systems, identified using FoF algorithms, which experienced a major merger as indicated by its merger tree.
Applying machine learning techniques in this training sample, and using several features computed from the observable properties of galaxy members, it is possible to select galaxy groups with a high probability of having experienced a major merger. Next we apply a mixture of Gaussian technique on galaxy members in order to reconstruct the properties of the haloes involved in such merger. This methodology provides a highly reliable sample of merging systems with low contamination and precisely recovered properties. We apply our techniques to samples of galaxy systems obtained from SDSS-DR7, WINGS and HeCS. Our results recover previously known merging systems and provide several new candidates. We present their measured properties and discuss future analysis on current and forthcoming samples.
keywords:
dark matter - galaxies: clusters - galaxies: kinematics1 Introduction.
Merging galaxy systems such as the Bullet Cluster (Clowe et al., 2006), Abell 520 (Mahdavi et al., 2007; Jee et al., 2012; Clowe et al., 2012; Jee et al., 2014), Baby Bullet (Bradac et al., 2008), Pandora (Merten et al., 2011), Musket Ball (Dawson et al., 2012), El Gordo (Menanteau et al., 2012; Ng et al., 2014; Molnar & Broadhurst, 2015), Abell 1758 (Durret et al., 2005) and Abell 3716 (Andrade-Santos et al., 2015) have provided observational evidence for the existence of dark matter. Most of them have been used to test the Cold Dark Matter (CDM) paradigm itself (Markevitch et al. (2004), Hayashi & White (2006), Farrar & Rosen (2007), Milosavljevic et al. (2007), Springel & Farrar (2007), Randall et al. (2008), Mastropietro & Burkert (2008), Lee & Komatsu (2010), Forero-Romero et al. (2010), Thompson & Nagamine (2012), Watson et al. (2014), Thompson et al. (2014)). Several statistical techniques have been proposed to measure dark matter properties using merging systems (such as the self interaction cross section, Massey et al., 2011; Harvey et al., 2014; Kahlhoefer et al., 2014; Harvey et al., 2015). However, the lack of a complete and uniformly selected sample of merging systems prevents efforts to derive robust constraints. In order to overcome this limitation different approaches have been proposed: the Merging Cluster Collaboration uses the radio emission due to induced shocks in the Intra Cluster Medium (ICM, Feretti et al., 2012) to obtain high redshift merging system candidates. These systems have been studied using pan-chromatic observations and detailed merging kinematic Bayesian reconstructions (Dawson, 2013). X-ray imaging, spectra and Sunyaev Zeldovich effect observations have been used to identify unrelaxed clusters of galaxies (Mann & Ebeling, 2012), cluster mergers (Harvey et al., 2014), substructures and any departures from hydrostatic equilibrium, mainly for the most massive galaxy clusters.
Galaxy redshift surveys are very useful to trace the dynamical state of galaxy systems and to search for substructures (Dressler &
Shectman, 1988).
To this end, some methods look for departures in the global Gaussian redshift distribution of system members
(Solanes et al., 1999; Hou
et al., 2014; Yu
et al., 2015). Even though all these methods aim to identify the
substructures and recover its properties, they suffer from false identifications and incompleteness, at least to some extent.
In this work we develop a uniform identification algorithm of merging systems based on galaxy redshift catalogues.
These methods can be applied on low mass systems and should increase the
number of merging systems like the bullet group recently identified by Gastaldello
et al. (2014).
This paper is organized as follows: In Sec.2, we apply machine learning techniques to a number of observable features and
present its calibration based on the result of simulations. We also introduce techniques to recover properties of merging dark matter haloes.
In Sec. 3 we apply our techniques to samples of galaxy systems identified from low-redshift galaxy surveys
(SDSS-DR7, HeCS, WINGS).
2 Methodology.
2.1 Mock Galaxy and Halo Catalogues
From the point of view of the current theory of galaxy formation, the most direct route for defining galaxy systems is via its host dark matter halo (Mo et al., 2010).
The Millennium simulation (Springel et al., 2005), used in this work, provides a catalogue of dark matter (sub)haloes constructed using a traditional 3D Friends-of-Friends algorithm (FoF) that percolates nearby particles. The GAVO Millennium data base, also provides merger trees for each halo (Roukema et al., 1993), therefore given all the haloes belonging to a FoF group, it is possible to infer its merger tree. We compute for each FoF group a parent list of FoF progenitors (identified in previous snapshots) which have contributed with at least one subhalo to the current FoF group. We define a major merger of FoF groups as the merger between two groups where the total mass of the involved haloes represents at least a 20 per cent of the mass after the merger, it is worth noting that this condition imposes a minimal value of 0.25 for the mass ratio of the interacting systems. We construct mock catalogues of the SDSS-DR7 redshift survey based on the results of a semi-analytic model (Guo et al., 2011) and use it to calibrate our identification method for merging systems. This process is extensively described in previous works (Lares et al., 2011) and (Domínguez Romero et al., 2012).
We define a recent major merger as a the major merger of two FoF groups, where its principal haloes are still present as different haloes in the final FoF group. With this selection criteria the mean of the look-back merger time is around 3 Gyr consistent with other work (Pinkney et al., 1996). The FoF groups identified as recent major mergers and their member galaxies identified in the mock catalogs are used to train different machine learning methods.
2.2 Identification Technique of Merging Systems.
Galaxy systems were identified in the mock catalogue reproducing the FoF process as applied on real redshift catalogues (Merchán & Zandivarez (2002), Merchán & Zandivarez (2005)).
Using the properties of the galaxies in these FoF systems we compute several features relevant to the problem, namely:
-
1.
The DS test developed by Dressler & Shectman (1988), uses the deviation of the local radial velocity, defined as the mean radial velocity of the closest galaxies to each galaxy, from the global radial velocity in order to find substructures in clusters of galaxies. A global cluster value of the DS test is then obtained by summing up individual galaxy values. Following Pinkney et al. (1996) we select those systems of galaxies with an occupancy galaxy members in order to have a better identification. We performed the DS test for and and use global and individual DS values as features.
-
2.
Well known tests measuring the departures from a normal Gaussian distribution: The Anderson-Darlling test, the Cramer-von Mises test, Kolmogorov-Smirnov test, Pearson chi-square test and Shapiro-Francia test (provided by the package nortest, Gross & Ligges, 2015) and Shapiro-Wilk test (provided by the stats package).
-
3.
Astrophysical properties of galaxies and clusters: SDSS magnitudes, g-r colour index and occupancy of clusters.
With this set of features we test different machine learning algorithms such as the Logistic Regression (Davison & Hinkley, 1997; Canty & Ripley, 2015), Support Vector Machines (Cortes & Vapnik, 1995; Meyer et al., 2014) and Random Forest (hereafter RF, Breiman, 2001; Liaw & Wiener, 2002), provided by the R statistical programming language, with the aim of finding merging systems in the complete sample of galaxy clusters in our simulated catalogues.
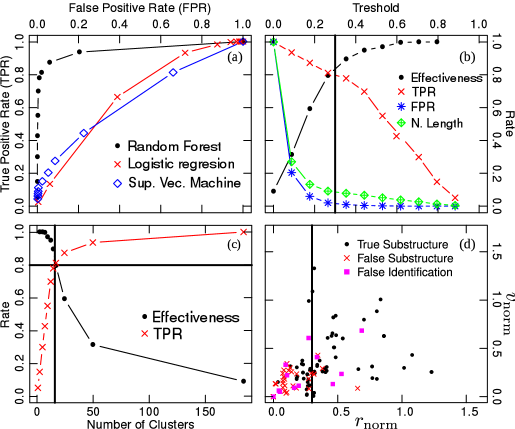
In order to measure its performance we run a standard cross validation test in 8 folds i.e. we divide the total sample in 8 individual and independent subsets and train each machine learning algorithm with 7 of them in order to predict the dynamical status of the clusters of the remaining fold. As we know both, the underlying and predicted dynamical status, we are able to compute the true positive rate (TPR), defined as the ratio between the number of merging clusters found in the final sample and the total number of merging clusters that were in the test fold. In the same way we are able to compute the false positive rate (FPR), defined as the number of relaxed clusters classified as merging clusters divided by the number of relaxed clusters that the studied fold has. This information allow us to construct the Receiver Operating Characteristic (ROC) curve showed in Fig. 1 (a) in which it can be seen that the best performance is obtained by the RF algorithm.
For each cluster the RF computes a statistic that is related to the probability that the cluster is undergoing a merger, by building many decision trees from bootstrap training data, where the final classification is based on the average assignation of the ensemble of decision trees. Each tree is grown using randomly selected features from the training dataset previously described. We impose a threshold to the RF statistic of each cluster in order to classify the sample of merging clusters. In order to select an optimal threshold, we study in Fig. 1 (b) the impact of different values on several statistics of the sample of merging systems, namely the TPR, the FPR, the effectiveness (number of identified true–mergers divided by the total number of identified mergers) and the normalized length (number of identified mergers divided by the maximum number of identified mergers of the different thresholds). As can be seen, the classification threshold impacts on the performance of the RF classifier. Consequently, we select a threshold value of . This selection criterion guarantees a low false positive detection (high effectiveness) in the selected merging systems, but it should be recalled that we are only detecting just a fraction of the overall merging systems in the simulated catalogue as can be seen in Fig. 1 (c). We note panel (d) of Fig. 1 will be analyze later in section 2.3.
The RF implementation also allows us to assess the relative importance of the features as described in Ehrlinger (2015). In our case the most important features are the number of galaxy members, the p-value of the Shapiro-Wilk test and the Dressler-Shectman test. Nevertheless, it is worth noting that all the previously described features are used in our RF implementation.
2.3 Measured Properties of the Merging Haloes.
The RF algorithm gives us a list of galaxies with high probability of belonging to the merging system. On the other hand, this method does not provide information about galaxy membership to the individual substructures. Using a Mixture of Gaussian algorithms (R package mclust, Fraley et al., 2012) it is possible to cluster these member galaxies into the two merging substructures. Assigning galaxies we are able to compute the centre position (angular and redshift) of the substructures, its velocity dispersion (Gapper estimator), virial radius and, therefore, measure a dynamical mass. In order to estimate the associated errors we implemented a bootstrap technique. As shown in Fig. 2 (a, b) the individual masses and the mass ratios are well recovered.
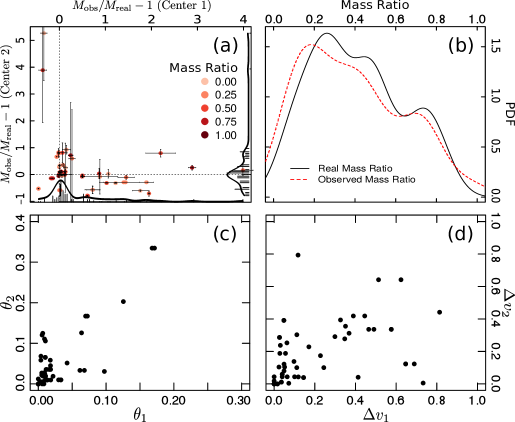
The recovered geometries of the merging systems can be seen in Fig. 1 (d) in terms of the separation of the components in the line of sight (LOS) and in the plane of the sky. Specifically in the x-axis we compute the normalized projected distance , where is the angular separation between both components of the merging system and and are the corresponding virial radii. In the y-axis we show the velocity difference where is the velocity distance between components and and are the corresponding velocity dispersions of the substructures. Using this identification method we found 3 different cases. Relaxed clusters that we classify as merging clusters (indicated by magenta squares), merging clusters in which we are unable to recover the real substructures (indicated by red crosses) and merging clusters in which we do recover the true substructures that are undergoing a merger (indicated by black dots). As can be seen the false positive cases (FPR ), indicated by magenta squares, are evenly distributed as a function of the parameter. The merging systems where we are not able to recover the real substructures are concentrated below a value of . Such a selection cut will be used in order to report the properties of the substructures. Although we are able to find spatially coincident merging systems (, that is systems merging along the LOS or systems with a small projected angular separation) we are not able to recover well the intervening substructures.
Using this methodology we are able to define samples of merging systems with high levels of purity, low contamination and almost exact computation of the centre position of each component, as can be seen in Fig. 2 (c,d). In panel (c) we show the angular separation between the actual and the recovered positions of each component, normalized to the actual virial radius. Similarly in panel (d) we show the differences between actual and measured radial velocities, divided by the real velocity dispersion. It should be recalled that our machine learning method is able to recover the correct substructures which belong to the major merger as identified using the merger tree.
3 Application to low z Clusters.
After testing our algorithm on simulated data, we applied our identification algorithms to galaxy systems with more than 30 galaxy members identified in the updated (Merchán & Zandivarez, 2002) catalogue, based on SDSS-DR7 (Abazajian et al., 2009) data and two samples of galaxy cluster measurements: WINGS (Cava et al., 2009) and HeCS (Rines et al., 2013). For the WINGS clusters we compute the g-r colour of the individual galaxies based on the observed b-v colour applying the formulas presented by the 2df Collaboration based on the results of Fukugita et al. (1995).
We report the following clusters as spatially coincident merging systems candidates: A2593, A2199✓, A2048✓, A3266✓, A3497 (full list will be available in the published version).Notice that we do not provide the substructure properties due to the LOS projection effect (as discussed in section 2.3), therefore minor mergers could be included in this sample (Ma et al., 2012). We display in Table LABEL:tab1 the properties of the two interacting structures of the merging clusters identified using our machine learning (RF) classification techniques. The errors for each property are the standard deviation computed on a hundred of measurements obtained from the RF and the clustering realizations. Many of them are well known merging systems (indicated by ✓in the table), however it is important to emphasize that our method was able to find several new candidates and also to measure their properties. It should be noted that the decomposition of these structures is only indicative, because galaxy velocities are strongly affected by the gravitational attraction of the two halos. Therefore a tomographic reconstruction is necessary (including lensing and X-ray/SZ data) to recover the substructures accurately.
3.1 The case of multiple major mergers.
It is well known that there are some clusters that are the result of the merging of more than two systems, although they represent only a small fraction of the total sample (27 of 132 in 8 SDSS mock catalogues). In order to recover all the merging substructure we performed a mixture of more than two Gaussians. We found that our algorithm is only able to recover, with reliable properties, the two more important substructures. Hence the remaining structures may appear as contamination or not appear at all. We discuss an individual analysis of Abell 1758 as an example of the multiple major merger case. This cluster is known as a merger of four substructures, two in the north and two in the south (Ragozzine et al., 2012a). At a first iteration, our algorithm, classified correctly Abell 1758 as a merging cluster, but failed to properly reconstruct the merging substructures. Considering this extra information we separate the cluster in north and south components and perform a new analysis to each separately. We find that our algorithm was able to classify both as merging clusters and well recovers the merging substructure properties of both components (north and south).
4 Conclusions and Future works
In this work we introduce a method aimed to detect merging systems of galaxies in redshift surveys. We select a random forest algorithm between other machine learning algorithms, and use as features quantities derived from the galaxy redshift space information and from photometry (eg. colours). Our detection method was trained and calibrated using a sample of merging systems extracted from mock catalogues. By studying the merger trees we check that we do find the two substructures that experienced a major merger and recover their fundamental properties (positions and masses). We apply our techniques to a sample of systems of galaxies identified in SDSS-DR7, WINGS and HeCS.
The resulting merging system sample in which we are able to recover the merging substructures comprises 12, 4 and 16 systems respectively. Additionally, we report 29 spatially coincident merging system candidates. Several of this systems where previously reported by other authors as interacting systems of galaxies. We also report for the first time 40 new nearby candidates as merging systems, that were previously overlooked.
We emphasize that our method detects in a reliable way the merging systems candidates and substructures properties, but also wish to note that, in the case of multiple mergers, some merging substructures may be joined by our algorithm and hence are reported as one component causing a possible biase in some measured properties.
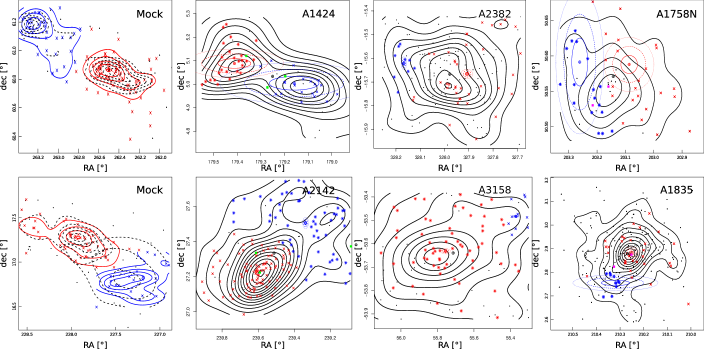
The kinematical reconstructions (see Fig. 3 and Table LABEL:tab1) will be corroborated using tomographic techniques including X-ray and weak lensing information (Gonzalez et al., 2015) in forthcoming papers. We also plan in further works to train our algorithm with light cone mocks in order to apply our technique to high redshift catalogues (CLASH-VLT (Biviano et al., 2013), FRONTIERs (Ebeling et al., 2014), EDiCs (Milvang-Jensen et al., 2008), DESI, etc.) and to study any environmental dependence of galaxy properties (eg. star formation rate, stellar mass, morphology) at different stages in the merging process. Diverse studies could be performed with a sample of merging systems like the ones presented in this paper. Using the Bayesian reconstruction techniques presented by Dawson (2013) it is possible to recover the 3D information of the merger. In a forthcoming paper we will use such information in order to explore the implications for the properties of the DM particle. A web interface implementing these methods (The MeSsI Algorithm) is freely available at http://200.16.29.98/martin/merclust.
| Name | [°] | [°] | [] | [°] | [°] | References | |||
| Abell 1424 | 3,6.7,8 | ||||||||
| Abell 2142 | 2 | ||||||||
| ✓ | |||||||||
| Abell 3158 | 4,9,16,21,22 | ||||||||
| ✓ | |||||||||
| Abell 2382 | |||||||||
| Abell 1758N | 2,23,26,27 | ||||||||
| ✓ | |||||||||
| Abell 1835 | 2,29,30 | ||||||||
Acknowledgements
MdlR warmly thanks to Monica Jauregui and Jorge de los Rios for the unconditional support.
This work is dedicated with admiration to Lionel Messi.
We also thank to Dario Graña for the technical support and Sebastían Gurovich for useful comments.
This work was partially supported by the Consejo Nacional de Investigaciones
Científicas y Técnicas (CONICET, Argentina)
and the Secretaría de Ciencia y Tecnología de la Universidad Nacional
de Córdoba (SeCyT-UNC, Argentina).
This research was developed while MJdLDR was a postdoctoral researcher at the
http://cgwa.phys.utb.edu/.
This research has made use of the
http://adsabs.harvard.edu/, Cornell University xxx.arxiv.org repository, the SIMBAD database,
operated at CDS, Strasbourg, France, the R project for statistical computing and the following
CRAN libraries: mclust,rgl,randomForest,nortest,e1071,shiny.
The Millennium Simulation databases Lemson &
Virgo Consortium (2006) used in this paper and the web application providing online access to
them were constructed as part of the activities of the GAVO.
Funding for the SDSS and SDSS-II has been provided by the Alfred P. Sloan Foundation, the Participating Institutions,
the National Science Foundation, the U.S. Department of Energy, the National Aeronautics and Space Administration, the
Japanese Monbukagakusho, the Max Planck Society, and the Higher Education Funding Council for England.
The SDSS Web Site is
http://www.sdss.org/.
References
- Abazajian et al. (2009) Abazajian K. N., et al., 2009, ApJS, 182, 543
- Abdullah et al. (2011) Abdullah M. H., Ali G. B., Ismail H. A., Rassem M. A., 2011, MNRAS, 416, 2027
- Andrade-Santos et al. (2015) Andrade-Santos F., et al., 2015, ArXiv e-prints
- Biviano et al. (2013) Biviano A., Rosati P., Balestra I., Mercurio A., 2013, A&A, 558, A1
- Boschin et al. (2012) Boschin W., Girardi M., Barrena R., Nonino M., 2012, A&A, 540, A43
- Bradac et al. (2008) Bradac M., Allen S. W., Treu T., Ebeling H., Massey R., Morris R. G., von der Linden A., Applegate D., 2008, ApJ, 687, 959
- Breiman (2001) Breiman L., 2001, Machine Learning, 45, 5
- Canty & Ripley (2015) Canty A., Ripley B. D., 2015, boot: Bootstrap R Functions
- Cava et al. (2009) Cava A., et al., 2009, A&A, 495, 707
- Clowe et al. (2006) Clowe D., Bradac M., Gonzalez A. H., Markevitch M., Randall S. W., Jones C., Zaritsky D., 2006, ApJL, 648, L109
- Clowe et al. (2012) Clowe D., Markevitch M., Bradac M., Gonzalez A. H., Chung S. M., Massey R., Zaritsky D., 2012, ApJ, 758, 128
- Cohen et al. (2014) Cohen S. A., Hickox R. C., Wegner G. A., Einasto M., Vennik J., 2014, ApJ, 783, 136
- Cortes & Vapnik (1995) Cortes C., Vapnik V., 1995, Machine Learning, 20, 273
- Davison & Hinkley (1997) Davison A. C., Hinkley D. V., 1997, Bootstrap Methods and Their Applications. CUP, Cambridge
- Dawson (2013) Dawson W. A., 2013, ApJ, 772, 131
- Dawson et al. (2012) Dawson W. A., et al., 2012, ApJL, 747, L42
- Domínguez Romero et al. (2012) Domínguez Romero M., García Lambas D., Muriel H., 2012, MNRAS, 427, L6
- Dressler & Shectman (1988) Dressler A., Shectman S. A., 1988, AJ, 95, 985
- Durret et al. (2011) Durret F., Laganá T. F., Haider M., 2011, A&A, 529, A38
- Durret et al. (2005) Durret F., Lima Neto G., Forman W., 2005, A&A, 432, 809
- Ebeling et al. (2014) Ebeling H., Ma C.-J., Barrett E., 2014, ApJS, 211, 21
- Ehrlinger (2015) Ehrlinger J., 2015, ggRandomForests: Graphical Exploration of Random Forests
- Einasto et al. (2012) Einasto M., et al., 2012, A&A, 540, A123
- Farrar & Rosen (2007) Farrar G. R., Rosen R. A., 2007, Physical Review Letters, 98, 171302
- Feretti et al. (2012) Feretti L., Giovannini G., Govoni F., Murgia M., 2012, A&ARv, 20, 54
- Forero-Romero et al. (2010) Forero-Romero J. E., Gottlober S., Yepes G., 2010, ApJ, 725, 598
- Fraley et al. (2012) Fraley C., Raftery A. E., Murphy T. B., Scrucca L., 2012
- Fukugita et al. (1995) Fukugita M., Shimasaku K., Ichikawa T., 1995, pasp, 107, 945
- Gastaldello et al. (2014) Gastaldello F., et al., 2014, MNRAS, 442, L76
- Gonzalez et al. (2015) Gonzalez J. E., et al., 2015, ArXiv e-prints
- Gross & Ligges (2015) Gross J., Ligges U., 2015, nortest: Tests for Normality
- Guo et al. (2011) Guo Q., et al., 2011, MNRAS, 413, 101
- Harvey et al. (2014) Harvey D., et al., 2014, MNRAS, 441, 404
- Harvey et al. (2015) Harvey D., Massey R., Kitching T., Taylor A., Tittley E., 2015, ArXiv e-prints
- Hayashi & White (2006) Hayashi E., White S. D. M., 2006, MNRAS, 370, L38
- Hou et al. (2014) Hou A., Parker L., Harris W. E., 2014, MNRAS, 442, 406
- Jee et al. (2014) Jee M. J., Hoekstra H., Mahdavi A., Babul A., 2014, ArXiv e-prints
- Jee et al. (2012) Jee M. J., Mahdavi A., Hoekstra H., Babul A., Dalcanton J. J., Carroll P., Capak P., 2012, ApJ, 747, 96
- Johnston-Hollitt et al. (2008) Johnston-Hollitt M., Sato M., Gill J. A., Fleenor M. C., Brick A.-M., 2008, MNRAS, 390, 289
- Kahlhoefer et al. (2014) Kahlhoefer F., Schmidt-Hoberg K., Frandsen M. T., Sarkar S., 2014, MNRAS, 437, 2865
- Korngut et al. (2011) Korngut P. M., et al., 2011, ApJ, 734, 10
- Lares et al. (2011) Lares M., Lambas D., Domínguez M., 2011, AJ, 142, 13
- Lee & Komatsu (2010) Lee J., Komatsu E., 2010, ApJ, 718, 60
- Lemson & Virgo Consortium (2006) Lemson G., Virgo Consortium t., 2006, ArXiv Astrophysics e-prints
- Liaw & Wiener (2002) Liaw A., Wiener M., 2002, R News, 2, 18
- Ma et al. (2012) Ma C.-J., Owers M., Nulsen P. E. J., McNamara B. R., Murray S. S., Couch W. J., 2012, ApJ, 752, 139
- Mahdavi et al. (2007) Mahdavi A., Hoekstra H., Babul A., Balam D. D., Capak P. L., 2007, ApJ, 668, 806
- Mann & Ebeling (2012) Mann A. W., Ebeling H., 2012, MNRAS, 420, 2120
- Markevitch et al. (2004) Markevitch M., Gonzalez A. H., Clowe D., Vikhlinin A., Forman W., Jones C., Murray S., Tucker W., 2004, ApJ, 606, 819
- Massey et al. (2011) Massey R., Kitching T., Nagai D., 2011, MNRAS, 413, 1709
- Mastropietro & Burkert (2008) Mastropietro C., Burkert A., 2008, MNRAS, 389, 967
- Menanteau et al. (2012) Menanteau F., et al., 2012, ApJ, 748, 7
- Merchán & Zandivarez (2002) Merchán M., Zandivarez A., 2002, MNRAS, 335, 216
- Merchán & Zandivarez (2005) Merchán M. E., Zandivarez A., 2005, ApJ, 630, 759
- Merten et al. (2011) Merten J., et al., 2011, MNRAS, 417, 333
- Meyer et al. (2014) Meyer D., Dimitriadou E., Hornik K., Weingessel A., Leisch F., 2014, e1071, TU Wien
- Milosavljevic et al. (2007) Milosavljevic M., Koda J., Nagai D., Nakar E., Shapiro P. R., 2007, ApJL, 661, L131
- Milvang-Jensen et al. (2008) Milvang-Jensen B., Noll S., Halliday C., Poggianti B. M., 2008, A&A, 482, 419
- Mo et al. (2010) Mo H., Van den Bosch F., White S., 2010, Galaxy formation and evolution. CUP
- Molnar & Broadhurst (2015) Molnar S. M., Broadhurst T., 2015, ApJ, 800, 37
- Ng et al. (2014) Ng K. Y., Dawson W. A., Wittman D., Jee M. J., Hughes J. P., Menanteau F., Sifón C., 2014, ArXiv e-prints
- Parekh et al. (2015) Parekh V., van der Heyden K., Ferrari C., Angus G., Holwerda B., 2015, A&A, 575, A127
- Pinkney et al. (1996) Pinkney J., Roettiger K., Burns J. O., Bird C. M., 1996, ApJS, 104, 1
- Ragozzine et al. (2012a) Ragozzine B., Clowe D., Markevitch M., Gonzalez A. H., Bradač M., 2012a, ApJ, 744, 94
- Ragozzine et al. (2012b) Ragozzine B., Clowe D., Markevitch M., Gonzalez A. H., Bradač M., 2012b, ApJ, 744, 94
- Ramella et al. (2007) Ramella M., et al., 2007, A&A, 470, 39
- Randall et al. (2008) Randall S. W., Markevitch M., Clowe D., Gonzalez A. H., Bradac M., 2008, ApJ, 679, 1173
- Rhee et al. (1991) Rhee G. F. R. N., van Haarlem M. P., Katgert P., 1991, A&A, 246, 301
- Rines & Diaferio (2006) Rines K., Diaferio A., 2006, AJ, 132, 1275
- Rines et al. (2013) Rines K., Geller M. J., Diaferio A., Kurtz M. J., 2013, ApJ, 767, 15
- Roukema et al. (1993) Roukema B. F., Quinn P. J., Peterson B. A., 1993, in Chincarini G. L., Iovino A., Maccacaro T., Maccagni D., eds, Observational Cosmology Vol. 51 of Astronomical Society of the Pacific Conference Series, Spectral Evolution of Merging/Accreting Galaxies. p. 298
- Smith & Taylor (2008) Smith G. P., Taylor J. E., 2008, ApJL, 682, L73
- Solanes et al. (1999) Solanes J. M., Salvador-Solé E., González-Casado G., 1999, A&A, 343, 733
- Springel et al. (2005) Springel V., et al., 2005, Nature, 435, 629
- Springel & Farrar (2007) Springel V., Farrar G. R., 2007, MNRAS, 380, 911
- Thompson et al. (2014) Thompson R., Davé R., Nagamine K., 2014, ArXiv e-prints
- Thompson & Nagamine (2012) Thompson R., Nagamine K., 2012, MNRAS, 419, 3560
- Wang et al. (2010) Wang Y., Xu H., Gu L., Gu J., Qin Z., Wang J., Zhang Z., Wu X.-P., 2010, MNRAS, 403, 1909
- Watson et al. (2014) Watson W. A., Iliev I., Diego J., Gottlober S., Knebe A., Martinez-Gonzalez E., Yepes G., 2014, MNRAS, 437, 3776
- Wen & Han (2013) Wen Z. L., Han J. L., 2013, MNRAS, 436, 275
- Yu et al. (2015) Yu H., Serra A., Diaferio A., Baldi M., 2015, ArXiv e-prints