2 Space Research Institute, Russian Academy of Sciences, 84/32 Profsoyuznaya Str, Moscow 117997, Russia
3 Institute of Astronomy, Russian Academy of Sciences, Pyatnitskaya 48, Moscow 119017, Russia
Alexander S. Gusev,
Studies of the Stellar Populations of Galaxies Using Two-Color Diagrams
Abstract
Variations in the photometric parameters of stellar systems as a function
of their evolution and the stellar populations comprising them are investigated. A set
of seven evolutionary models with an exponential decrease in the star-formation rate
and 672 models with a secondary burst of star formation are considered. The
occurrence of a secondary burst of star formation can shift the position of a stellar
system on two-color diagrams to the right or left of the normal color sequence for
galaxies and the extinction line. This makes it possible to estimate the composition
of the stellar population of a galaxy with a nonmonotonic star-formation history from
its position on two-color diagrams. Surface photometry in both the optical ()
and near-IR () is used to study the stellar populations and star-formation
histories in the structural components (nucleus, bulge, disk, spiral arms, bar, ring) of
26 galaxies of various morphological types (from S0 to Sd). Components (nucleus,
bulge, bar) with color characteristics corresponding to stellar systems with secondary
bursts of star formation are indicated in 10 of the 26 galaxies. The parameters of these
secondary bursts are estimated. Five of the 10 galaxies with complex star-formation
histories display clear structural perturbations. Appreciable differences in the
photometric characteristics of relatively red early-type galaxies (S0–Sb) and relatively
blue later-type galaxies (Sb–Sd) have been found. Galaxies of both early and late
types are encountered among the Sb–galaxies. Lenticular galaxies do not display
different photometric characteristics from early-type spiral galaxies.
DOI: 10.1134/S1063772915100029
Keywords: galaxies: spiral – galaxies: lenticular – galaxies: photometry – galaxies: structure – galaxies: stellar population
1 INTRODUCTION
Determining the composition of the stellar populations of galaxies and of their individual large-scale elements, such as bulges, disks, nuclei, bars, and spiral arms, is key for studies of galactic evolution. Modern receiver instrumentation and methods for reducing and storing data make it possible, in principle, to derive the detailed distributions of parameters of such stellar populations (their age, metallicity, velocity dispersion) in galaxies that cannot be resolved into individual stars. However, this requires joint sets of observations, such as surface photometry and spectrophotometry over as wide a bandwidth as possible, and one-dimensional and two-dimensional spectroscopy with high resolution. Such studies have been successfully carried out for nearby, bright galaxies (see, e.g., Gavazzi et al., 2002; Chilingarian et al., 2009), but have not been applied to large numbers of objects.
Optical surface photometry is the simplest way to obtain information about the structure and stellar populations of galaxies. Photometric observations require standard receivers and are possible on small (1-2 m) telescopes. Existing databases contain freely available images of many hundreds of galaxies in the bands, which can also be used to analyze photometric results. The extensive database of near-IR () galaxy images obtained as part of the 2MASS project (Jarrett et al., 2000) can be used to supplement optical data.
Direct use of color indices – the main indicators of the composition and age of a stellar population – is hindered by uncertainties associated with the chemical composition and amount of interstellar absorption in a given galaxy. Unfortunately, the shift of a stellar system in two-color diagrams due to the effects of metallicity and reddening are along the normal color sequence (NCS) of galaxies (Buta & Williams, 1995; Schröeder & Visvanathan, 1996; Zasov & Sil’chenko, 1983) – a sequence of stellar systems with standard star-formation histories; i.e., with star-formation rates (SFRs) that fall off exponentially with time (Sandage, 1986). In general, determining the metallicity and absorption in a galaxy requires spectroscopic observations, which, in turn, require more expensive and difficult to use equipment and time on larger telescopes.
| Galaxy | Type | PA | , kpc | , Mpc | |||||||
|---|---|---|---|---|---|---|---|---|---|---|---|
| NGC 245 | SA(rs)b | 3.1 | 12.72m | –21.12m | 19.3 | 53.8 | 0.097m | 0.04m | |||
| NGC 266 | SB(rs)ab | 1.6 | 12.27 | –21.94 | 15 | 95 | 3.09 | 57.4 | 63.8 | 0.252 | 0.01 |
| NGC 524 | SA0+(rs) | –1.2 | 11.01 | –21.72 | 5 | 55 | 3.63 | 34.1 | 32.3 | 0.299 | 0.00 |
| NGC 532 | Sab? | 1.9 | 13.10 | –19.59 | 71 | 31 | 2.29 | 21.1 | 31.7 | 0.337 | 0.42 |
| NGC 628 | SA(s)c | 5.2 | 9.70 | –20.72 | 7 | 25 | 10.46 | 21.9 | 7.2 | 0.254 | 0.04 |
| NGC 783 | Sc | 5.3 | 13.18 | –22.01 | 43 | 57 | 1.42 | 29.1 | 70.5 | 0.222 | 0.45 |
| NGC 1138 | SB0 | –1.9 | 13.31 | –19.49 | 35 | 95 | 2.04 | 19.6 | 33.0 | 0.542 | 0.00 |
| NGC 1589 | Sab | 2.4 | 11.80 | –21.86 | 80 | 159 | 3.16 | 45.5 | 49.5 | 0.307 | 0.61 |
| NGC 2336 | SAB(r)bc | 4.0 | 11.19 | –22.14 | 55 | 175 | 5.02 | 47.0 | 32.2 | 0.120 | 0.41 |
| NGC 3184 | SAB(rs)cd | 5.9 | 10.31 | –19.98 | 14 | 117 | 7.59 | 22.5 | 10.2 | 0.060 | 0.02 |
| NGC 3726 | SAB(r)c | 5.1 | 10.31 | –20.72 | 49 | 16 | 5.25 | 21.9 | 14.3 | 0.060 | 0.30 |
| NGC 4136 | SAB(r)c | 5.2 | 11.92 | –18.38 | 22 | 30 | 2.40 | 5.6 | 8.0 | 0.066 | 0.05 |
| NGC 5351 | SA(r)b? | 3.1 | 12.57 | –21.16 | 60 | 101 | 2.40 | 35.6 | 51.1 | 0.074 | 0.40 |
| NGC 5585 | SAB(s)d | 6.9 | 10.94 | –18.73 | 53 | 34 | 4.27 | 7.1 | 5.7 | 0.057 | 0.38 |
| NGC 5605 | (R)SAB(rs)c | 4.9 | 12.58 | –20.86 | 36 | 65 | 1.62 | 21.1 | 44.8 | 0.318 | 0.15 |
| NGC 5665 | SAB(rs)c | 5.0 | 12.25 | –20.42 | 53 | 151 | 1.91 | 17.3 | 31.1 | 0.091 | 0.35 |
| NGC 6217 | (R)SB(rs)bc | 4.0 | 11.89 | –20.45 | 33 | 162 | 2.30 | 13.8 | 20.6 | 0.158 | 0.22 |
| NGC 6340 | SA0/a(s) | 0.4 | 11.73 | –20.03 | 20 | 155 | 3.16 | 18.6 | 20.2 | 0.173 | 0.02 |
| NGC 6946 | SAB(rs)cd | 5.9 | 9.75 | –20.68 | 31 | 62 | 15.48 | 26.6 | 5.9 | 1.241 | 0.04 |
| NGC 7280 | SAB0+(r) | –1.3 | 12.82 | –19.44 | 59 | 76 | 2.09 | 15.8 | 25.9 | 0.201 | 0.00 |
| NGC 7331 | SA(s)b | 3.9 | 10.20 | –21.68 | 75 | 169 | 9.78 | 40.1 | 14.1 | 0.331 | 0.61 |
| NGC 7351 | SAB0? | –2.1 | 13.39 | –17.22 | 76 | 2 | 1.66 | 5.7 | 11.7 | 0.161 | 0.00 |
| NGC 7678 | SAB(rs)c | 4.9 | 12.50 | –21.55 | 44 | 21 | 2.08 | 28.9 | 47.8 | 0.178 | 0.23 |
| NGC 7721 | SA(s)c | 4.9 | 11.11 | –21.18 | 81 | 16 | 3.02 | 23.1 | 26.3 | 0.121 | 0.98 |
| IC 1525 | SBb | 3.1 | 12.51 | –21.89 | 48 | 27 | 1.95 | 39.5 | 69.6 | 0.410 | 0.24 |
| UGC 11973 | SAB(s)bc | 3.9 | 13.34 | –22.47 | 81 | 39 | 3.46 | 59.2 | 58.8 | 0.748 | 0.85 |
The goal of our current study is to elucidate what properties of the stellar populations of galaxies can be determined using optical () and infrared () photometry in the absence of independent information about absorption and chemical composition. As observational material, we used previously obtained surface photometry data for galaxies of various morphological types, both published and unpublished (Section 2). Section 3 considers the variations of the positions of stellar systems on two-color diagrams as a function of their particular star formation histories, using modern evolutionary models. Section 4 compares the photometric data and models in order to estimate the stellar populations in various components of the galaxies. We discuss the results in Section 5, and formulate our conclusions in Section 6.
2 GALAXY SAMPLE
We chose 26 galaxies with various morphological types for which and photometry was available for this study. Table 1 presents the main information about the galaxies – morphological type (in letter and numerical form); apparent magnitude corrected for Galactic absorption and absorption due to the inclination of the galaxy; absolute magnitude ; inclination ; position angle PA and diameter at the isophote in the band , taking into account Galactic absorption and absorption due to the inclination of the galaxy; distance ; Galactic absorption ; and absorption due to the inclination of the galaxy . The data on the morphological types (in letter form) and the absorption arising in our Galaxy, , were taken from the NASA Extragalactic Database (NED), and the remaining parameters from the HyperLeda database. There was no information about the position angles of some galaxies in the HyperLeda database; in these cases, the PAs were taken from NED.
The observations, reduction, and results of the surface-photometry data for 18 of the galaxies are described in Artamonov et al. (1997, 1999, 2000); Gusev et al. (2002); Gusev & Kaisin (2002); Gusev et al. (2003); Gusev & Park (2003); Gusev & Kaisin (2004); Gusev (2006a, b); Bruevich et al. (2007, 2010, 2011) (Table 2). Here, we use these earlier results, taking into account the new data of Schlafly & Finkbeiner (2011) on the distribution of absorption in our Galaxy.
The data for eight galaxies (NGC 245, NGC 266, NGC 6340, NGC 6946, NGC 7331, NGC 7351, NGC 7721, and UGC 11973) have not been published earlier. We describe the observations and reduction for these galaxies, as well as for NGC 6217 and NGC 7678, which we have observed multiple times, below in this section.
The observations of the galaxies were carried out in 2002–2006 on the 1.5 m telescope of the Maidanak Observatory of the Institute of Astronomy of the Academy of Sciences of the Republic of Uzbekistan (focus length 12 m), using a SITe-2000 CCD array. With the broadband , , , , and filters used, the CCD array realizes a photometric system close to the standard Johnson–Cousins system. A detailed description of the characteristics of the telescope and the instrumental photometric system can be found in Artamonov et al. (2010). The CCD array was cooled by liquid nitrogen, and was pixels in size, providing a field of view of and an image scale of /pixel. Table 3 presents a journal of these observations.
| Galaxy | Filter | Year | Telescope | Observatory | Reference |
|---|---|---|---|---|---|
| NGC 245 | 2005 | 1.5 m | Maidanak | ||
| NGC 266 | 2005 | 1.5 m | Maidanak | ||
| NGC 524 | 2003 | 1.5 m | Maidanak | Gusev (2006a, b) | |
| NGC 532 | 2003 | 1.5 m | Maidanak | Gusev (2006a, b) | |
| NGC 628 | 2002 | 1.5 m | Maidanak | Bruevich et al. (2007) | |
| NGC 783 | 2003 | 1.5 m | Maidanak | Gusev (2006a, b) | |
| NGC 1138 | 2003 | 1.5 m | Maidanak | Gusev (2006a, b) | |
| NGC 1589 | 2003 | 1.5 m | Maidanak | Gusev (2006a, b) | |
| NGC 2336 | 2001 | 1.8 m | Bohyunsan | Gusev & Park (2003) | |
| NGC 3184 | 1998, 1999 | 1 m, 1 m (JKT) | SAO, La Palma | Gusev & Kaisin (2002) | |
| NGC 3726 | 1998 | 1 m | SAO | Gusev et al. (2002) | |
| NGC 4136 | 1998 | 1 m | SAO | Gusev et al. (2003) | |
| NGC 5351 | 1998 | 1 m | SAO | Gusev & Kaisin (2004) | |
| NGC 5585 | 2005 | 1.5 m | Maidanak | Bruevich et al. (2010) | |
| NGC 5605 | 1997 | 1.5 m | Maidanak | Artamonov et al. (2000) | |
| NGC 5665 | 1997 | 1.5 m | Maidanak | Artamonov et al. (2000) | |
| NGC 6217 | 1988, 1989, | 1 m, | Maidanak | Artamonov et al. (1999) | |
| 1997, 2006 | 1.5 m | ||||
| NGC 6340 | 2006 | 1.5 m | Maidanak | ||
| NGC 6946 | 2002 | 1.5 m | Maidanak | ||
| NGC 7280 | 2003 | 1.5 m | Maidanak | Gusev (2006a, b) | |
| NGC 7331 | 2005 | 1.5 m | Maidanak | ||
| NGC 7351 | 2005 | 1.5 m | Maidanak | ||
| NGC 7678 | 1989, 2005 | 1 m, 1.5m | Maidanak | Artamonov et al. (1997) | |
| NGC 7721 | 2005 | 1.5 m | Maidanak | ||
| IC 1525 | 2005 | 1.5 m | Maidanak | Bruevich et al. (2011) | |
| UGC 11973 | 2005 | 1.5 m | Maidanak |
The subsequent reduction and calibration of the data were carried out using standard procedures in the ESO–MIDAS image-reduction system, described in detail, for example, in Bruevich et al. (2007, 2010).
To investigate the IR properties of the galaxies, we used data from the 2MASS catalog, which contains , , and images of the galaxies. These images were reduced using a similar procedure. The seeing for these images is , with an image scale of /pixel /pixel. In contrast to the data of Gusev (2006a, b), where we used the 2MASS photometric system, here, we converted the data to the system of Bessell & Brett (1988), in accordance with citetcar01,kin02: , , , and .
We constructed color equations and corrected for atmospheric extinction using , , , , and observations of the Landolt standard stars PG 0231+051, PG 2213–006, PG 2331+055, SA 92, SA 110, SA 111, SA 113, and SA 114 (Landolt, 1992) obtained on the same night over a broad range of air masses. When possible, we compared the data obtained with the results of aperture photometry data for the galaxies contained in the electronic version of the HyperLeda catalog. According to our estimates, the photometric calibration errors do not exceed in , , , and , and in .
All the data were corrected for Galactic absorption and absorption arising due to the inclination of the galaxy. We took the Hubble constant to be H kms-1Mpc-1. The linear scales of the images are presented in Table 3.
3 MODELS
3.1 Models with an Exponential Decrease in the Star-Formation Rate
The composition of the stellar population of a galaxy at any given time can be described using two parameters: the initial mass function (IMF) and the star-formation history, i.e., the variation in the SFR with time.
| Galaxy | Date | Filter | Exposure, | Air mass | Seeing | Scale, |
| s | pc/pixel | |||||
| NGC 245 | 1/2.11.2005 | 2300 | 1.31 | 69.6 | ||
| 2240 | 1.31 | 1.0 | ||||
| 2180 | 1.31 | 1.1 | ||||
| 290 | 1.31 | 0.8 | ||||
| 290 | 1.32 | 0.8 | ||||
| NGC 266 | 3/4.11.2005 | 2300 | 1.01 | 1.0 | 82.5 | |
| 2240 | 1.01 | 0.9 | ||||
| 2180 | 1.01 | 0.8 | ||||
| 2120 | 1.01 | 0.7 | ||||
| 290 | 1.01 | 0.7 | ||||
| NGC 6217 | 21/22.06.2006 | 2300 | 1.39 | 1.7 | 26.6 | |
| 2180 | 1.40 | 1.4 | ||||
| 2120 | 1.40 | 1.4 | ||||
| 390 | 1.41 | 1.2 | ||||
| 160 | 1.42 | 1.1 | ||||
| NGC 6340 | 19/20.06.2006 | 2300 | 1.29 | 1.2 | 26.1 | |
| 2240 | 1.30 | 0.9 | ||||
| 2120 | 1.31 | 0.8 | ||||
| 260 | 1.28 | 0.8 | ||||
| 260 | 1.28 | 0.7 | ||||
| NGC 6946 | 12/13.09.2002 | 4300 | 1.28 | 1.6 | 7.6 | |
| (northern | 3300 | 1.33 | 1.3 | |||
| part) | 2240 | 1.38 | 1.3 | |||
| 2180 | 1.23 | 1.0 | ||||
| 2150 | 1.24 | 0.9 | ||||
| 21/22.10.2002 | 4300 | 1.18 | 1.1 | |||
| 1300 | 1.20 | 1.0 | ||||
| 2240 | 1.22 | 0.9 | ||||
| 2180 | 1.15 | 0.8 | ||||
| 2150 | 1.16 | 0.8 | ||||
| NGC 6946 | 12/13.09.2002 | 4300 | 1.14 | 1.4 | 7.6 | |
| (southern | 2300 | 1.17 | 1.1 | |||
| part) | 2240 | 1.19 | 1.1 | |||
| 2180 | 1.12 | 0.7 | ||||
| 2150 | 1.13 | 0.8 | ||||
| 21/22.10.2002 | 4300 | 1.10 | 1.1 | |||
| 2300 | 1.12 | 1.3 | ||||
| 2240 | 1.14 | 0.9 | ||||
| 2180 | 1.09 | 1.2 | ||||
| 2150 | 1.09 | 0.9 | ||||
| NGC 7331 | 8/9.09.2005 | 8300 | 1.03 | 1.4 | 18.2 | |
| (central | 2240 | 1.02 | 1.3 | |||
| part) | 2150 | 1.03 | 1.3 | |||
| 290 | 1.00 | 1.0 | ||||
| 250 | 1.01 | 1.0 | ||||
| 10/11.09.2005 | 4300 | 1.01 | 1.0 | |||
| 2300 + 1150 | 1.00 | 1.0 | ||||
| 4150 | 1.00 | 1.0 | ||||
| 290 | 1.01 | 0.9 | ||||
| 260 | 1.01 | 0.8 | ||||
| NGC 7351 | 2/3.11.2005 | 2300 | 1.37 | 1.5 | 15.1 | |
| 2180 | 1.37 | 1.3 | ||||
| 2180 | 1.38 | 1.3 | ||||
| 290 | 1.39 | 1.0 | ||||
| 290 | 1.39 | 1.0 |
| Galaxy | Date | Filter | Exposure, | Air mass | Seeing | Scale, |
| s | pc/pixel | |||||
| NGC 7678 | 13/14.09.2005 | 5300 | 1.08 | 1.1 | 61.8 | |
| 2300 | 1.20 | 1.1 | ||||
| 1240 | 1.05 | 0.9 | ||||
| 2120 | 1.05 | 0.8 | ||||
| 290 | 1.22 | 1.1 | ||||
| NGC 7721 | 3/4.11.2005 | 2300 | 1.42 | 1.2 | 34.0 | |
| 2240 | 1.42 | 1.3 | ||||
| 2180 | 1.42 | 1.0 | ||||
| 2120 | 1.42 | 0.9 | ||||
| 290 | 1.42 | 0.9 | ||||
| UGC 11973 | 31.10/1.11.2005 | 2300 | 1.00 | 1.7 | 76.0 | |
| 2240 | 1.01 | 1.3 | ||||
| 2180 | 1.01 | 1.2 | ||||
| 290 | 1.01 | 1.0 | ||||
| 290 | 1.01 | 1.0 |
The parameters of the IMF only weakly influence the photometric characteritics of the stellar population: the most massive stars make a substantial contribution to the radiation, but their lifetimes ( Myr) are short compared to the characteristic time scale for galactic evolution ( Gyr), and their contribution to the total mass is too small to appreciably increase themetallicity of the interstellar medium. Low-mass stars make an extremely small contribution to the radiation of the stellar system in the optical. Small variations in the IMF likewise do not give rise to substantial variations in the color characteristics (Bruevich et al., 2011). In our current study, we used a classical Salpeter (1955) IMF with lower and upper mass limits of and .
Estimates of the variation of the SFR with time are very uncertain. Thirty years ago, Sandage (1986) proposed a model in which the SFR decreased exponentially with time, with the characteristic time scale increasing along the Hubble sequence of galaxies, from ellipticals to late-type spirals. The physical meaning behind this dependence was constancy of the star-forming efficiency (SFE=SFR/, where is the mass of gas in the galaxy) with time in each isolated galaxy.
Later, Gavazzi et al. (2002) modified the model of Sandage, and suggested instead the dependence
| (1) |
where is the time since the birth of the galaxy in Gyr, is the characteristic time for the decrease in the SFR in Gyr, and the SFR is expressed in yr (Fig. 1).
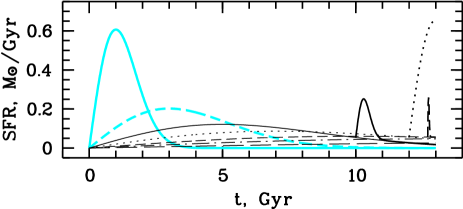
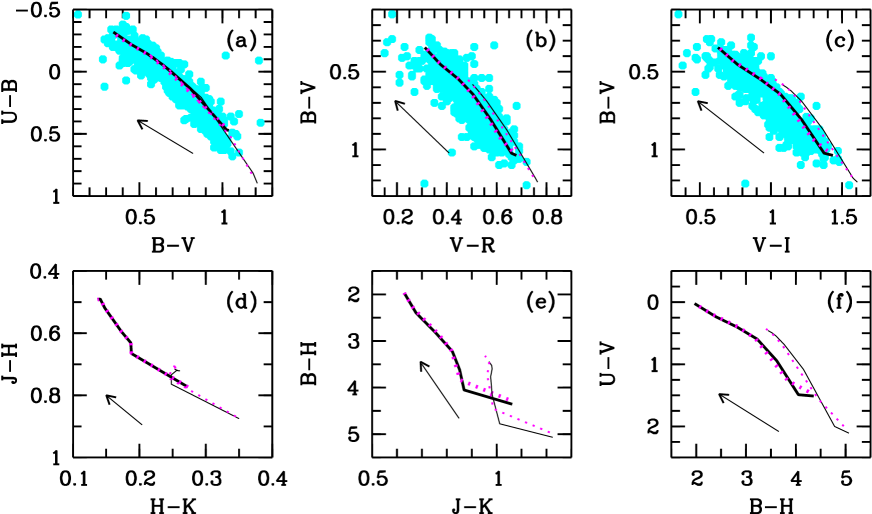
We used the PEGASE.2 program (Fioc & Rocca-Volmerange, 1997) to construct evolutionary models for stellar systems. Most importantly, we calculated the color indices for stellar systems according to Eq. (1), with characteristic time scales for the decrease in the SFR = 1, 3, 5, 7, 10, 13, and 20 Gyr (Figs. 1, 2). To reduce the number of free parameters, we took the age of the galaxies to be Gyr and the initial metallicity to be . Figs. 2a-2c show that, overall, the model stellar systems with the chosen , , and values correspond to the NCS for galaxies derived from the observations of Buta & Williams (1995); Schröeder & Visvanathan (1996). The metallicities of the interstellar medium for an age of 13 Gyr calculated for such systems also agrees well with observations: the gas metallicities of systems with Gyr are , decreasing to only for systems with Gyr.
3.2 Models with Secondary Bursts of Star Formation
Obviously, we cannot estimate the composition of the stellar populations of stellar systems with a standard star-formation history lying along the NCS without some additional data on absorption (Fig. 2). We are interested in systems whose positions in the two-color diagrams deviate from the NCS (or from the absorption line). We therefore considered stellar systems with secondary bursts of star formation. Such secondary bursts are possible in the evolution of galaxies as a whole (e.g., as a result of mergers or the absorption of smaller galaxies), as well as their individual components. Components such as disks and active nuclei, where the condition may not be valid, are of special interest.
We used the PEGASE.2 program to construct models for stellar systems with secondary bursts of star formation occurring Gyr ago, using the formula
for Gyr and
| (2) |
for Gyr, where is the characteristic time scale for the decay of the secondary burst of star formation in billions of years and is the mass of gas participating in the secondary burst of star formation divided by the total mass of the system at time . Fig. 2 presents plots of SFR() for such systems as examples.
We constructed stellar systems with secondary bursts of star formation having the following
parameters:
Myr,
Myr,
.
The metallicity of the system at the onset of the
secondary burst of star formation corresponds to the metallicity of the interstellar medium of the
evolved system at a time Gyr. We considered the maximum ratio
based on the fact that the fraction of newly formed stars in localized regions
of a galaxy, such as star-forming complexes, can appreciably exceed the fraction of relative old
stars in the disk.
The color indices of a stellar system depend on its geometrical shape: the absorption due to dust will be different for spheroidal and disk galaxies. For stellar systems with Gyr and for all secondary bursts of star formation, we used models with disks viewed face-on. For systems with Gyr – the star-formation decay time characteristic of elliptical galaxies – we used spherical models.
Thus, we calculated the photometric parameters of seven stellar systems with standard star formation and 672 () systems with secondary bursts of star formation.
Let us first consider the positions of stellar systems with a standard star-formation history on the two-color diagrams. Fig. 2 presents the NCSs of such systems on , , , , , and two-color diagrams. These show that possible variations in the ages of the galaxies do not influence their positions in these diagrams: the NCSs for stellar systems with ages of 10 and 13 billion years are superposed on one another. The initial metallicity of the interstellar medium has a much greater influence: stellar systems with the solar initial metallicity are located toward the lower right in the diagrams (i.e., they have redder colors) than systems with zero initial metallicity. Unfortunately, in most of the diagrams, variations in the metallicity shift the stellar systems along the absorption line. Small shifts from the absorption line due to variations in the chemical composition are observed only on the and diagrams (Figs. 2a, 2e). The color index is known as a main indicator of the metallicity of a galaxy (Bothun & Gregg, 1990).
The color indices of stellar systems with zero initial metallicity are in fairly good agreement with the observed colors of galaxies (Figs. 2a-2c). The sequence of stellar systems with non-zero initial metallicity deviates from the observed NCS of galaxies. This is especially clearly visible on the diagram (Fig. 2c).
The reddest galaxies (with ) do not agree with the models for stellar systems with a standard star formation and zero initial metallicity (Fig. 2a). We show below that the observations of such galaxies are consistent with models with zero initial metallicity and a secondary burst of star formation.
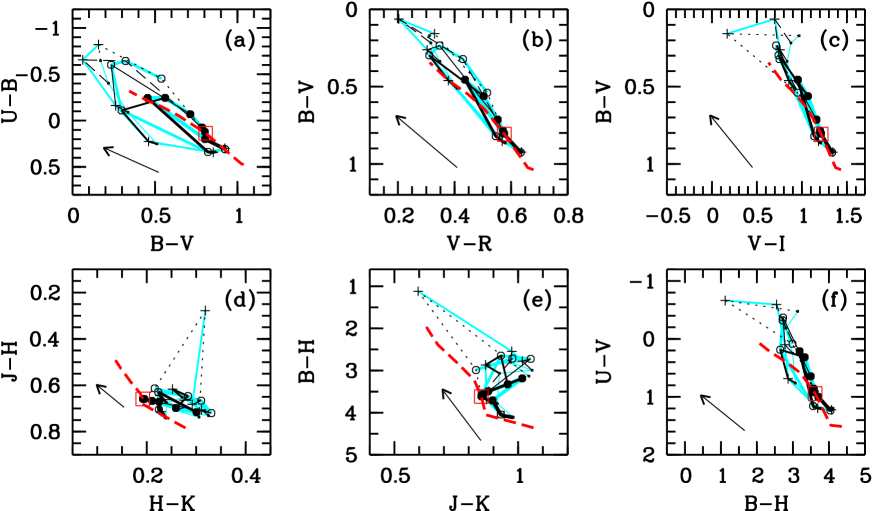
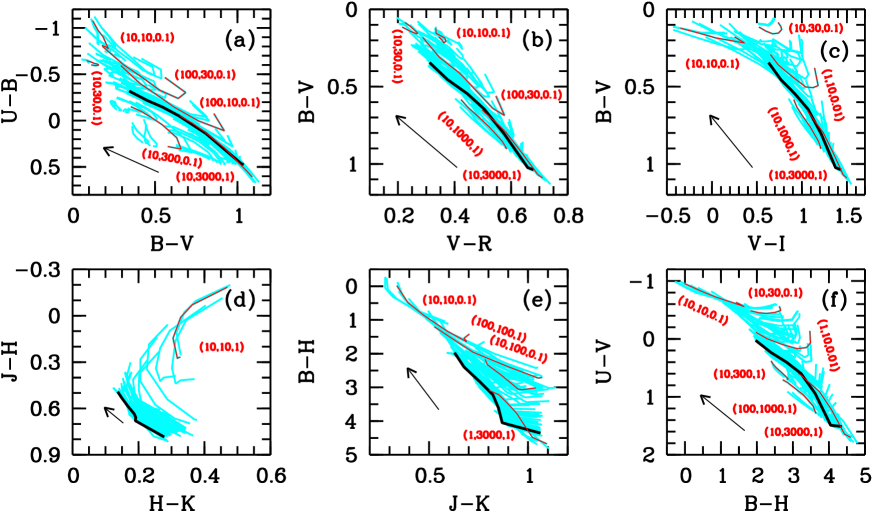
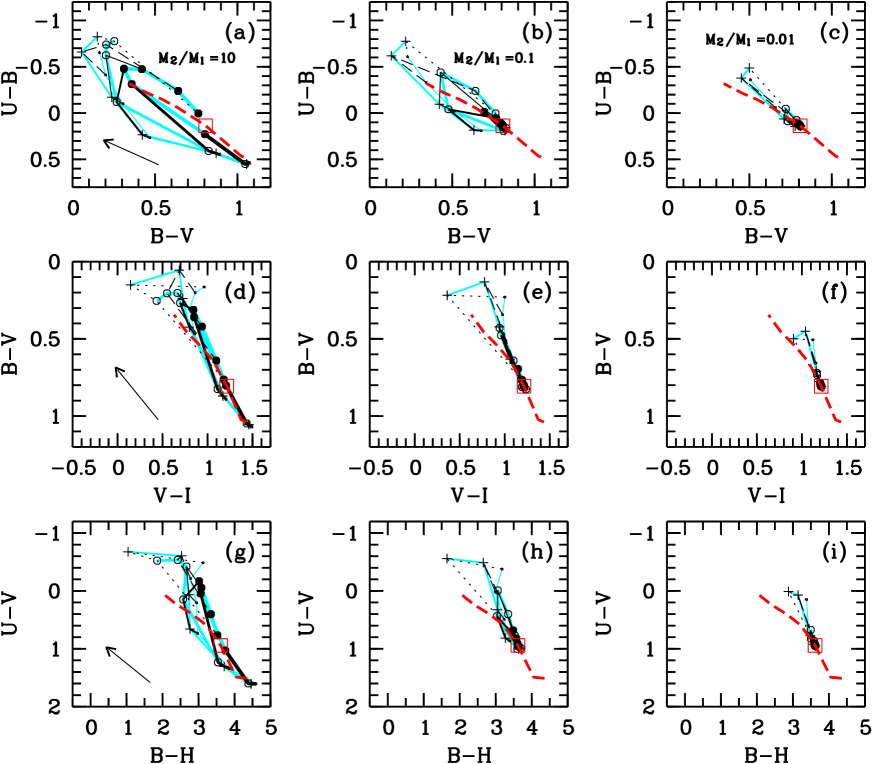
Fig. 3 presents the variations of the NCS in the two-color diagrams for galaxies with a secondary burst of star formation. The set of model sequences (96 curves) occupies an extended region in the diagrams, spreading to the right, left, and above the NCS, and substantially deviating from the absorption line. The largest deviations to the right and left of the NCS are observed in the diagram (Fig. 3a).
A recent burst of star formation ( Myr) shifts a stellar system toward the upper left corner of the two-color diagrams (an exception is the diagram; Fig. 3d), even if this burst has a relatively modest power (; Figs. 3a-3c, 3e, 3f). Weaker bursts () shift a stellar system upward from the NCS in the and diagrams (Figs. 3c, 3f). Thus, even a modest burst of star formation can appreciably decrease the and values, without influencing the longer-wavelength color indices.
Powerful bursts of star formation that occurred longer in the past ( Gyr, ) can shift a stellar system downward and to the right along the NCS (Figs. 3a-3c, 3e, 3f). This is a consequence of the fact that the color indices of an old stellar population depend only weakly on its age, but grow substantially with increasing metallicity (Fig. 2). A comparison of the positions of the observed galaxies and model stellar systems with secondary bursts of star formation on the diagram indicates that galaxies with the reddest colors are described well by models with secondary bursts of star formation occurring three or more Gyr ago (Figs. 2a, 3a).
Stellar systems with secondary bursts of star formation occurring Gyr ago are of special interest. Such systems are shifted to the left of the NCS in the , , , and diagrams (Figs. 3a-3c, 3f). For stellar systems with Gyr (galaxies with type Sa and later), this shift is perpendicular to the absorption line, and can in principle be detected.
Let us consider how the position of a stellar system varies in the two-color diagrams as a function of the parameters and . Fig. 4 presents the variations in the position of a stellar system with Gyr (a type Sa–Sb galaxy) in the case of a secondary burst of star formation with .
Systems with recent bursts of star formation ( Myr, Myr) with blue colors can be distinguished in all the two-color diagrams (with the exception of ; Fig. 4d). Models with such parameters describe star-forming regions in galaxies.
Models with bursts of star formation that ended in the more distant past ( Gyr, Gyr) have redder colors than the original stellar systems (Fig. 4).
In the optical, for systems with the same characteristic decay times , systems with smaller values have bluer colors. The dependence of the color on is more complex: when , systems with larger values have bluer colors, while systems with smaller values have bluer colors when . Thus, the bluest colors are observed for systems with – at the maximum SFR for the secondary burst (Fig. 4a-4c, 4f).
The parameters and , their ratios, and their absolute values influence the various color indices differently. This is most clearly visible in the diagram: systems with are shifted to the left of the original positions without a secondary burst of star formation, the NCS, and the absorption line; systems with are shifted to the right of the NCS and the absorption line (Fig. 4a). Similar behavior for the systems with secondary bursts of star formation is observed on the , , and diagrams, although the deviations of these systems from the NCS and absorption line are smaller here than in the diagram, and the systems themselves are shifted primarily to the right of the NCS (Figs. 4b, 4c, 4f).
In the and diagrams, secondary bursts with any parameters apart from Myr and Myr shift systems to the right of the NCS and the original position of the galaxy. Systems with prolonged secondary bursts ( Gyr) are located systematically below systems with Myr (i.e., they have higher and color indices; Figs. 4d, 4e).
The positions of stellar systems with secondary bursts of star formation on the , , and two-color diagrams as a function of the power of the burst () are shown in Fig. 5. Increasing the power only weakly influences the position of a stellar system in the diagrams. This is due to the fact that, with , the main contribution to the optical radiation is made by relatively young stars formed in the second burst. For systems with , the difference between the colors of the original galaxy and of a system with a secondary burst of star formation decrease systematically as the ratio is increased. The deviations from the position of the original galaxy and the NCS in the two-color diagrams are appreciable for systems with burst powers , and can be detected if the burst was relatively recent ( Myr) and not prolonged ( Myr). Decreasing the burst power by another order of magnitude, to values , means that only systems with recent secondary bursts with durations of the order of 10 Myr can be distinguished in the diagrams ( Myr, Myr; Figs. 5c, 5f, 5i).
Since the IR diagram serves as a good indicator of metallicity but reacts only weakly to the age of the stellar population, we used this diagram to estimate the variations of the NCS of galaxies with an age of 13 Gyr and various initial metallicities that have undergone secondary bursts of star formation (Fig. 6). Unfortunately, the cloud of model sequences for galaxies with zero initial metallicity cover the cloud of sequences for galaxies with the solar initial metallicity virtually completely. This reflects the fact that the ratio for systems with different initial metallicities decreases as the systems evolve (in our case, from several orders of magnitude at time to a factor of a few at time Gyr).
4 ANALYSIS OF THE OBSERVATIONAL DATA
4.1 Positions of Galaxy Components on Two-Color Diagrams
Earlier, we determined the structural components for nine galaxies (nucleus, bulge, disk, spiral arms, bar, ring), obtained the color indices in the bands, and analyzed the positions of the components on two-color diagrams (Artamonov et al., 1999, 2000; Gusev et al., 2002; Gusev & Kaisin, 2002; Gusev et al., 2003; Gusev & Park, 2003; Gusev & Kaisin, 2004; Bruevich et al., 2010). In our current study, we measured the optical color indices for the components of the remaining 17 galaxies, and also determined the color indices of the structural components in the IR for nine of these galaxies (Table 2).
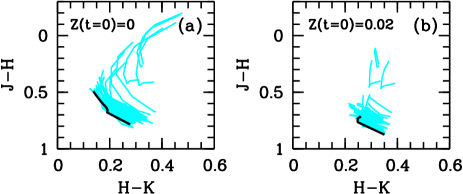
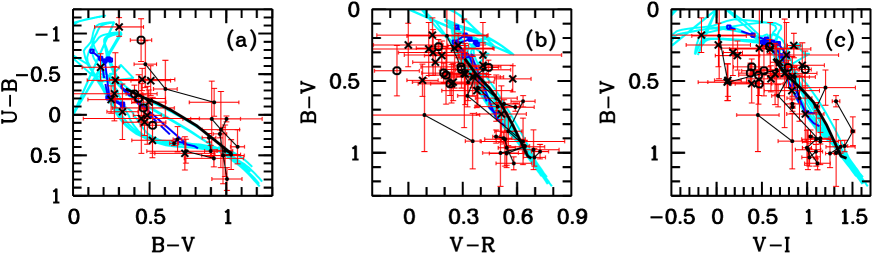
Fig. 7 shows the positions of the galactic components (nuclei, bulges, disks, spiral arms, bars, rings) on the two-color diagrams. We chose areas outside regions of star formation to determine the color indices of spiral arms, rings, and bars. Overall, the color indices of these galactic components agree with the model NCS within the uncertainties. However, the clouds of point indicating the positions of components in the optical diagrams are shifted to the left of the model NCS (Fig. 7a-7c, 7f), and to the right in the diagram (Fig. 7e). This shift cannot be explained by a failure to correctly take into account absorpton in the galaxies, since this would shift the positions of the components along the NCS, or by an effect of the age of the galaxies (Fig. 2). Our data agree well with the integrated color indices of galaxies: the cloud of points indicating the positions of galaxies on the optical two-color diagrams is also systematically shifted to the left from the model NCS. The diagram illustrates this especially well (compare Figs. 2c and 7c). Thus, the observed colors of the galaxies and their components are, on average, slightly redder than the model colors. We will discuss possible origins of this deviation in detail in the next section. Note that the uncertainties in the characteristic SFR decay time due to the deviations of the positions of the galaxy components from the NCS do not exceed the uncertainties associated with uncertainties in the color indices.
The values of derived from are systematically lower than the values derived from by a factor of 1.5, while the values derived from and are systematically higher by a factor of . Thus, the absolute magnitude of the characteristic decay time for the SFR can be determined from the positions of components on the two-color diagrams to within about a factor of three. The relative values of for the components of individual galaxies can be determined more precisely, and depend only on the uncertainty in the color indices and the difference of the internal absorption in a structural component from the mean absorption for the galaxy as a whole.
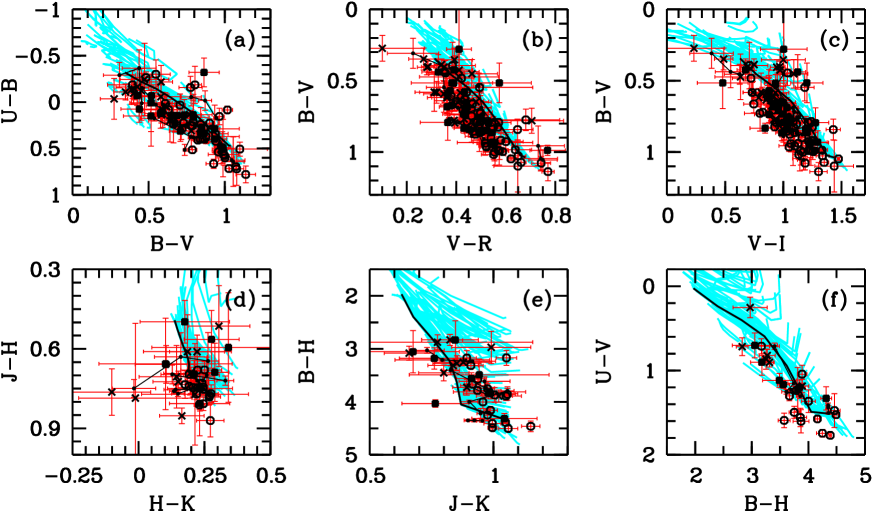
The locations of the vast majority of the galactic components, including spiral arms and rings, along the NCS in the two-color diagrams makes it possible to crudely estimate their photometric characteristic ages (as a function of , assuming that the absorption in the component does not differ strongly from the mean vaue calculated for the inclination of the galactic disk), but not the time and power of the secondary burst of star formation. An exception is extreme cases, for example, the nuclei with active star formation in the galaxies NGC 245 and NGC 3726, which are shifted to the right of the NCS toward the region of models with secondary bursts of star formation (Fig. 7a, 7c). As expected, galactic nuclei and bulges lie in the lower part of the NCS (i.e., they have redder colors), while, as a rule, disks, spiral arms, and rings are located in the central and upper parts of the NCS (Figs. 7a-7c, 8a, 8b). The structural components are essentially not observed in the upper part of the NCS in the IR diagrams (Figs. 7d-7f). This is due to a selection effect: the fraction of lenticular galaxies observed in the IR is much higher than the average for the sample (Tables 1 and 2).
Figs. 2a-2c and 7a-7c show that the cloud of points characterizing the color indices of the galaxies and their components fully cover the length of the NCS, and include appreciable shifts along the NCS. The color indices of the components do not depend on the inclination of the galactic disks (Fig. 8c). This indicates that the internal absorption of the galaxies as a function of the disk inclination is satisfactorily described by the true absorption in the galaxies, and can be used to make statistical estimates for large samples of galaxies and their components.
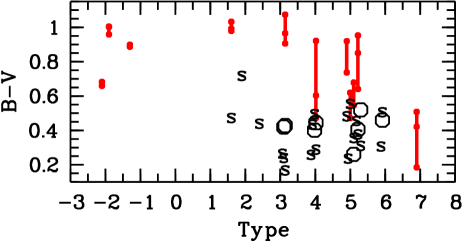
Figs. 8a and 8b show the color indices for various components along the Hubble sequence of galaxies. The numerical morphological types of the galaxies were taken from Table 1; for galaxies of the same morphological type, their order along the horizontal axis corresponds to their position in Table 1.
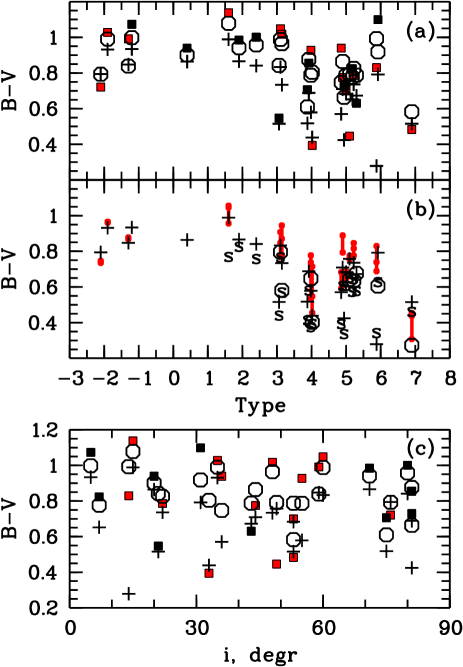
The galaxies clearly divide into two groups according to their photometric characteristics: the S0–Sb galaxies (Types ) and the Sb–Sd galaxies (Types ). All the components in galaxies in the first group, including disks, spirals, and rings, have red colors (). The lenticular galaxies and early-type spiral galaxies (to Sab inclusive) cannot be distinguished based on their photometric characteristics. The only exception is the photometric characteristics of bars: the colors of the bars of S0 galaxies do not change with distance from the center, while the bars in early-type spiral galaxies become bluer toward their ends (Fig. 8b). All the components in galaxies of the second group (Sb–Sd) are systematically bluer than the corresponding components of galaxies of the first group. This difference is less pronounced for the bulges and bars, but is clearly visible for the disks and spiral arms (Figs. 8a, 8b). Within the second group, on average, the galaxies and their components become bluer along the Hubble sequnce, although the correlation between the type of galaxies and the color of its components is weak. The Sb galaxies include galaxies in both the first group (NGC 5351) and the second group (NGC 245 and IC 1525; Figs. 8a, 8b).
The color indices of all the galactic components lie in the range from 0.25 to 1.15. Components with deviate to the right or left of the NCS in the two-color diagrams, toward the region of models with secondary bursts of star formation (Figs. 7a-7c). All types of structural components except for bulges are observed among such objects (Figs. 8a, 8b). The reddest components with could also have a complex star-formation history: they occupy regions corresponding to old, but chemically enriched, stellar systems in the two-color diagrams.
4.2 Nuclei, Bulges, and Disks
The reddest components are the bulges (Fig. 8a), whose color indices range from 0.8 to 1.05 (corresponding to Gyr) for S0–Sb galaxies and from 0.6 to 1.0 ( Gyr) for later type galaxies. The vast majority of the bulges lie along the NCS, and are described well bymodels with exponentially decaying SFRs with Gyr. Exceptions are the bulge in NGC 6217, which deviates to the right of the NCS in the diagram, the bulge in NGC 245, which deviates to the right of the NCS in the and diagrams, and the bulge in NGC 266, which lies below the NCS.
The nuclei of most of the studied galaxies are slightly redder than their bulges (by in ; Fig. 8a). However, roughly one-quarter of the galaxies have relatively blue nuclei, with the difference in for the nucleus and bulge sometimes exceeding 0.3. Due to this, the range of values for the nuclei is larger than for the bulges: for nuclei of galaxies in the first group, , while nuclei of Sb–Sd galaxies have (Fig. 8a). We note especially the four Sb–Sd galaxies NGC 245, NGC 6217, NGC 3726, and NGC 5585 with blue nuclei with (which corresponds to Gyr; Fig. 8a). Three of these galaxies have bars, and the fourth – NGC 245 – is a Makarian galaxy with an asymmetrical spiral structure. The only S0 galaxy with a relatively blue nucleus is NGC 7351, which also has a bar. The blue nuclei lie in the upper part of the NCS, although the nuclei of NGC 245 and NGC 3726 are shifted to the right of the NCS in the diagram (Fig. 7c). Deviations of nuclei to the right of the NCS are also observed for NGC 7678 in the and diagrams, for IC 1525 in the diagram, and for NGC 783 in the diagram (Figs. 7a, 7b, 7e).
The nucleus of NGC 266 (SBbc, inclination ) is the reddest component in the studied galaxies. It has the highest , , and values, and is located below the NCS in the two-color diagrams, in the region of models with a secondary burst of star formation in the distant past (more than three billion years ago). The nucleus of NGC 266 is shifted to the right of the NCS in the diagram (Fig. 7b).
The color indices of the disks are always lower than those of the spherical components (nuclei and bulges) of their galaxies, with this difference increasing along the Hubble sequence (Fig. 8a). An exception is galaxies with blue nuclei, in which, as a rule, the color characteristics of the nuclei and disks are very similar. The values for the disks of early-type galaxies are 0.8–1.0, while those for Sb–Sd galaxies are 0.3–0.8 (Fig. 8a). The bluest disks () are those in late-type galaxies with extremely blue nuclei (NGC 245, NGC 6217, NGC 3726, and NGC 5585) and the disk in the Sc galaxy NGC 3184, which has a bar and a moderately blue nucleus (Fig. 8a). The disks of NGC 245, NGC 3184, and NGC 6217 are shifted to the right of the NCS on the and/or diagrams (Figs. 7b, 7c).
The disk of the lenticular galaxy NGC 6340 occupies an anomalous position in the upper right part of the diagram, far from the NCS (Fig. 7a). This galaxy was studied in detail by Chilingarian et al. (2009), who showed that NGC 6340 has a fairly complex structure and evolution; in particular, it has undergone mergers and absorptions in the past.
4.3 Spiral Arms, Rings, and Bars
As a rule, spiral arms and rings are slightly bluer than the surrounding disk. The difference between the values for spiral arms and rings does not exceed 0.1 for all the galaxies except for NGC 2336 and NGC 5585 (Fig. 8b). NGC 5585 is a low-surface brightness Sd galaxy, and has an anomalously blue ring. The , , and values of the ring are the lowest among all the components of the galaxies studied (Figs. 7b, 7c). We studied this galaxy in Bruevich et al. (2010), where we showed that the center of the ring does not coincide with the center of the galaxy. This structure of NGC 5585 could be understood as the result of a recent external interaction (merger) (Bruevich et al., 2010). The NGC 5585 ring lies above and to the left of the NCS in the two-color diagrams, in the region of models with a secondary burst of star formation (Figs. 7a-7c).
The spiral arms (and rings, when present) of NGC 266, NGC 2336, NGC 5605, NGC 6946, and IC 1525 are appreciably bluer than their surrounding disks (Fig. 8b). These galaxies possess well developed, bright spiral arms that are clearly defined against the background of the disk, even in longwavelength bands.
The values of the spiral arms and rings of Sa–Sb galaxies lie within the narrow range from 0.75 to 0.85, while for the spiral arms and rings of galaxies in the second group are 0.25–0.7. The bluest spiral arms (rings), with , deviate to the right or left of the NCS on the and diagrams (Figs. 7b, 7c, 8b). Such spiral arms are observed in eight galaxies in our sample: five with blue disks (see above) and three Sbc–Scd galaxies with blue spirals against the background of relatively red disks (NGC 2336, NGC 5605, and NGC 6946).
In terms of their photometric characteristics, the bars occupy an intermediate position between the nuclei (bulges) and the spiral arms. As a rule, the inner regions of bars have color indices close to those of the nucleus or bulge (in galaxies with blue nuclei). The outer regions of bars have colors close to those of the disks (in S0 galaxies) or spiral arms (Figs. 8a, 8b). They occupy regions along the lower and middle part of the NCS on the two-color diagrams. One exception is NGC 5585, which has a complex evolution, whose very blue bar is located in the upper part of the NCS (Figs. 7a-7c). The bars of IC 1525 and of NGC 266 are shifted to the right of the NCS on the and diagrams, respectively.
Since the spirals, bars, and rings develop against the background of their associated disks, we also determined the brightnesses and color indices after subtracting the contribution of the disk (as well as the bulge, for inner regions of the bars) from the total luminosity in the corresponding photometric bands. Unfortunately, it was not possible to determine the color indices of some of the spiral arms, bars, and rings that were only weakly distinguished against the disk after subtracting the disk radiation, due to their large uncertainties. The uncertainties in the IR were too large to consider the galaxy components in the IR diagrams.
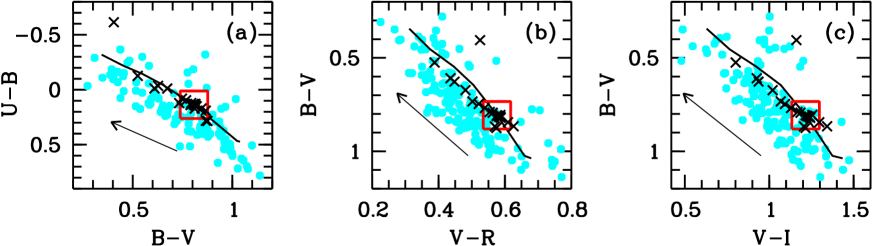
Fig. 9 shows the positions of the spiral arms, bars, and rings after subtracting the contributions of the disk and bulge. In contrast to the galaxy components presented in Fig. 7, the spiral arms, rings, and bars are not grouped along the NCS after the subtraction of the disk contribution. The points characterizing the color indices of the spiral arms and rings are located at the upper end of the NCS, and these color indices are contained within fairly narrow ranges: , , (Figs. 9a, 9b). The bars can be clearly distinguished from the spiral arms and rings in the diagrams, and are located near the lower part of the NCS. Note the absence of any correlation between the color characteristics of the spiral arms and rings and the morphological types of the galaxies (Fig. 10).
Unfortunately, the uncertainties in the color indices for the components, which reach for , , and and for , hinder accurate determination of the component ages; only qualitative crude estimates are possible. The galaxy components are arranged along the evolutionary tracks of stellar systems with roughly solar metallicity in the two-color diagrams. The best indicator of this is the diagram (Fig. 9a). Most of the spiral arms are located in the region of models with ages of 100 Myr – 1 Gyr and characteristic star-formation decay times Gyr; the rings are somewhat older ( Gyr). The color indices for most of the bars correspond to stellar systems with ages of several Gyr (Fig. 9a).
The and diagrams cannot be used to estimate the component ages: the isochrones of stellar systems with different values are located along the evolutionay tracks (Fig. 9b, 9c). However, the diagram can serve as a good indicator for the ages of the youngest components, with ages less than 100 Myr. Systems with ages of less than 100 Myr have and are located above and to the left of the NCS (Fig. 9c).
The bluest components in the sample are the spiral arms of NGC 2336, NGC 6217, NGC 7721, and IC 1525 (these are all giant galaxies with numerous star-forming regions), the rings of NGC 3726 and NGC 6217, and the outer part of the bar of the peculiar Sd galaxy NGC 5585 (the stellar populations of these components have ages of 10–100 Myr; Figs. 9a-9c).
The spiral arms of NGC 532 are anomalously red. This can be explained by the high inclination of the galaxy () and the presence of a powerful dust disk in the galaxy (Gusev, 2006a). It is likely that the absorption in the spiral arms of NGC 532 is appreciably higher than the mean for this galaxy.
The color indices of the bars after subtraction of the contributions of the disk and bulge are often higher than those before this subtraction (compare Figs. 8b and 10). This is especially true of the inner regions of the bars. This may indicate that the stars in the inner part of the bars are older than the stars in the surrounding disk, or that the inner regions of the bars contain a large concentration of dust.
5 DISCUSSION
5.1 The Model NCS and the Observed Color Indices of Galaxy Components
As is shown by Figs. 2a-2c, 7a-7c, the observed color indices of the galaxies and their components are systematically redder than the model color indices. The points representing the former are shifted to the left and downward by in each color index relative to the model NCS in the optical two-color diagrams. Varying the input parameters of the models of Fioc & Rocca-Volmerange (1997) enabled us to consider possible origins of this deviation: differences of the time dependence of the SFR from the model dependence, differences between the real IMF and the Salpeter IMF with the specified upper and lower limits, complex structure of the stellar system that differs from a disk or spheroidal geometry, differences of the physical parameters of the stars and the interstellar medium from the model values.
In particular, we considered stellar systems with a Salpeter IMF () with upper mass limits from to , and also IMFs with shallower () and steeper () profiles. We obtained the color characteristics of stellar systems for the classical model of Sandage (1986) with an exponential decay of the SFR with and also with a modified Sandage model (see Eq. (1)) with coefficients , and 10.
Variation of the IMF, the dependence SFR(), and other parameters either influence the color indices of stellar systems with zero initial metallicity and age Gyr only weakly, or shift the positions of the model stellar systems to the left and upward along the NCS (Fig. 11). The deviation of systems with model parameters different from those used in our study from the NCS do not exceed 0.1 in and and 0.05 in and (the only exception is the model with the shallow IMF with , which has very blue and color indices; Fig. 11). These deviations are too small to explain the differences between the observed and model photometric parameters of the galaxies and their components. Moreover, a shift of the color sequences to the left and upward on the diagrams (for example, for the models with , which have the smallest and colors for the given ) leads to a large shift between the observed and model colors along the absorption line, which cannot be explained using modern estimates of the internal absorption in the galaxies due to the inclinations of their disks.
Thus, variations in the input model parameters cannot explain the differences between the observed and model photometric parameters of the galaxies and their components. We suggest that these differences may be due to differences in the zero points for the photometric system used in the PEGASE.2 program from the standard values. The problem of absolute calibration in the standard Johnson–Cousins photometric system remains a subject of discussion (Bessell & Murphy, 2012). This is due to differences in the photometric parameters of stars that are not on the main sequence in different stellar libraries, as well as uncertainties associated with the shapes of the transmission curves for the filters and the magnitudes and color indices of Vega (the zero points in the bands of this photometric system).
5.2 Estimates of the Ages of the Stellar Populations and the Star-Formation History in the Galaxy Components based on Multi-color Photometry
We showed in Section 4.1 that, on average, the internal absorption of the galaxies determined by the inclination of their disks can be adequately described by the real absorption in the galaxy, and can be used to study the photometric parameters of galaxies and their components for large samples of objects. In particular, this enables studies of variations of the photometric characteristics of the components along the Hubble sequence of galaxies.
The color characteristics of the components in early- and late-type galaxies differ appreciably (Fig. 8a, 8b). Sb galaxies are the least uniform in terms of their photometric parameters. Some galaxies of this type have photometric properties corresponding to early-type galaxies, while the properties of others correspond to late-type galaxies. The morphological type Sb is sometimes assigned to intermediate-type galaxies (see, e.g., Mosenkov et al., 2010). The characteristics of the disks (colors, relative thickness, mass-to-light ratio at the center) and bulges (Sersic parameter, ratio of the bulge to the disk luminosity) of Sb galaxies also reflect the inhomogeneity of the objects assigned to this morphologicl type (de Grijs, 1998; Möllenhoff, 2004; Gusev, 2007). It is striking that, in spite of the appreciable differences in morphology, the components of lenticular galaxies exhibit essentially the same photometric characteristics as those of Sa galaxies.
The colors of the galactic nuclei correspond to those of stellar systems with old populations with ages Gyr, and depend only weakly on the morphological types of the galaxies. The presence of a bar has a larger influence on the color characteristics (the mean age of the stellar population) of the nuclei. Radial gas motions along the bar can stimulate star formation in the nucleus over a prolonged period (Arsenault, 1989; Friedli & Benz, 1995).
Unfortunately, the uncertainties in the color indices of the galaxy components are not sufficiently low to enable reliable determination of the compositions of their stellar populations and their star formation histories (compare Figs. 3 and 7). Another problem is that the absorption in individual galaxies or galaxy components may not correspond to the absorption calculated for the inclination of the galactic disks. This different could be substantial for the irregular components (spiral arms, rings, bars). Moreover, the distribution of dust, and as a consequence the amount of selective absorption, could be different in different spiral arms in the same galaxy. NGC 628 provides an example, where a dust lane passes through the inner edge of one spiral arm, and through the center of the stellar spiral of the opposite arm (Gusev & Efremov, 2013).
The color indices of the spiral arms correspond to those of stellar systems with ages Gyr (Figs. 9a, 9c). The age of the stellar population in the spiral arms is not the same at different galactocentric distances. In the vicinity of the corotation radius, the rotational velocity of the spiral pattern is equal to the rotational velocity of the disk, while the difference between these velocities increases with distance from the corotation radius. Thus, the maximum age of the stellar population in the spiral arms should be observed at distances from the galactic center corresponding to the corotation radius. In this region of the spiral arms, and also in rings, the characteristic time for a star to leave a given component is determined by the radial velocity dispersion for young stars.
In most galaxies, there is no secondary burst of star formation, or it is weak. The deviations of the components in these galaxies to the right or left of the NCS in the two-color diagrams are within the uncertainties in their color indices. However, the positions of the components of some galaxies in the two-color diagrams cannot be explained in the framework of evolutionary models with an exponentially decaying star-formation rate, as described by Eq. (1). These galaxies have apparently undergone external interactions (mergers) in the past, which have stimulated secondary bursts of star formation in them. Many of these galaxies display signs of morphological peculiarities. We consider estimates of the parameters of the secondary burst of star formation and the compositions of the stellar populations in such galaxies below.
5.3 Compositions of the Stellar Populations in the Components of Some Galaxies
NGC 245. This galaxy has a blue nucleus with a nearly constant star-formation rate over the past several billion years (the characteristic decay time for the SFR is Gyr). NGC 245 is a Makarian galaxy with asymmetric spiral arms and numerous star-forming complexes. The color indices of the disk and nucleus coincide within the uncertainties. According to its photometric characteristics, this is a late-type Sb galaxy. The components of NGC 245 lie to the left of the NCS on the diagram and to the right of the NCS on the diagram. This can be explained in models in which a secondary burst of star formation has ended (). The disk is described well by a model with a moderately powerful () burst of star formation occurring about 300 Myr ago; the bulge of NGC 245 is described well by a model with a powerful secondary burst of star formation long in the past ( Gyr).
NGC 266. This classical, symmetrical, early-type barred galaxy is viewed nearly face-on. It is distinguished by its anomalously red colors. The , , , and values for the disk correspond to the integrated color indices of elliptical galaxies, and the color indices of the nucleus and bulge cannot be described using models with an exponential decay in the SFR and zero initial metallicity. All the components of NGC 266 – the nucleus, bulge, disk, bar – have the highest values for these components among our sample galaxies (Figs. 8a, 8b). The relative positions of the components of NGC 266 in the two-color diagrams are typical for galaxies. The photometric characteristics of the components of NGC 266 are described well by models with a standard star-formation history in an initially chemically enriched stellar system (Fig. 2; the NCS for systems with ). These colors can be explained by a secondary burst of star formation in the initial stage of the galaxy’s evolution ( Gyr), for example, as a result of the merger of two stellar systems. An alternative explanation of the anomalous photometric parameters of NGC 266, namely, the presence of a relatively large amount of dust, seems less probable to us; an excess of dust in a galaxy can be explained only as the result of non-standard evolution of the stellar system.
NGC 3184. This is a late-type galaxy with numerous star-forming regions (Hodge, 1982) and a high integrated SFR (Young et al., 1996; Martinet & Friedli, 1997). The outer regions of the spiral arms have a curved, asymmetrical shape. The disk is located above and to the right of the NCS on the and diagrams. The photometric parameters of the NGC 3184 disk are characteristic of spiral arms. Apparently, active star formation is occurring in the NGC 3184 disk, which can be described in a model with numerous brief ( Myr) bursts of star formation. This is also indicated by the high, diffuse background in the H line in the disk between the spiral arms of the galaxy (Gusev & Kaisin, 2002). Clarifying the star-formation history in the disk of NGC 3184 will require surface photometry in and other UV bands.
NGC 3726. This is a late-type galaxy with a bar, ring, and flocculent spiral arms. The outer regions of NGC 3726 have a well defined asymmetric shape (which was not studied by us in Gusev et al., 2002). The positions of the components on the two-color diagrams are typical for Sc galaxies. An exception is the nucleus, which is the bluest component of the galaxy and deviates to the right of the NCS on the diagram. The position of the nucleus of NGC 3726 on the two-color diagrams corresponds best to models with a moderate (), relatively recent secondary burst of star formation ( Myr and Myr). Unfortunately, we did not observe this galaxy in the band, hindering unambiguous determination of the parameters of the nuclear burst of star formation.
NGC 5585. This is a very late-type small galaxy with low surface brightness. It has a pronounced asymmetry: the centers of the galaxy, of the bar, and of the ring do not coincide (Bruevich et al., 2010). It is the bluest galaxy of our sample. The SFR in NGC 5585 is essentially constant: the positions of the components in the two-color diagrams correspond to Gyr. The colors of the ring and outer parts of the bar suggest that the ages of their stellar populations do not exceed 100 Myr.
NGC 6217. This galaxy has a powerful bar and symmetric ring. In contrast to classical barred galaxies, the spiral arms in NGC 6217 begin not from the ends of the bar, but from the nucleus, independent of the bar. Numerous star-forming regions are observed in the galaxy. The nucleus is blue. The colors of the spiral arms and ring correspond to a stellar population with an age of 10–100 Myr, while the colors of the disk testify to active, ongoing star formation ( Gyr). The bulge of NGC 6217 is shifted to the right of the NCS on the diagram, into the region of models with an ongoing secondary burst of star formation. The bulge of NGC 6217 is very small (radius ), and is located between the blue nucleus and the beginning of the bar and spiral arms with active star formation. It is possible that we are observing in this region a mixture of an old stellar population in the bulge and a young population in the surrounding components.
NGC 6340. This is a symmetrical lenticular galaxy. The structure, evolution, and the composition of the stellar population of NGC 6340 were studied in detail in Chilingarian et al. (2009) based on photometric and spectrosopic data. Chilingarian et al. (2009) detected an asymmetry in the composition of the stellar population of the disk of NGC 6340: the ages of stars in the southwest part of the disk are half the ages of those in the northeast part (5 Gyr in the southwest and 10 Gyr in the northeast). The nucleus, bulge, and disk occupy a region in the lower part of the NCS in two-color diagrams, where they are indistinguishable from the components of other early-type galaxies. One exception is the position of the NGC 6340 disk on the diagram, where it is shifted upward and to the right of the NCS. Anomalously low values of are characteristic of stellar systems with moderate () secondary bursts of star formation with durations to several tens of millions of years. Such photometric parameters are characteristic of spiral arms. A system of rings (or tightly wound spiral arms) is clearly visible in the images of NGC 6340 presented in Chilingarian et al. (2009), obtained after subtracting the contributions of the bulge and disk from the image of the galaxy.
NGC 7351. This is a symmetrical S0 galaxy with a small bar. In spite of the fact that NGC 7351 is the earliest-type galaxy in our sample (Table 1), the colors of its components are more characteristic of Sab–Sb spiral galaxies. The nucleus of NGC 7351 is slightly bluer than the bulge and the disk, it has the same colors as the bar (Figs. 8a, 8b). The disk of NGC 7351 is shifted to the right of the NCS on the and diagrams. Its color characteristics correspond to those of stellar systems with a secondary burst of star formation long in the past ( Gyr).
NGC 7678. This is a late-type galaxy with a bar and active star formation ongoing in one of its spiral arms. The components are located around the NCS in the two-color diagrams, in the region corresponding to stellar systems with an exponentially decaying SFR with the characteristic time scale Gyr. The nucleus of NGC 7678 deviates upward and to the right of the NCS on the , and to the right of the NCS on the diagram. The color characteristics suggest a burst of star formation has been occurring in the nucleus over the past 10–30 Myr.
IC 1525. This symmetric galaxy with an intermediate Sb morphological type has a bar and ring. Numerous star-forming complexes are observed in the spiral arms and at the ends of the bar (Bruevich et al., 2011). The nucleus and bar of IC 1525 are shifted to the right of the NCS on the diagram. This provides evidence for the presence of an appreciable fraction of relatively young stars, together with the old stellar population.
6 CONCLUSION
Based on surface photometry of 26 galaxies with various morphological types (from S0 to Sd) in the optical () and near-infrared (), we have studied the compositions of the stellar populations and star-formation histories in their regular (nucleus, bulge, disk) and irregular (spiral arms, bar, ring) components using the PEGASE.2 evolutionary models. We have estimated the compositions of the stellar populations of the galaxy components from their positions on two-color diagrams. The color indices of the components have been compared with the photometric parameters of stellar systems derived for seven evolutionary models with an exponential decrease in the star-formation rate and 672 models with a secondary burst of star formation.
Our main conclusions are the following.
1. The galaxies and their components are described well by evolutionary models of stellar systems with zero initial metallicity, ages of 10–13 Gyr, and an exponential decrease in the star formation rate, with the characteristic time scale for the decay in the SFR being from 1 to 20 billion years. The observed color indices of the galaxies and their components in the optical are systematically redder than the model values by .
2. A secondary burst of star formation can shift the position of a stellar system on the two-color diagrams to the right or left of the NCS and the absorption line. Systems with an ongoing burst of star formation () are shifted to the right of the NCS on the diagram, while systems whose secondary burst of star formation has ended () are shifted to the left. In most models, a secondary burst of star formation shifts stellar systems to the right and/or upward relative to the NCS in the other two-color diagrams.
3. With uncertainties in the color indices , it is possible to detect a powerful secondary burst of star formation () occurring in the last billion years, or a burst with moderate power () occurring Myr ago, from the position of a stellar system in the two-color diagrams.
4. Galaxies of early (S0–Sb) and late (Sb–Sd) types differ appreciably in the photometric characteristics of their components. Both galaxies of early and late types are observed along the Sb galaxies. S0 galaxies are not distinguished from early-type spiral galaxies in terms of their photometric parameters.
5. In 10 of the 26 galaxies studied, the positions of their components on the two-color diagrams can be explained using models with a secondary burst of star formation. The parameters of the inferred secondary bursts have been estimated. Among the ten galaxies with complex star-formation histories, five display signs of peculiarity in their morphologies.
6. In all the galaxies, the ages of the stellar populations in the spiral arms and rings did not exceed 1 Gyr.
Acknowledgements.
This work was supported by the Russian Science Founation (project 14–22–00041). This work has made use of the HyperLeda (http://leda.univlyon1.fr), NED (http://ned.ipac.caltech.edu), and 2MASS (http://irsa.ipac.caltech.edu/applications/2MASS) electronic databases.References
- Arsenault (1989) Arsenault R., 1989, A&A, 217, 66
- Artamonov et al. (1997) Artamonov B.P., Bruevich V.V., Gusev A.S., 1997, Astron. Rep., 41, 577
- Artamonov et al. (1999) Artamonov B.P., Badan Yu.Yu., Bruevich V.V., Gusev A.S., 1999, Astron. Rep., 43, 377
- Artamonov et al. (2000) Artamonov B.P., Badan Yu.Yu., Gusev A.S., 2000, Astron. Rep., 44, 561
- Artamonov et al. (2010) Artamonov B.P., Bruevich V.V., Gusev A.S. et al., 2010, Astron. Rep., 54, 767
- Bessell & Brett (1988) Bessell M.S., Brett J.M., 1988, PASP, 100, 1134
- Bessell & Murphy (2012) Bessell M., Murphy S., 2012, PASP, 124, 140
- Bothun & Gregg (1990) Bothun G.D., Gregg M.D., ApJ, 350, 73
- Bruevich et al. (2007) Bruevich V.V., Gusev A.S., Ezhkova O.V., Sakhibov F.Kh., Smirnov M.A., 2007, Astron. Rep., 51, 222
- Bruevich et al. (2010) Bruevich V.V., Gusev A.S., Guslyakova S.A., 2010, Astron. Rep., 54, 375
- Bruevich et al. (2011) Bruevich V.V., Gusev A.S., Guslyakova S.A., 2011, Astron. Rep., 55, 310
- Buta & Williams (1995) Buta R., Williams K.L., 1995, AJ, 109, 543
- Carpenter (2001) Carpenter J.M., 2001, AJ, 121, 2851
- Chilingarian et al. (2009) Chilingarian I.V., Novikova A.P., Cayatte V., Combes F., di Matteo P., Zasov A.V., 2009, A&A, 504, 389
- de Grijs (1998) de Grijs R., 1998, MNRAS, 299, 595
- Fioc & Rocca-Volmerange (1997) Fioc M., Rocca-Volmerange B., 1997, A&A, 326, 950
- Friedli & Benz (1995) Friedli D., Benz W., 1995, A&A, 301, 649
- Gavazzi et al. (2002) Gavazzi G., Bonfanti C., Sanvito G., Boselli A., Scodeggio M., 2002, ApJ, 576, 135
- Gusev (2006a) Gusev A.S., 2006a, Astron. Rep., 50, 167
- Gusev (2006b) Gusev A.S., 2006b, Astron. Rep., 50, 182
- Gusev (2007) Gusev A.S., 2007, Astron. Rep., 51, 1
- Gusev & Efremov (2013) Gusev A.S., Efremov Yu.N., 2013, MNRAS, 434, 313
- Gusev & Kaisin (2002) Gusev A.S., Kaisin S.S., 2002, Astron. Rep., 46, 712
- Gusev & Kaisin (2004) Gusev A.S., Kaisin S.S., 2004, Astron. Rep., 48, 611
- Gusev & Park (2003) Gusev A.S., Park M.-G., 2003, A&A, 410, 117
- Gusev et al. (2002) Gusev A.S., Zasov A.V., Kaisin S.S., Bizyaev D.V., 2002, Astron. Rep., 46, 704
- Gusev et al. (2003) Gusev A.S., Zasov A.V., Kaisin S.S., 2003, Astron. Lett., 29, 363
- Hodge (1982) Hodge P.W., 1982, AJ, 87, 1341
- Jarrett et al. (2000) Jarrett T.H., Chester T., Cutri R., Schneider S., Skrutskie M., Huchra J.P., 2000, AJ, 119, 2498
- Kinman & Castelli (2002) Kinman T., Castelli F., 2002, A&A, 391, 950
- Landolt (1992) Landolt A.U., 1992, AJ, 104, 340
- Martinet & Friedli (1997) Martinet L., Friedli D., 1997, A&A, 323, 363
- Möllenhoff (2004) Möllenhoff C., 2004, A&A, 415, 63
- Mosenkov et al. (2010) Mosenkov A.V., Sotnikova N.Ya., Reshetnikov V.P., 2010, MNRAS, 401, 559
- Salpeter (1955) Salpeter E.E., 1955, ApJ, 121, 161
- Sandage (1986) Sandage A., 1986, A&A, 161, 89
- Schlafly & Finkbeiner (2011) Schlafly E.F., Finkbeiner D.P., 2011, ApJ, 737, 103
- Schröeder & Visvanathan (1996) Schröeder A., Visvanathan N., 1996, A&AS, 118, 441
- Young et al. (1996) Young J.S., Allen L., Kenny J.D.P., Lesser A., Rownd B., 1996, AJ, 112, 1903
- Zasov & Sil’chenko (1983) Zasov A.V., Sil’chenko O.K., 1983, Sov. Astron., 27, 616