Optical injection induced polarization mode switching and correlation analysis on a VCSEL
Abstract
Vertical cavity Surface Emitting Laser (VCSEL) diodes emit light in two polarization modes. The amount of optical feedback is found to influence the intensities of the emitted modes. We investigate the effect of the amount of total output polarization feedback and polarization selective feedback on the intensities of the two emitted polarization modes. A 40 s resolution time series correlation analysis is done for different feedback conditions and investigate the power spectral continuity and intensity fluctuations in the two polarization modes.
A laser system with delayed optical feedback is a good test bed to understand the evolution of a nonlinear system under noise and chaos [1]. Such studies may also help to gain insight in to many naturally occurring phenomena, for example the effect of feedback in EL Nio oscillations [3]. Delayed optical feedback is found to influence the emission characteristics of the diode lasers [4]. The non linear interaction of the laser active medium with the fed back optical field introduces novel features in the output of the laser [5]. Optical feedback on conventional Edge Emitting Lasers (EEL) shows promising effects on the laser output, some notable effects are bistability, chaos [1, 2], low frequency intensity fluctuations in the output of the laser, [6] etc.
Vertical Cavity Surface Emitting Laser (VCSEL), show behaviour different from the edge emitting ones, due to their different structure. Typically, they emit light perpendicular to the thin active region compared to the EEL. The optical beam is directed in a perpendicular direction to the cavity end faces [7]. The emission is in two distinct modes, with orthogonal polarizations, horizontal (TE) and vertical (TM) [8, 9, 10]. The two modes are coupled internally and energy is transferred between them[8]. In case of a short cavity length, the intensities of polarization modes are not stabilized and shows fluctuations and cross over with laser injecting current and other factors such as birefringence of the laser cavity, temperature, optical feedback, feedback strength etc [11, 12]. A number of studies are performed to understand the complex phenomena exhibited by VCSEL upon feedback. A modulation in the laser injecting current can cause abrupt polarization flips between two modes of the VCSEL [13]. Output dynamics of VCSEL in short external cavity feedback regime shows the emergence of pulse packages [14]. A drift phenomena with optical feedback in VCSEL reported in [15, 12].
Studies are also conducted to investigate the effect of polarization selective optical feedback on VCSEL [16, 17, 15], such feedback in a VCSEL can result in a strong suppression of one of the two orthogonally polarized polarization modes [15]. A square wave modulation switching in the output of a VCSEL with crossed polarization feedback is reported in [18]. Phase dynamics with crossed polarization injection is investigated in [19, 20]. A two-mode VCSEL is also studied to investigate the coupling between two modes [21].
While some of the above phenomena are studied with a specially designed VCSEL [20, 21] and some others are performed at specific situations of a VCSEL operation, such as single mode etc. we undertake a more detailed study of a commercial VCSEL. As our VCSEL shows a two-mode operation with two orthogonally polarized outputs, we investigate how a feedback in only one of them affect the other mode. This is of importance since the two modes are coupled through the two - mode Lang-Kobayashi equations [5]. For the complete study, we first provide a feedback without selecting any particular polarization. i.e., the feedback has the same polarization properties as of the original output of the VCSEL. The dynamics of the two output modes are independently studied. Then we selectively provide a feedback with a particular polarization and study its effect on both modes independently. We also look at the intensity fluctuations and the effect of feedback on it. The correlations between these intensity fluctuations show memory effect at specific feedback situations. This study is therefore in more detail than the above mentioned works. The experimental data provided here is in excellent agreement with the theoretical predictions from reference [8].
For our studies, we take a standard, commercially available VCSEL (VCSEL 780 from Thorlabs Inc., with central wavelength of 780 nm, and a .) and divide its output into two, using a beam splitter. One part is used for monitoring, independently in both polarization modes. The other part is used for feedback. Initially we send the entire output back into the diode, with only attenuating the intensity of the feedback. Later, we select the polarization of the feedback component and also attenuate the amount of feedback. In this case, the feedback has given to only one of the modes while its effect is simultaneously monitored in both modes, as explained in the next section.
The paper is presented as follows. We give a description of the experimental setup, indicating how a polarization-selective feedback and a polarization-independent feedback is provided. The subsequent section provides results of our study with polarization-independent feedback. In this situation, the polarization component of the feedback will be identical to that as provided by the VCSEL. Since the output in two modes generated from the VCSEL depends upon the injection current, (see figure 2), the feedback follows the same state. In the next section, we select the polarization component of the feedback and show its effect on the modes of the VCSEL. Since the two output modes of the VCSEL are coupled [19], a feedback in one of the modes affect the other as well.
1 The Experiment
A schematic of our experimental setup is as shown in Fig.1. The VCSEL (Thorlab, VCSEL 780) used has an operating wavelength of 780 nm and an output power of 1.65 mW. VCSEL is injected by suitable laser current from a laser driver (Thorlab,VITC002). The output laser beam from VCSEL is split by the 50:50 beam splitter (BS) . One beam is directed towards a polarizing beam splitter (PBS) to measure the laser intensity in two orthogonal polarization modes. The vertical intensity is measured by the detector D1 (Thorlabs SM05PD1A, responsivity 0.637 A/W), connected to an oscilloscope (Tektronics TDS3034B - 300 Mhz at 2.5 GS/s). The data stored in the oscilloscope is captured onto the computer using a GPIB card (NI VSB SH) and associated software.
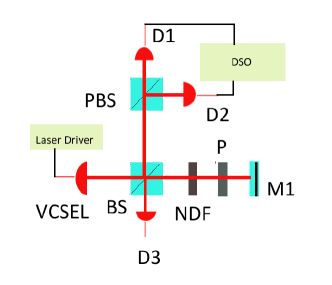
The data is recorded for a period of 400 ms in 10000 bins. Similarly the horizontal intensity is measured by using the detector D2. The actual laser intensity is estimated from the measurement in two orthogonal basis, using detector D1 and D2. The direct beam from the beam splitter is fed to a feedback path formed by a plane mirror having reflectivity greater than 99%. The reflected beam from the mirror is sent back to the VCSEL through the BS. The length of the feedback path from edge of VCSEL to mirror is 20.4 cm. The 50% reflected beam from BS captured by the detector D3 is used to calculate the actual feedback signal intensity goes back to the VCSEL. A neutral density filter(NDF) is used to attenuate the feedback beam. By rotating the NDF angles it is possible to attenuate the amount of feedback. The maximum and minimum signal attenuation possible with NDF are from 16 dB to 6 dB from the input laser intensity. A polarizer (P) is inserted into the feedback path to set the polarization selective feedback in horizontal or vertical basis.
At first we measure the laser output in two different modes as a function of injection current, without any feedback. The feedback part in figure 1 is blocked and the intensities of D1 and D2 are recorded. It is seen that the two modes are not equal in intensity and vary as a function of current. The intensity in horizontal polarization becomes greater than the vertical component a little above 5.90 mA current and they become equal again at about 7.30 mA.
Above 7.30 mA both the components meet and cross at several injection current values. The currents at which they cross and meet also show fluctuations while repeating the experiment. This is the region when there is maximum overlap between two modes and we study the correlation in this region.
2 Behavior Of The System With Feedback Of Arbitrary Polarization
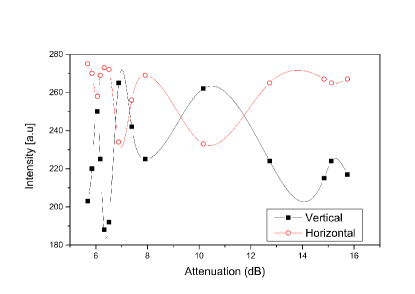
Initially, the polariser in the feedback path is removed so that all feedback is independent of polarization. The laser injection current is set at 7.30 mA. The intensity measured in horizontal and vertical bases, as measured by D1 and D2, for varying attenuation of the feedback from -6 dB to -16 dB is shown in figure 3. It can be seen that depending upon the amount of feedback the output switches from one modes to the other.
When feedback is highly attenuated, the intensity in vertical mode is less compared to horizontal, as shown near -16 dB. As feedback is increased (i.e., attenuation is decreased) the output hops from one mode to another. The symbols in figure 3 indicate experimental data and the smooth line is a spline interpolation to provide visual aid. The hopping frequency increases as the feedback increases, a behaviour characteristic of two coupled oscillators with noise [22]. A small birefringence, if any, within the medium is known to result in the output of the two modes being slightly detuned from each other [8]. But this does not seem to affect our results.
3 Behavior of the system with Polarization selective optical injection
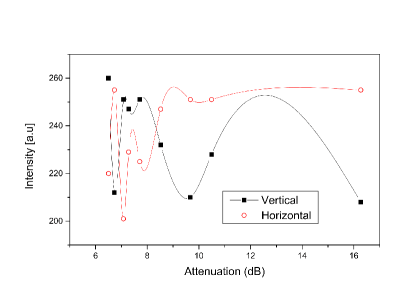
Polarization selective feedback is done by inserting a polariser (LPNIR100, Thorlabs. Extinction ratio of 106 @ 780 nm) within the feedback path. As in case of earlier, attenuation by NDF is characteried by measuring the feedback intensity by detector D3. The laser current is set at 7.40 mA and the output intensity in vertical and horizontal basis are measured for different attenuation. The behaviour is now different for feedback in vertical polarized and horizontal polarized.
When the feedback is in vertically polarized, the diode output shows an oscillatory behaviour, hopping from one mode to other as feedback is increased. But the variation is not as harmonic as in case of polarization independent feedback. For high attenuation of feedback, which is equivalently no feedback condition, the output is predominantly horizontal. As feedback increased, the output hops between polarizations. At very high feedback, the output is predominantly vertical. There also occasional oscillations in the interim positions.
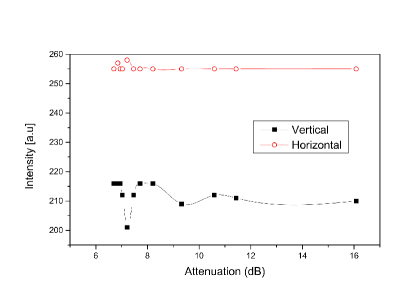
The experiment is repeated for horizontal polarization optical injection and the behaviour is markedly different from vertical position. In this case there is no cross over for polarization observed. The horizontal component is constantly stronger than the vertical component. The horizontally polarized feedback suppresses the vertical output from the VCSEL. Occasional oscillations in both components of the output are observed even here. This is similar to results to polarization switch that occurs for optical feedback for suppressed output and is reported in [15].
4 correlation analysis without optical injection for different laser injection currents
To obtain a better understanding of the coupling between the two modes, and instabilities, we study the time correlation of the output. At first, we study the The auto correlation function (ACF) of the output without any feedback, defined as
| (1) |
where T is the total signal duration, I(t) is the intensity in vertical/horizontal polarizations and is the time lag. For our experimental data the minimum possible is 40 . For a given bin size of 10,000 the 95% confidence level for ACF is calculated as . ie, any coming under 0.02 can be considered as a signal which is independently and identically distributed random variable.
The autocorrelation for vertical polarization outputs are analyzed without optical injection for laser currents of 7.40 mA, 7.6 mA and 7.7 mA (Fig.6). The output conditions, for free running diode at these currents are indicated in figure 2 with vertical lines. For currents of 7.6 mA and 7.7 mA, the intensity correlation value is very low, in the order of . This indicates a randomness in the mode and intensity fluctuations. Whereas it is about 0.05 at 7.4 mA, indicating a stable mode. This behaviour is identical in both horizontal and vertical components.
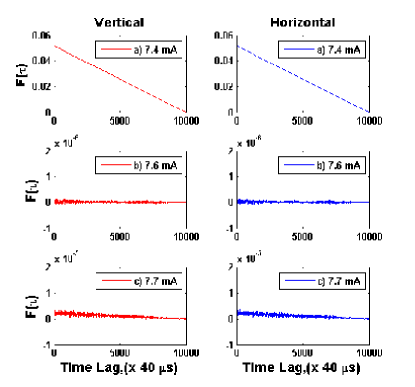
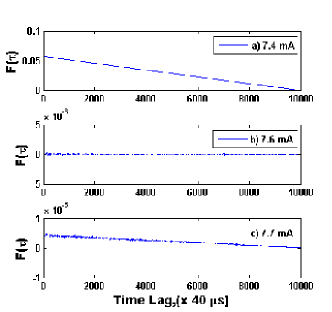
Figure 7 shows the cross correlation between horizontal and vertical polarizations, computed in the same fashion, using equation 2
| (2) |
indicate intensities measured in horizontal and vertical components respectively. It also indicates a correlated output at 7.4 mA and a highly uncorrelated output at 7.6 mA and 7.7 mA.
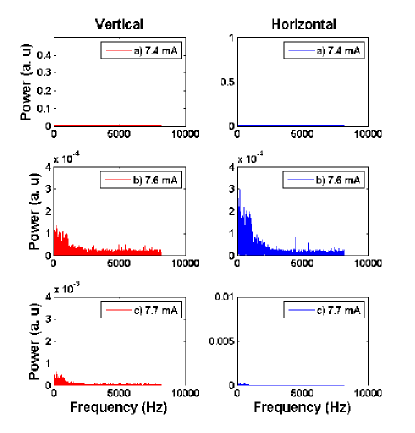
For further understanding, we obtained a Fast Fourier Transform (FFT) analysis of these signals using fft function of MATLAB. The results are shown in (Fig.8). The 7.4 mA laser current injection shows no power in the higher frequencies. But with 7.6 mA and 7.7 mA the intensity fluctuates at higher frequencies, even in absence of any feedback. A change from a continuous FFT spectrum from to a discrete FFT spectrum has been shown earlier to be one of the indications of chaotic oscillation [23]. But this in itself is not a proof of chaos and requires further investigation, which we will show elsewhere [24]
5 Correlation analysis for feedback condition
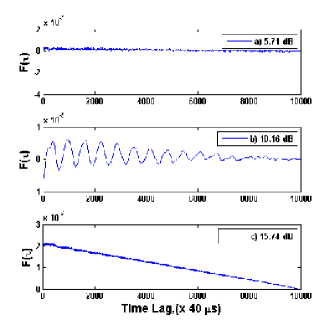
In presence of feedback, the correlation behaviour is different. Figure 9 shows the correlograms for polarization independent feedback for laser current of 7.40 mA. The autocorrelation function shows zero correlation for a feed back attenuated at -5.71 dB and a very small correlation when feedback is attenuated to -15.74 dB. However, at -10.16 dB is the periodic oscillation in the autocorrelation function with a period around 26 ms.
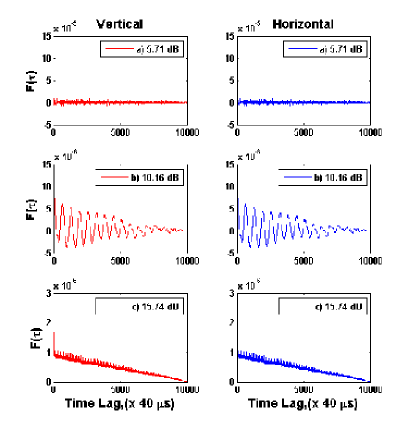
The cross correlation between horizontal and vertical polarization with the same set of data shows uncorrelated behavior (Fig.10.). The periodic rise and fall of the correlation indicate that the output at a certain time depends strongly on the output a much earlier time instead of immediately prior - in this case about 5.3 ms earlier. It is therefore termed as ‘memory effect’ by Feng and coworkers [25], and is observed in many other systems as well.
The cross correlation also shows a similar behaviour, with strongly uncorrelated behaviour at higher feedback and an oscillatory correlation, or memory effect at moderate feedback. This indicates that the vertical and horizontal components are not coupled to each other at high feedback, but at moderate feedbacks, they range from a good correlation to anti-correlation, since the correlation values range from positive to negative values.
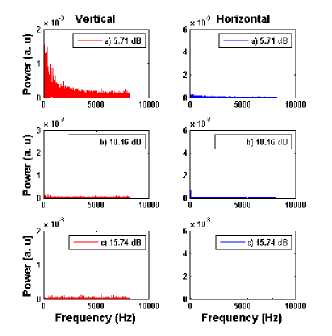
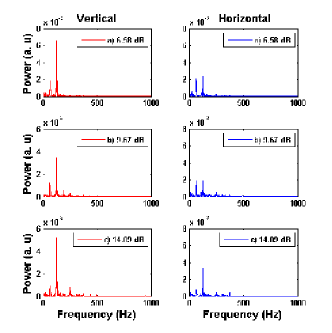
The FFT analysis of the same data is shown in figure 11. Vertical component shows intensity fluctuations at a large range of frequencies, whereas the horizontal component shows very little fluctuation. When feedback is attenuated strongly, the power spectrum does not show any spread, indicating a not so randomized output.
6 Polarization selective optical injection induced correlation analysis
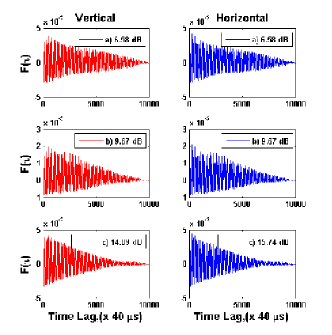
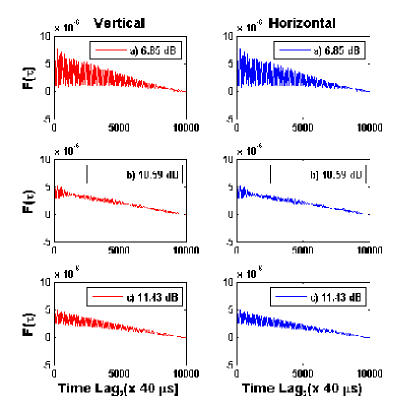
When only one of the polarized component is selected for the feedback, the correlations show large fluctuations. Figure 12 shows the auto correlation for horizontal and vertical polarizations, for vertical feedback and figure 13 shows the same for horizontal polarization selective feedback. Autocorrelation shows values around , as in case of polarization unselective feedback. However, the autocorrelation also shows high frequency oscillations, at a period of 5.32 ms, equal to 188 Hz. In addition, with a vertically polarized feedback, both vertical and horizontal components show oscillations scanning both sides of zero, indicating an oscillation from correlated to anti-correlated regime. Whereas the with only a horizontal feedback, both outputs show values always positive, indicating only a correlated regime, but oscillating between high correlation to low correlation.
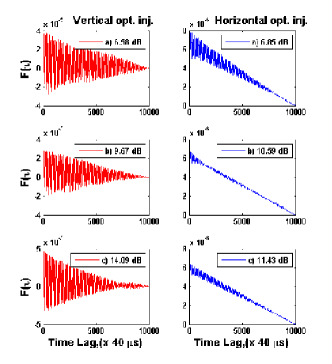
For the same situation, the cross correlation are shown in figure 14. The values range around , but with much more rapid oscillations. The horizontal component is in positive side, indicating only correlations whereas the vertical component oscillates on both sides, indicating an oscillation from correlated to anti-correlated regime.
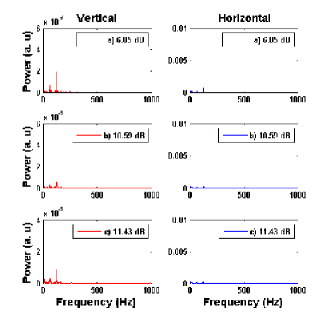
The FFT analysis of the same data is shown in figure 15 and 16 for vertical and horizontal polarization optical injections respectively. The discrete nature of frequency domain spectra shows that the signals are not driven in to instabilities. With horizontal polarization injection the frequency spectra is not prominent compared to vertical polarization injection, especially for horizontal basis measurement.
7 Conclusions
We have shown a detailed investigation of the output dynamics of a VCSEL under feedback, with different strengths and polarizations. A typical VCSEL operatins in two modes, with orthogonal polarizations. We have studied the output of the laser individually into these modes and the effect of feedback on them, both polarization insensitive feedback as well as polarization selective feedback.
We have shown that the output modes of the VCSEL are affected differently when the polarization of the feedback is restricted, as opposed to a feedback without selecting the polarization. We have shown that modes can be suppressed or enhanced by using appropriate feedback. In addition, the FFT analysis of the output shows an enhanced spread in oscillations, indicating larger intensity fluctuations, which could lead to a chaotic output under appropriate conditions. Correlation analysis of the output modes show that the two modes oscillate from non-correlated to correlated or anti-correlated, at differing time intervals. This indicates that the coupling between two modes not only changes strength but also sign depending upon feedback. We also show for the first time, evidence of ‘memory effects’ in the mode dynamics.
The exact nature in which the feedback affects the two modes needs to be studied further using the Lang-Kobayashi equations for the two, coupled-mode formalism [5, 8, 9]. In addition, the feedback of appropriate nature can drive the VCSEL into chaos, which can be used for chaos encryption [2]. We shall show the chaos analysis in another communication and that these same effects can be used for random number generation [24].
S.D acknowledge the support from UGC Minor Research Project no. MRP(S)-0667/13-14/KLKA014/UGC/SWRO. R.S. acknowledges UGC-RGNF scheme for fellowship.
References
- [1] G. Vaschenko et al., Phys. Rev. A,81, 25, (1998)
- [2] S. Sivaprakasam and K. A. Shore, Opt. Lett., 24, 1200 (1999)
- [3] Lewi Stone, Peter I. Saparin, Amir Huppert, and Colin Price, Geophysical Research Letters, 25, 2, (1998)
- [4] Lew Goldberg, Henry F. Taylor, Anthony Dandridge, Joseph F Weller and Ronald O Miles, IEEE Transactions on Microwave Theory and Techniques, MTT-30,4,(1982)
- [5] R. Lang and K. Kobayashi, IEEE J. Quantum Electron. QE-16, 347 (1980).
- [6] G. H. M. van Tartwijk, A. M. Levine and D. Lenstra, IEEE Journal of Selected Topics in Quantum electronics, 1,2,(1995)
- [7] Joanne Y. Law, Ph.D thesis, University of Rochester, (1997)
- [8] C. Masoller and N. B. Abraham, Appl. Phys. Lett. 74, 1078 (1999)
- [9] M. San Miguel, Q. Feng, and J. V. Moloney, Phys. Rev. A 52, 1729 (1995)
- [10] C. Masoller and N. B. Abraham, Phys. Rev. A , (59), 4, (1999)
- [11] Steven J. Schablitsky, Lei Zhuang, Rick C. Shi, and Stephen Y. Chou, Applied Physics Letters, 69,1,(1996)
- [12] Markus Sondermann and Thorsten Ackemann, Optics Express, 13, 7, (2005)
- [13] Giovanni Giacomelli, Francesco Marin, and Ivan Rabbiosi Phys. Rev. Lett. 82, 675 (1999)
- [14] Andrzej Tabaka, Michael Peil, Marc Sciamanna, Ingo Fischer, Wolfgang Elsäßer, Hugo Thienpont, Irina Veretennicoff, and Krassimir Panajotov, Phys. Rev. A, 73, 013810 (2006)
- [15] Giovanni Giacomelli, Francesco Marin, and Marco Romanelli Phys. Rev. A 67, 053809 (2003)
- [16] Yanhua Hong, Paul S. Spencer, and K. Alan Shore, Optics Letters, 29,18,(2004)
- [17] F. Robert, P. Besnard, M. L. Chares, G. M. Stephan, Optical and Quantum Electronics, 27, 9, (1995)
- [18] J. Mulet, M. Giudici, J. Javaloyes, and S. Balle, Phys. rev.A, 74, 043801, (2007)
- [19] J. Javaloyes, M. Marconi and M. Giudici, Phys. rev.A, 90, 023838, (2014)
- [20] A. El Amili, V. Pal, F. Goldfarb, R. Ghosh, M. Alouini,3, I. Sagnes, and F. Bretenaker, Opt. Express, 19, 17250 (2011)
- [21] V. Pal, P. Trofimoff, B.-X. Miranda, G. Baili, M. Alouini, L. Morvan, D. Dolfi, F. Goldfarb, I. Sagnes, R. Ghosh, and F. Bretenaker, Opt. Express, 18, 5008 (2010)
- [22] Otti D’Huys, Thomas Jüngling, and Wolfgang Kinzel, Phys. Rev. E 90, 32918 (2014)
- [23] Robert C. Hilborn, Chaos and Nonlinear Dynamics: An Introduction for Scientists and Engineers (Oxford, New York, 2000), Edn.II, p. 539.
- [24] Ram Soorat, Sajeev D and A Vudayagiri, under preparation.
- [25] S. Feng, C. Kane, P. A. Lee, and A. D. Stone, Phys. Rev. Lett. 61, 834 (1988)