The Progenitor of the Type IIb SN 2008ax Revisited
Abstract
Hubble Space Telescope observations of the site of the supernova (SN) 2008ax obtained in 2011 and 2013 reveal that the possible progenitor object detected in pre-explosion images was in fact multiple. Four point sources are resolved in the new, higher-resolution images. We identify one of the sources with the fading SN. The other three objects are consistent with single supergiant stars. We conclude that their light contaminated the previously identified progenitor candidate. After subtraction of these stars, the progenitor appears to be significantly fainter and bluer than previously measured. Post-explosion photometry at the SN location indicates that the progenitor object has disappeared. If single, the progenitor is compatible with a supergiant star of B to mid-A spectral type, while a Wolf-Rayet (WR) star would be too luminous in the ultraviolet to account for the observations. Moreover, our hydrodynamical modelling shows the pre-explosion mass was 4–5 and the radius was 30–50 , which is incompatible with a WR progenitor. We present a possible interacting binary progenitor computed with our evolutionary models that reproduces all the observational evidence. A companion star as luminous as an O9-B0 main-sequence star may have remained after the explosion.
Subject headings:
supernovae: general – supernovae: individual (SN 2008ax)1. INTRODUCTION
The question of what stellar system produce the different types of core-collapse supernovae (SNe) is still open. While it is accepted that hydrogen-rich (Type II-Plateau) SNe arise from relatively low-mass stars in the red supergiant phase (Smartt et al., 2009), the nature of hydrogen-deficient (Types Ib and Ic) SNe progenitors remains unclear (Eldridge et al., 2013). One crucial aspect is understanding what mechanisms are at play for envelope removal. In this respect it is interesting to focus the attention on the intermediate group of Type IIb SNe (SNe IIb) whose spectra evolve from hydrogen rich to hydrogen poor and which has been suggested to originate from stars that lost most of their H-rich envelopes. Proposed mass-loss mechanisms are those of strong stellar winds or interaction in close binary systems. The former mechanism requires a very large mass of the SN progenitor, possibly with a Wolf-Rayet (WR) or luminous blue variable (LBV) nature.
Remarkably, the firmest identifications of SN-IIb progenitors in pre-explosion images—i.e., those of SNe 1993J and 2011dh—have been associated to moderate-mass supergiants of spectral types F to K (Aldering et al., 1994; Van Dyk et al., 2002; Maund et al., 2011; Van Dyk et al., 2011), hotter than the progenitors of Type II-Plateau SNe. Moreover, they were suggested to have formed close binary systems by the possible detection of their companion stars (Maund et al., 2004; Fox et al., 2014; Folatelli et al., 2014). SNe 2008ax and 2013df are the other two SNe IIb with possible progenitor identifications in pre-explosion imaging. The case of SN 2008ax is revised in this work using newly available data. For SN 2013df, the candidate is again a cool, K-type supergiant star (Van Dyk et al., 2014). These cases appear to indicate a prevailing close binary origin for SNe IIb. However, Gal-Yam et al. (2014) found signatures of a WR-type wind in very ealy spectra of the SN IIb 2013cu.
The SN IIb 2008ax has been an important case of study due to its small distance and the availability of pre-explosion Hubble Space Telescope (HST) imaging and extensive multi-wavelength followup. Crockett et al. (2008) studied the pre-SN images and found a source at the SN location that was possibly the progenitor. With the then available data, the authors selected two out of a series of possible scenarios: a WR star that retained a small amount of hydrogen, or an interacting binary system. The light curves and spectra indicated a relatively low ejected mass and normal kinetic energy (Pastorello et al., 2008; Roming et al., 2009; Tsvetkov et al., 2009; Maurer et al., 2010; Taubenberger et al., 2011; Jerkstrand et al., 2015). The low mass was generally interpreted as an indication against a single massive WR progenitor. However, by including rotation in the evolutionary models of massive stars Georgy et al. (2012) found a suitable progenitor born with 20 and ending with the correct core mass, hydrogen content, luminosity and color to explain the complete set of observations. Groh et al. (2013a) reinterpreted the final stage of the rotating model as a luminous blue variable (LBV) star and suggested that LBVs may be the progenitors of some core-collapse SNe.
One intriguing aspect of SNe IIb is the possible relation between progenitor radius (or H-envelope mass) and circumstellar medium (CSM) density. If the progenitor star can be detected in pre-SN observations, a radius can be determined. Alternatively, the shape of the UV-optical light curve during the first few days after explosion can also indicate the extent of the exploding star depending on the strength of the cooling emission from the shocked envelope (Woosley et al., 1994; Bersten et al., 2012, 2014). The CSM can be probed through radio and X-ray observations and this can be linked to the mass-loss history of the progenitor. When a dense CSM is present shock-heated gas can also produce optical emission at late times, typically evident in box-like emission lines in the spectra and a slow-down of the light curve as compared to the usual radioactive-power decline rate. These phenomena were observed in the SNe IIb 1993J (Matheson et al., 2000a, b) and 2013df (Maeda et al., 2015).
Chevalier & Soderberg (2010) suggested that radio properties of core-collapse SNe provide information about the size of the progenitor and proposed that SNe IIb were divided into those with compact (WR-like) and extended (supergiant) progenitors. SN 2008ax was placed in the compact category while SN 1993J belonged to the extended one. Bersten et al. (2012), however, showed that such a connection breaks down for SN 2011dh. Nonetheless, by restricting to the three SNe IIb with direct progenitor detections and estimates of the CSM density (SNe 1993J, 2011dh, and 2013df), Maeda et al. (2015) suggest that SNe with more extended progenitors may have denser surrounding media, possibly due to a larger mass-loss rate near the time of explosion. The range of radii goes from 200 in SN 2011dh to 600 in SNe 1993J and 2013df. There is a wide variety of SNe-IIb light curves observed during the first few days after explosion, which may indicate a range of progenitor radii. However, it is not clear whether the relation suggested by Maeda et al. (2015) holds in general, and if it represents a continuum of progenitor properties or two distinct groups. Adding more objects to the CSM density–progenitor radius diagram is thus of critical importance to understand the evolutionary paths and mass-loss history of massive stars.
Since the work by Crockett et al. (2008), new HST imaging of the field of SN 2008ax was obtained with longer exposure times and better spatial resolution than the pre-explosion ones. The new images allowed us to revisit the SN site in order to study the nature of the progenitor. In Section 2 we present the high spatial resolution images used in this work and provide estimates for the distance and extinction toward SN 2008ax. Section 3 is dedicated to the analysis of the pre- and post-explosion photometry at the SN site. Section 4 presents the possible properties of the progenitor object based on hydrodynamical and stellar evolution models. Our conclusions are given in Section 5.
2. OBSERVATIONAL DATA
2.1. High-Resolution Imaging
This work is based on high-resolution images of the field where SN 2008ax went off in NGC 4490. The observations are summarized in Table 1, including the images previously analyzed by Crockett et al. (2008) and new imaging obtained in 2011 and 2013. The former dataset included images in four optical bands obtained at three different epochs with the Wide Field Planetary Camera 2 (WFPC2) mounted on HST. The SN site landed on WF detectors for the , , and frames, yielding a pixel scale of pixel-1. In the frames the SN site was on the PC chip, with a pixel scale of pixel-1. The new imaging was obtained in two epochs (in July 2011 and October 2013) using the Wide Field Camera 3 (WFC3) of HST with a pixel scale of pixel-1. In 2011 the , , , , and bands were employed, while in 2013 the imaging was done in the , , , , and bands. Along with a higher resolution, the new images are deeper than the pre-explosion ones.
Processed HST data were downloaded from the Hubble Legacy Archive111http://hla.stsci.edu (HLA). The WFPC2 observations were performed in pairs of exposures with each filter. The combined image had poor quality due to a misalignment of both exposures. We thus performed the image combination for that band using the DRIZZLEPAC package. The WFC3 images from 2011 and 2013 consisted on four and three integrations per band, respectively.
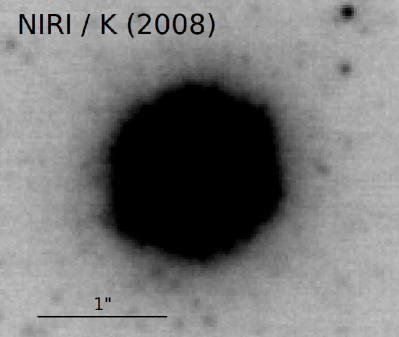
Crockett et al. (2008) obtained ground-based, high-resolution imaging of the SN while it was still bright in order to accurately determine the location of the SN. These observations were carried out in the band using adaptive optics with the Altair/NIRI instrument mounted on the Gemini North Telescope. We obtained the raw images from the Gemini Science Archive222www.cadc-ccda.hia-iha.nrc-cnrc.gc.ca/en/gsa and processed them through sky subtraction and combination using the dedicated tools for NIRI in the gemini package of IRAF. The co-added image has excellent quality, with FHWM of ( pixels).
| Date | Instrument/ | Filter | Exposure | Program | Program |
|---|---|---|---|---|---|
| Detector | (s) | ID | PI | ||
| Pre-explosion | |||||
| 1994-12-03 | WPFC2/WFC | 160 | GO-5446 | Illingworth | |
| 2001-07-02 | WFPC2/PC | 600 | GO-9124 | Windhorst | |
| 2001-11-13 | WFPC2/WFC | 460 | GO-9042 | Smartt | |
| 2001-11-13 | WFPC2/WFC | 460 | GO-9042 | Smartt | |
| Post-explosion | |||||
| 2011-07-12 | WFC3/UVIS | 1704 | GO-12262 | Maund | |
| 2011-07-12 | WFC3/UVIS | 1684 | GO-12262 | Maund | |
| 2011-07-12 | WFC3/UVIS | 1310 | GO-12262 | Maund | |
| 2011-07-12 | WFC3/UVIS | 1029 | GO-12262 | Maund | |
| 2011-07-12 | WFC3/UVIS | 1939 | GO-12262 | Maund | |
| 2013-10-29 | WFC3/UVIS | 2361 | GO-13364 | Calzetti | |
| 2013-10-29 | WFC3/UVIS | 1107 | GO-13364 | Calzetti | |
| 2013-10-29 | WFC3/UVIS | 953 | GO-13364 | Calzetti | |
| 2013-10-29 | WFC3/UVIS | 1131 | GO-13364 | Calzetti | |
| 2013-10-29 | WFC3/UVIS | 977 | GO-13364 | Calzetti | |
2.2. Distance and Extinction
Distance and extinction are usually the largest sources of uncertainty in the study of SN progenitors from direct detections. The distance to NGC 4490 has been computed as Mpc by Pastorello et al. (2008) from an average of several measurements. This value has been extensively used in the literature for SN 2008ax. We note that the average includes distances derived from the recession velocity of the host galaxy. These are relatively large distances that involve large uncertainties given the small recession velocity of NGC 4490. In this work we instead adopt an updated distance of Mpc, as provided by the NASA/IPAC Extragalactic Database (NED), based on seven measurements done with the Tully-Fisher (Tully, 1988; Theureau et al., 2007; Karachentsev et al., 2013), and Sosies (Terry et al., 2002) methods.
Dust extinction in the direction toward SN 2008ax appears to be significant. The Milky-Way contribution is small, the NED provides mag based on infrared dust maps of Schlafly & Finkbeiner (2011). For the host-galaxy reddening, several estimates have been given in the literature based on equivalent widths (EW) of interstellar lines. Pastorello et al. (2008) inferred a reddening of mag from the EW of the Na I D line and using the empirical relation of Turatto et al. (2003). Chornock et al. (2011) noted that the Na I D line is saturated and used the EW of the K I 7699 instead to derive mag based on the relation of Munari & Zwitter (1997). Chornock et al. (2011) also provided an EW of the diffuse interstellar band (DIB) at 5780 Å observed in high-resolution spectra. With their value of 228 mÅ and the relation presented by Phillips et al. (2013), we obtain mag, assuming a standard reddening law of Cardelli et al. (1989) with .
A more accurate measure of the host-galaxy reddening can be obtained from the color evolution. We compared the MW-corrected colors of SN 2008ax with those of a sample of reddening-free stripped-envelope SNe observed by the Carnegie Supernova Project (CSP; Hamuy et al., 2006). The reddening-free sample is composed of SNe with no narrow Na I D absorptions and located relatively apart of star-forming regions. An average intrinsic color curve was constructed from this sample between maximum light and 20 days after. The intrinsic colors evolve monotonically during this interval from mag to mag, with a dispersion of – mag. The color curve of SN 2008ax reproduced the same shape but shifted toward redder colors. We adopt the average shift as the color excess, mag. Due to the dispersion in the intrinsic colors, we consider a systematic uncertainty of mag.
We also compared colors evaluated at 10 days past - and -band maximum light with the intrinsic-color calibrations of Drout et al. (2011) of mag and mag, respectively. For SN 2008ax we measure mag and mag after correcting for MW reddening. An average of the differences from the reference values yields mag. Assuming a standard extinction law with , we obtain mag.
Considering the color excesses derived from observed colors, we adopt a host-galaxy reddening of mag. The same value was adopted by Crockett et al. (2008) in their analysis of the progenitor candidate, although their distance was % longer.
3. ANALYSIS
3.1. Image Registration and Photometry
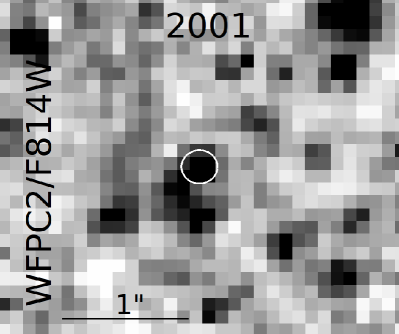
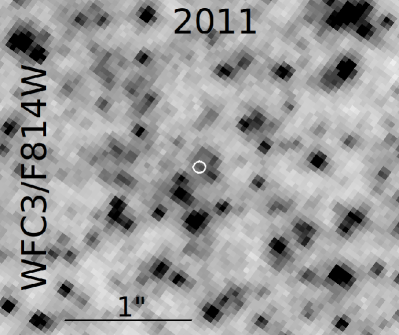
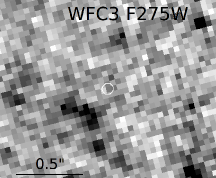
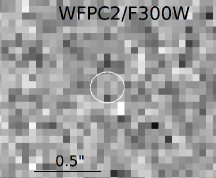
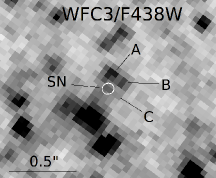
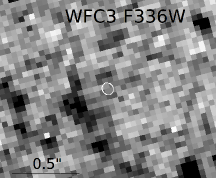
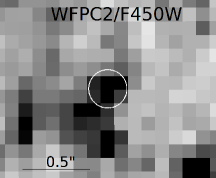
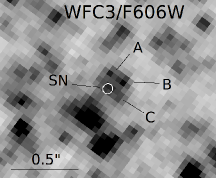
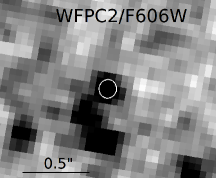
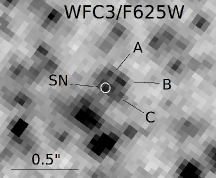
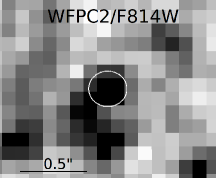
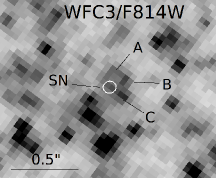
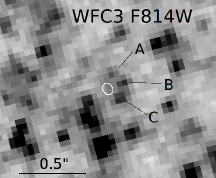
We used the combined NIRI image to find the location of the SN on the images obtained at different epochs. We employed 39 stars in common—the same stars at all epochs—to align the HST images with respect to the NIRI image. The registration produced rms uncertainties of mas ( pixel), mas ( pixel), and mas ( pixel) for the 2001, 2011, and 2013 images, respectively. The location of the SN on the images is shown in Figure 1 and corresponds to pixels , , and in the WFPC2 image, the 2011 WCF3 image and the 2013 WFC3 image, respectively. We confirm the identification of the pre-SN object detected by Crockett et al. (2008) in the WFPC2 images. But the late-time WFC3 images reveal critical information previously unavailable about the possible SN progenitor.
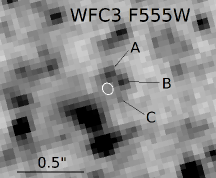
The first thing that strikes the eye from Figure 1 is that the object detected by Crockett et al. (2008) is in fact resolved into four sources in the 2011 image. The source to the SE matches the location of the SN to within 1. We identify this source with the fading SN. Indeed, the 2013 images show that this source has disappeared within the noise. We indicate the other three sources with letters A, B, and C. The object identified by Crockett et al. (2008) as the progenitor candidate is thus contaminated by the light from objects A, B, and C.
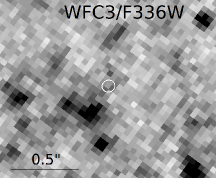
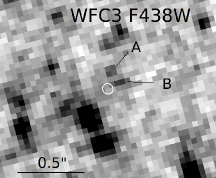
Figure 2 shows the complete set of images used in this work. The identification of sources A, B, and C can be done in the rest of the WFC3 images from 2011 and 2013, except for the bluest bands where the signal-to-noise ratio () is too low. We performed point-spread function (PSF) photometry of the pre-SN source present in the WFPC2 images, and of the four sources identified in the WFC3 images. When the objects were not detected, we estimated limiting magnitudes as explained below.
The pre-explosion WFPC2 images were measured with the DAOPHOT package included in IRAF333IRAF, the Image Reduction and Analysis Facility, is distributed by the National Optical Astronomy Observatory, which is operated by the Association of Universities for Research in Astronomy (AURA), Inc., under cooperative agreement with the National Science Foundation (NSF); see http://iraf.noao.edu.. We employed the combined frames except in the band which showed poor alignment of the individual exposures. In that band we measured PSF photometry on the two images and averaged the results. The resulting photometry is listed in Table 2 (second row), compared with that obtained by Crockett et al. (2008) on the same images (first row). The values are consistent within the uncertainties. We obtain a larger uncertainty in the band, probably due to a larger inconsistency between the two individual exposures. We thus confirm that the magnitude in this band is about mag brighter than what was originally reported by Li et al. (2008) who may have used the misaligned image from the HLA.
No object was detected at the SN location in the WFPC2/ image (Figure 2). We thus estimated a limiting magnitude from the pixel statistics in the region of the PC chip around the SN site. Following Harris (1990), we defined the limiting magnitude for as that of an object with peak pixel value of three times the standard deviation of the background ( counts s-1). Due to the lack of point sources in the PC chip, we could not compute a suitable PSF that would allow us to convert the detection threshold to a magnitude. Instead, we used the encircled energy fractions tabulated by Holtzman et al. (1995) for apertures of different radii. From Table 2(a) in Holtzman et al. (1995), the fraction of flux in a radius of 1 pixel versus 120 pixels is and at the and bands, respectively, with a typical uncertainty of . We assumed an average was valid for , and thus the limiting flux was counts s-1. Using the flux calibration of WFPC2 (Table 5.1 in Gonzaga et al., 2010) the limiting Vega-system magnitude corresponding to that flux is . With and mag, this is mag. This value is similar to that of mag obtained by Crockett et al. (2008)
On the WFC3 images we used the DOLPHOT v2.0 package (Dolphin, 2000). DOLPHOT provides a magnitude from each exposure. We only considered those measurements where the object was detected in all frames. In those cases, the final magnitude was obtained as a weighted average of the individual measurements. In other cases we estimated a limiting magnitude based on the local pixel statistics. The detection limit was set as three times the background standard deviation, and this value was converted into a limiting magnitude in the Vega system using the PSF computed for the image. The resulting magnitudes and limits are listed in Table 3. The photometry of objects A, B, and C remains stable within the uncertainties between 2011 and 2013, while the object identified as the SN in 2011 is no longer detected in 2013. The limits at this latter epoch indicate that the SN became, as expected, fainter with time.
Objects A, B, and C are separated from the SN by , , and , respectively, as measured in the F814W image. At the distance of NGC 4490, these correspond to projected separations of pc, pc, and pc. Their profiles are compatible with being point sources, although the image resolution with full width at half-maximum of corresponds to a projected diameter of 3 pc. Their relative brightness and separation from the SN site make them blend into one source in the WFPC2 images (see Figure 1). As already indicated by Crockett et al. (2008), the size of the source in the WFPC2 images is actually compatible with it holding more than one star.
| Measurement | Reference | ||||
|---|---|---|---|---|---|
| (mag) | (mag) | (mag) | (mag) | ||
| ContaminatedaaPhotometry of the object detected in the pre-SN WFPC2 images. | cc3 detection limit. | Crockett et al. (2008) | |||
| ContaminatedaaPhotometry of the object detected in the pre-SN WFPC2 images. | cc3 detection limit. | This work | |||
| UncontaminatedbbRevised photometry after subtraction of contributions from stars A, B and C. | cc3 detection limit. | This work |
Note. — Uncertainties given in parentheses in units of th of magnitude.
| Date | |||||||
|---|---|---|---|---|---|---|---|
| SN 2008ax | |||||||
| 2011-07-12 | 25.836(291) | 26.085(125) | 25.168(056) | 24.877(110) | 24.825(069) | ||
| 2013-10-29 | |||||||
| Star A | |||||||
| 2011-07-12 | 26.063(326) | 25.529(073) | 25.333(123) | 25.257(133) | 24.847(111) | ||
| 2013-10-29 | 25.984(177) | 25.621(176) | 25.065(160) | ||||
| Average | 26.063(326) | 25.613(103) | 25.621(176) | 25.333(123) | 25.257(133) | 24.898(096) | |
| Star B | |||||||
| 2011-07-12 | 25.903(118) | 25.223(048) | 25.112(073) | 24.679(061) | |||
| 2013-10-29 | 26.033(203) | 25.559(073) | 24.831(103) | ||||
| Average | 25.954(083) | 25.559(073) | 25.223(048) | 25.112(073) | 24.719(053) | ||
| Star C | |||||||
| 2011-07-12 | 27.468(396) | 25.619(081) | 25.244(135) | 24.348(047) | |||
| 2013-10-29 | 26.220(131) | 24.379(077) | |||||
| Average | 27.468(396) | 26.220(131) | 25.619(081) | 25.244(135) | 24.356(040) | ||
Note. — Uncertainties given in parentheses in milimagnitudes.

pre-explosion 2011 2013
3.2. Spectral Energy Distribution
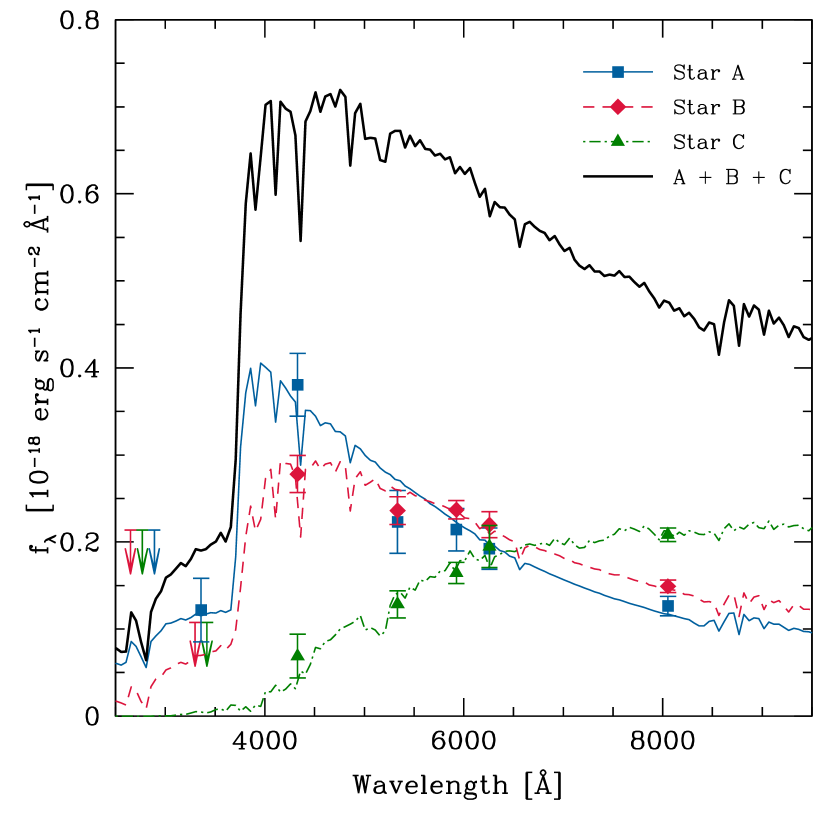
In order to remove the contamination of the three neighboring sources from the proposed SN progenitor found in the pre-explosion WFPC2 images, we determined their spectral energy distributions (SED). For this purpose, we transformed the magnitudes into specific fluxes at the effective wavelength of each band. The results were put in absolute scale by adopting a distance modulus of mag as given by NED. We further assumed the extinction to be the same for the four objects as that of derived for the SN in Section 2.2. The corrected SED for objects A, B, and C are shown in the left panel of Figure 3.
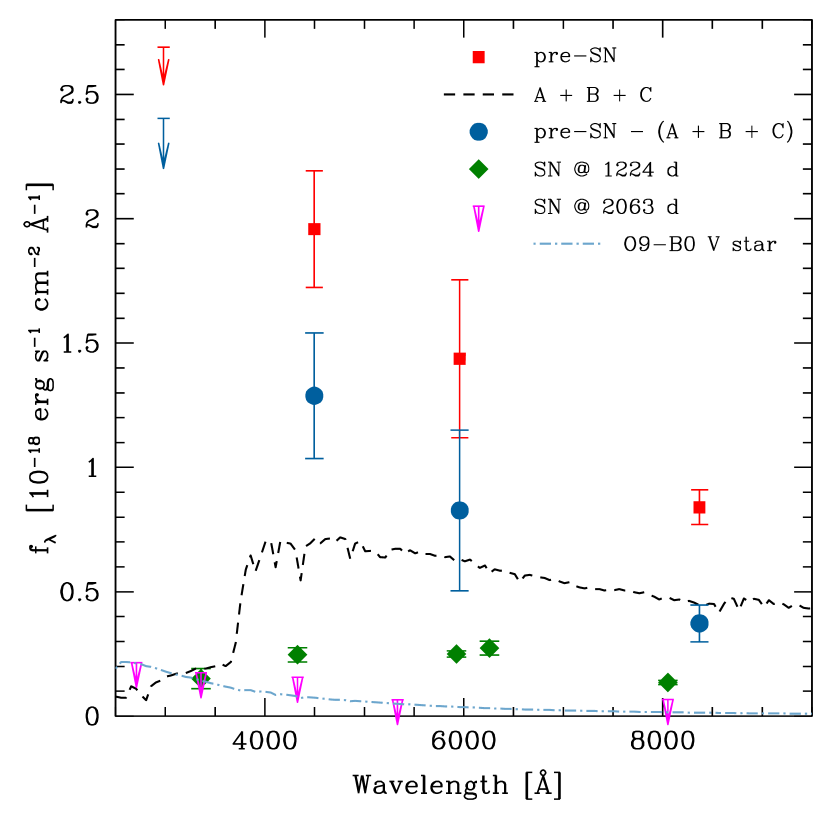
The SED were fit with stellar atmosphere models from Kurucz (1993). The results are shown in Figure 3 and the corresponding effective temperatures and luminosities are given in Table 4. These fits indicate that the objects are compatible with being single stars. The sum of the SED from stars A, B, and C was assumed to have contaminated the photometry of the pre-explosion object detected in the WFPC2 images. The total A+B+C SED flux was checked by computing photometry through a large aperture of -pixel radius that encompassed the three stars in the 2011 and 2013 images after subtracting other nearby sources—including the SN itself in the 2011 images. The resulting fluxes were comparable (to within 20%–30%) with the summed SED in all bands. However, due to the noise included in the large aperture, the unknown aperture correction, and the arbitrary aperture centering, this aperture photometry was too uncertain to be used in the following analysis. We instead computed synthetic photometry using the A+B+C SED in the WFPC2 bands and subtracted it from the observed SED of the pre-SN object. The resulting uncontaminated photometry is shown in the right panel of Figure 3 and listed in Table 2. We note that the contamination accounted for about 34%, 42%, and 55% of the pre-SN flux in the , , and bands, respectively. The contribution in was also calculated and it was subtracted from the upper flux limit of the pre-SN object in that band.
Figure 3 (right panel) also shows the SED of the remaining object at the SN location in the 2011 images (at days after explosion), and the detection limits from the 2013 images (at days after explosion). These calculations indicate that most of the flux of the pre-existing object—even after removing stars A, B and C—has disappeared. The SED at 1224 days may be mostly due to the fading SN, as indicated by the strong decrease in flux at the and bands observed at 2063 days. The flux limits at 2063 days allow only for a small contribution from any other object than the progenitor itself. Such contributions are not greater than about 12%, 8% and 18% of the pre-SN flux in , , and , respectively. The limits in the bluest bands ( and ) place strong constraints on the near-UV emission of any putative left-over object (see Section 4.1).
| Object | Spectral | ||
|---|---|---|---|
| (K) | Type | ||
| Star A | A1 Iab | ||
| Star B | F2 Iab | ||
| Star C | K3 Iab | ||
| ProgenitoraaOne-sigma ranges are given because and are highly correlated as shown in Figure 4. | 7600–20000 | – | B–A Ia |
4. THE PROGENITOR OF SN 2008ax
4.1. Progenitor SED
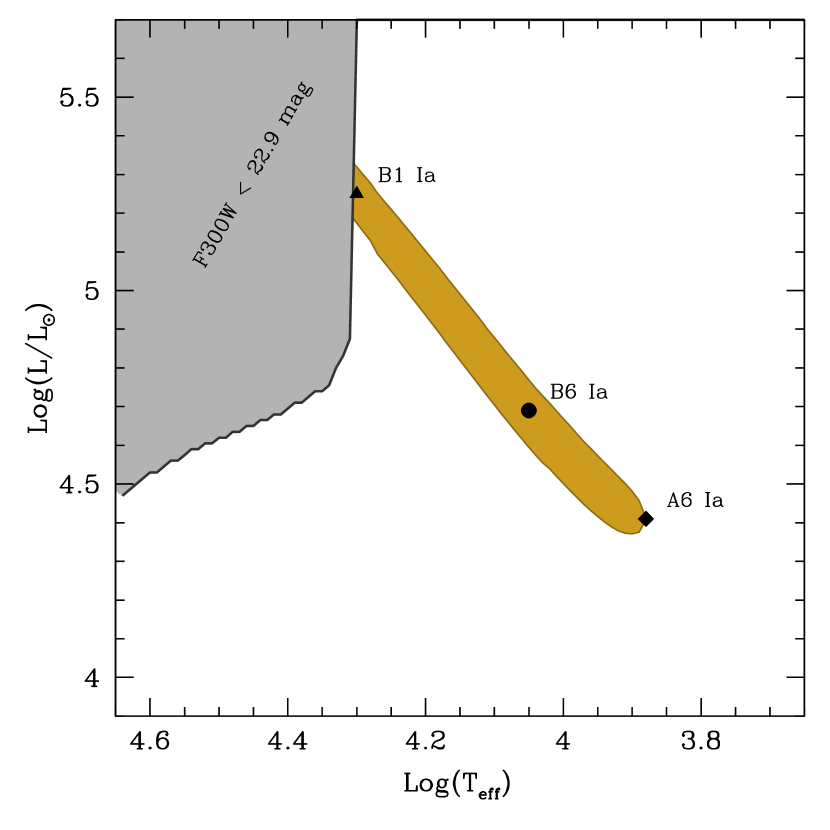
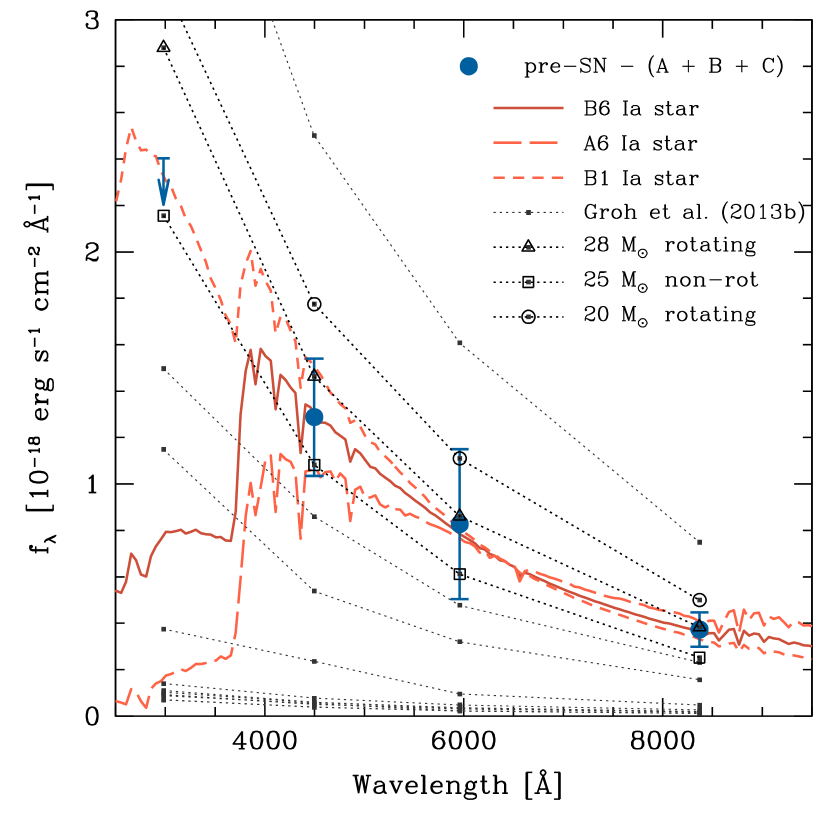
We fit the revised photometry of the progenitor object after removing the flux from the three nearby stars by assuming the SED of a single star using the atmosphere models of Kurucz (1993). The results of such a fit are illustrated in Figure 4. The best-fit model is that with K and , roughly corresponding to a B6 Ia star. The uncertainties in the photometry and lack of detection in the band allow for a relatively wide range of solutions. As shown by the confidence region in Figure 4, temperatures can be as low as K. Solutions with K fail to comply with the upper limit in the band. Most importantly, the resulting temperatures and luminosities are highly correlated. The solutions are within the realm of bright supergiants, with spectral types between B1 and A6. The stellar radii of the fitting models lie within a narrow range of 40–70 .
Alternatively, we tested the atmosphere models of SN progenitors computed by Groh et al. (2013b) for rotating and non-rotating massive stars of solar metallicity. Their models predict that SN-IIb progenitors should end their evolution as red supergiants, yellow hypergiants, Wolf-Rayet or luminous blue variable (LBV) stars, depending on the initial mass and rotation. In Figure 4, right panel, we show the SED of the models in Groh et al. (2013b) computed from synthetic photometry through the WFPC2 filters. Based on rotating models and the uncorrected pre-SN photometry from Crockett et al. (2008), Georgy et al. (2012) showed the progenitor of SN 2008ax was well-reproduced by a 20- star initially rotating at 40% of the critical velocity. Groh et al. (2013a) later reinterpreted the final stage of that model as an LBV star. At the time such an LBV progenitor was able to explain not only the available pre-SN photometry, but also it had a relatively low mass to explain the SN light curve (see Section 4.2), and a small amount of H to produce an SN IIb. With the revised distance and uncontaminated photometry presented here, however, this model no longer fits the pre-SN photometry, as shown in Figure 4.
A better fit to the revised pre-SN photometry in the , and bands is achieved using the rotating model with 28 from Groh et al. (2013b). However, the UV emission is too bright to comply with the upper limit in the band (see Figure 4). Another problem of the model is the low H abundance at the final stage: the progenitor would be a WN star that would produce a Type Ib SN. A further complication is the final progenitor mass being , which too large to explain the light-curve timescale (Section 4.2). A possibly better solution could be that of the non-rotating 25- model, which according to Groh et al. (2013b) leads to a final configuration that is compatible with a SN-IIb event. As shown in the right panel of Figure 4 (green squares), the model is slightly underluminous in all bands. If, however, the distance is assumed to be shorter within the uncertainty the fit to the observed pre-SN photometry can be improved. As mentioned before, the final mass of the model of poses a problem when one considers the shape of the SN light curve.
A different scenario that appears to be recurrent among stripped-envelope SNe and SNe IIb in particular is an interacting binary progenitor. In this case, the primary (donor) star explodes after transferring most of its H-rich envelope to the secondary (accreting) star. As a consequence, the secondary may remain after the explosion. The detection limits from 2013 place constraints on the brightness of any putative left-over companion star. The most luminous companion star allowed is an O9-B0 type, main sequence star, as shown on the right panel of Figure 3. In Section 4.2 we provide support for a binary progenitor based on the mass of the pre-SN object obtained from hydrodynamical modelling of the SN light curve and expansion velocities. In Section 4.3 we present a possible binary system computed with our stellar evolution code that accounts for the pre-SN properties along with complying with constraints from observations of the SN itself.
4.2. Hydrodynamical Models
A set of explosion models were calculated in order to derive the possible physical parameters of SN 2008ax. For this purpose we used a one-dimensional Lagrangian LTE hydrodynamical code (Bersten et al., 2011) applied to stellar evolution pre-SN structures (Nomoto & Hashimoto, 1988) with different He core masses. The methodology is the same that we applied in previous analyses of SNe IIb (e.g., see Bersten et al., 2012; Bufano et al., 2014), i.e. we first derived global parameters focusing on the explosion of H-free structures to fit the main peak of the bolometric light curve and the expansion velocities, and then we used such parameters to analyze the effect on the early light curve of a thin H-rich envelope with different extensions. In order to compare models and observations on the same time frame, we adopted an explosion date of from Taubenberger et al. (2011).
The bolometric light curve was derived using the color-based bolometric corrections provided by Lyman et al. (2014). We adopted this approach over integrating the flux in the observed bands to obtain a more homogeneous result at all epochs independently of the wavelength coverage. The bolometric corrections take into account contributions from the UV and IR ranges that can be significant depending on the SN color. We employed the and light curves published by Pastorello et al. (2008) augmented by observations of Taubenberger et al. (2011). Bolometric corrections were derived using the calibrations for , , , , , , and . The colors above were corrected by Milky-Way and host-galaxy reddening as derived in Section 2.2. Observed magnitudes were corrected for extinction and the resulting bolometric magnitudes were transformed to luminosities using the distance to NGC 4490 also given in Section 2.2. For each color a different result was obtained, thus yielding seven bolometric light curves. These were finally combined by interpolating each light curve to the epochs of the others and averaging the results.
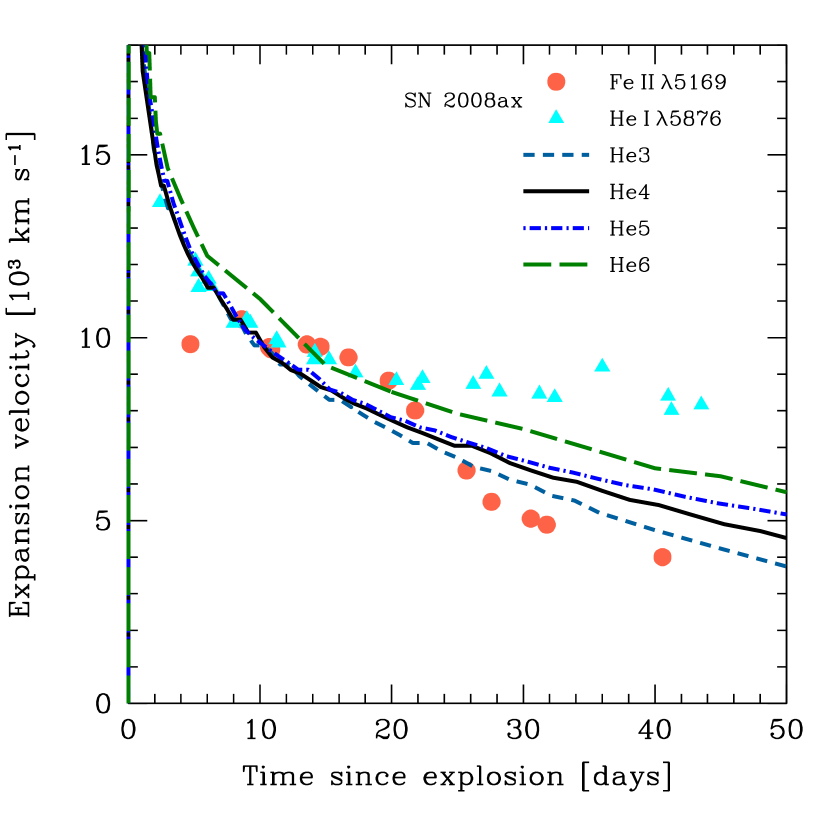
In order to approximate the photospheric velocities calculated by our models, we adopted line expansion velocities derived from Doppler shifts of the He I 5876 and Fe II 5169 absorptions. He I 5876 velocities were taken from Chornock et al. (2011) and Taubenberger et al. (2011), while Fe II 5169 velocities were obtained from the latter work. Roughly after day 10 since explosion He I 5876 velocities began to flatten as the photosphere receded beyond the bottom of the He-rich layer. At such late times Fe II 5169 presumably provides a closer approximation of the photospheric velocity. At early times, the Fe II 5169 velocity has a flat behavior that may be due to contamination from other lines as the Fe II lines are rather weak. We thus adopted the He I velocities at days and the Fe II velocities afterward.
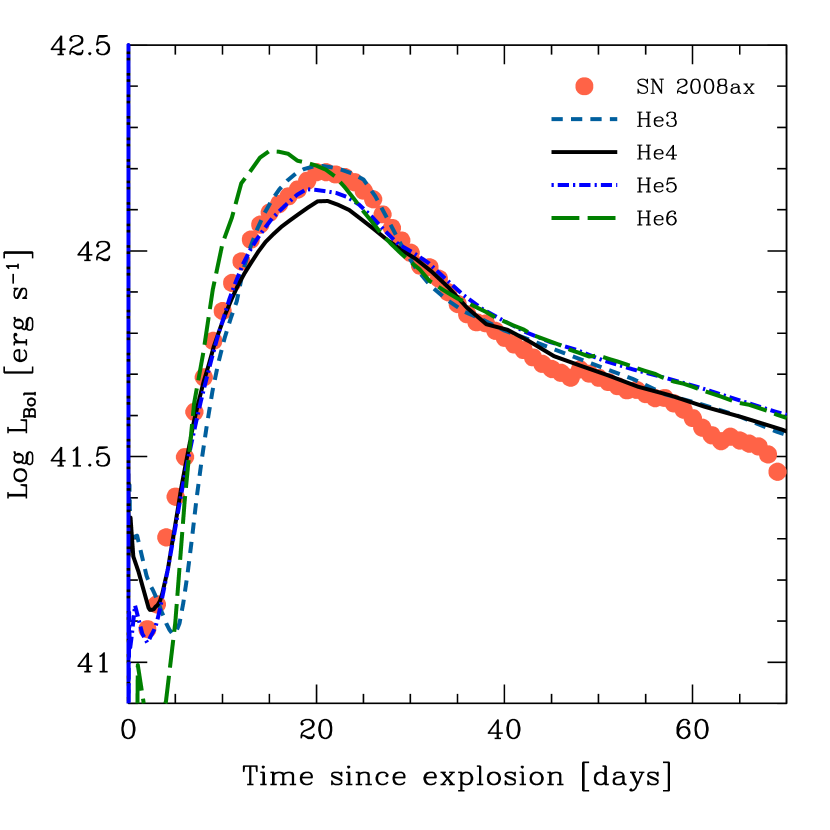
In the first stage of the modeling we derive the ejected mass, explosion energy and radioactive nickel production by fitting the overall shape of the bolometric light curve and expansion velocity evolution. Figure 5 shows the observations compared with four models of different progenitor masses: (1) model He3 with He core mass of , explosion energy of erg, and 56Ni mass of , (2) model He4 with He core mass of 4 , explosion energy of erg, and 56Ni mass of , (3) model He5 with He core mass of 5 , explosion energy of erg, and 56Ni mass of , and (4) model He6 with He core mass of 6 , explosion energy of erg, and 56Ni mass of .
We consider that models He3, He4, and He5 give a fair representation of the observations judging all the uncertainties involved, whereas model He6 provides an overall worse fit to the light curve shape and velocity evolution. The range of validity of the model parameters is roughly given by the three former solutions. Note that models He4 and He5 provide a better fit on the rising part of the bolometric light curve than model He3, but the latter gives a better match to the main peak and subsequent decline. While He5 produces a slightly overestimation of the tail luminosity, He4 has a lower peak and slightly wider light curve than what was observed. On the other hand, He3 gives the best approximation to the late-time photospheric velocity evolution as traced by the Fe II 5169 line. Even if models He4 and He5 provide higher photospheric velocities than the observed ones we consider that they are acceptable given the uncertainties involved. Contrarily, model He6 departs from the observations in an unsolvable manner. Its light curve is too and wide, the initial rise is not well-reproduced, and the late-time velocities are too large. If the energy were lowered to improve the match to the velocities, the resulting light curve would be even wider and the initial luminosity evolution would be even lower.
This analysis suggests that the progenitor of SN 2008ax had a He core mass of . In order to have this low He core mass, the progenitor necessarily had a zero-age main sequence (ZAMS) mass below 25 , thus favoring a binary origin. Our conclusions are consistent with previous results based on analytical modeling (Pastorello et al., 2008; Roming et al., 2009; Taubenberger et al., 2011).
Early photometry obtained within a few days from explosion can serve to reveal the progenitor structure and in particular, the extent of its H-rich envelope (e.g., see Bersten et al., 2012, 2014). During this phase, before radioactivity begins to dominate, the light curve is regulated by the physical conditions of the shock-heated ejecta. This in turn leads to an initial luminosity decline usually referred to as the “cooling phase”. The more extended the progenitor structure, the higher the luminosity and temperature of the emitting region right after shock breakout, and the slower the subsequent decline. The effect on temperature makes the cooling phase more noticeable in the blue bands than in the red ones.
Interestingly, SN 2008ax was observed in the UV range by the Swift satellite soon after the explosion (Roming et al., 2009). The Swift/UVOT data in the UV bands showed an initial decline lasting for at least four days after explosion. This decline was not observed in the optical range, although a slower initial rise may be seen in the Swift band (Roming et al., 2009) and in the band (Pastorello et al., 2008). These observations are reminiscent of a post shock cooling phase. We thus investigated whether the early light curves provided information about the progenitor extent based on our hydrodynamical modelling.
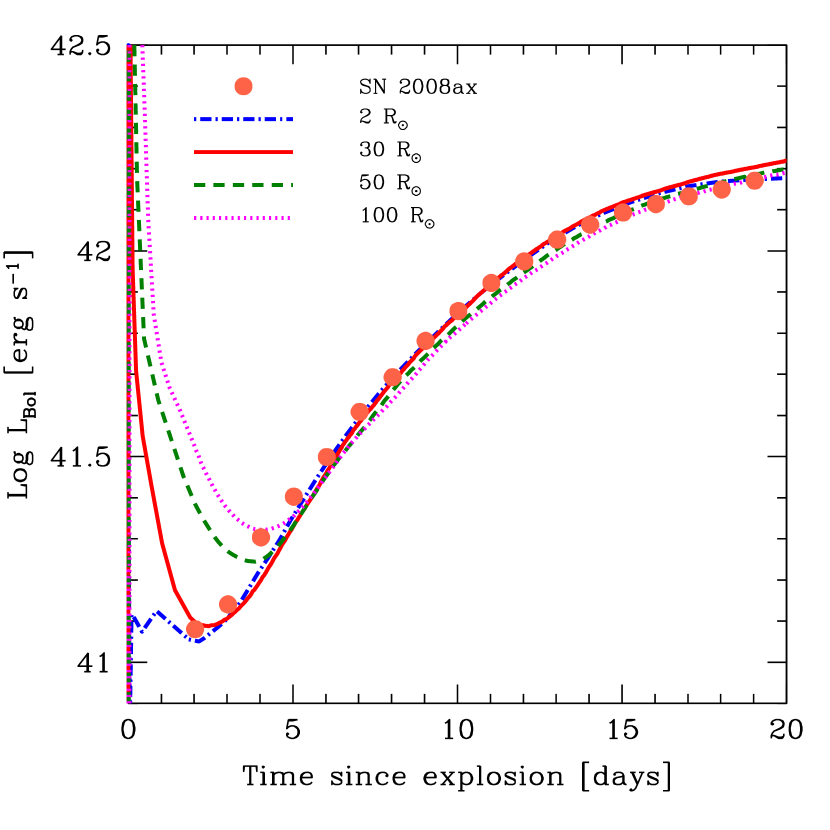
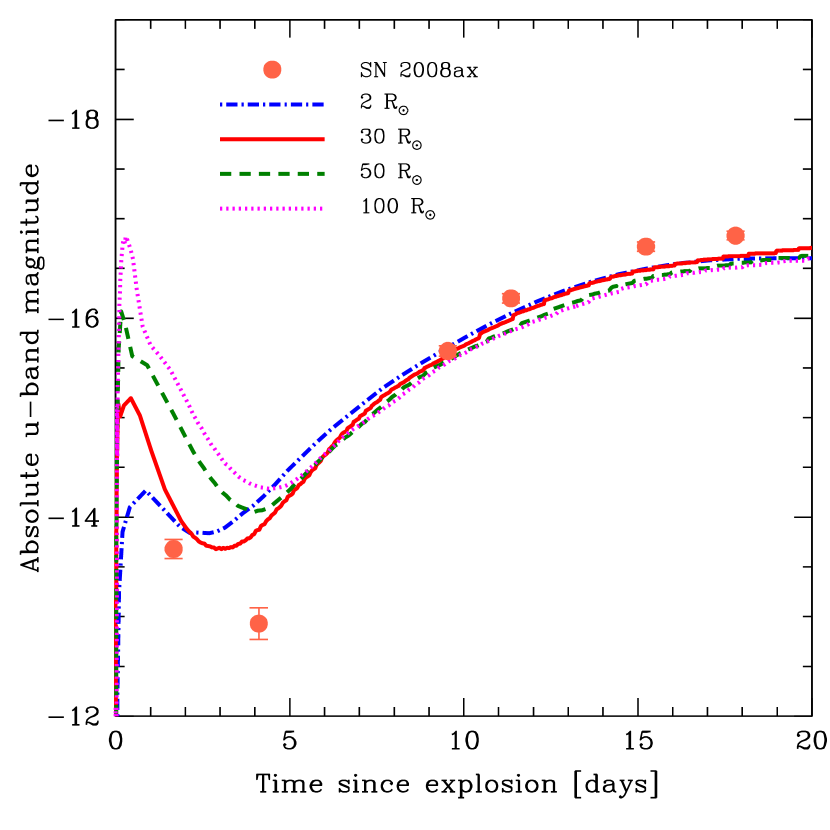
We considered our H-free He5 initial stellar structure, which has a radius of , and modified it by adding thin H-rich envelopes of different extent to , 50, and 100 and masses of – . With these initial structures we computed the hydrodynamics using the same explosion parameters as in the model shown in Figure 5. The left panel of Figure 6 shows the comparison of the resulting bolometric light curves with the observations at early times. Clearly, as the radius increases the initial decline becomes more evident. After about five days since explosion, all the models converge as the light curve becomes regulated by 56Ni radioactivity. The comparison suggests that progenitor radii up to about 30 are allowed.
A caveat should be made about the accuracy of the bolometric luminosity at the earliest times when a significant fraction of the flux is expected to be emitted in the UV range. According to Pritchard et al. (2014), the observed colors of SN 2008ax indicate that the fraction of the total flux included in the Swift UV range is well below 10% at all epochs. And even if the bolometric corrections from Lyman et al. (2014) can account for this contribution (see their Section 5.1), any extra flux at shorter wavelengths may have been missed. This is why in the following we decided to directly compare our models with light curves in individual Swift/UVOT bands.
For that purpose we assumed a black body emission to convert the modeled bolometric light curves into broad-band light curves. This is a simple assumption, although at early times it may provide a valid approximation as the ejecta are sufficiently dense. We constrained our analysis to the -band data since it showed the most clear initial decline. Bluer UV bands showed only upper limits at this early stage. The right panel of Figure 6 shows the comparison of our extended He5 models with the -band light curve. Absolute magnitudes were obtained from the observations by assuming a distance modulus and extinction as derived in Section 2.2 (i.e., -band extinction of mag). Although the models fail to exactly reproduce the low luminosity at days, presumably due to the black-body approximation, we can qualitatively see that the more extended the progenitor the larger the initial decline and the later the light-curve minimum occurs. Also the extended models produce a smaller contrast between the minimum and the subsequent maximum of the light curve. The apparent duration and depth of the observed minimum would indicate that the most favored models are those between 30 and 50 .
We performed a similar analysis based on the He3 and He4 models and found a worse comparison with the observations. In particular, as the core mass decreases, the -band light curve becomes more luminous. This is a consequence of the increased temperatures reached by the ejecta due to the shock wave propagation. Although the approximations involved may prevent a definitive conclusion to be driven, the overall trends of the -band analysis seem to indicate that the mass of the progenitor was between 4 and 5 and its radius was between 30 and 50 . Indeed, the location of the pre-SN object in the Hertzsprung-Russell diagram (HRD; see Section 4.3) indicates an extended structure for the progenitor of .
4.3. A Binary Progenitor
We now consider whether the results from the previous sections can be interpreted in the frame of the theory of binary stellar evolution. For this purpose we computed several models with the aim of accounting for the pre-supernova photometry and, simultaneously, the observed light curve of SN 2008ax. A successful model should produce a progenitor with a final mass of to reproduce the SN light curve, and a small amount of hydrogen in the outermost layers to satisfy the SN classification as Type IIb.
We employed the code described in Benvenuto & De Vito (2003), updated to consider the case of massive binaries as presented in Benvenuto et al. (2013). Our stellar code handles the mass transfer process in a fully implicit way. We considered models with solar chemical composition and ignored the effects of rotation. Furthermore, we assumed that the companion star is able to retain a fraction of the material transferred by the primary (the one that explodes). is kept fixed throughout the entire evolution of the pair. We ended the calculations at oxygen exhaustion. Since the remainder of the primary evolution occurs during a very short time scale and only affecting its core, it is safe to assume that the stars do not significantly move any further in the HRD.
We explored the parameters of the problem—the masses of the components and the initial orbital period, —based on our study of SN 2011dh (Benvenuto et al., 2013). In comparison, for SN 2008ax we found slightly larger initial masses and a much shorter . The observations of SN 2008ax are fulfilled with a pair of 18+12 on an orbit with days, while for SN 2011dh we proposed a pair with 16+10 and days.
In Figure 7 we show the resulting evolutionary track for the case of . Shortly after the end of the core hydrogen burning stage, the primary star undergoes Roche lobe overflow (RLOF), i.e., a Class B mass transfer episode. The main mass transfer episode starts at an age of Myr and lasts for only 26 Kyr. The star detaches from its Roche lobe with a mass of ; thus, the mean mass transfer rate is of yr-1 while the maximum value is of yr-1. Core helium burning starts soon after the end of the RLOF, and most of it is burned during the large blue loop in the HRD. When central helium is exhausted the star begins to swell again, evolving to lower effective temperature conditions. Then, the primary star begins to burn carbon and quickly undergoes the second RLOF that lasts up to explosion. The companion star reacts to accretion by swelling appreciably, but it does not fill its own Roche lobe at any moment; therefore, the binary never reaches a contact configuration and thus avoids suffering a common-envelope episode.
The primary explodes at an age of Myr. At these conditions, the pre-SN has a mass of and a radius of . Most of its radius is occupied by the outer hydrogen rich layer (outward of ) containing only . The total amount hydrogen in the outer layer is of . At that moment, the companion has a mass of with a luminosity and effective temperature very similar to those corresponding to a 20 star on the Zero Age Main Sequence (ZAMS, see Figure 7); so, it is somewhat overluminous.
The parameters chosen for the binary system satisfy the effective temperatures and luminosities for both stars just before the explosion, and also a primary structure capable of accounting the light curve and classification of SN 2008ax. However, we should remark that this is not a unique solution because the parameters are degenerate. For example, we may have chosen a higher initial mass for the companion and a lower value of to reach a similar final mass. In any case, it seems virtually impossible to find a final mass of the primary of 4–5 —suitable to account for the observed light curve—if the initial primary mass is modified by more than about .
The results presented in this section allow us to state that binary stellar evolution is able to provide a successful progenitor scenario to explain the main characteristics of SN 2008ax.

5. CONCLUSIONS
SN 2008ax has been one of the best-studied SNe IIb to date. Along with extensive, multi-wavelength follow-up observations, the existence of deep pre-explosion HST images placed this object among a selected group of SNe IIb for which a progenitor could be characterized, as first done by Crockett et al. (2008). Since then, additional observations of the SN site were obtained with even higher resolution using the WFC3 camera on board HST. The new images allowed us to revisit the progenitor candidate and to discover that it was in fact a multiple source. After subtracting the light from three nearby stars, the revised progenitor photometry resulted significantly fainter and bluer than what was measured on the pre-explosion images. Moreover, the new images showed a fading source coincident with the SN location and demonstrated that most of the light from the pre-SN source had disappeared. This observation unambiguously showed the correct identification of the exploding star. SN 2008ax is thus the third SN IIb, after SNe 1993J and 2011dh, with a firm progenitor detection.
Comparing the revised photometry with stellar atmosphere models, we found that the progenitor, if single, was compatible with a B to mid-A type supergiant star. Contrarily, pre-SN models of WR and LBV stars calculated by Groh et al. (2013b), some of which had been proposed for SN 2008ax based on the contaminated photometry, are not compatible with the new photometry. Detection limits from the 2013 images allow for a relatively faint source to be left at the SN site. We estimated that any such remaining object could be as luminous as an O9–B0 main-sequence star.
Using hydrodynamical models to reproduce the bolometric light curve and photospheric velocity evolution we arrived at the conclusion that the exploding object had a relatively low mass of 4–5 , similarly to what had been concluded based on other techniques. From a comparison with the early light curves, especially those in the UV range, we additionally concluded that the progenitor must have had a relatively extended structure, with a low-density H-rich envelope reaching about 30–40 . Such a low mass and extended radius disfavor a massive progenitor that loses the outer envelope via stellar winds and ends its life as a WR or LBV star. We note that even if the favored progenitor appears as a blue supergiant star, resembling those of SN 1987A-like events, the stellar structure is substantially different in the case of SN 2008ax, with a much lower-mass, extended H-rich envelope. The difference in H mass is what explains the dissimilar light curve shape and spectroscopic properties between the SN IIb 2008ax and the SN 1987A-like objects.
A viable alternative is that of an interacting binary system. In this case, the progenitor is allowed to be less massive and the envelope is lost through mass transfer to the companion star. We were able to provide such a binary model using our stellar evolution code. The model assumed a pair of 18+12 in a close orbit (with initial period of 5 days) that naturally explained the explosion of a nearly H-free, 4 star of with a remaining main-sequence companion that complied with the latest detection limits. The solution is not unique but it demonstrates that the scenario is plausible. A definitive confirmation and characterization of the proposed binary progenitor would require a deep search for the companion star in future observations from space.
The case of SN 2008ax sheds light on the origin of SNe IIb, which has implications for the progenitors of core-collapse SNe in general. To date there are three SNe IIb with identified progenitors, namely SNe 1993J, 2008ax, 2011dh, and one candidate for SN 2013df. Remarkably, in all of these cases the progenitors have been suggested to belong to binary systems. For SNe 1993J and 2011dh there is further evidence of the presence of a hot companion star (Maund et al., 2004; Fox et al., 2014; Folatelli et al., 2014). This fact points to a possible common origin for SNe IIb.
The history of mass loss for SN-IIb progenitors is a crucial aspect to understand their nature. From radio and X-ray observations and by studying the late-time optical spectra and light curves, evidence of substantial amounts of CSM has been found for SNe 1993J and 2013df. Contrarily, SNe 2008ax and 2011dh appear to have occurred in much “cleaner” environments. Such differences may indicate a different mass-loss history. In the interacting binary scenario, this may in turn be linked with the strength and timing of the mass-transfer episodes and with the ability of the accreting star to retain the material. As pointed out by Maeda et al. (2015), the cases with denser CSM correspond to more extended progenitors, of over 500 . With a progenitor radius of only 40 as derived from our models, SN 2008ax would agree with the same picture. More objects are necessary to confirm if this is a general rule for SNe IIb and whether the progenitor radius and CSM density follow a continuum of properties or if they group into two distinct classes. Finally, the physical reason for such a possible distinction is yet to be known and would require detailed modeling of the progenitor evolution.
References
- Aldering et al. (1994) Aldering, G., Humphreys, R. M., & Richmond, M. 1994, AJ, 107, 662
- Benvenuto & De Vito (2003) Benvenuto, O. G., & De Vito, M. A. 2003, MNRAS, 342, 50
- Benvenuto et al. (2013) Benvenuto, O. G., Bersten, M. C., & Nomoto, K. 2013, ApJ, 762, 74
- Bersten et al. (2011) Bersten, M. C., Benvenuto, O. G., & Hamuy, M. 2011, ApJ, 729, 61
- Bersten et al. (2012) Bersten, M. C., Benvenuto, O. G., Nomoto, K., et al. 2012, ApJ, 757, 31
- Bersten et al. (2014) Bersten, M. C., Benvenuto, O. G., Folatelli, G., et al. 2014, AJ, 148, 68
- Blinnikov et al. (1998) Blinnikov, S. I., Eastman, R., Bartunov, O. S., Popolitov, V. A., & Woosley, S. E. 1998, ApJ, 496, 454
- Bufano et al. (2014) Bufano, F., Pignata, G., Bersten, M., et al. 2014, MNRAS, 439, 1807
- Cardelli et al. (1989) Cardelli, J. A., Clayton, G. C., & Mathis, J. S. 1989, ApJ, 345, 245
- Chevalier & Soderberg (2010) Chevalier, R. A., & Soderberg, A. M. 2010, ApJ, 711, L40
- Chornock et al. (2011) Chornock, R., Filippenko, A. V., Li, W., et al. 2011, ApJ, 739, 41
- Crockett et al. (2008) Crockett, R. M., Eldridge, J. J., Smartt, S. J., et al. 2008, MNRAS, 391, L5
- Dolphin (2000) Dolphin, A. E. 2000, PASP, 112, 1383
- Drout et al. (2011) Drout, M. R., Soderberg, A. M., Gal-Yam, A., et al. 2011, ApJ, 741, 97
- Eldridge et al. (2013) Eldridge, J. J., Fraser, M., Smartt, S. J., Maund, J. R., & Crockett, R. M. 2013, MNRAS, 436, 774
- Folatelli et al. (2014) Folatelli, G., Bersten, M. C., Benvenuto, O. G., et al. 2014, ApJ, 793, L22
- Fox et al. (2014) Fox, O. D., Azalee Bostroem, K., Van Dyk, S. D., et al. 2014, ApJ, 790, 17
- Gal-Yam et al. (2014) Gal-Yam, A., Arcavi, I., Ofek, E. O., et al. 2014, Nature, 509, 471
- Georgy et al. (2012) Georgy, C., Ekström, S., Meynet, G., et al. 2012, A&A, 542, AA29
- Gonzaga et al. (2010) Gonzaga, S., & Biretta, J., et al. 2010, in HST WFPC2 Data Handbook, v. 5.0, ed., Baltimore, STScI
- Groh et al. (2013a) Groh, J. H., Meynet, G., & Ekström, S. 2013, A&A, 550, L7
- Groh et al. (2013b) Groh, J. H., Meynet, G., Georgy, C., & Ekström, S. 2013, A&A, 558, AA131
- Hamuy et al. (2006) Hamuy, M., Folatelli, G., Morrell, N. I., et al. 2006, PASP, 118, 2
- Harris (1990) Harris, W. E. 1990, PASP, 102, 949
- Holtzman et al. (1995) Holtzman, J. A., Hester, J. J., Casertano, S., et al. 1995, PASP, 107, 156
- Jerkstrand et al. (2015) Jerkstrand, A., Ergon, M., Smartt, S. J., et al. 2015, A&A, 573, AA12
- Karachentsev et al. (2013) Karachentsev, I. D., Makarov, D. I., & Kaisina, E. I. 2013, AJ, 145, 101
- Kurucz (1993) Kurucz, R. 1993, ATLAS9 Stellar Atmosphere Programs and 2 km/s grid. Kurucz CD-ROM No. 13. Cambridge, Mass.: Smithsonian Astrophysical Observatory, 1993, 13
- Li et al. (2008) Li, W., Filippenko, A. V., & van Dyk, S. D. 2008, Central Bureau Electronic Telegrams, 1306, 1
- Lyman et al. (2014) Lyman, J. D., Bersier, D., & James, P. A. 2014, MNRAS, 437, 3848
- Maeda et al. (2015) Maeda, K., Hattori, T., Milisavljevic, D., et al. arXiv:1504.06668
- Matheson et al. (2000a) Matheson, T., Filippenko, A. V., Barth, A. J., et al. 2000, AJ, 120, 1487
- Matheson et al. (2000b) Matheson, T., Filippenko, A. V., Ho, L. C., Barth, A. J., & Leonard, D. C. 2000, AJ, 120, 1499
- Maund et al. (2004) Maund, J. R., Smartt, S. J., Kudritzki, R. P., Podsiadlowski, P., & Gilmore, G. F. 2004, Nature, 427, 129
- Maund et al. (2011) Maund, J. R., Fraser, M., Ergon, M., et al. 2011, ApJ, 739, L37
- Maurer et al. (2010) Maurer, I., Mazzali, P. A., Taubenberger, S., & Hachinger, S. 2010, MNRAS, 409, 1441
- Munari & Zwitter (1997) Munari, U., & Zwitter, T. 1997, A&A, 318, 269
- Nomoto & Hashimoto (1988) Nomoto, K.,& Hashimoto, M. 1988, Phys. Rep., 163, 13
- Pastorello et al. (2008) Pastorello, A., Kasliwal, M. M., Crockett, R. M., et al. 2008, MNRAS, 389, 955
- Phillips et al. (2013) Phillips, M. M., Simon, J. D., Morrell, N., et al. 2013, ApJ, 779, 38
- Pritchard et al. (2014) Pritchard, T. A., Roming, P. W. A., Brown, P. J., Bayless, A. J., & Frey, L. H. 2014, ApJ, 787, 157
- Roming et al. (2009) Roming, P. W. A., Pritchard, T. A., Brown, P. J., et al. 2009, ApJ, 704, L118
- Schlafly & Finkbeiner (2011) Schlafly, E. F., & Finkbeiner, D. P. 2011, ApJ, 737, 103
- Shigeyama et al. (1994) Shigeyama, T., Suzuki, T., Kumagai, S., et al. 1994, ApJ, 420, 341
- Smartt et al. (2009) Smartt, S. J., Eldridge, J. J., Crockett, R. M., & Maund, J. R. 2009, MNRAS, 395, 1409
- Taubenberger et al. (2011) Taubenberger, S., Navasardyan, H., Maurer, J. I., et al. 2011, MNRAS, 413, 2140
- Terry et al. (2002) Terry, J. N., Paturel, G., & Ekholm, T. 2002, A&A, 393, 57
- Theureau et al. (2007) Theureau, G., Hanski, M. O., Coudreau, N., Hallet, N., & Martin, J.-M. 2007, A&A, 465, 71
- Tsvetkov et al. (2009) Tsvetkov, D. Y., Volkov, I. M., Baklanov, P., Blinnikov, S., & Tuchin, O. 2009, Peremennye Zvezdy, 29, 2
- Tully (1988) Tully, R. B. 1988, Nearby Galaxy Catalog
- Turatto et al. (2003) Turatto, M., Benetti, S., & Cappellaro, E. 2003, in Proc. ESO/MPA/MPE Workshop, From Twilight to Highlight: The Physics of Supernovae. Hillebrandt W., Leibundgut B., eds., Springer-Verlag, Berlin, 200
- Van Dyk et al. (2002) Van Dyk, S. D., Garnavich, P. M., Filippenko, A. V., et al. 2002, PASP, 114, 1322
- Van Dyk et al. (2011) Van Dyk, S. D., Li, W., Cenko, S. B., et al. 2011, ApJ, 741, L28
- Van Dyk et al. (2014) Van Dyk, S. D., Zheng, W., Fox, O. D., et al. 2014, AJ, 147, 37
- Woosley et al. (1994) Woosley, S. E., Eastman, R. G., Weaver, T. A., & Pinto, P. A. 1994, ApJ, 429, 300