Discovery of rare doublelobe radio galaxies hosted in spiral galaxies
Abstract
Double-lobe radio galaxies in the local Universe have traditionally been found to be hosted in elliptical or lenticular galaxies. We report the discovery of four spiral-host double-lobe radio galaxies (J0836+0532, J1159+5820, J1352+3126 and J1649+2635) that are discovered by cross-matching a large sample of 187005 spiral galaxies from SDSS DR7 to the full catalogues of FIRST and NVSS. J0836+0532 is reported for the first time. The host galaxies are forming stars at an average rate of – M⊙ yr-1 and possess Super Massive Black Holes (SMBHs) with masses of a few times 108 M⊙. Their radio morphologies are similar to FR-II radio galaxies with total projected linear sizes ranging from 86 kpc to 420 kpc, but their total 1.4 GHz radio luminosities are only in the range 1024 1025 W Hz-1. We propose that the formation of spiral-host double-lobe radio galaxies can be attributed to more than one factor, such as the occurrence of strong interactions, mergers, and the presence of unusually massive SMBHs, such that the spiral structures are not destroyed. Only one of our sources (J1649+2635) is found in a cluster environment, indicating that processes other than accretion through cooling flows galaxy-galaxy mergers or interactions could be plausible scenarios for triggering radio-loud AGN activity in spiral galaxies.
keywords:
galaxies: active - galaxies: spiral - galaxies: radio - radio continuum: galaxies - galaxies: jets1 Introduction
Radio galaxies in the local Universe are found to be exclusively hosted in massive, gas poor elliptical galaxies characterised by feeble star formation rates (Urry & Padovani 1995; Wilson & Colbert 1995; McLure et al. 2004; Best et al. 2005). It is believed that the relativistic jets emanating from the accreting Super Massive Black Holes (SMBH) at their centres can easily plough through the rarer interstellar medium (ISM) of elliptical galaxies and reach scales of 100–1000 kpc. In contrast, the denser ISM present in spiral galaxies impedes jets and confines them to within the host galaxy as often seen in Seyfert galaxies (Gallimore et al. 2006; Schawinski et al. 2011). Arguably, the nature of the host galaxy ISM is one of the key parameters responsible for the form of the AGN jets that come out of the galaxy (Capetti & Balmaverde 2006). Moreover, other factors such as the mass and spin of the SMBH are also believed to play a crucial role in the formation of larger jets in radio galaxies (Laor 2000; Liu et al. 2006; Chiaberge & Marconi 2011).
It has been shown that active galactic nuclei (AGN) release vast amounts of energy into the ISM via feedback processes that cause an increase in the temperature of the ISM gas, expel it via outflows, and quench star formation (see Fabian 2012). AGN feedback can be either via AGN radiation (‘quasar mode’), or through the interaction of the jet with the ISM (known as kinetic or ‘radio mode’). Radio galaxies with extremely large and fast jets are able to inject enormous amounts of energy into the ISM and even into the intergalactic medium (IGM; McNamara & Nulsen (2007)). In general, the star formation efficiency of radio galaxies in the local Universe is found to be 10–50 times less than that in normal galaxies, and this fact can be reconciled via AGN feedback (Nesvadba et al. 2010). However, it has also been shown that not all radio galaxies have low star formation efficiency, and so the impact of feedback on a galaxy may evolve ( Labiano et al. 2013, 2014). Therefore, the study of radio galaxies hosted in spiral, disk-dominated galaxies with high star formation efficiency is key to understanding how AGN feedback affects the properties of their hosts. In fact, such studies are important for an overall understanding of galaxy evolution, as AGN feedback is believed to be responsible for several observed phenomena the correlation between black hole and host galaxy bulge mass (Magorrian et al. 1998; Tremaine et al. 2002), and the fast transition of early-type galaxies from the blue cloud to the red sequence (Schawinski et al. 2007; Kaviraj et al. 2011).
Furthermore, despite the presence of vast numbers of radio and optical observations,
powerful radio galaxies hosted in spiral disk-dominated galaxies are extremely rare.
Hitherto, only a handful of such sources have been found
0313-192 (Ledlow
et al. 1998); Speca (Hota et al. 2011); J2345-0449 (Bagchi
et al. 2014) and J1649+2635 (Mao et al. 2015).
In this paper we present a sample of four radio galaxies hosted in spiral galaxies.
These galaxies are discovered by cross-matching a large sample of 187005 spiral galaxies derived
from Sloan Digital Sky Survey (SDSS111http://www.sdss.org/; Abazajian et al. (2009))
Data Release 7 (DR7) with the full Faint Images of the Radio Sky at Twenty-cm (FIRST222http://sundog.stsci.edu/; Becker
et al. (1995)) and
the NRAO VLA Sky Survey (NVSS333http://www.cv.nrao.edu/nvss/; Condon et al. (1998)) radio data.
Our study is the first systematic attempt to search for spiral-host double-lobe radio galaxies using large area optical and radio surveys.
This paper is structured as follows.
In Section 2, we describe the data used to search for spiral-host double-lobe radio galaxies.
Our search strategy is discussed in Section 3.
In Section 4, we describe the methods used to estimate various properties (star formation rates, black holes masses, large-scale
environments) of the host galaxies. The properties of individual sources are discussed in Section 5. We discuss our findings in
Section 6 and present our conclusions in Section 7. In this paper we assume a cosmology with
km s-1 Mpc-1, , and .
2 Data
2.1 Optical
We use a sample of 187005 spiral galaxies from the Meert et al. (2015) catalogue that provides morphological classification of galaxies of the SDSS DR7 spectroscopic sample (Abazajian et al. 2009). The galaxy morphology (spiral, elliptical or uncertain) is determined quantitatively by an automated two-dimensional photometric decomposition of the -band surface-brightness using the Pymorph software pipeline (Vikram et al. 2010) and Galfit (Peng et al. 2002). The Meert et al. (2015) catalogue is one of the most recent and extensive works to classify the morphologies of SDSS galaxies. This catalogue has substantial overlap with other galaxy morphology catalogues based on full or partial SDSS data ( Simard et al. 2011; Kelvin et al. 2012; Lackner & Gunn 2012), and the ‘Galaxy Zoo’ citizen scientist based programme (Lintott et al. 2008, 2011). A detailed comparison of these various catalogues is given in Meert et al. (2015).
2.2 Radio
To find the radio counterparts of the spiral galaxies in our sample, we use
the FIRST survey that was carried out at 1.4 GHz with the Very Large Array (VLA) in its ‘B’ configuration, and
covers a sky region over 10,000 square degrees around the North and South Galactic Caps (Becker
et al. 1995).
The FIRST radio maps have a resolution of 5 and a typical noise rms of mJy/beam.
We have used the most recent version of FIRST source catalogue (released in March 2014), that lists peak as well as integrated flux densities
and radio sizes derived by fitting a two-dimensional Gaussian to a source detected at a flux limit of 1 mJy (SNR 5).
The astrometric reference frame of the FIRST maps is accurate to 0.05 and individual sources have 90 confidence
error circles of radius 0.5 at the 3 mJy level and 1.0 at the 1 mJy survey threshold (see Becker
et al. 1995).
The relatively high resolution (smaller synthesized beamsize) FIRST observations can miss extended
low-surface-brightness emission as the flux density per beam falls below the sensitivity limit (it is resolved out), and so
we use NVSS radio data to detect fainter, extended diffuse emission from the lobes of radio galaxies.
NVSS is a 1.4 GHz continuum survey carried out by the VLA in its ‘D’ configuration.
It covers the entire sky north of declination and provides radio
images with resolution and sensitivity mJy at the 5 level (Condon et al. 1998).
We use the NVSS catalogue which contains over 1.8 million unique detections brighter than 2.5 mJy
and gives total integrated 1.4 GHz flux densities for all the radio sources.
The astrometric accuracy ranges from .0 for the brightest NVSS detections
to about 7.0 for the faintest detections.
Some studies on the search for radio counterparts of spiral galaxies
used the Unified Radio Catalogue (Kimball &
Ivezić 2008), which contains data from
both the FIRST and NVSS surveys, and also lists sources detected in the Green
Bank 6 cm survey (GB6) and the 92 cm Westerbork Northern Sky Survey (WENSS).
We caution that the unified radio catalogue is a mere
compilation of the closest NVSS sources to a FIRST source within a circle
of 30 radius and vice-versa for a NVSS source. Users are
advised to opt for their own criteria to use true counterparts
(see Kimball &
Ivezić 2008). Given these limitations, we choose
to use the FIRST and NVSS catalogues to find radio counterparts of SDSS spiral galaxies.
3 Search strategy
To search for double-lobe radio galaxies associated with SDSS DR 7 spiral galaxies we make optimal use of both FIRST and NVSS
in a multi-stage process.
Both FIRST and NVSS are carried out at 1.4 GHz, but with different resolutions and sensitivities, which make them complementary to each other.
The relatively high resolution ( beam) and sensitive (5 rms mJy/beam) FIRST observations
can efficiently detect faint, kpc-scale radio structures that may remain unresolved or undetected in the NVSS.
On the other hand, NVSS observations of relatively low resolution ( beam, 5 rms mJy/beam) can
efficiently detect diffuse, low-surface-brightness, extended radio emission
from hundreds-of-kpc-scale large radio lobes that may get resolved out in FIRST.
Our multi-stage search process involves the following steps.
(i)Using only FIRST data :
In general, radio galaxy morphology consists of a central AGN core emission component and a pair of bipolar jets terminating in lobes.
For the purpose of cross-matching radio sources to their optical counterparts, we refer to the unresolved central radio-emitting component
as ‘the core’, although it may contain emission from parts of the jets close to the AGN core.
To find double-lobe radio sources hosted in spiral galaxies,
we first look for sources in which the core component is closely matched to an optical source within
3, and the two radio lobes are clearly detected within a circular region of radius 180″.
Double-lobe radio sources larger than 180″ can be more effectively detected in the NVSS and are searched for in step (ii).
In cross-matching optical and radio sources, the random offset between radio and optical positions is mainly due to positional uncertainties in the FIRST and SDSS sources. The systematic offset between FIRST and SDSS spiral galaxies positions is negligible (RA = (RASDSS - RAFIRST) -0″.087 and DEC = (DECSDSS - DECFIRST) -0″.0006) as compared to the positional uncertainties. The choice of search radius in cross-matching is a trade off between the completeness and contamination, a smaller matching radius reduces the contamination at the expense of completeness. For example, using a search radius of 1″.0 - 2″.0 for matching FIRST and SDSS sources, greatly reduces the contamination, but introduces bias against true radio counterparts mainly at the fainter end, where the astrometric uncertainties are larger (see Lu et al. 2007; McGreer et al. 2009). Also, for extended radio sources the fitted radio centroid position may not correspond directly to the optical position. We choose a search radius of 3.0 owing to the fact that the distribution of the separation between the optical and radio positions in the cross-matched sample of FIRST and SDSS galaxies is approximately Gaussian up to 3.0, and tails off beyond it with an increasing number of contaminants, which is consistent with previous studies (see Wadadekar 2004; de Vries et al. 2006; Singh et al. 2015).
We cross-match 187005 SDSS DR7 spiral galaxies to the FIRST catalogue using a search radius of 3,
and this simple one-to-one cross-matching yields a total of 5030 sources.
To find double-lobe radio sources among these 5030 galaxies, we search for the presence of multicomponent radio sources in
a circle of radius 180, centred at the optical position.
We find that there are a total of 953 sources with two or more extended radio components within this matching radius.
Visual inspection of all 953 sources using 6 6 FIRST image cutouts shows
that in the majority of cases, the extended components are completely unrelated to the central component, and
in several cases, the central component matching with the spiral galaxy is found to be a radio lobe of an offset radio galaxy.
We excluded all such cases.
Since our objective is to search for sources with distinct double-lobe radio morphology, we also
excluded sources in which FIRST radio morphology appears somewhat extended with no apparent
double-lobe radio structure and radio size resides within the optical size of the host galaxy
(possible cases of Seyfert galaxies or compact radio sources).
Using FIRST data we finally obtain a total of four sources (J1008+5026, J1159+5820, J1450-0106 and J1649+2635) exhibiting
distinct double-lobes and a central core component associated with a spiral galaxy.
(ii) Using NVSS and FIRST data :
In order to detect radio galaxies with hundreds-of-kpc to Mpc-scale jet-lobe structures,
we search for the presence of extended radio components detected in the NVSS in a circle of radius 600, centred
at the optical positions of 5030 galaxies that possess a central radio core component
detected in the FIRST.
There are a total of 498 sources having one or more extended () components with high
signal-to-noise ratio (S/N 10).
We visually inspected all these 498 sources using 30 30 NVSS image cut-outs and
found that in the majority of cases, the extended radio components are completely unrelated to the central
component.
In several cases, the NVSS radio source appears extended due to closely placed more than one unrelated radio
sources that are clearly seen in the corresponding FIRST images.
We finally find only four sources (J0836+0532, J1159+5820, J1352+3126 and J1649+2635) exhibiting
double-lobe radio morphology.
Two (J1159+5820 and J1649+2635) of these four sources were already found using only FIRST data in step (i).
However, NVSS shows an additional pair of lobes in J1159+5820 that are completely undetected in FIRST
due to the inherent limited sensitivity of FIRST to detect low surface brightness extended structures.
We note that the redshift distribution of the 5030 spiral galaxies has median with and sources at 0.032 and 0.02 respectively. The search radius of 600′′ corresponds to 807 kpc, 386 kpc and 245 kpc at , and , respectively. This implies that our search radius of 600′′ will pick up emitting components separated by up to 490 kpc and 772 kpc in and of sources, respectively. Therefore, even at low-redshifts, our search radius will effectively pick up giant radio galaxies in which the centroids of emitting components are separated by a few hundreds of kpc, and where the total end-to-end linear projected size is Mpc (Schoenmakers et al. 2001; Saripalli et al. 2005). We also note that our search radius is larger than that used in previous studies (450′′; Best et al. (2005)) to search for radio galaxies associated with SDSS galaxies.
Our multistage search process involving step (i) and (ii) yields a total of six double-lobe radio galaxies associated with spiral galaxies. One of these six sources J1649+2635 has already been reported by Mao et al. (2015). To further check the spiral nature of the host galaxies, we use the ‘Galaxy Zoo’ catalogue and consider only galaxies with a probability of being spiral 0.8. We note that two of our six sources J1008+5026 (P), J1450-0106 (P), appear to be bulge-dominated spheroidals with low probability of being them spiral. These sources are classified as spirals in the Meert et al. (2015) catalogue mainly due to the presence of a weak exponential component which permits a statistically better fit to the optical surface-brightness profile. Therefore, we do not consider these two galaxies as confirmed spirals and exclude them from further study. Thus, our final sample of double-lobe radio galaxies hosted in spiral galaxies consists of four sources J0836+0532, J1159+5820, J1352+3126 and J1649+2635 (see Table 1 and Figure 1).
We note that our search for spiral-host radio galaxies is not complete, as we miss core-less double-lobe sources that are either lobe-dominated or relic radio galaxies with a weak (or absent) undetected core component. An attempt to search for core-less double-lobe radio sources around optical sources gives random matches without confirmed positional coincidence. We also miss those radio galaxies in which lobes are resolved out in FIRST and whole source remain unresolved in the NVSS (total end-to-end projected size is less than the NVSS beam-size 45). Furthermore, our sample of spiral galaxies is based on the morphological classification given in Meert et al. (2015) and therefore, we miss those spirals that are not listed in this catalogue. For example, J1409-0302 (Speca; Hota et al. (2011)) is reported as a spiral-hosted radio galaxy but it has been assigned ‘uncertain’ morphology in the Meert et al. (2015) catalogue. We also note that, 0313-192 (Ledlow et al. 1998) as well as J2345-0449 (Bagchi et al. 2014) are not included in Meert et al. (2015) since they fall outside the SDSS DR7 footprint.
In order to check that our sources are not simple chance matches, we estimate the probability of chance coincidence for a double-lobe radio galaxy from FIRST and NVSS to match with a spiral galaxy within a search radius of 3 centred at the optical position. Surface source densities in the FIRST and NVSS are 90 deg-2 (White et al. 1997) and 50 deg-2 (Condon et al. 1998), respectively. We assume that 70 of FIRST detected radio sources at the faintest level are AGN, and only 10 of these are radioloud (Ivezic et al. 2002). Although, at higher flux densities, the fraction of AGN increases and the source density decreases. Furthermore, nearly two-thirds ( 67) of all the radio-loud AGN can be recognized as double-lobe radio galaxies owing to the projection effect (in general FR-I, FR-II radio galaxies have typical viewing angle of jet 30∘ (Ghisellini et al. 1993) and their counterparts seen at smaller viewing angles are likely to be classified as BL Lacs and radio-loud quasars as per the AGN unification model (Urry & Padovani 1995)). Therefore, only 4.7 FIRST detected radio sources with average surface density ( 90 4.7) 4.23 deg-2 are expected to be double-lobe radio galaxies. NVSS will have an even lower double-lobe radio galaxy source density due to its overall lower surface source density. Considering a circle of radius 3 around the optical position, the probability of a double-lobe radio galaxy falling within it by chance is (3.0/3600)2 4.23. And, since there are a total of 187005 spiral galaxies, the cumulative number of chance matches is (3.0/3600)2 4.23 187005 1.7. The total number of six double-lobe radio galaxies showing a FIRST central component within 3 in our sample is higher than the number of chance matches. However, we note that one to two chance matches are not in fact unexpected. We further note that our spiral-host double-lobe radio galaxies are optical AGN (see Table 4 and Figure 6). Therefore, probability of double-lobe radio galaxies positionally matching to optical AGN by chance would be even lower, because only a fraction of spiral galaxies in the Meert catalog are AGN.
4 Properties of host galaxies
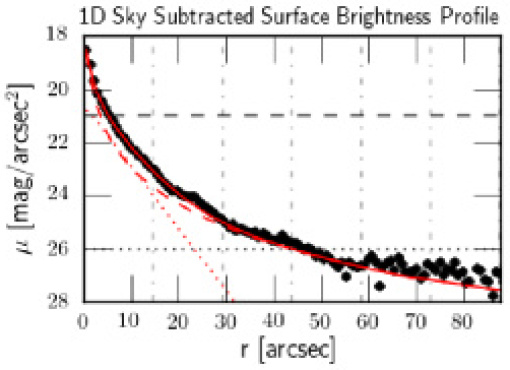
4.1 Optical surface brightness profile
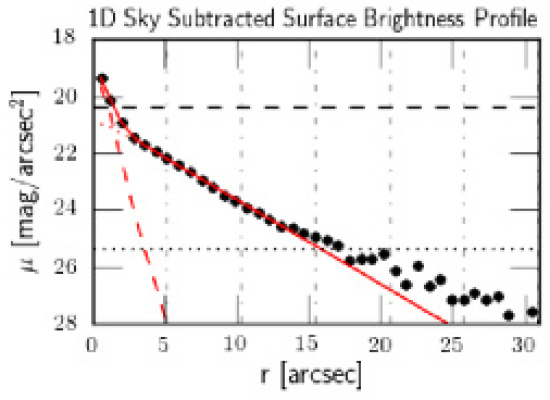
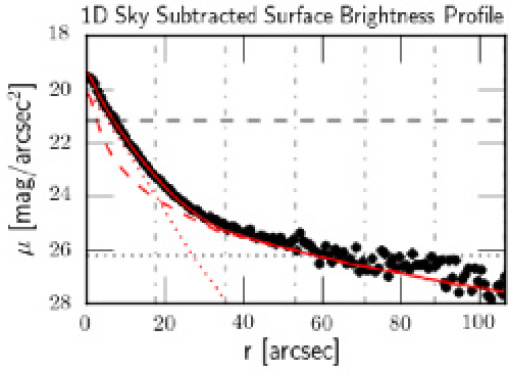
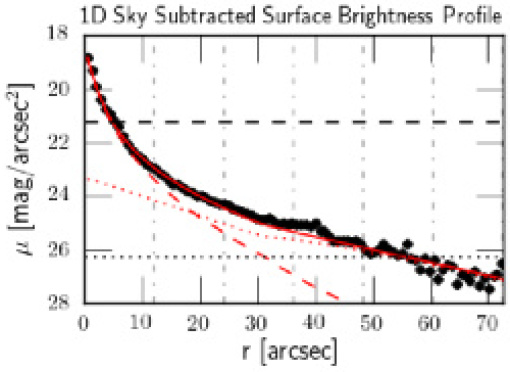
In order to check the morphological parameters of the host galaxies, we use the best fit Sérsic model parameters derived from -band SDSS images, as given in the Meert et al. (2015) catalogue (see Table 1). The optical surface brightness profile of a spiral galaxy having bulge and disk components was fitted with a two-component model, a Sérsic model for the central bulge component, and a disk component fitted with an exponential law defined as , where is the scale radius, and is the central surface brightness. The Sérsic model is defined as (Sérsic 1963); where = 1.9992 - 0.3271 and is valid for (using the approximation from Capaccioli & Caon (1989)). For , the Sérsic model reduces to the de Vacouleurs model (de Vaucouleurs 1948). The parameters that define the Sérsic profile are Sérsic index (), half-light radius (), and surface brightness () at . The SDSS r-band optical surface brightness profiles of our sample sources (see Figure 2 to 5), best fitted with the Sérsic model plus an exponential disk component, are taken from Meert et al. (2015)444http://shalaowai.physics.upenn.edu/ameert/fit_catalog/view_galaxies/.
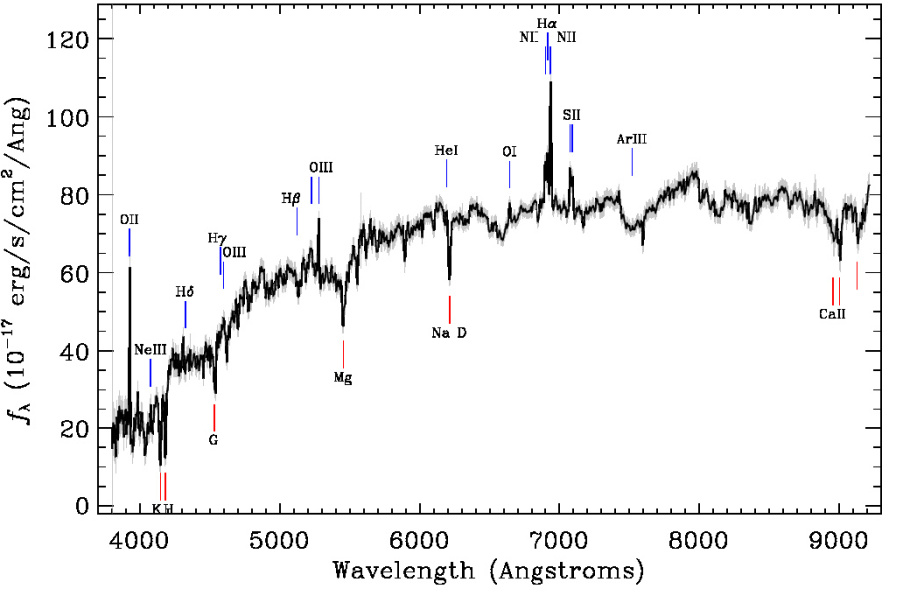
4.2 Optical spectral properties
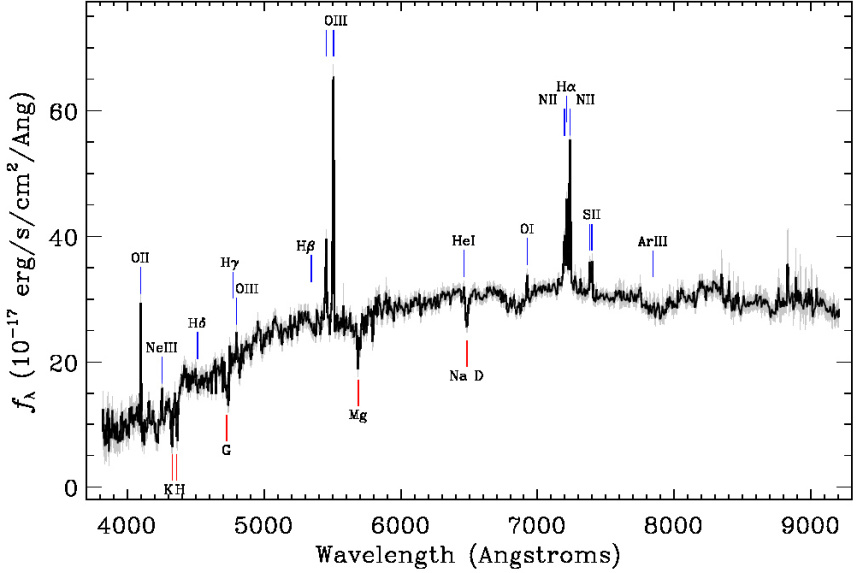
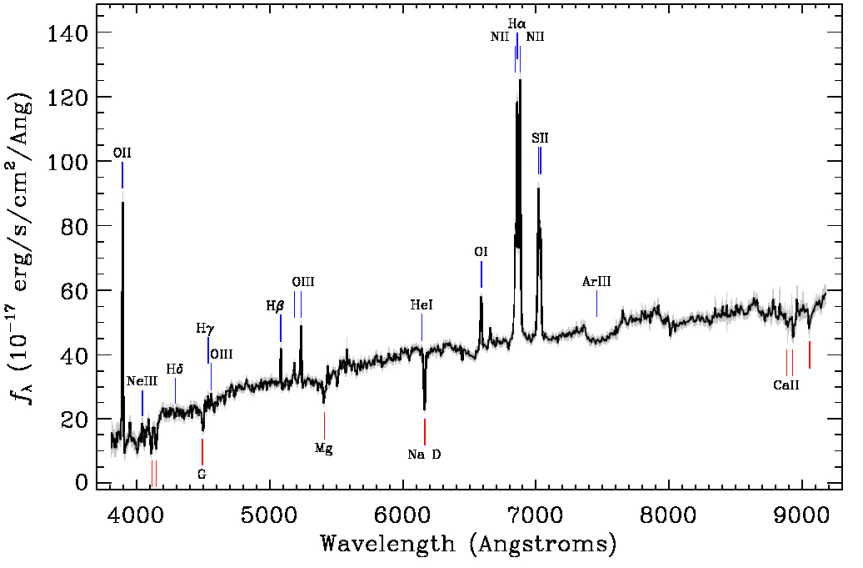
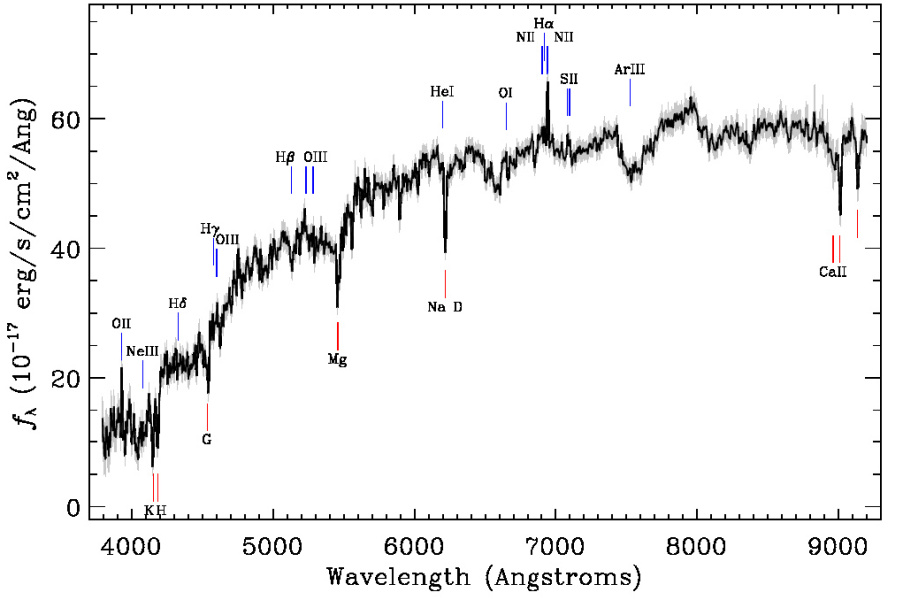
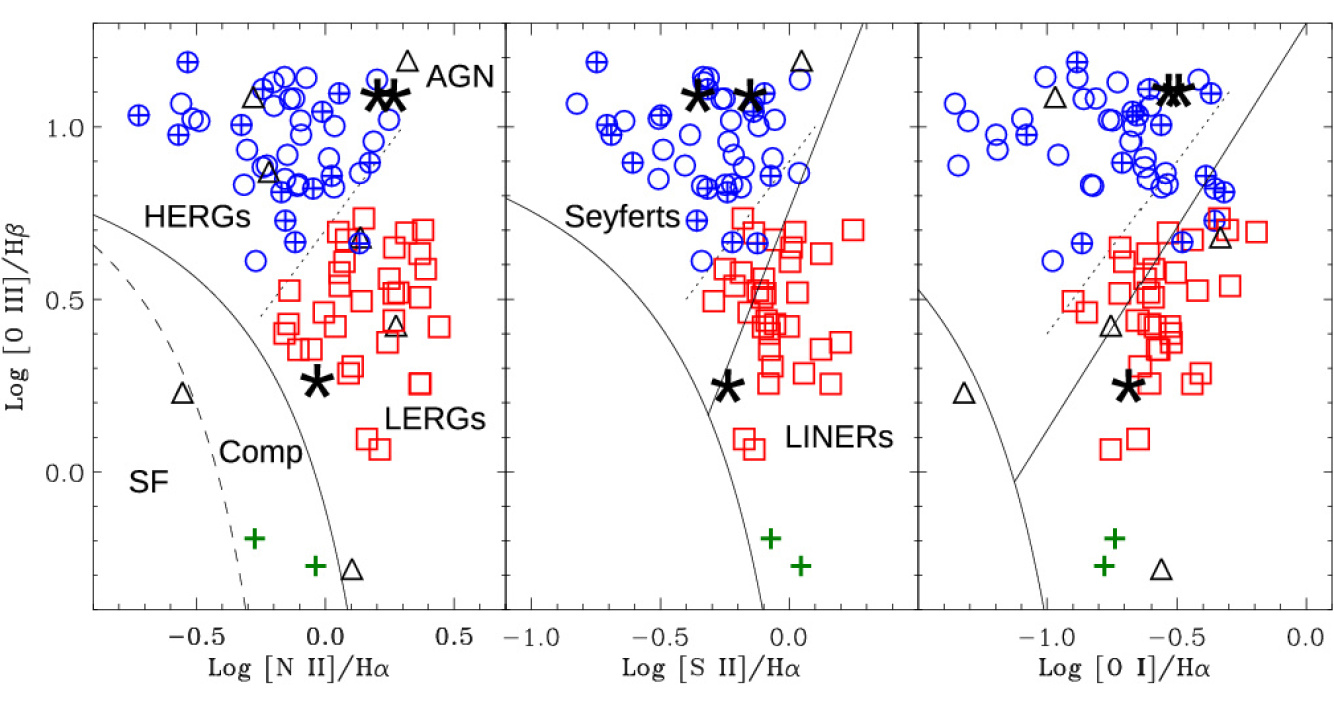
Optical spectral properties can be used to reveal the nature of the host galaxy. We examine the SDSS spectra of our sample sources. These are extracted from fibers of 3 diameter positioned at the centres of galaxies, and are therefore dominated by the light from the central region of galaxies. All our sample sources are at and thus capture of the galaxy light (see Kewley et al. 2005). Thus, SDSS spectra sample the light from the nucleus (AGN) as well as from the central part of the galaxy. Spiral galaxies are expected to show strong blue continuum due to the presence of young stellar populations. We also use emission line ratio diagnostics proposed by Kewley et al. (2006) to identify if any emission lines present are due to star formation or AGN. Table 4 lists the emission line ratios ([O III]/Hβ, [N II]/Hα, [S II]/Hα and [O I]/Hα) and the spectral classification based on the emission line diagnostics (Baldwin et al. 1981; Kewley et al. 2006)). The SDSS optical spectra of our sample sources, presented in figure 2 to 5, are taken from the SDSS website555http://www.sdss.org/dr12/spectro/.
4.3 Star formation rate
Star Formation Rate (SFR) is one of the characteristic properties of galaxies. We estimate SFRs for our sample sources using mid-IR and UV continuum, whenever available. It has been shown that the monochromatic mid-IR luminosity is tightly correlated with total IR luminosity and can be used to estimate SFR ( Rieke et al. 2009). All of our sample sources are detected in the mid-IR by the Wide-field Infrared Survey Explorer (WISE; Wright et al. (2010)), and we use the 22 m (W4 band) luminosity to estimate SFRs. The WISE colours of our sample sources are [3.4] - [4.6] 0.8 (Vega magnitudes), indicating that the mid-IR emission is dominated by star formation and AGN contamination is not significant (see Stern et al. 2012). To obtain mid-IR flux densities from magnitudes, we first converted WISE Vega magnitudes into AB magnitudes using conversion factors (mAB = mVega + m; where m is 2.683, 3.319, 5.242 and 6.604 for W1, W2, W3 and W4 bands, respectively) given in the WISE data release document666http://wise2.ipac.caltech.edu/docs/release/prelim/expsup/sec4_3g.html. We estimate total IR (8 - 1000 m) luminosity (LIR) from the WISE 22 m luminosity using the full range of templates in the libraries of Chary & Elbaz (2001) and Dale & Helou (2002). The total IR luminosities were then converted into SFRs using the Kennicutt (1998) law SFR (M⊙ yr-1) = 4.5 10-44 (ergs s-1). We adopt the median SFR value from the full template set as the SFR of galaxy, and the error bars are upper/lower limits considering the full template set. Table 3 lists the mid-IR WISE magnitudes, colours, IR luminosities and SFRs of our sample sources.
Two of our sample sources are detected both in the Near-UV (NUV; 1750-2750 Å) and Far-UV (FUV; 1350-1750 Å) bands of GALEX (Martin et al. 2005) as the part of All-sky Imaging Survey (AIS). J1649+2635 is detected only in the NUV band. Table 2 lists UV magnitudes for our sample sources. Since UV emission in star forming galaxies is dominated by young massive stars, SFR scales with increasing UV luminosity. We use UV luminosities to estimate SFRs using Kennicutt (1998) equation : SFR (M⊙ yr-1) = 1.4 10-28 (ergs s-1). We use observed UV luminosities to estimate SFRs, and therefore these SFRs are only lower limits. The extinction corrections are problematic, as the spatial distribution of dust causing extinction can be patchy and UV emission may be primarily from regions with less obscuration (Calzetti et al. 1994). We also caution that UV emission may have some contribution from processes such as scattered light from the AGN, in addition to that from star formation ( Tadhunter et al. 2002). In Table 3, we list the SFRs derived from IR and UV observed luminosities. Notably, SFRs derived from UV luminosities for three sources are systematically lower than those from IR luminosities.
4.4 Supermassive black hole mass
The mass of the supermassive black hole is one of the fundamental parameters of an AGN host galaxy system. We estimate black hole masses for our sample sources using the black hole mass–bulge luminosity relation (Kormendy & Richstone 1995; Magorrian et al. 1998). Absolute bulge magnitudes of our sample sources are taken from Simard et al. (2011) who present bulge-disk decomposition for SDSS DR7 galaxies. The absolute bulge magnitudes are converted into luminosities, which are in turn used to estimate black hole masses. We use the empirical black hole mass–bulge luminosity relations given in McConnell & Ma (2013) and Bentz et al. (2009). McConnell & Ma (2013) present scaling relations for black hole mass and host galaxy properties for early and late type galaxies. As a sanity check, we also use the empirical black hole mass–bulge luminosity relation given in Bentz et al. (2009) for a sample of AGN. Bentz et al. (2009) use black hole mass measurements based on reverberation mapping and bulge luminosities from two-dimensional decompositions of Hubble Space Telescope (HST) images. Table 5 lists bulge magnitudes, luminosities and black hole mass estimates for our sample sources. Black hole mass estimates derived from the scaling relations for late type galaxies and AGN are likely to be better estimates for our sample sources as the hosts of our sources are spirals with AGN.
4.5 Environment
It is known that the nature of a galaxy can be influenced by the large scale surrounding environment. To check if our sample sources are residing in groups or clusters of galaxies, we look at the distribution of galaxies around our sample sources. Noting that the typical velocity dispersion in a cluster of galaxies is 1000 km s-1 (Becker et al. 2007), we consider galaxies only within a redshift range of cz = 1000 km s-1 (z = 0.0033) w.r.t. the redshift (z) of our sample galaxies. We use only galaxies and QSOs with redshifts given in the SDSS DR10 spectroscopic catalogue. The SDSS catalogue includes photometric redshift estimates for more galaxies, including fainter ones, but the redshift errors are much larger than cz = 1000 km s-1, and this makes them unsuitable for our analysis. Clusters and groups of galaxies typically have sizes up to few Mpc, but since we do not know the position of our source w.r.t. any parent cluster, we investigate the distribution of galaxies in a large circular region of radius varying from 0.5 Mpc to 4.0 Mpc. Galaxy groups typically contain a few galaxies to a few tens of galaxies in a diameter as large as 1.0 to 2.0 Mpc, while systems with more galaxies are defined as clusters (Lin et al. 2004; Tago et al. 2008). Although, we caution that there is no sharp dividing line between a large group and a small cluster. Table 9 lists the number of galaxies with redshifts zz that fall within the projected circular regions of the radii of 0.5 Mpc, 1.0 Mpc, 2.0 Mpc and 4.0 Mpc centred at our sample galaxies. Furthermore, we also use the Tempel et al. (2014) catalogue of groups and clusters to examine the association of our sample sources with over-densities. Using SDSS DR10 data Tempel et al. (2014) identified galaxy groups and clusters based on a modified friends-of-friends method and present a flux (mr = 17.77) and volume limited catalogue. Tempel et al. (2014) considered galaxy group as a system of 3 galaxies where galaxies are linked into the system using a linking length ( 0.25 Mpc/h in the projected distance at z = 0) that varies with the distance. The group finding algorithm is explained in (Tago et al. 2008, 2010). We list estimated positions, sizes, masses and densities of the groups associated with our sample galaxies in Table 9. The presence of a cluster can also be found by the detection of extended X-ray emitting hot intracluster gas. Therefore, we checked archival RoSAT All Sky Survey (RASS; Voges et al. (1999); Voges et al. (2000)) to examine the presence of soft X-ray (0.1 - 2.4 keV) emission around our sample sources. We find that none of our sample sources are detected in the RASS.
| Source | RA | Dec | Redshift | Best fit | /dof | Sérsic | rbulge | rdisk | B/T | b/a | Pspiral |
|---|---|---|---|---|---|---|---|---|---|---|---|
| name | (h m s) | (d m s) | model | index (n) | (″) | (″) | |||||
| J0836+0532 | 08 36 55.9 | +05 32 42.0 | 0.099 | Ser + Exp | 1.03 | 0.830.06 | 0.640.01 | 3.820.04 | 0.15 | 0.91 | 0.95 |
| J1159+5820 | 11 59 05.8 | +58 20 35.5 | 0.054 | Ser + Exp | 1.07 | 7.690.20 | 29.422.06 | 5.070.03 | 0.75 | 0.75 | 0.81 |
| J1352+3126 | 13 52 17.8 | +31 26 46.3 | 0.045 | Ser + Exp | 1.18 | 5.830.27 | 51.346.22 | 7.780.02 | 0.61 | 0.60 | 0.86 |
| J1649+2635 | 16 49 23.9 | +26 35 02.7 | 0.055 | Ser + Exp | 1.16 | 2.810.03 | 7.570.12 | 20.820.76 | 0.63 | 0.71 | 0.97 |
Note - Best fit model parameters are based on Meert et al. (2015) catalogue. Ser : Sérsic model; Exp : Exponential model. rbulge is the bulge radius, rdisk is the disk radius, B/T is the bulge-to-total light ratio from fit, b/a is the axis ratio (semi-minor/semi-major) of the total fit, Pspiral is the debiased probability for host galaxy to be a spiral according to the Galaxy Zoo catalogue.
| Survey | GALEX | SDSS | ||||||
|---|---|---|---|---|---|---|---|---|
| Band | FUV | NUV | u | g | r | i | z | u - r |
| Source | ||||||||
| J0836+0532 | 18.1870.034 | 16.4320.004 | 15.5450.004 | 15.1090.004 | 14.7560.010 | 2.64 | ||
| J1159+5820 | 19.730.17 | 18.760.04 | 16.6700.015 | 14.7750.002 | 13.9820.002 | 13.5530.002 | 13.2200.003 | 2.69 |
| J1352+3126 | 20.490.27 | 18.650.05 | 16.8570.017 | 15.0560.003 | 14.1250.002 | 13.6150.002 | 13.2610.004 | 2.74 |
| J1649+2635 | 20.630.15 | 17.6530.027 | 15.4960.003 | 14.4780.002 | 13.9730.002 | 13.5810.004 | 3.17 | |
Note - GALEX magnitudes are from All-sky Imaging Survey (AIS)777http://galex.stsci.edu/GalexView/. SDSS magnitudes are model based. Strateva et al. (2001) proposed that optical colour (u - r) can effectively separate red (u - r 2.22) and blue galaxies (u - r 2.22) in the SDSS data.
| Source | W1 | W2 | W3 | W4 | W1 - W2 | LIR | SFRIR | SFRUV |
|---|---|---|---|---|---|---|---|---|
| name | (3.4 m) | (4.6 m) | (12 m) | (22 m) | (L⊙) | (M⊙ yr-1) | (M⊙ yr-1) | |
| J0836+0532 | 12.87 | 12.42 | 9.61 | 7.49 | 0.45 | 5.80 1010 | 9.99 | |
| J1159+5820 | 11.82 | 11.75 | 9.38 | 7.38 | 0.07 | 1.68 1010 | 2.89 | 1.50 |
| J1352+3126 | 11.33 | 10.79 | 8.12 | 5.96 | 0.54 | 4.31 1010 | 7.41 | 0.97 |
| J1649+2635 | 11.79 | 11.80 | 9.69 | 8.01 | -0.01 | 9.68 109 | 1.67 | 0.20 |
| Source | Hβ | [O III] | [O I] | Hα | [N II] | [S II] | log([O III]/Hβ) | log([N II]/Hα) | log([S II]/Hα) | log([O I]/Hα) | BPT |
|---|---|---|---|---|---|---|---|---|---|---|---|
| name | 4863 Å | 5007 Å | 6300 Å | 6563 Å | 6584 Å | 6717 Å | class | ||||
| J0836+0532 | 26.66 | 329.77 | 45.89 | 163.32 | 250.56 | 65.44 | 1.09 | 0.19 | -0.39 | -0.55 | Seyfert / HERG |
| J1159+5820 | 13.69 | 167.01 | 70.17 | 234.67 | 396.72 | 157.46 | 1.09 | 0.23 | -0.17 | -0.52 | Seyfert / HERG |
| J1352+3126 | 95.25 | 178.13 | 202.62 | 982.84 | 1022.29 | 622.74 | 0.27 | 0.02 | -0.20 | -0.69 | LINER / LERG |
| J1649+2635 | 50.84 | 38.51 | 128.94 | 145.25 | 56.00 | 0.05 | -0.36 | -0.52 |
Note - Fluxes are in units of 10-17 erg cm-2 s-1. Classification is based emission line ratio diagnostics (famously known as ‘BPT’ diagnostics) proposed by Baldwin et al. (1981) (see Kewley et al. 2006). Radio galaxies can also have emission line ratios similar to low luminosity AGN (Seyfert and LINER galaxies), but High Excitation Radio Galaxies (HERGs) and Low Excitation Radio Galaxies (LERGs) occupy different regions in the BPT diagrams (Buttiglione et al. 2010).
| Source | Magg_bulge | Magr_bulge | Magv_bulge | Lv_bulge | M (M⊙) | M (M⊙) | M (M⊙) |
|---|---|---|---|---|---|---|---|
| name | (L⊙) | = 9.23, = 1.11 | = 9.10, = 0.98 | = 7.98, = 0.80 | |||
| J0836+0532 | -20.980.03 | -21.950.02 | -21.550.02 | 3.630.07 1010 | 5.51.7 108 | 4.72.7 108 | 2.71.0 108 |
| J1159+5820 | -20.960.01 | -22.020.01 | -21.580.01 | 3.730.03 1010 | 5.71.3 108 | 4.82.7 108 | 2.81.0 108 |
| J1352+3126 | -19.663.26 | -21.130.18 | -20.521.37 | 1.411.78 1010 | 1.90.4 108 | 1.91.1 108 | 1.70.5 108 |
| J1649+2635 | -20.470.01 | -21.430.01 | -21.040.01 | 2.270.02 1010 | 3.30.7 108 | 2.91.7 108 | 1.80.7 108 |
Note - g-band and r-band bulge magnitudes (Magg_bulge and Magr_bulge) are taken from Simard et al. (2011) catalogue, where bulge is fitted with Sérsic model with Sérsic index (n) as a free parameter. V-band bulge magnitude is estimated from g-band and r-band magnitudes using Jester et al. (2005) magnitude conversion equation (V = g - 0.58*(g-r) - 0.01). Black hole masses (MSMBH) are estimated using black hole mass - bulge luminosity relation (log = + log; where = 9.230.10, = 1.110.13 for early type galaxies and = 9.100.23, = 0.980.20 for late type galaxies with Lv_bulge 1010.8) given in McConnell & Ma (2013) and (log = + log; = 7.980.06, = 0.800.09 derived for AGN) given in Bentz et al. (2009). a : using McConnell & Ma (2013) relation for early type galaxies; b : using McConnell & Ma (2013) relation for late type galaxies; and c : using Bentz et al. (2009) relation for AGN.
| Survey | GB61 | FIRST | NVSS | B22 | VLSS2 |
|---|---|---|---|---|---|
| Band | 4.85 GHz | 1.4 GHz | 1.4 GHz | 408 MHz | 74 MHz |
| (mJy) | (mJy) | (mJy) | (mJy) | (mJy) | |
| Source | |||||
| J0836+0532 | 23.810.36 | 62.42.3 | |||
| J1159+5820 | 257.038.6 | 8.610.56 | 338.17.5 | ||
| J1352+3126 | 1940.0291 | 4119.975.73 | 4844.2145.8 | 10460850 | |
| J1649+2635 | 6310 | 101.970.84 | 155.45.4 | 3317 | 610100 |
| Source | RA | Dec | Redshift | scale | size | L | FR | Environment | Reference |
|---|---|---|---|---|---|---|---|---|---|
| name | (kpc/) | (kpc) | (W Hz-1) | type | |||||
| J0836+0532 | 08 36 55.9 | +05 32 42.0 | 0.099 | 1.756 | 420 | 1.53 1024 | FR-II | Field | 1 |
| J1159+5820 | 11 59 05.8 | +58 20 35.5 | 0.054 | 1.037 | 392 | 2.26 1024 | FR-II | Field | 1 |
| J1352+3126 | 13 52 17.8 | +31 26 46.3 | 0.045 | 0.877 | 335 | 2.26 1025 | FR-II | Field | 1 |
| J1649+2635 | 16 49 23.9 | +26 35 02.7 | 0.055 | 1.046 | 86 | 1.07 1024 | FR-II | group/BCG | 1, 4 |
| J0315-1906 (0313-192) | 03 15 52.1 | -19 06 44.0 | 0.067 | 1.268 | 200 | 1.0 1024 | FR-I | Abell 428 | 2 |
| J1409-0302 (Speca) | 14 09 48.8 | -03 02 32.5 | 0.138 | 2.411 | 1000 | 7.0 1024 | FR-II | BCG | 3 |
| J2345-0449 | 23 45 32.7 | -04 49 25.3 | 0.076 | 1.423 | 1600 | 2.5 1024 | FR-II | Field/CL outskirt | 5 |
Note : Sizes are end-to-end linear projected distances in FIRST or NVSS images whichever show clear double-lobe radio morphology. Total 1.4 GHz radio luminosities are from NVSS as extended emission is often missed in FIRST.
| FIRST | NVSS | ||||||||||||
| Sp | Sint | Major | Minor | PA | Roff | Morphology | Sint | Major | Minor | PA | Roff | Morphology | |
| (mJy/b) | (mJy) | (″) | (″) | (deg) | (″) | (mJy) | (″) | (″) | (deg) | (″) | |||
| J0836+0532 | C + 2L | C +2L | |||||||||||
| Core | 9.32 | 16.45 | 7.55 | 1.26 | 97.2 | 1.1 | 23.2 | 26.0 | 24.6 | 73.5 | 1.04 | ||
| lobe 1 (SW) | 2.19 | 7.36 | 11.15 | 5.78 | 13.3 | 80.2 | 25.4 | 35.2 | 27.0 | -19.2 | 74.5 | ||
| lobe 2 (NE) | 13.8 | 34.3 | 37.0 | -52.1 | 80.7 | ||||||||
| J1159+5820 | C + 2L | C + 2L | |||||||||||
| Core | 2.06 | 2.11 | 2.21 | 0.00 | 113.6 | 1.1 | |||||||
| lobe 1 (new) | 1.95 | 2.14 | 3.56 | 0.00 | 120.2 | 10.0 | |||||||
| lobe 2 (new) | 2.92 | 4.36 | 4.77 | 2.76 | 42.1 | 12.5 | |||||||
| lobe 1 (old)C1 | 145.4 | 122.0 | 57.4 | -11.9 | 118 | ||||||||
| lobe 1 (old)C2 | 10.6 | 87.0 | 29.8 | -42.0 | 115 | ||||||||
| lobe 1 (old)C3 | 66.3 | 127.1 | 16.7 | 78.1 | 62.6 | ||||||||
| lobe 2 (old)C1 | 36.0 | 126.4 | 65.0 | -31.4 | 159 | ||||||||
| lobe 2 (old)C2 | 76.1 | 112.6 | 29.3 | 80.9 | 116 | ||||||||
| lobe 2 (old)C3 | 3.7 | 43.6 | 41.6 | 35.8 | |||||||||
| J1352+5348 | C + 2L | C + 2L | |||||||||||
| Core | 3334.28 | 3709.13 | 2.50 | 0.75 | 100.3 | 0.6 | 4085.4 | 14.8 | 17.9 | -15.5 | 0.44 | ||
| lobe 1 (NW) | 33.31 | 393.3 | 14.58 | 5.28 | 14.6 | 85.0 | 629.1 | 42.9 | 20.8 | -30.6 | 76.5 | ||
| lobe 2 (SE) | 6.74 | 17.54 | 6.95 | 0.00 | 148.4 | 97.5 | 129.7 | 83.2 | 30.7 | -23.3 | 107 | ||
| J1649+2635 | C + 2L | PS | |||||||||||
| Core | 6.34 | 8.59 | 4.64 | 1.29 | 47.1 | 1.4 | 155.4 | 69.7 | 17.1 | 55.6 | 5.99 | ||
| lobe 1 (SW) | 4.46 | 42.76 | 21.14 | 11.63 | 57.1 | 24.0 | |||||||
| lobe 2 (NE) | 5.15 | 50.62 | 19.46 | 13.13 | 45.0 | 29.5 | |||||||
Note - FIRST flux densities of lobes of J1352+5348 is sum of several small components. ‘C’ : core, ‘L’: lobe, PS : point source. Sizes are deconvolved from synthesized beam.
| galaxy group parameters | |||||||||||||
| Source | redshift | redshift | Ngal | dist | RA | DEC | zcmb | Ngal | Rvir | Rmax | MNFW | MHer | Density |
| name | (z) | range | 0.5, 1.0, 2.0, 4.0 Mpc | (kpc) | (deg) | (deg) | (Mpc) | (Mpc) | (1012 M⊙) | (1012 M⊙) | (1Mpc/h) | ||
| (1) | (2) | (3) | (4) | (5) | (6) | (7) | (8) | (9) | (10) | (11) | (12) | (13) | (14) |
| J0836+0532 | 0.0994 | 0.0961 - 0.1027 | 2, 4, 4, 7 | 77.6 | 129.22136 | +05.54070 | 0.09978 | 3 | 0.3335 | 0.3228 | 30.5 | 50.8 | 153.328 |
| J1159+5820 | 0.0537 | 0.0504 - 0.0570 | 1, 2, 7, 13 | ||||||||||
| J1352+3126 | 0.0452 | 0.0419 - 0.0485 | 3, 3, 11, 38 | 129.1 | 208.11753 | +31.46362 | 0.04556 | 3 | 0.1470 | 0.1511 | 1.55 | 2.51 | 74.321 |
| J1649+2635 | 0.0545 | 0.0512 - 0.0578 | 9, 21, 38, 64 | 229.4 | 252.35435 | +26.64486 | 0.05448 | 19 | 0.2878 | 0.6936 | 51.5 | 86.2 | 197.75 |
Note - Column 1: Source name; column 2: redshift; column 3: redshift range spanning z = 0.0033 covering 1000 km s-1 velocity dispersion centred at the redshift of radio galaxy host; column 4: Number of galaxies (Ngal) with redshift zz lying in concentric circular regions of radii 0.5 Mpc, 1.0 Mpc; 2.0 Mpc and 4.0 Mpc centred at the position of radio galaxy host; column 5: distance of the centre of group from host of radio galaxy; column 6 and 7: RA, DEC of the centre of the group; column 8: CMB-corrected redshift of the group; column 9: Number of galaxies within the group; column 10: Virial radius of the group (Rvir); column 11: Maximum radius of the group (Rmax); column 12: Mass of the galaxy group using NFW profile (MNFW); column 13: Mass of the galaxy group using Hernquist profile (MHer); column 14: Normalized environmental density (mean of group galaxy densities) of the group for smoothing scale of 1 Mpc.
: Source has not been associated to any group in Tempel et al. (2014) catalogue.
5 Notes on individual sources
In this section we discuss the properties of individual spiral-host double-lobe radio galaxies.
5.1 J0836+0532
This spiral-host double-lobe radio galaxy is reported for the first time. Below we describe the optical and radio properties of this source.
5.1.1 Host galaxy
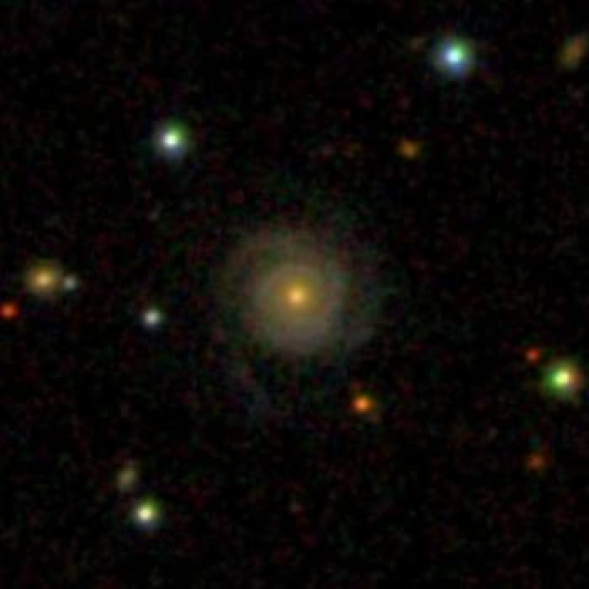
J0836+0532 is a face-on spiral galaxy with two distinct spiral arms seen in the SDSS image (see Figure 1). The Galaxy Zoo catalogue classifies it a spiral galaxy with 95 probability. The surface brightness profile of the -band SDSS image is best fitted with a combination of Sérsic and exponential components. The best fitted parameters bulge-to-total ratio (B/T) 0.15, bulge radius ( 0.640.06), disk radius ( 3.820.04) and Sérsic index (n 0.830.06) suggest it to be a disk dominated galaxy (see Table 1). The apparent projected size of this galaxy is at least 25, which corresponds to 44.0 kpc, therefore indicating it to be a giant spiral galaxy. The optical colour (u - r = 2.64, see Table 2) and spectral continuum (see Figure 2) suggest it to be a red galaxy. Using the criterion ‘(g-r) 0.63 - 0.02(Mr + 20)’ given in Masters et al. (2010), J0836+0532 (g-r = 0.88, Mr = -22.91) can be classified as a red galaxy. Red spiral galaxies have lower SFR than their blue counterparts, but had similar star formation histories until 500 Myr ago (Tojeiro et al. 2013). The mid-IR colour ([3.4] - [4.6] = 0.45) indicates that the mid-IR emission is dominated by star formation rather than AGN. The estimated SFR from 22 m is 9.99 M⊙ yr-1 and so it is an actively star forming galaxy.
The SDSS optical spectrum of the central region (3 in diameter) shows strong permitted (Hβ 4862 Å, Hα 6563 Å) and forbidden ([O II] 3726 Å, [O III] 5007 Å, [N II] 6548 Å, [S II] 6717, 6731 Å) emission lines (see Figure 2). The emission line flux ratio diagnostics indicate it to be a Seyfert or High Excitation Radio Galaxy (HERG) (see Table 4). The black hole mass estimated from the bulge magnitude using the black hole mass–bulge luminosity empirical relations is around 2.7 5.5 108 M⊙. Thus, the black hole mass in this galaxy is similar to those found in powerful radio-loud AGN ( Chiaberge & Marconi 2011). Only large spirals are known to host such massive black holes. The black hole mass in this galaxy is similar to that found in previously reported spiral-host radio galaxies (0313-192 (Keel et al. 2006); J2345-0449 (Bagchi et al. 2014)).
5.1.2 Radio morphology
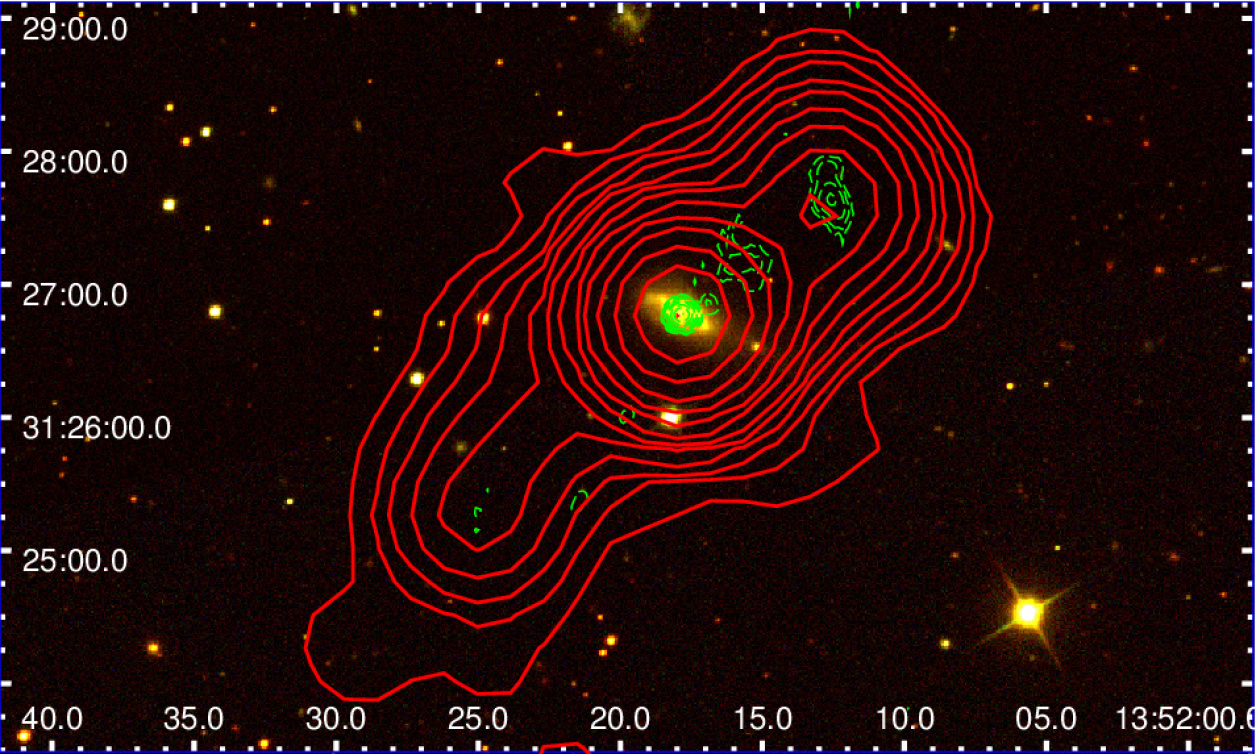
The NVSS image shows a distinct core-lobe morphology with total end-to-end projected linear size of 4′ that corresponds to 420 kpc at the redshift of 0.099. Table 8 lists flux densities, sizes and separations of the different emitting components seen in the FIRST and NVSS images. The FIRST image shows a clear core component but barely detectable extended emission from the lobes. The radio morphology is clearly detectable only in the lower resolution (beam-size 45) NVSS image. In the NVSS image, the peaks of the South-West (SW) and North-East (NE) lobes lie at 74.5 and 80.0, respectively, from the core component. The flux densities of the core, NE and SW lobes are 23.2 mJy, 13.8 mJy and 25.4 mJy, respectively, indicating that the NE lobe is significantly weaker than the SW lobe. The distinct lobes with signs of edge brightening in the NVSS image suggest it to be a FR-II radio galaxy. However, the total 1.4 GHz NVSS luminosity ( 1.53 1024 W Hz-1) lies below the FR-I/FR-II luminosity break. A radio galaxy with large-scale FR-II radio morphology but low radio luminosity can be possible if the radio-lobes are old the source is in the later phase of its lifetime. Evolutionary models of radio galaxies suggest a slow increase in both size and luminosity over most of the source lifetime, followed by a rapid decline in luminosity at the late phase of its lifetime ( Luo & Sadler 2010). The inflated radio morphology of this source further indicates the possibility of being it at the late phase of its evolution, although the presence of bright compact radio core and hotspots implies that the AGN is still active. Multi-frequency radio observations are required to estimate the age and evolutionary stage of this radio source. Optical emission line ratio diagnostics suggest it to be a HERG (see Figure 6). In fact, Best & Heckman (2012) also classify this source as a HERG with ‘high-excitation radio-mode’ accretion. In general, HERGs are believed to possess relatively high accretion rates in radiatively efficient standard accretion discs fuelled by cold gas, possibly brought in through mergers and interactions, and with some of the cold gas leading to associated star formation (see Best & Heckman 2012).
5.1.3 Environment
Using SDSS spectroscopic data we examine the distribution of galaxies around J0836+0532. Considering the typical velocity dispersion in cluster of galaxies to be cz 1000 km s-1 z0.0033, we find that there are only 2, 2, 4 and 7 galaxies in the circular regions of the radii of 0.5, 1.0, 2.0 and 4.0 Mpc centred at J0836+0532 position. Using the Tempel et al. (2014) catalogue, we find that J0836+0532 is associated with a group of 3 galaxies with magnitude limit (mr) 17. The estimated virial radius of the group is 333.5 kpc and the mass is in the range of 3.05 5.08 1013 M⊙.
5.2 J1159+5820
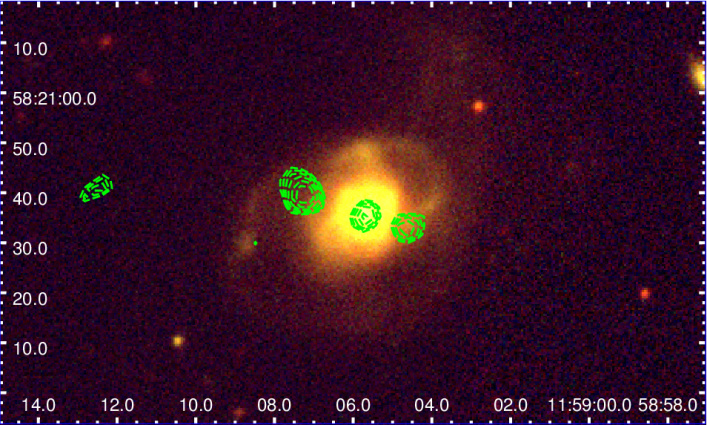
This galaxy located at RA = 11h 59m 05.s8, Dec = +58∘ 20 35.5 with redshift (z) = 0.054, and has been identified as ‘CGCG 292057’ (Stoughton et al. 2002). Kozieł-Wierzbowska et al. (2012) present a detailed optical and radio study of this source.
5.2.1 Host galaxy
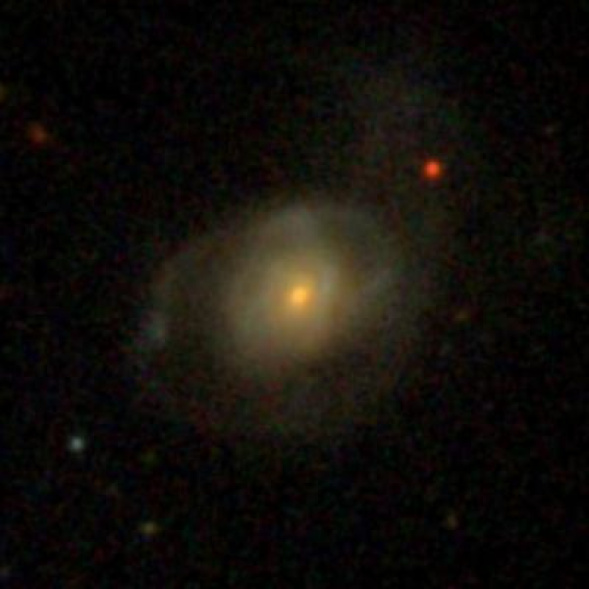
The SDSS image of J1159+5820 shows a disturbed optical morphology in which the bright central bulge is accompanied by spiral arms resembling tidal tails (see Figure 1). The optical surface brightness profile is best fitted with a combination of Sérsic plus exponential components. The best fitted parameters suggest it to be a bulge dominated system in which 75 of the total light is coming from the bulge (B/T 0.75). The total span of this galaxy, including spiral arm tails, is nearly 75, which corresponds to 77.8 kpc. The optical morphology and sizes of the different components indicate it to be a merged system, viewed close to face on (b/a 0.75). This may be a recent merger of a spiral galaxy and an elliptical galaxy, where the bulge representing elliptical galaxy is nearly intact while the spiral galaxy is tidally disrupted. The optical spectrum shows strong H, [O II] emission lines and redder continuum that can be understood as the presence of both young and old stellar populations. Emission line flux ratio diagnostics suggest it to be a LINER or Low Excitation Radio Galaxy (LERG) (see Table 4). The SFRs derived from the mid-IR and UV emission are 2.89 M⊙ yr-1 and 1.50 M⊙ yr-1, respectively. The estimated black hole mass is 2.7 5.7 108 M⊙.
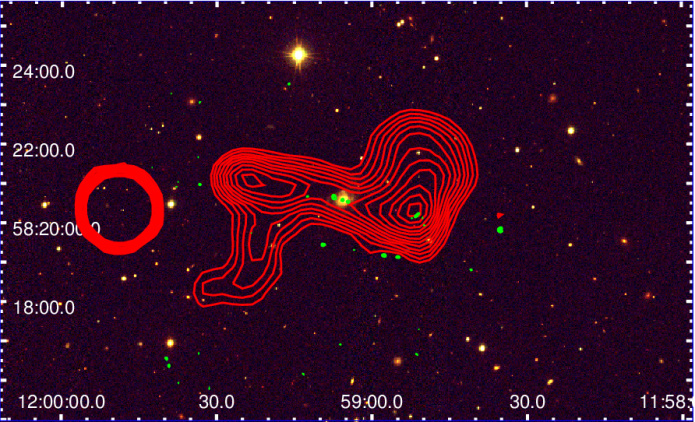
5.2.2 Radio morphology
J1159+5820 (CGCG 292057) has a very peculiar and complex radio morphology. The FIRST image of relatively higher resolution (beam-size 5.0) shows a core and two lobes with flux densities of 2.11, 2.14 and 4.36 mJy, respectively. The eastern and western lobes are located at 10.0 and 12.5 from the core component. The total end-to-end radio size is 28.7, which corresponds to 29.8 kpc and lies within the optical size of the galaxy. The NVSS image shows large scale radio emission exhibiting ‘X-shape’ or ‘Z-like’ morphology. It also shows an outer pairs of lobes that are nearly coaxial with the inner pair of lobes seen in the FIRST image. Both outer lobes are accompanied by wing-like structures of low-surface-brightness that are oriented at an angle of 40∘ w.r.t the jet-lobe axis. The outer lobes and wings are nearly symmetric w.r.t. the host galaxy. The total end-to-end linear projected size of the outer lobe structure is 6.3, which corresponds to 392 kpc, while the total end-to-end linear projected separation of the wings is 7.9 (494 kpc). In J1159+5820, the presence of two pair of lobes is an evidence for episodic AGN activity, where the inner lobes were formed by recent AGN activity, while the outer lobes were formed during a previous cycle of AGN activity. Such galaxies are known as Double-Double Radio Galaxies (DDRGs) (see Saikia & Jamrozy 2009). The wings seen in J1159+5820 may be the fading lobes of another cycle of AGN activity, and, therefore this source can be classified as triple-double radio galaxy where three pairs of lobes are seen from three epochs of AGN activity (Kozieł-Wierzbowska et al. 2012). Such radio galaxies are extremely rare and J1159+5820 may be one among rare sources, with the first such source B0925+420 being reported by Brocksopp et al. (2007).
5.2.3 Environment
We consider galaxies in the redshift bin of 0.0504–0.0570 and found that there are only 1, 2, 7 and 13 galaxies within the circular regions of the radii of 0.5, 1.0, 2.0 and 4.0 Mpc, respectively, centred at this galaxy. This suggests the lack of an over-density in the vicinity of J1159+5820. In the Tempel et al. (2014) catalogue of groups and clusters, this galaxy has not been associated with any group or cluster.
5.3 J1352+3126
J1352+3126 is a well studied source across nearly all wavelengths.
5.3.1 Host galaxy
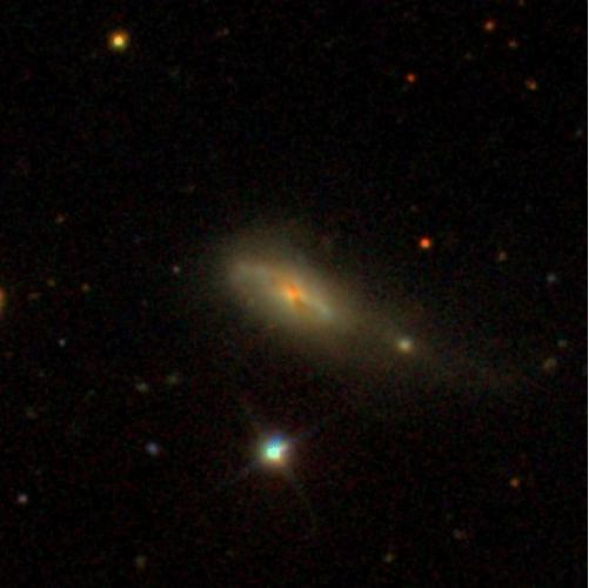
In the literature, J1352+3126 (other names : 3C 293, UGC 8782 and VV5-33-12 de Vaucouleurs et al. (1991)) has been classified as both a spiral galaxy ( Sandage 1966; Colla et al. 1975; Burbidge 1967) and an irregular galaxy ( Tremblay et al. 2007), owing to its extremely complex morphology, with a dusty disk, compact knots, and large dust lanes (see Figure 1). Donzelli et al. (2007) showed that the radial brightness profile can be better fitted by a Sersic law plus an exponential disk component. In the Galaxy Zoo catalogue, this galaxy has been classified as a spiral with 86 probability. The optical surface brightness profile is best fitted with a combination of Sérsic and exponential models. The best fitted parameters suggest it to be a bulge dominated (B/T 0.61) galaxy with major-to-minor axis ratio (b/a) 0.60. Given its complex morphology and the presence of vast amounts of dust and gas, it is believed that this galaxy is the result of a gas-rich merger of an elliptical galaxy and a spiral galaxy (Martel et al. 1999; de Koff et al. 2000; Capetti et al. 2000; Floyd et al. 2006). The SDSS optical spectrum shows a dominant red continuum along with strong Hα and [O II] emission lines (see Figure 4), indicating the presence of both old and young stellar populations. Emission line flux ratio diagnostics suggest it to be a composite galaxy, where both star formation as well as AGN contribute significantly (see Table 4). In fact, detailed stellar population studies suggest a mix of a young (0.1 - 2.5 Gyr) as well as an old (10 Gyr) stellar population, with total stellar mass of 2.8 1011 M⊙ ( Tadhunter et al. 2005; Tadhunter et al. 2011). Hubble Space Telescope (HST) observations have revealed several regions of recent star formation (Baldi & Capetti 2008). The estimated SFRs from mid-IR and UV continuum are 7.41 M⊙ yr-1 and 0.97 M⊙ yr-1, respectively. The low SFR derived from UV measurements is likely due to the presence of dust that causes extinction. Using CO line observations Labiano et al. (2014) showed the presence of massive molecular gas (M(H2) 2.2 1010 M⊙) distributed along a large 21 kpc diameter warped disk rotating around the AGN and average star formation rate of 4.01.5 M⊙ yr-1. The black hole mass derived from the bulge magnitude is 1.3 1.9 108 M⊙.
5.3.2 Radio morphology
FIRST observations only show a bright central component of 3.7 Jy, with a barely detected north-west lobe and no detection of a south-east lobe. The large beam of NVSS helps to detect extended lobe emission where the south-east lobe is less prominent. The total extent of this radio galaxy as seen in the NVSS image spans to 335 kpc with total observed 1.4 GHz luminosity 1.9 1025 W Hz-1. Previous radio observations report this as a FR-II radio galaxy with the two lobes highly asymmetric in intensity and a hotspot seen in north-west lobe ( Bridle et al. 1981; Beswick et al. 2004). The central component has a steep radio spectrum and high resolution observations of it reveal a compact double-lobed source with multiple components and a flat-spectrum radio core (Akujor et al. 1996; Beswick et al. 2004; Giovannini et al. 2005). The projected linear separation of the two inner double lobes is 1.7 kpc and has been interpreted to arise from a more recent cycle of AGN activity. Using multi-frequency radio observations Joshi et al. (2011) estimated the spectral ages of the outer and inner lobes to be 17 - 23 Myr and 0.1 Myr, respectively.
5.3.3 Environment
Considering galaxies within the redshift bin of 0.0419–0.0485 from the SDSS DR10 spectroscopic catalogue, we find only 3, 3, 11 and 38 galaxies lie in the circular regions of the radii of 0.5, 1.0, 2.0 and 4.0 Mpc, respectively, centred at the position of J1352+3126. This suggests that J1352+3126 does not reside in an over-dense region. In the Tempel et al. (2014) catalogue, this galaxy is part of a group of three galaxies with virial radius of 147 kpc and mass 1.55 2.51 1012 M⊙.
5.4 J1649+2635
A detailed study of this source has been presented in Mao et al. (2015). We independently discovered this spiral-host radio galaxy as one of our sample sources. We briefly discuss the properties of this source below.
5.4.1 Host galaxies
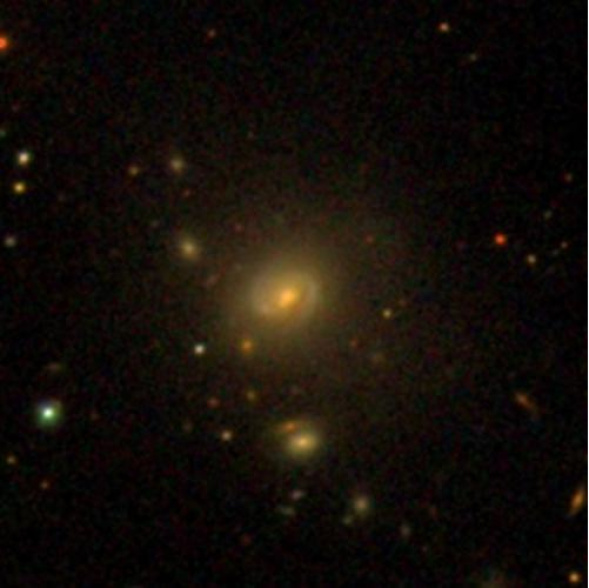
SDSS image of J1649+2635 clearly shows it to be a face on spiral galaxy with two distinct spiral arms. In the Galaxy Zoo catalogue this source has been classified as a spiral galaxy with 97 probability. Its optical surface brightness profile is best fitted with a combination of Sérsic and exponential models. The best fit parameters yield a bulgetototal ratio (B/T) 0.63, suggesting the presence of a prominent bulge. Interestingly, the optical surface bright profile extends up to 60 ( 60 kpc) indicating the existence of an extended optical halo that is fitted by the exponential component. The optical spectrum is dominated by a red continuum with a clear 4000Å break, a characteristic of early type galaxies. The WISE colour ([3.4] - [4.6] -0.01) suggests that the mid-IR emission is dominated by star formation. The estimated SFRs from mid-IR and UV continuum are 1.67 M⊙ yr-1 and 0.20 M⊙ yr-1, respectively. The black hole mass derived from bulge magnitude is in the range of 1.8 3.3 108 M⊙.
5.4.2 Radio morphology
The FIRST image shows a clear double-lobe radio morphology with two lobes placed nearly symmetrically around the radio core. The core, South-Western (SW) and North-Eastern (NE) lobes have integrated flux densities 8.59, 42.76 and 50.62 mJy, respectively. The SW and NE radio lobes are located at 24.0 and 29.5 from the optical counterpart, respectively (see Table 8). The total end-to-end projected linear size of the radio structure is 1.37, corresponding to 86 kpc at the redshift (z) 0.055 of the source. The NVSS image shows an unresolved but extended structure along the position angle of 55∘.6. The total NVSS flux density (155.4 mJy) is higher than the total FIRST flux density (102 mJy) and therefore indicates the presence of extended radio emission of low-surface-brightness that remains undetected in the FIRST observations. This source has also been observed at 4.86 MHz (in the GB 6 survey), 408 MHz (in the B2 survey) and 74 MHz (in the VLA Low-frequency Sky Survey) with total flux densities 63 mJy, 331 mJy and 640 mJy, respectively (see Table 6).
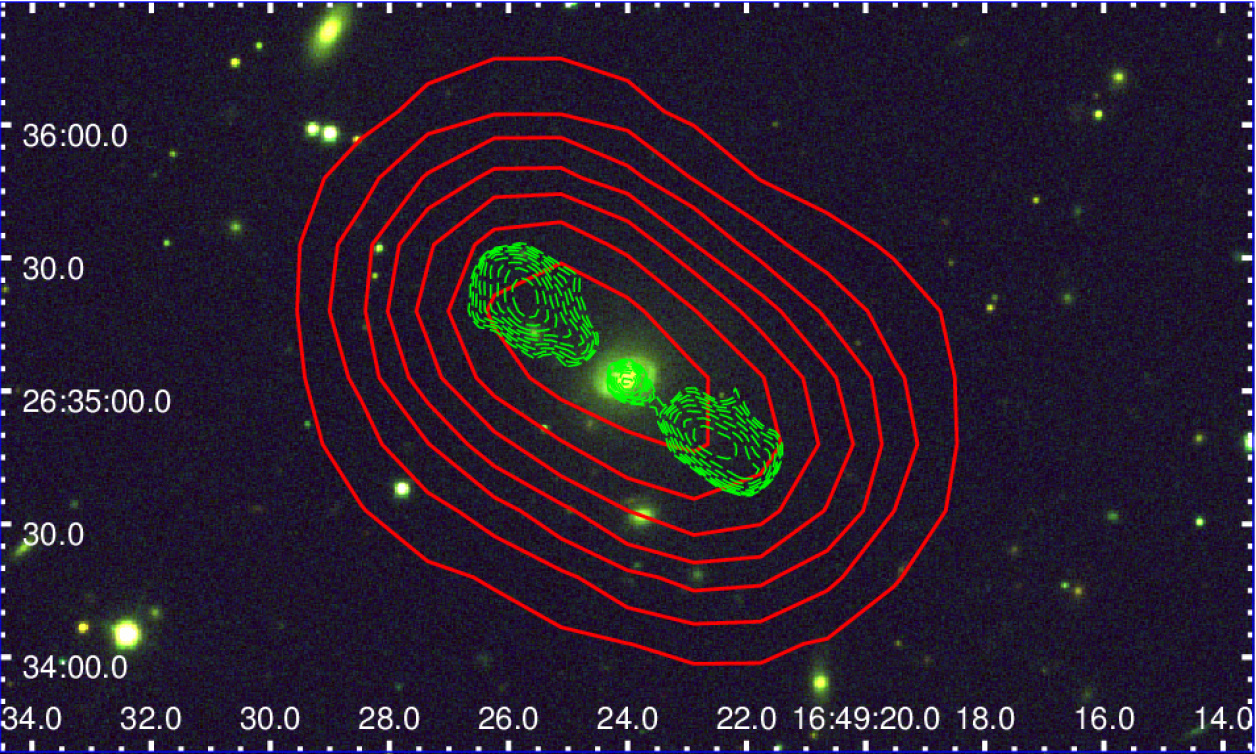
5.4.3 Environment
Using SDSS DR10 spectroscopic data and considering galaxies within the redshift bin of 0.05450.0033, we find that there are 9, 21, 38 and 64 galaxies in circular regions of radii of 0.5, 1.0, 2.0 and 4.0 Mpc, respectively, centred at the position of J1649+2635. This suggests that J1649+2635 is residing in a group or possibly a cluster (as more galaxies are likely to be present below the SDSS spectroscopic flux limit). In the Tempel et al. (2014) catalogue, J1649+2635 is associated with a group of 19 galaxies with viral radius of 287.8 kpc and mass of 5.15 8.62 1013 M⊙.
6 Discussion
In our study we find four spiral-host radio galaxies by cross-matching a large sample of 187005 spiral galaxies to the FIRST and NVSS catalogues. Considering the scarcity of such systems in the local Universe it is important to understand the underlying mechanism(s) for the formation of such sources. Here we discuss some of the plausible scenarios for the formation of spiral-host double-lobe radio galaxies.
6.1 Radio-loud Seyfert galaxies
Two of our sample sources (J0836+0532 and J1649+2635) are large face-on spiral galaxies without any apparent indication of an ongoing merger or interaction. Emission line flux ratio diagnostics suggest J0836+0532 to be a Seyfert or HERG (see Table 4), as both radio-quiet (Seyfert galaxies, LINERs) and radio-loud sources (radio galaxies) can have similar emission line ratios (Buttiglione et al. 2010). In general, Seyfert galaxies represent radio-quiet AGN residing in late type disk dominated spiral or lenticular galaxies (Schmidt & Green 1983; Kellermann et al. 1989). Moreover, a few examples of Seyfert galaxies with double-lobe radio morphology have been reported NGC 1052 (Wrobel 1984), NGC 1068 (Ulvestad et al. 1987), NGC 7674 (Momjian et al. 2003), MRK 3 (Kukula et al. 1999) and MRK 6 (Kharb et al. 2006)). Although, the sizes of radio structures in radio-loud Seyfert galaxies span only up to 10–15 kpc. The optical properties (spiral morphology and emission line ratios) of J0836+0532 and J1649+2635 are similar to Seyfert galaxies, but with relatively larger black hole masses (2.7 5.5 108 M⊙ and 1.8 3.3 108 M⊙, respectively). Their large black hole masses may play a role in producing powerful jets that result in their large double-lobes ( Chiaberge & Marconi 2011). In a recent study, Kaviraj et al. (2014) reported that spiral galaxies exhibiting strong nuclear radio emission detected in VLBI observations are in general more massive than VLBI-undetected spiral galaxies, suggesting that larger black hole masses result in more powerful jets. Moreover, Seyfert galaxies with double-lobe radio morphology spanning few hundreds of kpc are unusual and enigmatic. It seems that spiral-host double-lobe radio galaxies constitute a rare population in which optical properties are similar to low luminosity AGN (Seyferts) while radio properties are of the typical radio galaxies ( Morganti et al. 2011). Mao et al. (2015) proposed that J1649+2635 may have undergone a planar minor merger that would not introduce angular momentum perpendicular to the plane, so that spiral structure is not disrupted. The merger would bring sufficient matter (6.6 - 15.5 M⊙ yr-1 assuming 0.1 efficiency) on to the supermassive black hole and trigger radio-loud AGN activity that would eventually result in the large-scale double-lobe radio morphology similar to that seen in typical radio galaxies. This process would also lead to quenching of star formation, making the host galaxy red.
6.2 Merger driven radio-loud AGN activity
Two sources (J1159+5820 and J1352+3126) in our sample are clear cases of mergers between a spiral and an elliptical. In both galaxies, the optical morphology and surface brightness profile display the presence of large bulge and disturbed disk with tidal tails of spiral arms (see Sections 5.2 and 5.3). Both these systems are likely to be recent gas-rich mergers of a massive spiral and an elliptical such that the spiral arm features are disturbed, although not destroyed. The spiral arms can be sustained over a period of time if there is a large reservoir of gas and dust available, and may perhaps grow if there is supply of gas and dust from the inner part of the merged system. In fact, in both these galaxies, the spiral arms appear blue, indicating the presence of young stellar population and dust rich local ISM. Notably, both these galaxies exhibit episodic AGN activity displayed by the presence of two pairs of lobes. It is possible that a large double-lobe radio galaxy may have been residing in a usual early type bulge dominated galaxy and a recent merger with a large spiral galaxy brought enough material to the supermassive black hole to give rise a recent episode of AGN activity. It has been suggested that the episodic AGN activity is likely to be caused by merger that provides fresh supply of material onto SMBH ( Saikia & Jamrozy 2009; Tremblay et al. 2010). Recently, Chiaberge et al. (2015) demonstrated that galaxy-galaxy merger is the main triggering mechanism for the radio-loud AGN activity in a sample of high-redshift (z 1) sources.
6.3 Role of environment
The large-scale surrounding environment is expected to play an important role in triggering the AGN activity in galaxies. It has been suggested that the cooling of hot gas and its inflow towards the centre of the cluster is one of the key factors in triggering AGN activity in Bright Cluster Galaxies (BCGs) residing at the centre of clusters (McNamara & Nulsen 2007; Fabian 2012). It is worth noting that some of the previously found spiral-host radio galaxies (J0315-1906 (Ledlow et al. 1998), Speca (Hota et al. 2011)) are reported to be residing in a cluster environment. We investigated for the presence of cluster environment around our sample sources using the SDSS DR10 data and the Tempel et al. (2014) catalogue, and found that none of our sources except J1649+2635 reside in cluster environment. J1649+2635 likely resides in a group of galaxies of viral radius 287 kpc and dynamical mass of 5.15 8.62 1013 M⊙. None of our sample sources is detected in RoSAT All Sky Survey. Therefore, we surmise that the large-scale surrounding environment is not the only possible factor in triggering radio-loud AGN activity in spiral galaxies. As discussed earlier in this section, galaxy-galaxy mergers can also be plausible scenario for the trigger of AGN activity in our sample sources. The proposed scenario is consistent with recent works that suggest a strong connection between merging and the onset of AGN activity in low-redshift sources ( Koss et al. 2010; Ellison et al. 2011; Kaviraj et al. 2015).
7 Conclusions
We report the discovery of four spiral-host radio galaxies (J0836+0532, J1159+5820, J1352+3126 and J1649+2635)
by cross-matching a large sample of 187005 spiral galaxies to
the FIRST and NVSS catalogues. J0836+0532, with the largest radio size in our sample, is reported for the first time.
Given our small sample size, despite the use of extremely large optical and radio catalogues,
it is evident that spiral-host double-lobe radio galaxies are extremely rare.
In fact, our study can be considered as a test bed to find rare populations of spiral-host double-lobe radio galaxies
using more sensitive surveys from upcoming facilities such as the Large Synoptic Survey Telescope (LSST; Ivezic
et al. (2008)) and
the Square Kilometer Array (SKA; Dewdney et al. (2009)).
We note that all of our sample sources exhibit radio morphologies similar to FR-II radio galaxies.
Since both radio-quiet and radio-loud AGN exhibit similar emission line ratios and therefore,
diagnostics based on emission line ratios indicate two sources (J0836+0532 and J1159+5820) to be HERG or Seyferts
and one source (J1352+3126) to be LERG or LINER.
Considering only optical properties (spiral disk and emission line ratios) these sources may have been
classified as Seyfert and LINER galaxies.
While radio properties classify them as typical radio galaxies.
The host galaxies of our sample sources are forming stars at an average rate of 1.7 M⊙ yr-1 to 10 M⊙ yr-1.
The supermassive black hole masses in our spiral-host radio galaxies are a few times 108 M⊙, typical of radio-loud AGN.
Their radio morphologies, with total linear projected sizes ranging from 86 kpc to 420 kpc, are typical of those seen in
FR-II radio galaxies. However, their NVSS 1.4 GHz radio luminosities are relatively lower, in the range 1024 to 1025 W Hz-1.
The relatively lower luminosity of FR-II type radio galaxies can be understood if the extended radio emission is old
the electrons are not re-accelerated and the lobes have become dimmer.
Evolutionary models of radio galaxies generally predict a slow increase in both size and luminosity over most of the source lifetime,
followed by a rapid decline in luminosity at the late phase of its lifetime ( Luo &
Sadler 2010).
Therefore, our spiral-host double-lobe radio galaxies may be in the late phase of their evolution.
Indeed, multi-frequency radio observations of J1159+5820 and J1352+3126 have shown that the extended radio emission in
these sources is dominated of relic radio emission from the previous phase of AGN activity.
Our ongoing multi-frequency, multi-resolution radio observations (from Giant Metrewave Radio Telescope)
of the spiral-host double-lobe radio sources presented in this study would provide further insights on the formation of these systems.
Based on properties of the spiral-host radio galaxies in our small sample,
we propose following plausible scenarios that may be responsible for their formation.
(i) A radio-loud Seyfert nucleus hosted in a massive spiral galaxy with
large black hole mass (few times of 108 M⊙), similar to radio-loud AGN, may form a spiral-host radio galaxy.
An AGN with a large black hole mass is likely to produce powerful jets that can lead to the formation of a large double-lobe radio morphology.
J0836+0532 and J1649+2635 are possible cases without an apparent sign of merger or strong interaction visible in the SDSS images.
(ii) The optical morphology of J1159+5820 and J1352+3126 suggest them to be recent mergers of
possibly equally massive spiral and elliptical galaxies.
In these sources, the spiral structures are disturbed but not destroyed, perhaps due to the presence of large reservoirs of gas and dust.
Both these galaxies show blue coloured disks and spiral arms, suggesting the presence of young stellar populations and dust-rich local ISM.
Notably, both these galaxies shows episodic AGN activity, indicating that merger may have resulted in a second episode of AGN activity.
None of our sample sources except J1649+2635 are found to be residing in cluster environments,
therefore, suggesting the plausibility of processes, other than accretion through cooling flows,
in triggering radio-loud AGN activity in our spiral-host radio galaxies.
We suggest that the large scale double-lobe radio structures found in spiral galaxies are possibly attributed to more than
one factor, such as the occurrence
of unusually large supermassive black holes, and/or mergers that do not destroy spiral structures.
Acknowledgements
The financial assistance of the South African SKA Project (SKA SA) towards this research is hereby acknowledged.
Opinions expressed and conclusions arrived at are those of the authors and are not necessarily to be attributed to the SKA SA.
YW and AB acknowledge support from the Indo-French Centre for the Promotion of Advanced Research (Centre Franco-Indien pour la
Promotion de la Recherche Avancé) under program no. 4404-3.
We thank the anonymous referee for useful comments that helped to improve the manuscript.
This research has made use of the NASA/IPAC Extragalactic Database (NED) which is operated by the Jet Propulsion Laboratory, California
Institute of Technology, under contract with the National Aeronautics and Space Administration.
This publication makes use of data products from the Wide-field Infrared Survey Explorer, which is a joint project of the University of California,
Los Angeles, and the Jet Propulsion Laboratory/California Institute of Technology, funded by the National Aeronautics and Space Administration.
Funding for SDSS-III has been provided by the Alfred P. Sloan Foundation, the Participating Institutions, the National Science Foundation,
and the U.S. Department of Energy Office of Science. The SDSS-III web site is http://www.sdss3.org/.
SDSS-III is managed by the Astrophysical Research Consortium for the Participating Institutions of the SDSS-III Collaboration
including the University of Arizona, the Brazilian Participation Group, Brookhaven National Laboratory, Carnegie Mellon University,
University of Florida, the French Participation Group, the German Participation Group, Harvard University, the Instituto de Astrofisica de Canarias,
the Michigan State/Notre Dame/JINA Participation Group, Johns Hopkins University, Lawrence Berkeley National Laboratory,
Max Planck Institute for Astrophysics, Max Planck Institute for Extraterrestrial Physics, New Mexico State University,
New York University, Ohio State University, Pennsylvania State University, University of Portsmouth, Princeton University,
the Spanish Participation Group, University of Tokyo, University of Utah, Vanderbilt University, University of Virginia,
University of Washington, and Yale University.
References
- Abazajian et al. (2009) Abazajian K. N., Adelman-McCarthy J. K., Agüeros M. A., Allam S. S., Allende Prieto C., An D., Anderson K. S. J., Anderson S. F., Annis J., Bahcall N. A., et al. 2009, ApJS , 182, 543
- Akujor et al. (1996) Akujor C. E., Leahy J. P., Garrington S. T., Sanghera H., Spencer R. E., Schilizzi R. T., 1996, MNRAS , 278, 1
- Bagchi et al. (2014) Bagchi J., Vivek M., Vikram V., Hota A., Biju K. G., Sirothia S. K., Srianand R., Gopal-Krishna Jacob J., 2014, ApJ , 788, 174
- Baldi & Capetti (2008) Baldi R. D., Capetti A., 2008, A&A , 489, 989
- Baldwin et al. (1981) Baldwin J. A., Phillips M. M., Terlevich R., 1981, PASP , 93, 5
- Becker et al. (2007) Becker M. R., McKay T. A., Koester B., Wechsler R. H., Rozo E., Evrard A., Johnston D., Sheldon E., Annis J., Lau E., Nichol R., Miller C., 2007, ApJ , 669, 905
- Becker et al. (1995) Becker R. H., White R. L., Helfand D. J., 1995, ApJ , 450, 559
- Bentz et al. (2009) Bentz M. C., Peterson B. M., Pogge R. W., Vestergaard M., 2009, ApJL , 694, L166
- Best & Heckman (2012) Best P. N., Heckman T. M., 2012, MNRAS , 421, 1569
- Best et al. (2005) Best P. N., Kauffmann G., Heckman T. M., Brinchmann J., Charlot S., Ivezić Ž., White S. D. M., 2005, MNRAS , 362, 25
- Beswick et al. (2004) Beswick R. J., Peck A. B., Taylor G. B., Giovannini G., 2004, MNRAS , 352, 49
- Bridle et al. (1981) Bridle A. H., Fomalont E. B., Cornwell T. J., 1981, AJ , 86, 1294
- Brocksopp et al. (2007) Brocksopp C., Kaiser C. R., Schoenmakers A. P., de Bruyn A. G., 2007, MNRAS , 382, 1019
- Burbidge (1967) Burbidge E. M., 1967, ApJL , 149, L51
- Buttiglione et al. (2010) Buttiglione S., Capetti A., Celotti A., Axon D. J., Chiaberge M., Macchetto F. D., Sparks W. B., 2010, A&A , 509, A6
- Calzetti et al. (1994) Calzetti D., Kinney A. L., Storchi-Bergmann T., 1994, ApJ , 429, 582
- Capaccioli & Caon (1989) Capaccioli M., Caon N., 1989, in Grosbøl P. J., Murtagh F., Warmels R. H., eds, ESO/ST-ECF Data Analysis Workshop Vol. 31 of European Southern Observatory Conference and Workshop Proceedings, Surface photometry of early-type galaxies.. pp 107–126
- Capetti & Balmaverde (2006) Capetti A., Balmaverde B., 2006, A&A , 453, 27
- Capetti et al. (2000) Capetti A., de Ruiter H. R., Fanti R., Morganti R., Parma P., Ulrich M.-H., 2000, A&A , 362, 871
- Chary & Elbaz (2001) Chary R., Elbaz D., 2001, ApJ , 556, 562
- Chiaberge et al. (2015) Chiaberge M., Gilli R., Lotz J. M., Norman C., 2015, ApJ , 806, 147
- Chiaberge & Marconi (2011) Chiaberge M., Marconi A., 2011, MNRAS , 416, 917
- Cohen et al. (2007) Cohen A. S., Lane W. M., Cotton W. D., Kassim N. E., Lazio T. J. W., Perley R. A., Condon J. J., Erickson W. C., 2007, AJ , 134, 1245
- Colla et al. (1972) Colla G., Fanti C., Fanti R., Ficarra A., Formiggini L., Gandolfi E., Lari C., Marano B., Padrielli L., Tomasi P., 1972, Astron. & Astrophys. Suppl. , 7, 1
- Colla et al. (1975) Colla G., Fanti C., Fanti R., Gioia I., Lari C., Lequeux J., Lucas R., Ulrich M. H., 1975, Astron. & Astrophys. Suppl. , 20, 1
- Condon et al. (1998) Condon J. J., Cotton W. D., Greisen E. W., Yin Q. F., Perley R. A., Taylor G. B., Broderick J. J., 1998, AJ , 115, 1693
- Dale & Helou (2002) Dale D. A., Helou G., 2002, ApJ , 576, 159
- de Koff et al. (2000) de Koff S., Best P., Baum S. A., Sparks W., Röttgering H., Miley G., Golombek D., Macchetto F., Martel A., 2000, ApJS , 129, 33
- de Vaucouleurs (1948) de Vaucouleurs G., 1948, Annales d’Astrophysique, 11, 247
- de Vaucouleurs et al. (1991) de Vaucouleurs G., de Vaucouleurs A., Corwin Jr. H. G., Buta R. J., Paturel G., Fouque P., 1991, Third Reference Catalogue of Bright Galaxies. Volume 1-3, XII, 2069 pp. 7 figs.. Springer-Verlag Berlin Heidelberg New York
- de Vries et al. (2006) de Vries W. H., Becker R. H., White R. L., 2006, AJ , 131, 666
- Dewdney et al. (2009) Dewdney P. E., Hall P. J., Schilizzi R. T., Lazio T. J. L. W., 2009, IEEE Proceedings, 97, 1482
- Donzelli et al. (2007) Donzelli C. J., Chiaberge M., Macchetto F. D., Madrid J. P., Capetti A., Marchesini D., 2007, ApJ , 667, 780
- Ellison et al. (2011) Ellison S. L., Patton D. R., Mendel J. T., Scudder J. M., 2011, MNRAS , 418, 2043
- Fabian (2012) Fabian A. C., 2012, ARAA , 50, 455
- Floyd et al. (2006) Floyd D. J. E., Perlman E., Leahy J. P., Beswick R. J., Jackson N. J., Sparks W. B., Axon D. J., O’Dea C. P., 2006, ApJ , 639, 23
- Gallimore et al. (2006) Gallimore J. F., Axon D. J., O’Dea C. P., Baum S. A., Pedlar A., 2006, AJ , 132, 546
- Ghisellini et al. (1993) Ghisellini G., Padovani P., Celotti A., Maraschi L., 1993, ApJ , 407, 65
- Giovannini et al. (2005) Giovannini G., Taylor G. B., Feretti L., Cotton W. D., Lara L., Venturi T., 2005, ApJ , 618, 635
- Gregory & Condon (1991) Gregory P. C., Condon J. J., 1991, ApJS , 75, 1011
- Hota et al. (2011) Hota A., Sirothia S. K., Ohyama Y., Konar C., Kim S., Rey S.-C., Saikia D. J., Croston J. H., Matsushita S., 2011, MNRAS , 417, L36
- Ivezic et al. (2002) Ivezic Z., Menou K., Knapp G. R., Strauss M. A., Lupton R. H., Vanden Berk D. E., Richards G. T., Tremonti C., Weinstein M. A., 2002, AJ , 124, 2364
- Ivezic et al. (2008) Ivezic Z., Tyson J. A., Abel B., Acosta E., Allsman R., Zhan H., for the LSST Collaboration 2008, ArXiv e-prints:0805.2366
- Jester et al. (2005) Jester S., Schneider D. P., Richards G. T., Green R. F., Schmidt M., Hall P. B., Strauss M. A., Vanden Berk D. E., Stoughton C., Gunn J. E., Brinkmann J., Kent S. M., Smith J. A., Tucker D. L., Yanny B., 2005, AJ , 130, 873
- Joshi et al. (2011) Joshi S. A., Nandi S., Saikia D. J., Ishwara-Chandra C. H., Konar C., 2011, MNRAS , 414, 1397
- Kaviraj et al. (2011) Kaviraj S., Schawinski K., Silk J., Shabala S. S., 2011, MNRAS , 415, 3798
- Kaviraj et al. (2014) Kaviraj S., Shabala S. S., Deller A. T., Middelberg E., 2014, ArXiv:1412.5602
- Kaviraj et al. (2015) Kaviraj S., Shabala S. S., Deller A. T., Middelberg E., 2015, MNRAS , 452, 774
- Keel et al. (2006) Keel W. C., White III R. E., Owen F. N., Ledlow M. J., 2006, AJ , 132, 2233
- Kellermann et al. (1989) Kellermann K. I., Sramek R., Schmidt M., Shaffer D. B., Green R., 1989, AJ , 98, 1195
- Kelvin et al. (2012) Kelvin L. S., Driver S. P., Robotham A. S. G., Hill D. T., Alpaslan M., Baldry I. K., Tuffs R. J., 2012, MNRAS , 421, 1007
- Kennicutt (1998) Kennicutt Jr. R. C., 1998, ARAA , 36, 189
- Kewley et al. (2006) Kewley L. J., Groves B., Kauffmann G., Heckman T., 2006, MNRAS , 372, 961
- Kewley et al. (2005) Kewley L. J., Jansen R. A., Geller M. J., 2005, PASP , 117, 227
- Kharb et al. (2006) Kharb P., O’Dea C. P., Baum S. A., Colbert E. J. M., Xu C., 2006, ApJ , 652, 177
- Kimball & Ivezić (2008) Kimball A. E., Ivezić Ž., 2008, AJ , 136, 684
- Kormendy & Richstone (1995) Kormendy J., Richstone D., 1995, ARAA , 33, 581
- Koss et al. (2010) Koss M., Mushotzky R., Veilleux S., Winter L., 2010, ApJL , 716, L125
- Kozieł-Wierzbowska et al. (2012) Kozieł-Wierzbowska D., Jamrozy M., Zola S., Stachowski G., Kuźmicz A., 2012, MNRAS , 422, 1546
- Kukula et al. (1999) Kukula M. J., Ghosh T., Pedlar A., Schilizzi R. T., 1999, ApJ , 518, 117
- Labiano et al. (2014) Labiano A., García-Burillo S., Combes F., Usero A., Soria-Ruiz R., Piqueras López J., Fuente A., Hunt L., Neri R., 2014, A&A , 564, A128
- Labiano et al. (2013) Labiano A., García-Burillo S., Combes F., Usero A., Soria-Ruiz R., Tremblay G., Neri R., Fuente A., Morganti R., Oosterloo T., 2013, A&A , 549, A58
- Lackner & Gunn (2012) Lackner C. N., Gunn J. E., 2012, MNRAS , 421, 2277
- Laor (2000) Laor A., 2000, ApJL , 543, L111
- Ledlow et al. (1998) Ledlow M. J., Owen F. N., Keel W. C., 1998, ApJ , 495, 227
- Lin et al. (2004) Lin Y.-T., Mohr J. J., Stanford S. A., 2004, ApJ , 610, 745
- Lintott et al. (2011) Lintott C., Schawinski K., Bamford S., Slosar A., Land K., Thomas D., Edmondson E., Masters K., Nichol R. C., Raddick M. J., Szalay A., Andreescu D., Murray P., Vandenberg J., 2011, MNRAS , 410, 166
- Lintott et al. (2008) Lintott C. J., Schawinski K., Slosar A., Land K., Bamford S., Thomas D., Raddick M. J., Nichol R. C., Szalay A., Andreescu D., Murray P., Vandenberg J., 2008, MNRAS , 389, 1179
- Liu et al. (2006) Liu Y., Jiang D. R., Gu M. F., 2006, ApJ , 637, 669
- Lu et al. (2007) Lu Y., Wang T., Zhou H., Wu J., 2007, AJ , 133, 1615
- Luo & Sadler (2010) Luo Q., Sadler E. M., 2010, ApJ , 713, 398
- Magorrian et al. (1998) Magorrian J., Tremaine S., Richstone D., Bender R., Bower G., Dressler A., Faber S. M., Gebhardt K., Green R., Grillmair C., Kormendy J., Lauer T., 1998, AJ , 115, 2285
- Mao et al. (2015) Mao M. Y., Owen F., Duffin R., Keel B., Lacy M., Momjian E., Morrison G., Mroczkowski T., Neff S., Norris R. P., Schmitt H., Toy V., Veilleux S., 2015, MNRAS , 446, 4176
- Martel et al. (1999) Martel A. R., Baum S. A., Sparks W. B., Wyckoff E., Biretta J. A., Golombek D., Macchetto F. D., de Koff S., McCarthy P. J., Miley G. K., 1999, ApJS , 122, 81
- Martin et al. (2005) Martin D. C., Fanson J., Schiminovich D., Morrissey P., Friedman P. G., Barlow T. A., Conrow T., Grange R., Jelinsky P. N., Milliard B., Siegmund O. H. W., Bianchi L., Wyder T. K., 2005, ApJL , 619, L1
- Masters et al. (2010) Masters K. L., Mosleh M., Romer A. K., Nichol R. C., Bamford S. P., Schawinski K., Lintott C. J., Andreescu D., Campbell H. C., Crowcroft B., Doyle I., Edmondson E. M., Murray P., Raddick M. J., Slosar A., Szalay A. S., Vandenberg J., 2010, MNRAS , 405, 783
- McConnell & Ma (2013) McConnell N. J., Ma C.-P., 2013, ApJ , 764, 184
- McGreer et al. (2009) McGreer I. D., Helfand D. J., White R. L., 2009, AJ , 138, 1925
- McLure et al. (2004) McLure R. J., Willott C. J., Jarvis M. J., Rawlings S., Hill G. J., Mitchell E., Dunlop J. S., Wold M., 2004, MNRAS , 351, 347
- McNamara & Nulsen (2007) McNamara B. R., Nulsen P. E. J., 2007, ARAA , 45, 117
- Meert et al. (2015) Meert A., Vikram V., Bernardi M., 2015, MNRAS , 446, 3943
- Momjian et al. (2003) Momjian E., Romney J. D., Carilli C. L., Troland T. H., 2003, ApJ , 597, 809
- Morganti et al. (2011) Morganti R., Holt J., Tadhunter C., Ramos Almeida C., Dicken D., Inskip K., Oosterloo T., Tzioumis T., 2011, A&A , 535, A97
- Nesvadba et al. (2010) Nesvadba N. P. H., Boulanger F., Salomé P., Guillard P., Lehnert M. D., Ogle P., Appleton P., Falgarone E., Pineau Des Forets G., 2010, A&A , 521, A65
- Peng et al. (2002) Peng C. Y., Ho L. C., Impey C. D., Rix H.-W., 2002, AJ , 124, 266
- Rieke et al. (2009) Rieke G. H., Alonso-Herrero A., Weiner B. J., Pérez-González P. G., Blaylock M., Donley J. L., Marcillac D., 2009, ApJ , 692, 556
- Saikia & Jamrozy (2009) Saikia D. J., Jamrozy M., 2009, Bulletin of the Astronomical Society of India, 37, 63
- Sandage (1966) Sandage A., 1966, ApJ , 145, 1
- Saripalli et al. (2005) Saripalli L., Hunstead R. W., Subrahmanyan R., Boyce E., 2005, AJ , 130, 896
- Schawinski et al. (2007) Schawinski K., Thomas D., Sarzi M., Maraston C., Kaviraj S., Joo S.-J., Yi S. K., Silk J., 2007, MNRAS , 382, 1415
- Schawinski et al. (2011) Schawinski K., Treister E., Urry C. M., Cardamone C. N., Simmons B., Yi S. K., 2011, ApJL , 727, L31
- Schmidt & Green (1983) Schmidt M., Green R. F., 1983, ApJ , 269, 352
- Schoenmakers et al. (2001) Schoenmakers A. P., de Bruyn A. G., Röttgering H. J. A., van der Laan H., 2001, A&A , 374, 861
- Sérsic (1963) Sérsic J. L., 1963, Boletin de la Asociacion Argentina de Astronomia La Plata Argentina, 6, 41
- Simard et al. (2011) Simard L., Mendel J. T., Patton D. R., Ellison S. L., McConnachie A. W., 2011, ApJS , 196, 11
- Singh et al. (2015) Singh V., Ishwara-Chandra C. H., Wadadekar Y., Beelen A., Kharb P., 2015, MNRAS , 446, 599
- Stern et al. (2012) Stern D., Assef R. J., Benford D. J., Blain A., Cutri R., Dey A., Eisenhardt P., Griffith R. L., Jarrett T. H., Lake S., Masci F., Petty S., Stanford S. A., Tsai C.-W., Wright E. L., Yan L., Harrison F., Madsen K., 2012, ApJ , 753, 30
- Stoughton et al. (2002) Stoughton C., Lupton R. H., Bernardi M., Blanton M. R., Burles S., Castander F. J., Connolly A. J., Eisenstein D. J., Zheng W., 2002, AJ , 123, 485
- Strateva et al. (2001) Strateva I., Ivezić Ž., Knapp G. R., Narayanan V. K., Strauss M. A., Gunn J. E., Lupton R. H., Schlegel D., Shimasaku K., York D., 2001, AJ , 122, 1861
- Tadhunter et al. (2002) Tadhunter C., Dickson R., Morganti R., Robinson T. G., Wills K., Villar-Martin M., Hughes M., 2002, MNRAS , 330, 977
- Tadhunter et al. (2011) Tadhunter C., Holt J., González Delgado R., Rodríguez Zaurín J., Villar-Martín M., Morganti R., Emonts B., Ramos Almeida C., Inskip K., 2011, MNRAS , 412, 960
- Tadhunter et al. (2005) Tadhunter C., Robinson T. G., González Delgado R. M., Wills K., Morganti R., 2005, MNRAS , 356, 480
- Tago et al. (2008) Tago E., Einasto J., Saar E., Tempel E., Einasto M., Vennik J., Müller V., 2008, A&A , 479, 927
- Tago et al. (2010) Tago E., Saar E., Tempel E., Einasto J., Einasto M., Nurmi P., Heinämäki P., 2010, A&A , 514, A102
- Tempel et al. (2014) Tempel E., Tamm A., Gramann M., Tuvikene T., Liivamägi L. J., Suhhonenko I., Kipper R., Einasto M., Saar E., 2014, A&A , 566, A1
- Tojeiro et al. (2013) Tojeiro R., Masters K. L., Richards J., Percival W. J., Bamford S. P., Maraston C., Nichol R. C., Skibba R., Thomas D., 2013, MNRAS , 432, 359
- Tremaine et al. (2002) Tremaine S., Gebhardt K., Bender R., Bower G., Dressler A., Faber S. M., Filippenko A. V., Green R., Grillmair C., Ho L. C., Kormendy J., Lauer T. R., Magorrian J., Pinkney J., Richstone D., 2002, ApJ , 574, 740
- Tremblay et al. (2007) Tremblay G. R., Chiaberge M., Donzelli C. J., Quillen A. C., Capetti A., Sparks W. B., Macchetto F. D., 2007, ApJ , 666, 109
- Tremblay et al. (2010) Tremblay G. R., O’Dea C. P., Baum S. A., Koekemoer A. M., Sparks W. B., de Bruyn G., Schoenmakers A. P., 2010, ApJ , 715, 172
- Ulvestad et al. (1987) Ulvestad J. S., Neff S. G., Wilson A. S., 1987, AJ , 93, 22
- Urry & Padovani (1995) Urry C. M., Padovani P., 1995, PASP , 107, 803
- Vikram et al. (2010) Vikram V., Wadadekar Y., Kembhavi A. K., Vijayagovindan G. V., 2010, MNRAS , 409, 1379
- Voges et al. (1999) Voges W., Aschenbach B., Boller T., Bräuninger H., Briel U., Burkert W., Dennerl K., Englhauser J., Gruber R., Haberl F., Zimmermann H. U., 1999, A&A , 349, 389
- Voges et al. (2000) Voges W., Aschenbach B., Boller T., Brauninger H., Briel U., Burkert W., Dennerl K., Schmitt J., Trumper J., Zimmermann U., 2000, IAU Circ. , 7432, 3
- Wadadekar (2004) Wadadekar Y., 2004, A&A , 416, 35
- White et al. (1997) White R. L., Becker R. H., Helfand D. J., Gregg M. D., 1997, ApJ , 475, 479
- Wilson & Colbert (1995) Wilson A. S., Colbert E. J. M., 1995, ApJ , 438, 62
- Wright et al. (2010) Wright E. L., Eisenhardt P. R. M., Mainzer A. K., Ressler M. E., Cutri R. M., Jarrett T., Kirkpatrick J. D., Padgett D., McMillan R. S., Skrutskie M., Stanford S. A., Cohen M., Tsai C.-W., 2010, AJ , 140, 1868
- Wrobel (1984) Wrobel J. M., 1984, ApJ , 284, 531