Measuring economic complexity of countries and products: which metric to use?
Abstract
Evaluating the economies of countries and their relations with products in the global market is a central problem in economics, with far-reaching implications to our theoretical understanding of the international trade as well as to practical applications, such as policy making and financial investment planning. The recent Economic Complexity approach aims to quantify the competitiveness of countries and the quality of the exported products based on the empirical observation that the most competitive countries have diversified exports, whereas developing countries only export few low quality products—typically those exported by many other countries. Two different metrics, Fitness-Complexity and the Method of Reflections, have been proposed to measure country and product score in the Economic Complexity framework. We use international trade data and a recent ranking evaluation measure to quantitatively compare the ability of the two metrics to rank countries and products according to their importance in the network. The results show that the Fitness-Complexity metric outperforms the Method of Reflections in both the ranking of products and the ranking of countries. We also investigate a generalization of the Fitness-Complexity metric and show that it can produce improved rankings provided that the input data are reliable.
1 Introduction
Where does the wealth of nations come from? Which countries will economically grow in the future? Unveiling the intangible factors driving economic success and growth is a long-standing problem which still has many open questions. Classical economic theories, from Ricardo’s theory ricardo1891principles to more recent studies romer1990endogenous ; grossman1991quality , emphasize the importance of specialization of countries’ production on few high-quality products. The Economic Complexity approach exploits the interconnectedness of the current global market and represents the international trade data as a bipartite network where countries are connected to the products that they export. The starting point of the analysis is the empirical observation that the most competitive countries tend to diversify their export basket, whereas developing countries are able to export only a few products, typically those exported by many other countries hidalgo2009building ; tacchella2012new . This finding contrasts the standard view that the richest countries should specialize their production in economic niches ricardo1891principles .
How to best infer countries’ and products’ economic complexity from the structure of the country-product network is still debated. There are two competing viewpoints: (1) The Method of Reflections (MR) by Hidalgo and Hausmann hidalgo2009building defines country and product complexity through a set of linear iterative equations, similarly to Google’s PageRank brin1998anatomy ; (2) The Fitness-Complexity Method (FCM) by Tacchella et al. tacchella2012new defines country fitness and product complexity through a set of non-linear iterative equations. The input of both methods is the adjacency matrix of the country-product network. The MR has been applied to world trade data both by the original authors hausmann2014atlas and by others felipe2012product ; poncet2013export ; cheng2013hidden . It has been shown that the complexity index based on the MR scores – called Economic Complexity Index (ECI) – contributes to the variance of countries’ economic growth significantly more than the existing governance, institutional quality, education quality and economic competitiveness indexes hausmann2014atlas . By contrast, Refs. tacchella2012new ; cristelli2013measuring ; caldarelli2012network ; tacchella2013economic ; battiston2014metrics emphasize some negative aspects of the application of the MR to the world trade data. This criticism is mostly motivated by the study of a few particular countries and by the convergence of the iterations that define the MR scores toward an uniform fixed point cristelli2013measuring ; caldarelli2012network . While the convergence issue can be fixed by a mathematical transformation of the MR variables hausmann2014atlas , the case studies pointed out in Ref. cristelli2013measuring indicate that the MR underestimates the importance of highly diversified countries, such as China and India. Unlike the MR, the non-linear equations that define the FCM favor countries with a diversified export basket and penalize products that are exported by poorly diversified countries tacchella2012new .
However, a quantitative comparison of the quality of the rankings of countries and products by the two methods is still lacking. In this work, we fill this gap by applying both methods on the NBER-UN world trade dataset and by comparing the resulting rankings of countries and products. To evaluate the rankings, we use a metric introduced in the context of ecological networks, the extinction area allesina2009googling . This metric reflects the idea that developed countries are fundamental for the presence of complex products in the world trade, while non-complex products are crucial for the production of developing countries. We find that the FCM clearly outperforms the MR in this respect. This is in agreement with the findings on ecological networks dominguez2015ranking where the FCM has been shown to be the best candidate to rank active and passive species, such as pollinators and plants, according to their importance and vulnerability, respectively.
While the non-linear equations of the FCM introduced in tacchella2012new represent one the simplest mathematical equations that favor countries with diversified exports and penalize products with a large number of exporter countries, their possible generalizations have not been yet applied to world trade data. Here, we study a generalization of the original FCM where the dependence of product complexity on fitness of the countries that export is governed by a tunable parameter . We find that when the ability of the generalized FCM to rank nodes by importance can be improved by changing , the country and product rankings become more sensitive to noise and changes more rapidly with time. This discourages the use of the generalized metric when a significant level of noise is present in the data, as is the case for the world trade data battiston2014metrics .
2 Materials and methods
2.1 Dataset and definition of the country-product network
We use the NBER-UN dataset which has been cleaned and further described in feenstra2005world . We take into account the same list of countries described in hidalgo2007product . For products, we used the same cleaning procedure of Ref. vidmer2015prediction : we removed aggregate product categories and products with zero total export volume for a given year and nonzero total export volume for the previous and the following years. Products and countries with no entries after year 1993 have been removed as well. After the cleaning procedure, the dataset consists of products. To decide if we consider country to be an exporter of product or not, we use the Revealed Comparative Advantage (RCA) balassa1965trade which is defined as
| (1) |
where is the volume of product that country exports measured in thousands of US dollars. RCA characterizes the relative importance of a given export volume of a product by a country in comparison with this product’s exports by all other countries. We use the bipartite network representation introduced in hidalgo2009building , where two kinds of nodes represent countries and products, respectively. All country-product pairs with RCA values above a threshold value–set to here–are consequently joined by links between the corresponding nodes in the bipartite network. We refer to the degree of country and to the degree of product as country ’s diversification and product ’s ubiquity, respectively hidalgo2009building . The adjacency matrix of the resulting network is the only input of the metrics for economic complexity hidalgo2009building ; tacchella2012new . Weighted metrics based on the fraction of the total export instead of provide useful information as well tacchella2012new but are not studied in this work. In the NBER dataset, the complete information about mutual exchanges is only available for a core group of countries. For countries outside this core group, we know only their exchanges with countries inside the core group, but we have actually no information about exchanges between them feenstra2005world . This incompleteness of data makes the robustness against noisy data a crucial element to evaluate the metrics (see Section 3.4). We studied also a restricted dataset that only contains the countries belonging to the core group. We found that neglecting the countries outside the core group can lead to inconsistencies in the rankings due to the loss of information on the exports from developing countries, as we will discuss in Section 3.6.
2.2 Method of reflections (MR)
The Economic Complexity Index by Hidalgo and Hausmann is built on the method of reflections hidalgo2009building ; hausmann2014atlas . This method defines the -th order country scores and product scores in a recursive way
| (2) |
where is the adjacency matrix of the country-product network and , . Ref. hidalgo2009building considers and as generalized measures of diversification and ubiquity, respectively. Products are ranked in order of increasing consistently with the economic interpretation: complex products tend to be less ubiquitous. The Economic Complexity Index based on and is a better predictor of the future economic growth of a country than the existing indicators that do not take the network connectedness into account, such as institutional and education quality measures hausmann2014atlas . However, this method presents both mathematical and conceptual issues tacchella2012new ; cristelli2013measuring ; caldarelli2012network ; tacchella2013economic ; battiston2014metrics . In particular, the interpretation of the scores changes when considering odd or even iteration order , high-order iterations are difficult to interpret, and the process asymptotically converges to a trivial fixed point cristelli2013measuring ; caldarelli2012network . The problem of convergence to an uniform fixed point can be bypassed by defining the final country score as , where and are the average and the standard deviation of scores , respectively. For sufficiently large, is proportional to the -th component of the eigenvector associated to the second largest eigenvalue of the stochastic matrix relating with caldarelli2012network . When the number of iterations becomes large, score differences between countries can become smaller than the computational precision, which is why Ref. hidalgo2009building considers only MR variables for . We consider here only the even iterations and, given that the process described by Eq. (2) converges to a uniform fixed point, we study the ranking for different values of in the range .
2.3 Fitness-Complexity Method (FCM) and its generalization
In the original Fitness-Complexity Method (FCM), the country fitness and product complexity values are defined as the stationary state of the following non-linear iterative process tacchella2012new
| (3) |
where scores are normalized after each step according to
| (4) |
with the initial condition and . The metric defined by Eq. (3) has been shown to be economically well-grounded tacchella2012new ; cristelli2013measuring and to be highly informative about the future economic development of countries cristelli2015heterogeneous . Moreover, the metric has been recently applied beyond its original scope: it has been shown to be the most efficient metric among several network-based metrics in ranking species according to their importance in mutualistic ecological networks dominguez2015ranking . The method has also provided new insights into the long-lasting problem of evaluating the scientific competitiveness of nations cimini2014scientific .
In general, the parameter dependence of an algorithm is an important problem. For example, the dependence of the prominent PageRank algorithm on its only parameter, the teleportation parameter, has been studied in detail (see berkhin2005survey for a review). We study here the generalized FCM defined by the equations pugliese2014convergence
| (5) |
We refer to the scores produced by these equations as generalized fitness and complexity and to as the extremality parameter. Eq. (5) reduces to Eq. (3) for (). Consistently with the economic interpretation of the equations, we restrict our analysis to pugliese2014convergence . The higher the value of , the more sensitive the generalized complexity is to the fitness of the least-fit exporting country. When is sufficiently small we observe a transition to a condensed phase where all score is accumulated by the least ubiquitous product and the country exporting it. To avoid this transition, we study only in the following.
The convergence properties of the algorithm defined by Eq. (5) are highly non-trivial due to the non-linear coupling between fitness and complexity. We do not attempt to study how the convergence properties of the algorithm depend on and simply run iterations of the process defined by Eq. (5). In our dataset is a reasonable choice, because ranking switches are rare for (in agreement with the results presented in Ref. pugliese2014convergence ), involve only low-ranked countries (or products) and their effect on our results is negligible. We also notice that after a larger number of iterations some scores are rounded to zero due to machine precision, which causes a loss of the method’s discriminative power. Our choice allows us to avoid the appearance of these zero scores and the consequent loss of discriminative power.
3 Results
Our main aim is to compare the metrics for economic complexity with respect to different criteria. Here we discuss the results on the NBER-UN dataset described in the Materials and Methods section, focusing on three different years (1996-1998); the results for the different years are in qualitative agreement.
3.1 Correlation between complexity of countries and diversification
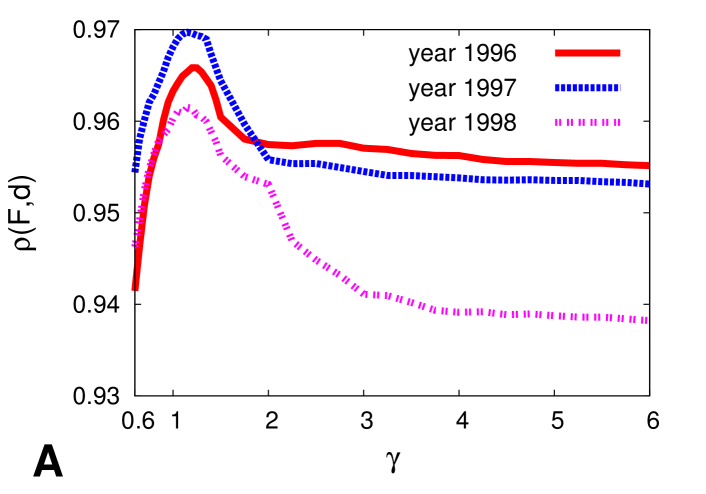
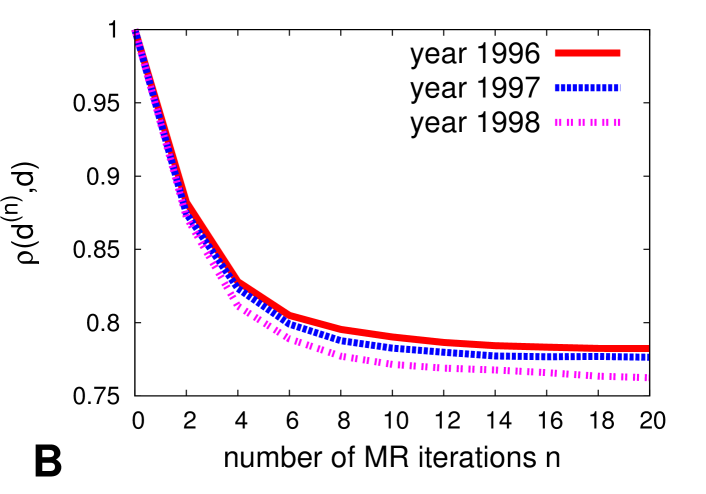
According to the economic complexity interpretation of the international trade, the level of diversification of a country’s exports reflects its level of industrial development. Indeed, in order to produce a certain product, a country must own a variety of appropriate capabilities, which may include suitable climatic conditions, labor skills, strong scientific research, and others. While these capabilities are not measurable in the real world, we can infer a country’s complexity by looking at its export basket: a developed country owns a large number of capabilities and, as a result, is able to export many products. Consequently, we expect a good metric to produce a country ranking that is highly correlated with the ranking by diversification , i.e., with the ranking by number of exported products. Fig. 1 shows the Spearman’s correlation between the rankings produced by different metrics and diversification. For the FCM, is maximal when and decreases as becomes significantly larger than one. For the MR, by definition, and decreases when the number of MR iterations increases, which means that the information about diversification is progressively lost. After two iterations, the correlation of the MR country score with diversification is already considerably smaller than the correlation between fitness and diversification. This loss of information caused by MR iterations is qualitatively in agreement with results on artificial data based on a toy model where capabilities are explicitly defined (see Fig. 12 of Ref. cristelli2013measuring ). The lower correlation with diversification is a negative issue for the MR in view of the interpretation of country complexity as a measure of the diversity of its available capabilities.
3.2 Role of the extremality parameter
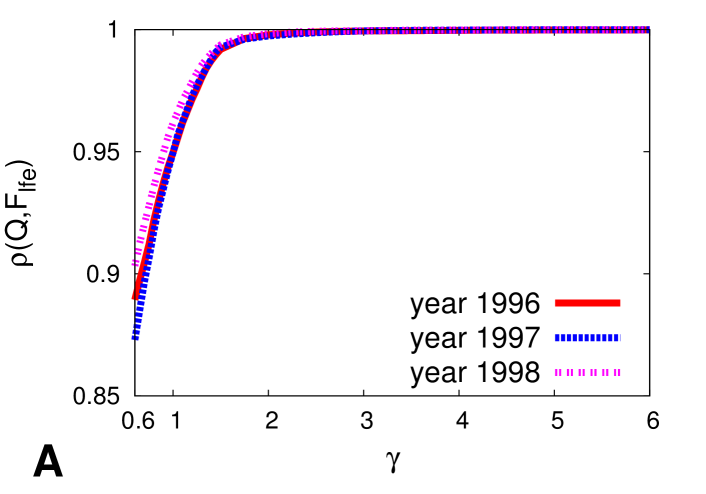
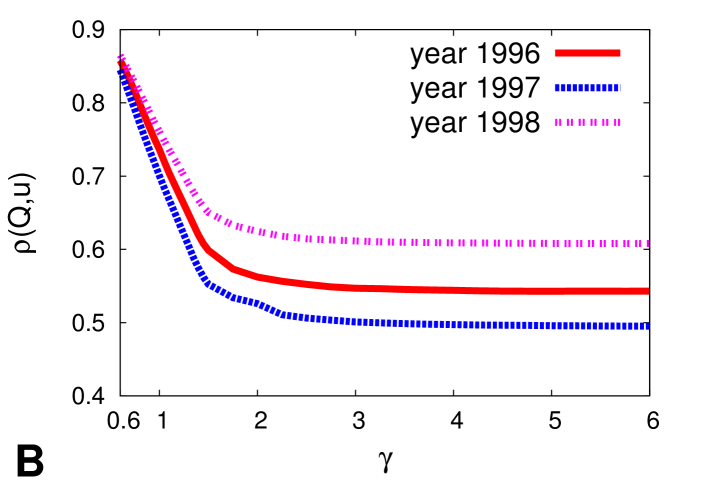
We compare now the product rankings produced by the FCM for different values of . When is large, the sum in Eq. (5) becomes dominated by the term corresponding to the least-fit exporter country, while all other terms become negligible. As a result, when the ranking of countries becomes almost perfectly extremal, i.e., almost perfectly correlated with the ranking of products according to the fitness values of their least-fit exporting countries, as shown in Fig. 2A. Conversely, when is close to one, is also sensitive to the number of terms involved in the sum of terms, i.e., to product ubiquity. For this reason, the Spearman’s correlation between product complexity and ubiquity monotonously decreases with , as shown in Fig. 2B.
3.3 Evaluating economic complexity rankings
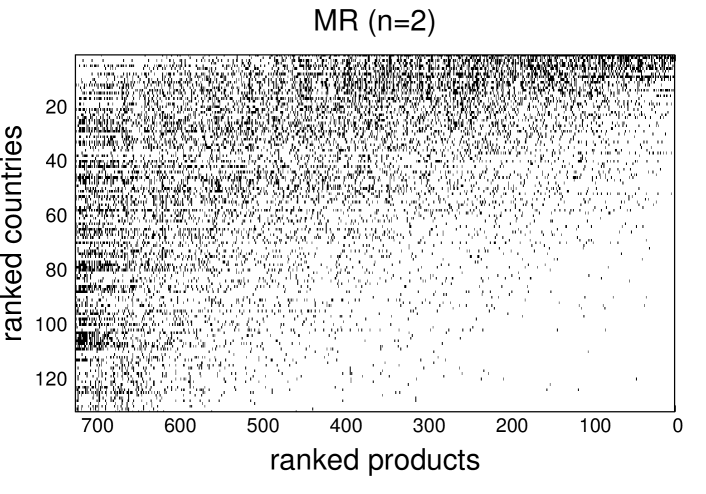
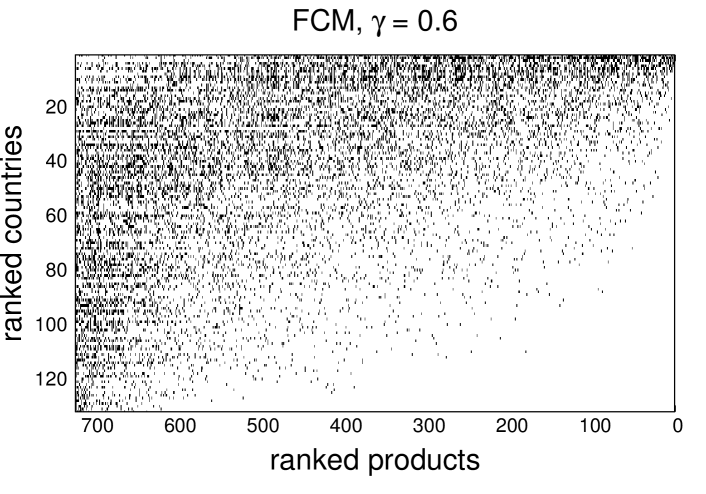
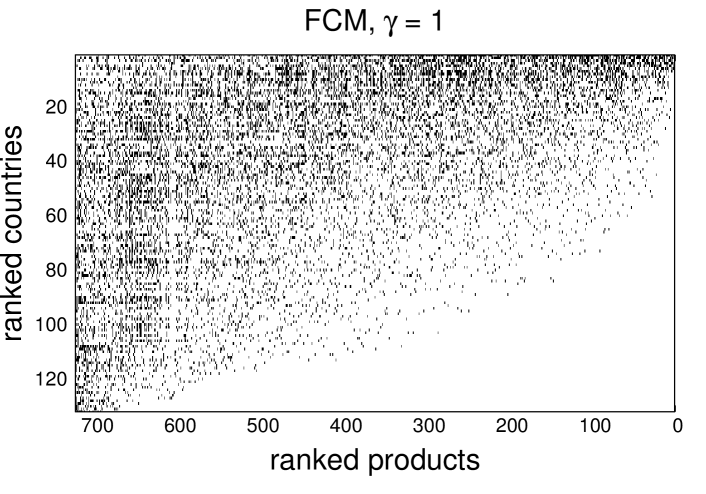
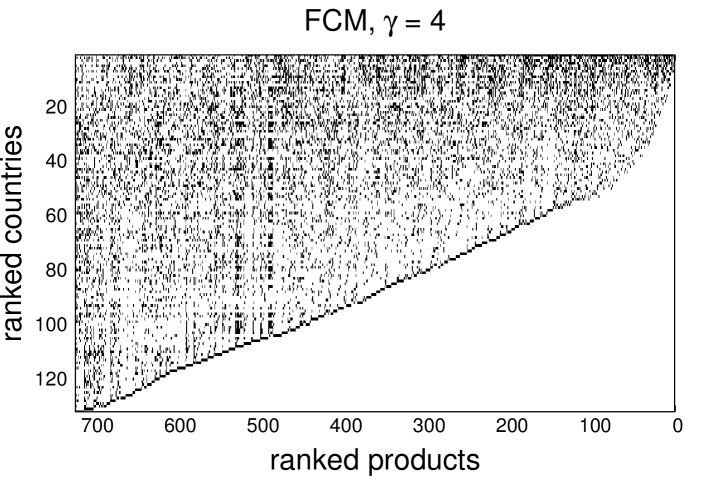
As mentioned before, competitive countries have a highly diversified export basket, while developing countries tend to export ubiquitous products. This property is well captured by the Fitness-Complexity metric tacchella2012new : when arranging the country-product matrix according to ranking, the matrix has a triangular shape. This is also a feature found in ecological systems, such as plant-animal mutualistic networks, where it is referred to as nestedness bascompte2003nested ; bascompte2010structure . Fig. 3 shows the country-product matrices generated by different metrics. Note that the FCM produces a more triangular shape than the MR, meaning that the FCM better captures the nested structure of the international trade than the MR. Moreover, the triangularity improves when increases.
To assess the quality of economic complexity algorithms, we use the extinction area metric which has been introduced in the context of ecological networks. In an ecological network where active species are connected with passive species, the extinction area quantifies the ability of a certain algorithm to rank active (or passive) species by importance (or vulnerability) when active species (or passive) are progressively removed from the system in order of decreasing importance (or increasing vulnerability) allesina2009googling ; dominguez2015ranking . According to this metrics, a good active-species ranking leads to a quick breakdown of the system when active species are progressively removed from the system in order of decreasing importance. We use this metric to evaluate algorithms for economic complexity, assuming that the most important countries and vulnerable products are the most complex countries and products, respectively. This assumption is motivated by the observation that both kinds of systems, ecological networks and the country-product matrix, have a nested structure. For the country-product network, the nested structure implies that the artificial deletion of a complex country must have a strong impact on the system, because it is likely to cause the disappearance of the most complex products from the global market. Conversely, the presence of developing countries tends to be less essential for the existence of products in the market. Similarly, removing non-complex products must strongly impact the economy of developing countries, which are likely to disappear when a sufficient number of non-complex products are removed from the system. In contrast, competitive countries can survive in the market even if many low-quality products are removed from the trade, because of their diversified export basket.
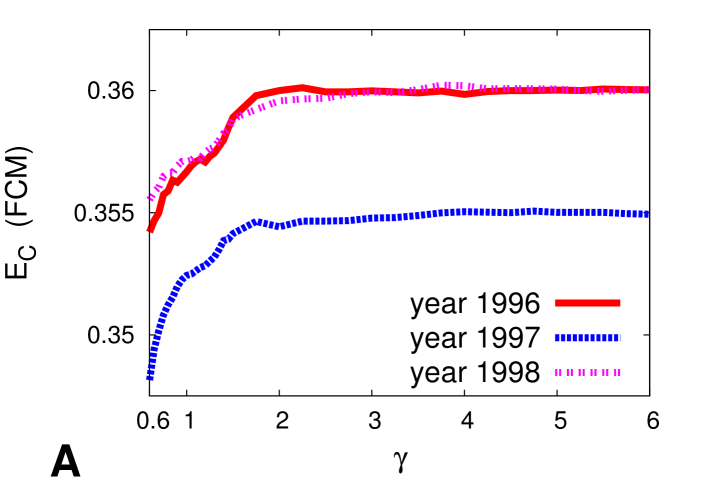
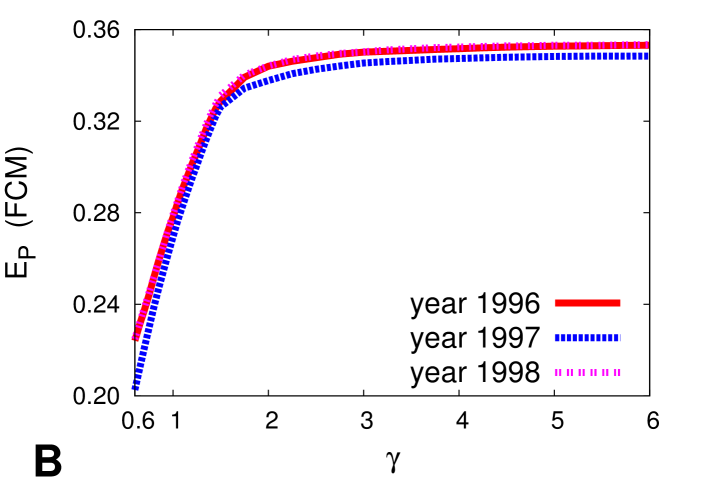
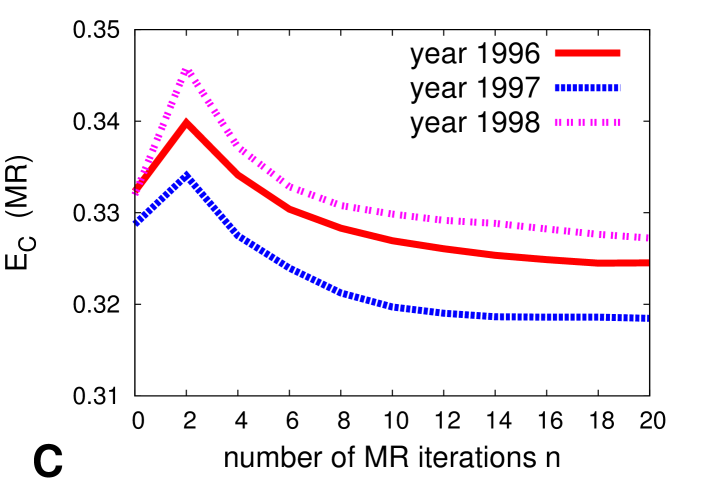
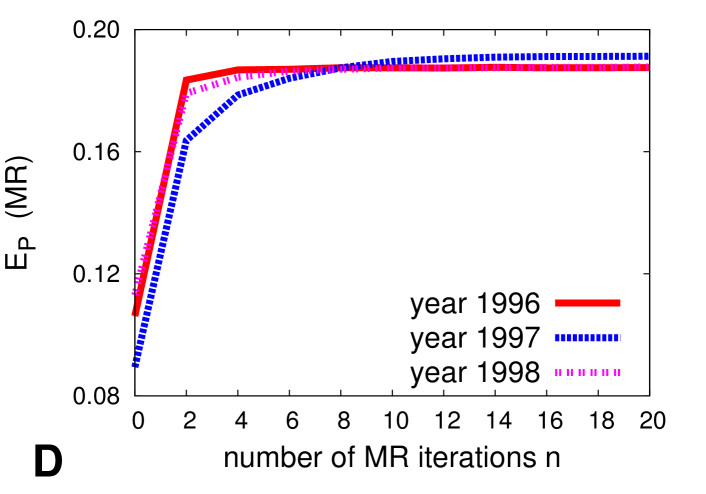
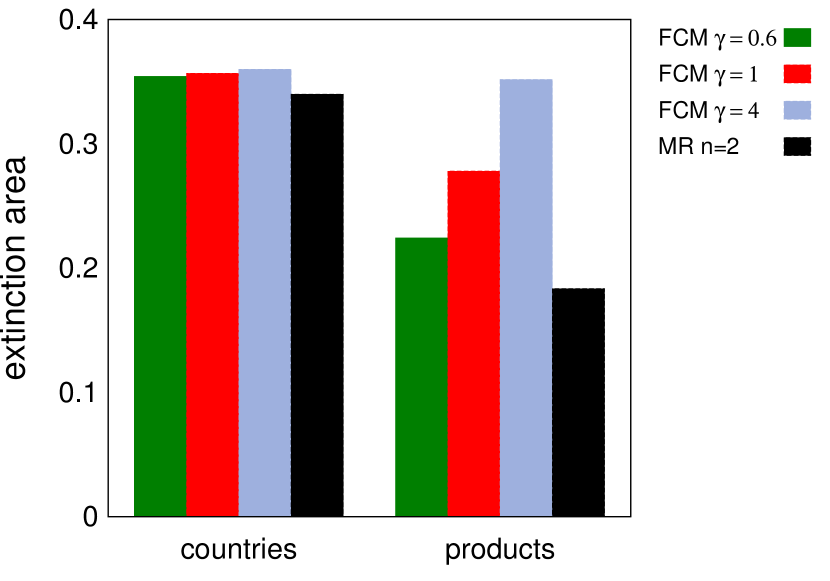
Based on this intuition, a good metric for economic complexity is expected to maximize the extinction areas for countries (hereafter ) and for products (hereafter ). To define , countries (with all their links) are sequentially removed from the network in order of decreasing ranking, from the first in the ranking to the last one. This procedure defines an extinction curve for countries, which is the fraction of extinct products as a function of the fraction of removed countries; is defined as the area below the curve from (no removed countries) to (all countries have been removed). This area is large when important countries are ranked high and are consequently removed early. The extinction area for products is defined analogously as the area below the curve from to , where is the fraction of extinct countries after the removal of a fraction of products (products are removed in order of increasing ranking). Following Ref. dominguez2015ranking , the rankings are not recomputed after every node removal. In the case of ranking ties we consider different randomized rankings and compute the average extinction area.
Fig. 4 (panels A-B) shows the dependence of and on the parameter for the generalized FCM: the extinction areas increase with when , ending in a plateau for , approximately. Fig. 4 (panels C-D) shows the dependence of and on the number of iterations for the MR. For the country ranking, the first two MR iterations (the diversification of country and the average diversification of countries exporting the products exported by country ) are better able to capture the relevance of the country in the world trade than successive iterations. However, the FCM outperforms the MR (see Fig. 5 for a visual comparison of algorithms’ performance). The FCM outperforms the elementary ranking of nodes by diversification [in 1996, whereas ]: despite fitness and diversification are highly correlated, country fitness provides a better estimate of country importance with respect to diversification. For products, the difference between the FCM and the MR is even larger (see Fig. 5). Fig. 4 shows that ubiquity provides a poor estimate of node importance and it is outperformed by the MR scores with . However, the original FCM () performs remarkably better than the MR. This suggests that the extremality property of Eq. (3) is an essential element to correctly rank products, which is confirmed by the monotonous dependence of on for the FCM. The generalized FCM with outperforms the original algorithm () in ranking nodes by importance (see Figs. 4, 5).
3.4 Robustness of rankings against noise
Algorithm robustness against noise is a crucial property when studying incomplete or unreliable data ghoshal2011ranking ; lu2011leaders . Data on international trade contains a substantial fraction of errors battiston2014metrics which may arise from different sources. In some cases information is missing: for instance, our dataset only contains data on the mutual exchanges between countries, while exchanges between countries outside this core group are absent (see Materials and Methods and feenstra2005world ). Moreover, original data sometimes are inaccurate and manually adjusted during the preparation of the dataset, and, in general, data can undergo various cleaning procedures.
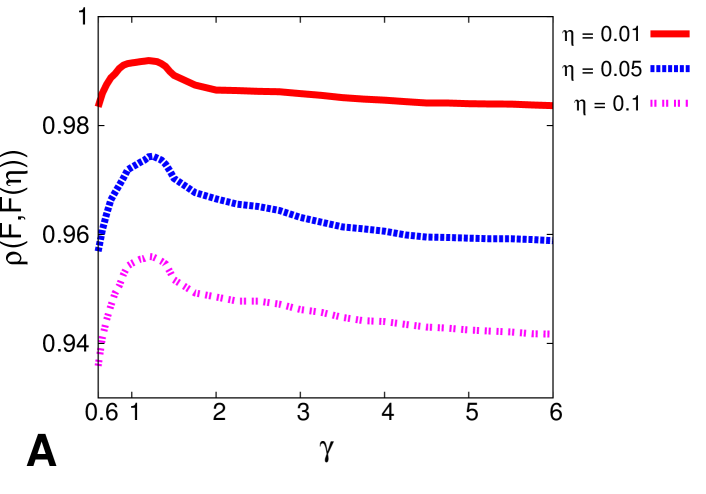
This unreliability of data makes the robustness of an economic complexity metric with respect to noise a key property. To study this robustness property, we use the same method of Ref. battiston2014metrics : we randomly reverse a fraction of elements in the country-product matrix and, for each metric, we compute the Spearman’s correlation between the rankings before and after the reversal. Fig. 6 shows this correlation for three different values of (), that are close to the expected level of noise in the world trade data which is (see Ref. battiston2014metrics for further details). The country ranking produced by the FCM has an optimal stability in the range . For products, when increases, becomes more sensitive to the least-fit exporting country and, as a consequence, the stability of the ranking according to monotonously decreases. These findings imply that high values of should not be used when the level of noise in data is high.
3.5 Ranking volatility
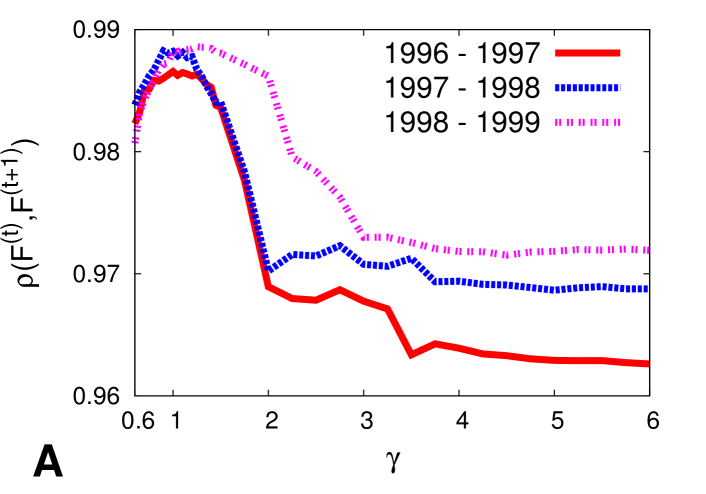
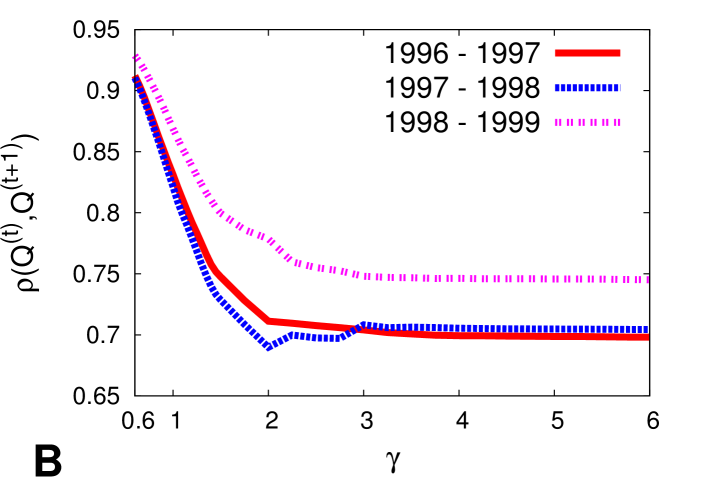
So far we have studied trade data from different years separately. However, another interesting property of a ranking is its volatility, i.e. how the ranking changes with time. In the absence of strong external factors such as a major war or a revolutionary scientific discovery, we expect fitness variations to be slow because a country needs to develop new capabilities to grow its fitness, which is expected to be a time-consuming process lasting several years. We study here the Spearman’s correlation between the rankings produced by a method in two consecutive years. Fig. 7 shows the results in the period 1996-1999. For countries, the correlation shows a maximum close to . By contrast, for products monotonously decreases with , which is another point against the use of large values. These results are in qualitative agreement with those obtained for stability against the random reversal of links (Fig. 6). Moreover, these findings confirm that product complexity variations can be significant in the short-term cristelli2013measuring . This is due to the strong non-linear coupling between fitness and complexity : if a new country starts exporting a certain product, the complexity of that product can change significantly.
3.6 The effect of data incompleteness on the FCM
To understand the effect of data incompleteness on the rankings produced by the FCM, we compute fitness and complexity scores on a restricted dataset where we include only the 72 core countries for which the complete information on mutual trade exchanges is available. While the idea of including only the countries for which the full information is available may seem appealing, we find the results on the restricted dataset misleading as, for example, some apparently simple products such as soy beans appear at top positions of the product complexity ranking. This happens because low-fitness exporters of these products are not included in the restricted dataset. In the case of soy beans, for example, only the United States, Brazil and Argentina exceed the RCA threshold, which directly results in a high complexity score. In the 132-countries dataset that we used through the paper, there are other countries that exceed the RCA threshold, including Malawi and Zambia, and the complexity score of soy beans is correspondingly lower. This example demonstrates that the information on the exports of low-fitness countries is crucial for the FCM because even a single low-fitness country exporting a certain product carries substantial information about the product’s complexity. At the same time, the missing trade exchange information between the 60 non-core countries is comparatively less important because the non-core countries are typically low-fitness countries and the trades between them do not affect the fitness of the most diversified countries. Our choice to use the 132-countries dataset is thus well justified. The missing trades would be crucial only if we were interested in the import-export flows between two specific countries; however, this level of resolution is not needed for our work which focuses on methods that only require the binary matrix as input.
4 Discussion
To summarize, our article shows that the FCM is highly effective in ranking the nodes by importance in the country-product network. This property has already been observed in ecological networks dominguez2015ranking which indicates that the potential range of application of the FCM is broad and not restricted to economic systems. Using the extinction area metric, we provide a quantitative estimate of the performance gap between the FCM and the MR. Our study of the generalized version of the FCM shows that, in general, the optimal choice of the extremality parameter should be based on a tradeoff between the method’s ability to capture the nestedness of the network and the ranking robustness against noise. When the extremality parameter is close to (i.e., close to the value set in the original metric defined by Eq. (3)), the product ranking is determined both by product ubiquity and by the least-fit exporting country, while the correlation between country fitness and diversification is maximal. By choosing around one, we maximize the correlation between the country ranking and diversification, the robustness of the country ranking with respect to noise and the correlation between the country rankings of two consecutive years. When the extremality parameter is large (), the product ranking becomes almost perfectly correlated with the ranking of products by the fitness of the least-fit exporting country. As a consequence, the rankings better capture the importance of nodes to the system stability but, at the same time, they are highly sensitive to noise and volatile. For this reason, we believe that the metric with large should not be applied to noisy data, such as the world trade data, whereas it could still be informative when applied to high-quality data.
Our findings deepen our understanding of the Fitness-Complexity method and have potential implications for all the systems where the method has been applied, including ecological networks dominguez2015ranking and the bipartite network of countries and academic fields cimini2014scientific . We stress that our findings are based on the evaluation of the rankings on the country-product networks corresponding to different years. The two methods has been also used to predict the future exports vidmer2015prediction and the future economic growth of a country hausmann2014atlas ; cristelli2015heterogeneous , but which of the two metrics has more predictive power remains unclear. The comparison between the studied network-based metrics with respect to their predictive power has not been addressed in this work, and may constitute an interesting direction for future research on Economic Complexity.
Acknowledgements
We thank Luciano Pietronero and Matthieu Cristelli for relevant suggestions for the preparation of the dataset and useful discussions on the interpretation of our results. This work was supported by the EU Project nr. 611272 GROWTHCOM.
Author contribution statement
All authors designed the research; M.S.M. and A.V. wrote the code to perform the experiments; all authors analyzed the data; M.S.M., M.M. and A.V. wrote the manuscript; all authors reviewed the manuscript.
References
- (1) D. Ricardo, Principles of political economy and taxation (G. Bell and sons, 1891)
- (2) P.M. Romer, Journal of Political Economy 98(5 pt 2) (1990)
- (3) G.M. Grossman, E. Helpman, The Review of Economic Studies 58(1), 43 (1991)
- (4) C.A. Hidalgo, R. Hausmann, Proceedings of the National Academy of Sciences 106(26), 10570 (2009)
- (5) A. Tacchella, M. Cristelli, G. Caldarelli, A. Gabrielli, L. Pietronero, Scientific Reports 2 (2012)
- (6) S. Brin, L. Page, Computer Networks and ISDN Systems 30(1), 107 (1998)
- (7) R. Hausmann, C.A. Hidalgo, The atlas of economic complexity: Mapping paths to prosperity (MIT Press, 2014)
- (8) J. Felipe, U. Kumar, A. Abdon, M. Bacate, Structural Change and Economic Dynamics 23(1), 36 (2012)
- (9) S. Poncet, F.S. De Waldemar, World Development 51, 104 (2013)
- (10) Z. Cheng, T. Dongfeng, L. Xiangqian, The hidden capabality network of product space, in Service Operations and Logistics, and Informatics (SOLI), 2013 IEEE International Conference on (IEEE, 2013), pp. 567–571
- (11) M. Cristelli, A. Gabrielli, A. Tacchella, G. Caldarelli, L. Pietronero, PLoS ONE 8(8), e70726 (2013)
- (12) G. Caldarelli, M. Cristelli, A. Gabrielli, L. Pietronero, A. Scala, A. Tacchella, PLoS ONE 7(10), e47278 (2012)
- (13) A. Tacchella, M. Cristelli, G. Caldarelli, A. Gabrielli, L. Pietronero, Journal of Economic Dynamics and Control 37(8), 1683 (2013)
- (14) F. Battiston, M. Cristelli, A. Tacchella, L. Pietronero, Complexity Economics 1(1), 1 (2014)
- (15) S. Allesina, M. Pascual, PLoS Computational Biology 5(9), e1000494 (2009)
- (16) V. Domínguez-García, M.A. Muñoz, Scientific Reports 5 (2015)
- (17) R.C. Feenstra, R.E. Lipsey, H. Deng, A.C. Ma, H. Mo, NBER Working Paper (11040) (2005)
- (18) C.A. Hidalgo, B. Klinger, A.L. Barabási, R. Hausmann, Science 317(5837), 482 (2007)
- (19) A. Vidmer, A. Zeng, M. Medo, Y.C. Zhang, Physica A: Statistical Mechanics and its Applications 436, 188 (2015)
- (20) B. Balassa, The Manchester School 33(2), 99 (1965)
- (21) M. Cristelli, A. Tacchella, L. Pietronero, PLoS ONE 10(2), e0117174 (2015)
- (22) G. Cimini, A. Gabrielli, F.S. Labini, PLoS ONE 9(12), e113470 (2014)
- (23) P. Berkhin, Internet Mathematics 2(1), 73 (2005)
- (24) E. Pugliese, A. Zaccaria, L. Pietronero, arXiv preprint arXiv:1410.0249 (2014)
- (25) J. Bascompte, P. Jordano, C.J. Melián, J.M. Olesen, Proceedings of the National Academy of Sciences 100(16), 9383 (2003)
- (26) J. Bascompte, Science 329(5993), 765 (2010)
- (27) G. Ghoshal, A.L. Barabási, Nature Communications 2, 394 (2011)
- (28) L. Lü, Y.C. Zhang, C.H. Yeung, T. Zhou, PLoS ONE 6(6), e21202 (2011)