Thermal conductivity of monolayer MoS2, MoSe2, and WS2: Interplay of mass effect, interatomic bonding and anharmonicity
Abstract
Phonons are essential for understanding the thermal properties in monolayer transition metal dichalcogenides, which limit their thermal performance for potential applications. We investigate the lattice dynamics and thermodynamic properties of MoS2, MoSe2, and WS2 by first principles calculations. The obtained phonon frequencies and thermal conductivities agree well with the measurements. Our results show that the thermal conductivity of MoS2 is highest among the three materials due to its much lower average atomic mass. We also discuss the competition between mass effect, interatomic bonding and anharmonic vibrations in determining the thermal conductivity of WS2. Strong covalent W-S bonding and low anharmonicity in WS2 are found to be crucial in understanding its much higher thermal conductivity compared to MoSe2.
I Introduction
Monolayer transition metal dichalcogenides, MX2 (M = Mo, W; X = S, Se), have aroused much interest recently due to their remarkable properties for applications in next-generation nanoelectronic and energy conversion devices Ferrari Andrea C and et. al. (2015); Klinovaja and Loss (2013); Buscema et al. (2013). Since all these applications are closely related to its thermal properties, it is necessary to investigate the lattice dynamics and thermodynamic properties of MX2. For instance, high-performance electronic devices strongly depend on high thermal conductivity for highly efficient heat dissipation, while low thermal conductivity is preferred in thermoelectric application.
In semiconductors, heat is carried by the atomic vibrations that are quantized as phonons Ziman (1960). Theoretical predictions based on the phonon Boltzmann transport equation have found that monolayer WS2 has the highest thermal conductivity (142 W/mK) at room temperature, then followed by MoS2 (103 W/mK) and MoSe2 (54 W/mK) Gu and Yang (2014). However, the measured thermal conductivity for monolayer MoS2 and WS2 is W/mK Yan et al. (2014) and 32 W/mK Peimyoo et al. (2015), respectively, which is much lower than the theoretical predictions. Furthermore, various phonon properties such as interatomic bonding and anharmonic vibrations still lack a unified understanding. The parameters that affect phonon transport include crystal structure, atomic mass, interatomic bonding, and anharmonicity Slack (1973); Lindsay et al. (2013); Jain and McGaughey (2014). Generally there are four rules for finding a nonmetallic crystal with higher thermal conductivity, including (i) lower average atomic mass, (ii) stronger interatomic bonding, (iii) simpler crystal structure, and (iv) lower anharmonicity Slack (1973). All monolayer MX2 compounds have similar crystal structures, while conditions (i) and (ii) imply a larger Debye temperature, and condition (iv) means smaller Grüneisen parameter. Recent theoretical investigation has provided a quantitative analysis of the roles of mass, structure, and bond strength in thermal expansion and thermomechanics of MX2 Huang and Zeng (2015). However, the roles of mass, interatomic bonding, and anharmonic vibrations in phonon transport still remain uninvestigated. Clear knowledge of the underlying physics will be helpful for understanding and modulating the thermal transport in MX2, for example, through doping other M or X atoms Gong et al. (2014); Dumcenco et al. (2013).
Here we investigate fundamental vibrational properties to understand thermal transport in MoS2, MoSe2, and WS2. The measured phonon frequencies are well reproduced in our calculations. The thermodynamic properties are calculated within quasi-harmonic approximation, and the calculated thermal conductivities agree well with the measurements. Combining first principles calculations and the Slack model, the roles of mass, interatomic bonding, and anharmonicity in thermal transport are clearly revealed.
II Methodology
All calculations are implemented in the Vienna ab initio simulation package (VASP) based on the density functional theory (DFT) method Kresse and Furthmüller (1996). The Perdew, Burke, and Ernzerhof (PBE) parametrization within the generalized gradient approximation (GGA) is used for the exchange-correlation functional. A plane-wave basis set is employed with the kinetic energy cutoff of 600 eV. A 15151 k-mesh is used during structural relaxation for the unit cell until the energy differences are converged within 10-6 eV, with a Hellman-Feynman force convergence threshold of 10-4 eV/Å. We maintain the interlayer vacuum spacing larger than 12 Å to eliminate the interaction with periodic boundary condition.
In the calculation of phonon dispersion, the harmonic interatomic force constants (IFCs) are obtained by density functional perturbation theory (DFPT) using the supercell approach, which calculates the dynamical matrix through the linear response of electron density Baroni et al. (2001). The 551 supercell with 551 k-mesh is used to ensure the convergence. The phonon dispersion is obtained using the Phonopy code with the harmonic IFCs as input Togo et al. (2008).
III Results and discussion
III.1 Crystal structures
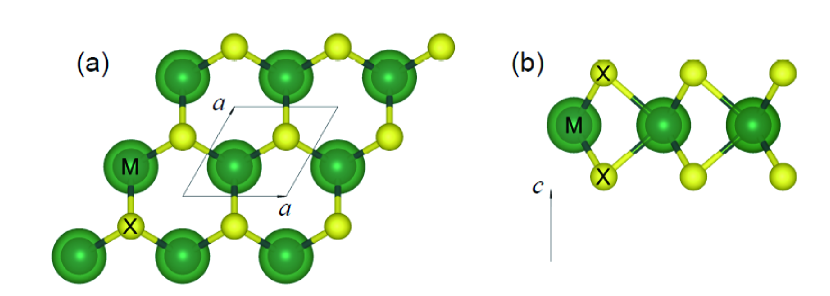
Monolayer MX2 has honeycomb structure with space group Molina-Sánchez and Wirtz (2011) as shown in fig. 1. An M atom layer is sandwiched between two X atom layers, connected by covalent bonds. The optimized lattice parameters of all studied MX2 are shown in table 1. Our GGA calculations overestimate the lattice parameters by 0.16%, 0.36%, and 0.29%, respectively, which is a general feature of the GGA functional.
| MoS2 | MoSe2 | WS2 | |
| (Å) | 3.165 (3.160 a) | 3.300 (3.288 a) | 3.163 (3.154 b) |
| (eV) | 1.81 (1.88 c) | 1.56 (1.57 d) | 1.97 (1.95 e) |
| a Reference Coehoorn et al. (1987) | |||
| b Reference Matthäus et al. (1997) | |||
| b Reference Mak et al. (2010) | |||
| b Reference Tonndorf et al. (2013) | |||
| b Reference Gutiérrez et al. (2013) | |||
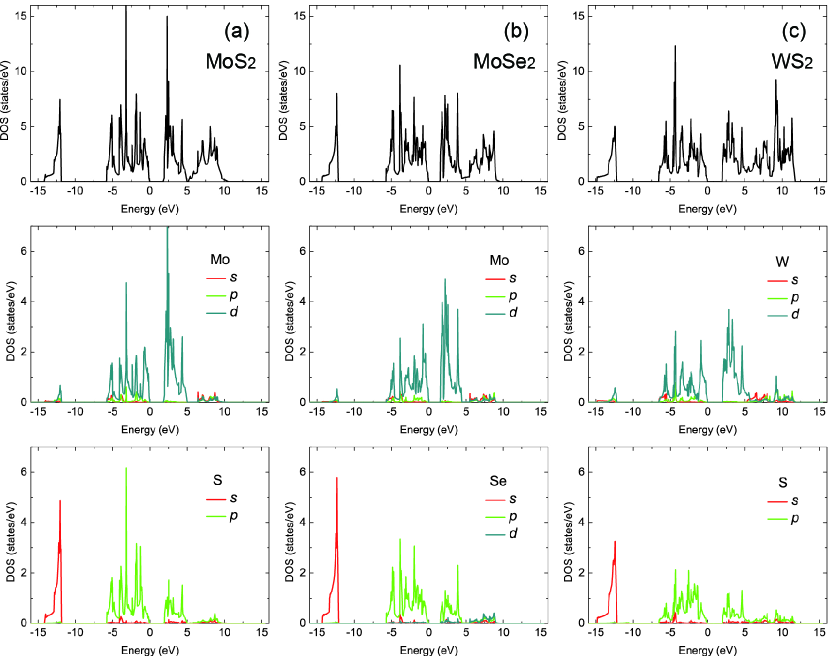
The electronic structures of all studied MX2 are calculated by DFT method. As shown in table 1, the calculated band gap is consistent with the measurements Mak et al. (2010); Tonndorf et al. (2013); Gutiérrez et al. (2013). The total and atom projected density of states (DOS) are shown in fig. 2. The total DOS from -7 to 10 eV is mainly composed of M- and X- states, and the bands on each side of the band gap originate primarily from M- states, which is in agreement with previous work Kumar and Ahluwalia (2012). Due to a less localized DOS of W atoms, the overlap between W- and S- state in the valence band of WS2 from -7 to 0 eV is larger than other two materials , indicating a strong covalent bonding. Similar large overlap between W- and S- state in WS2 from 0 to 12 eV tends to increase the widths of the conduction bands.
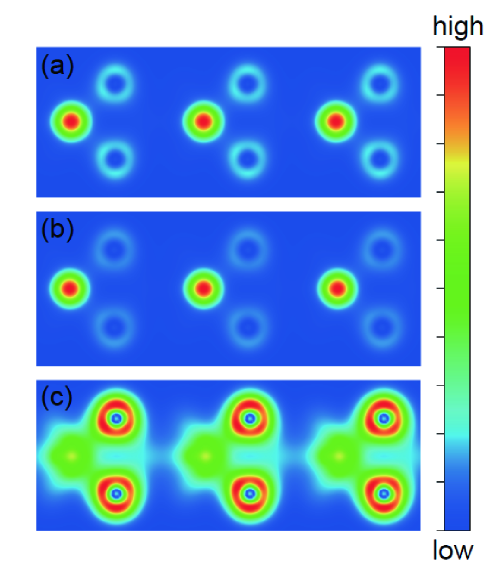
Fig. 3 presents the electronic charge density of all studied MX2 in the [] plane. For MoS2 and MoSe2, the highest charge density is found to be on the Mo atoms due to the strongly localized DOS of Mo atoms, while for WS2, S atoms have the highest charge density. As shown in fig. 3, the W-S bonding is the strongest, whereas the Mo-Se bonding is weaker than the Mo-S bonding, which is consistent with the projected DOS in fig. 2. Usually, strong interatomic bonding and low average atomic mass imply a large Debye temperature, leading to a high thermal conductivity. From fig. 2, it is found that the state of transition metal M play an important role in determining the interatomic bonding, which will further affect the heat transport in these three materials.
III.2 Phonon spectra
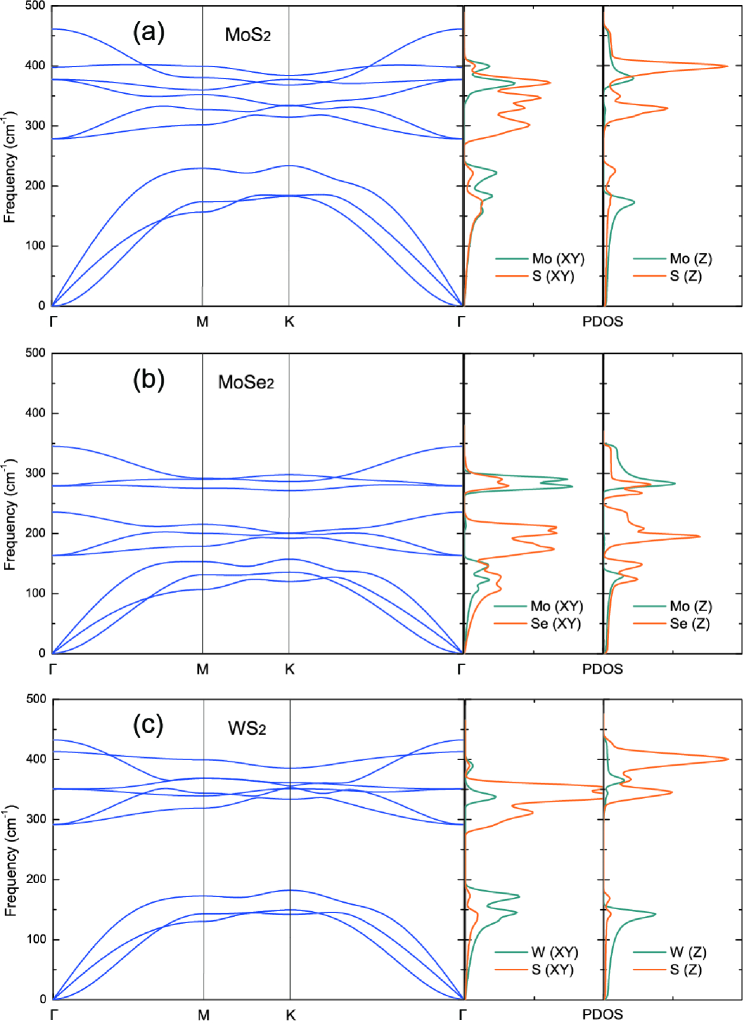
The phonon spectra of all studied MX2 structures are calculated using the supercell approach, with the real-space force-constants calculated in the density-functional perturbation theory (DFPT) Baroni et al. (2001) within the Phonopy code Togo et al. (2008). Fig. 4 presents the phonon spectra along several high symmetry directions, together with the corresponding projected phonon density of states (PDOS). The primitive cell of monolayer MX2 contains 3 atoms, corresponding to three acoustic and six optical phonon branches. The average acoustic Debye temperature for monolayer MX2 is determined from Morelli and Heremans (2002)
| (1) |
where for each acoustic branch ( LA, TA) is defined as
| (2) |
where is Planck constant, is the phonon frequency at the zone boundary of the -th acoustic mode, and is Boltzmann constant. The calculated Debye temperature for MoS2, MoSe2, and WS2 are 262.3 K, 177.6 K, and 213.6 K, respectively, which is in good agreement with previous results, 260-320 K for MoS2 estimated from specific-heat measurement Touloukian and Buyco (1970), 197.36.6 K for MoSe2 estimated from photoconductivity measurements Hu et al. (2006), 210 K for WS2 estimated from the Lindemann formula Ho et al. (1998).
Concerning thermal vibrations and the bonding forces, the Debye temperature is a measure of the temperature above which all modes begin to be excited and below which modes begin to be frozen out Nakashima and Umakoshi (1992). We first investigate the relation between vibrational modes and the Debye temperature by calculating the projected PDOSs for the M(XY), M(Z), X(XY), and X(Z) vibrations in MX2 stuctures as shown in fig. 4. Similar to the diatomic linear chain model, the scale of the acoustic (optical) phonon branch is dominated by atoms with larger (smaller) mass in three materials. As the mass ratio of all studied MX2 () in table 2 show, the acoustic phonon vibration in the PDOS is governed by the larger mass. The mass ratio of MoS2 is most close to 1, while that of WS2 is much larger 1. Therefore the low-frequency acoustic phonon branches of MoS2 up to 233.9 cm-1 are mainly from the Mo(XY), Mo(Z) and S(XY) vibrations due to similar mass, whereas those of WS2 up to 182.3 cm-1 are mainly from the W(XY) and W(Z) vibrations due to the much larger mass of W atoms. In contrast to other two materials, the mass of transition metal atoms in MoSe2 is smaller than the mass of chalcogenide atoms. Thus, although all Mo(XY), Mo(Z), Se(XY), and Se(Z) vibrations contribute significantly to the low-frequency branches of MoSe2 up to 157.5 cm-1, the PDOS of the Se(XY) and Se(Z) vibrations is higher than other two vibrations due to the relatively larger mass of Se atoms.
Furthermore, low average atomic mass , besides the strong interatomic bonding mentioned above, can lead to a large Debye temperature as well. The mass differences in MoS2, MoSe2, and WS2 are also shown in table 2. For MoS2 and MoSe2 which have similar bonding characteristics as shown in fig. 3, the of MoS2 is approximately two thirds the of MoSe2, and the calculated is about 1.5 times larger. For WS2, although it has close mass to MoSe2, the strong covalent W-S bonding as shown in fig. 3, can result in relatively larger Debye temperature as implied in previous work Lindsay et al. (2013). Therefore, although the average atomic mass plays a key role in determining the Debye temperature, the effect of interatomic bonding can not be neglected and should be taken into account when studying the thermal transport properties of monolayer MX2.
| Structure | (amu) | (K) | |
|---|---|---|---|
| MoS2 | 1.50 | 53.36 | 262.3 |
| MoSe2 | 0.61 | 84.63 | 177.6 |
| WS2 | 2.87 | 82.66 | 213.6 |
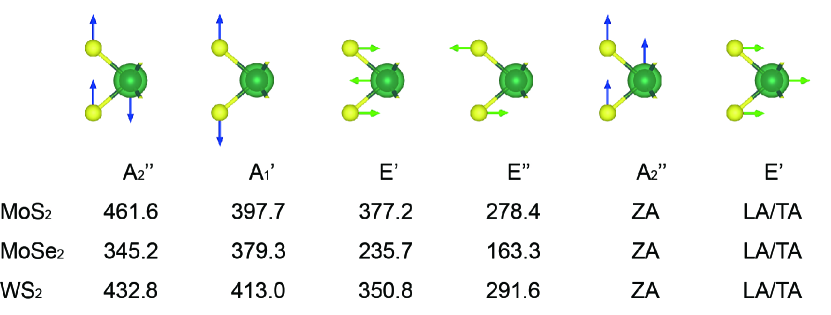
In addition, we investigate the vibrational mode of all studied MX2. Since the monolayer MX2 belongs to the point group, the optical lattice-vibration modes at point can be thus decomposed as
| (3) |
where IR and R denote infrared- and Raman-active mode respectively. Table 3 lists the optical phonon frequencies at the point. The calculated phonon frequencies are in agreement with the experimental results, and the discrepancy is less than 3%. The LO/TO splitting is very small and can be neglected here Cai et al. (2014); Luttrell et al. (2006).
| Structure | ||||
|---|---|---|---|---|
| MoS2 | 278.4 (283 a) | 377.2 (385 a) | 397.7 (404 a) | 461.6 (470 b) |
| MoSe2 | 163.3 (167 c) | 235.7 (240 c) | 279.3 (282 c) | 345.2 (351 c) |
| WS2 | 291.6 (298 a) | 350.8 (357 a) | 413.0 (419 a) | 432.8 (438 d) |
| a Reference Zhang et al. (2015) | ||||
| b Reference Wieting and Verble (1971) | ||||
| c Reference Late et al. (2014) | ||||
| d Reference Luttrell et al. (2006) | ||||
The schematic vibrations for the phonon modes are shown in fig. 5, where one and one are acoustic modes, the other () are IR (both IR and R) active as shown in Eq. (3). and modes vibrate along the -direction, and and modes vibrate in the direction. As shown before in fig. 4, in the case of in monolayer MoS2, the Mo and S atoms vibrate with similar amplitudes; for in MoS2, the vibrations of Mo atoms have much larger amplitudes. For both and in monolayer MoSe2, the Se atoms vibrate with greater amplitudes than Mo atoms. The vibration of W atoms dominates S atoms in both and vibrational modes in monolayer WS2 due to the large .
III.3 Thermodynamic properties
The Grüneisen parameter , which describes the thermal expansion of a crystal on its vibrational properties, provides information on the anharmonic interactions. The larger the Grüneisen parameter indicates the stronger anharmonic vibrations. The expression for the Grüneisen parameter is given by Grimvall (1999); Shao et al. (2015)
| (4) |
where is the linear thermal expansion coefficient, is the bulk modulus, is the molar volume, and is the isometric heat capacity.
Table 4 compares the calculated isometric heat capacity, bulk modulus, and linear thermal expansion coefficient with experimental results at 300 K. The isometric heat capacity can be calculated as
| (5) |
where is temperature, and is the phonon frequency of the -th branch with wave vector q. The calculated values of for , , and at room temperature are in good agreement with the experimental results Volovik et al. (1978); Blinder and Trofimova (1993); O’hare et al. (1984). The bulk modulus and linear thermal expansion coefficient are calculated using the quasi-harmonic approximation (QHA), which takes the first-order anharmonicity into account Togo et al. (2008). The obtained for is in agreement with the experimental value Aksoy et al. (2006). For , the computed is fallen in the range of measured values Aksoy et al. (2008); Zhao et al. (2015). The great discrepancies between the calculated and experimental are seen for . Since the bulk modulus is used to describe the stiffness of MX2 Huang and Zeng (2015), the bonding in monolayer WS2 is found to be much stiffer comparing to other two materials. The calculated for MoS2 and MoSe2 at 300 K is is fallen in the range of measured values Late et al. (2014); Dudnik and Kh. (1966); El-Mahalawy and Evans (1976), while larger than the measured for WS2.
| Structure | |||
|---|---|---|---|
| MoS2 | 62.97 (63.55 a) | 52.3 (53.41.0 b) | 17.4 (10.7 c) (82 d) |
| MoSe2 | 68.75 (68.60 e) | 57.3 (45.70.3 f) (62 g) | 19.5 (7.24 h) (105 d) |
| WS2 | 63.49 (63.820.32 i) | 77.9 (611 j) | 14.8 (6.35 k) |
| a Reference Volovik et al. (1978) | |||
| b Reference Aksoy et al. (2006) | |||
| c Reference Dudnik and Kh. (1966) | |||
| d Reference Late et al. (2014) | |||
| e Reference Blinder and Trofimova (1993) | |||
| f Reference Aksoy et al. (2008) | |||
| g Reference Zhao et al. (2015) | |||
| h Reference El-Mahalawy and Evans (1976) | |||
| i Reference O’hare et al. (1984) | |||
| j Reference Selvi et al. (2006) | |||
| k Reference Matthäus et al. (1997) | |||
As shown in fig. 6, the temperature-dependent Grüneisen parameter is calculated using Eq. (4). The Grüneisen parameter can also be calculated by averaging the mode Grüneisen parameter ,
| (6) |
where is the mode heat capacity. The mode Grüneisen parameter is given by
| (7) |
where is the equilibrium lattice constant at 0 K. Fig. 6 also shows the calculated , which is consistent with the Grüneisen parameter calculated using Eq. (4).
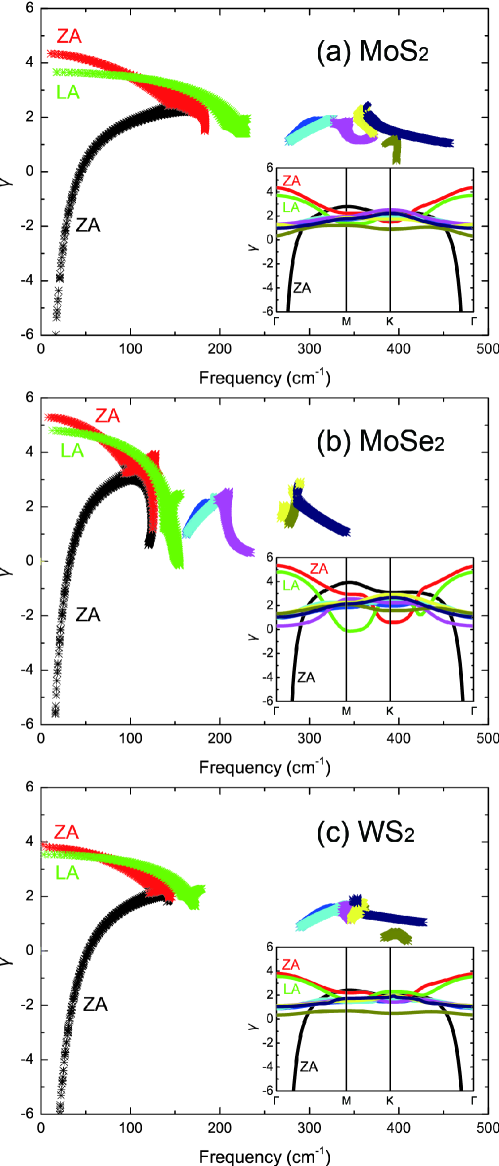
The frequency dependence of mode Grüneisen parameter of MoS2 in the irreducible BZ is plotted in fig. 7, and the mode Grüneisen parameter along symmetry directions is shown in the inset. Similar to diamond, graphite and graphene Mounet and Marzari (2005), negative is observed at low frequencies (under 50 cm-1 in MoS2). The average Grüneisen parameter is negative at low temperatures because only the low-frequency phonons are excited, as shown in fig. 6. Our results are in agreement with previous calculations Huang et al. (2014); Sevik (2014). The calculated at room temperature is 1.22, 1.20, and 1.15 for MoS2, MoSe2, and WS2, respectively, indicating that MoS2 has the strongest bonding anharmonicity among three materials, while WS2 has the weakest anharmonic vibrations. The bonding anharmonicity obtained from analysing the of all studied MX2 is consistent with previous work Huang and Zeng (2015).
According to Slack’s expression Slack (1973); Morelli and Heremans (2002), assuming that only the acoustic phonon modes participate in the heat conduction process, the lattice thermal conductivity in the temperature range where three-phonon scattering is dominant, can be given as
| (8) |
where is the average mass of an atom in the crystal, is the volume per atom, is the number of atoms in the primitive unit cell, and is a constant which is given by Julian (1965)
| (9) |
when the units of , , and are taken as W/mK, amu, and Å, respectively. The obtained lattice thermal conductivity for monolayer MoS2, MoSe2, and WS2 at room temperature is 33.6 W/mK, 17.6 W/mK, and 31.8 W/mK, respectively, which is in good agreement with the experimental value of W/mK for monolayer MoS2 Yan et al. (2014), and 32 W/mK for monolayer WS2 Peimyoo et al. (2015). Although there is no experimental value for monolayer MoSe2, our calculated is a reasonable prediction.
The Slack’s expression attempts to normalize the effect of mass density, crystal structure, interatomic bonding, and anharmonicity Slack (1973); Lindsay et al. (2013); Jain and McGaughey (2014). MoS2, MoSe2, and WS2 have similar crystal structure. The factor in Eq. (8) is maximized for light mass, strong bonded crystals, because low average atomic mass and strong interatomic bonding lead to a high , and the term dominates the behaviour Slack (1973). The Debye temperature reflects the magnitude of sond velocity. Higher Debye temperature results in increased phonon velocities, and increased acoustic-phonon frequencies as mentioned above, which suppress phonon-phonon scattering by decreasing phonon populations. Therefore the high thermal conductivity of MoS2 is related to its high Debye temperature, which is due to its much lower average atomic mass.
Recent theoretical work has predicted that monolayer WS2 has the highest thermal conductivity among all studied MX2 at room temperature due to a large frequency gap between its acoustic and optic phonons Gu and Yang (2014), which originates in its larger mass ratio . Our results suggest that the average atomic mass plays a key role in determining the phonon dispersion of MoS2 and WS2, and subsequently determines the Debye temperature from which the phonon velocities can be estimated. In addition, although WS2 has similar average atomic mass to MoSe2, its strong W-S bonding leads to a higher Debye temperature. Furthermore, small of WS2 means low anharmonicity, which also results in a higher thermal conductivity. Therefore the thermal conductivity of WS2 is determined by the competition between high average atomic mass, strong covalent W-S bonding and low anharmonicity.
IV Conclusion
In summary, we investigate the lattice dynamics and thermodynamic properties of MoS2, MoSe2, and WS2 by first principles calculations. The obtained phonon frequencies and lattice thermal conductivity agree well with experimental measurements. Our calculations show that the thermal conductivity of MoS2 is highest among the three materials due to its large Debye temperature, which is attributed to the lowest average atomic mass. We also find that WS2 has stronger covalent W-S bonding and lower anharmonicity, leading to much higher thermal conductivity compared to MoSe2.
Acknowledgement
This work is supported by the National Natural Science Foundation of China under Grants No. 11374063 and 11404348.
References
References
- Ferrari Andrea C and et. al. (2015) B. F. Ferrari Andrea C and et. al., Nanoscale 7, 4598 (2015).
- Klinovaja and Loss (2013) J. Klinovaja and D. Loss, Phys. Rev. B 88, 075404 (2013).
- Buscema et al. (2013) M. Buscema, M. Barkelid, V. Zwiller, H. S. J. van der Zant, G. A. Steele, and A. Castellanos-Gomez, Nano Letters 13, 358 (2013).
- Ziman (1960) J. M. Ziman, Electrons and Phonons: The Theory of Transport Phenomena in Solids (Oxford University Press, 1960).
- Gu and Yang (2014) X. Gu and R. Yang, Applied Physics Letters 105, 131903 (2014).
- Yan et al. (2014) R. Yan, J. R. Simpson, S. Bertolazzi, J. Brivio, M. Watson, X. Wu, A. Kis, T. Luo, A. R. Hight Walker, and H. G. Xing, ACS Nano 8, 986 (2014).
- Peimyoo et al. (2015) N. Peimyoo, J. Shang, W. Yang, Y. Wang, C. Cong, and T. Yu, Nano Research 8, 1210 (2015).
- Slack (1973) G. A. Slack, Journal of Physics and Chemistry of Solids 34, 321 (1973).
- Lindsay et al. (2013) L. Lindsay, D. A. Broido, and T. L. Reinecke, Phys. Rev. Lett. 111, 025901 (2013).
- Jain and McGaughey (2014) A. Jain and A. J. McGaughey, Journal of Applied Physics 116, 073503 (2014).
- Huang and Zeng (2015) L.-F. Huang and Z. Zeng, The Journal of Physical Chemistry C 119, 18779 (2015).
- Gong et al. (2014) Y. Gong, Z. Liu, A. R. Lupini, G. Shi, J. Lin, S. Najmaei, Z. Lin, A. L. Elías, A. Berkdemir, G. You, et al., Nano Letters 14, 442 (2014).
- Dumcenco et al. (2013) D. O. Dumcenco, H. Kobayashi, Z. Liu, Y.-S. Huang, and K. Suenaga, Nat Commun 4, 1351 (2013).
- Kresse and Furthmüller (1996) G. Kresse and J. Furthmüller, Phys. Rev. B 54, 11169 (1996).
- Baroni et al. (2001) S. Baroni, S. de Gironcoli, A. Dal Corso, and P. Giannozzi, Rev. Mod. Phys. 73, 515 (2001).
- Togo et al. (2008) A. Togo, F. Oba, and I. Tanaka, Phys. Rev. B 78, 134106 (2008).
- Molina-Sánchez and Wirtz (2011) A. Molina-Sánchez and L. Wirtz, Phys. Rev. B 84, 155413 (2011).
- Coehoorn et al. (1987) R. Coehoorn, C. Haas, J. Dijkstra, C. J. F. Flipse, R. A. de Groot, and A. Wold, Phys. Rev. B 35, 6195 (1987).
- Matthäus et al. (1997) A. Matthäus, A. Ennaoui, S. Fiechter, S. Tiefenbacher, T. Kiesewetter, K. Diesner, I. Sieber, W. Jaegermann, T. Tsirlina, and R. Tenne, Journal of The Electrochemical Society 144, 1013 (1997).
- Mak et al. (2010) K. F. Mak, C. Lee, J. Hone, J. Shan, and T. F. Heinz, Phys. Rev. Lett. 105, 136805 (2010).
- Tonndorf et al. (2013) P. Tonndorf, R. Schmidt, P. Böttger, X. Zhang, J. Börner, A. Liebig, M. Albrecht, C. Kloc, O. Gordan, D. R. T. Zahn, et al., Opt. Express 21, 4908 (2013).
- Gutiérrez et al. (2013) H. R. Gutiérrez, N. Perea-López, A. L. Elías, A. Berkdemir, B. Wang, R. Lv, F. López-Urías, V. H. Crespi, H. Terrones, and M. Terrones, Nano Letters 13, 3447 (2013).
- Kumar and Ahluwalia (2012) A. Kumar and P. Ahluwalia, The European Physical Journal B 85, 186 (2012), ISSN 1434-6028.
- Morelli and Heremans (2002) D. T. Morelli and J. P. Heremans, Applied Physics Letters 81, 5126 (2002).
- Touloukian and Buyco (1970) Y. S. Touloukian and E. H. Buyco, eds., Specific Heat-Nonmetallic Solids, in Thermal Properties of Matter: The TPRC Data Series, vol. 5 (New York: IFI/Plenum, 1970).
- Hu et al. (2006) S. Hu, Y. Lee, J. Shen, K. Chen, K. Tiong, and Y. Huang, Solid State Communications 139, 176 (2006).
- Ho et al. (1998) C. H. Ho, C. S. Wu, Y. S. Huang, P. C. Liao, and K. K. Tiong, Journal of Physics: Condensed Matter 10, 9317 (1998).
- Nakashima and Umakoshi (1992) T. Nakashima and Y. Umakoshi, Philosophical Magazine Letters 66, 317 (1992).
- Cai et al. (2014) Y. Cai, J. Lan, G. Zhang, and Y.-W. Zhang, Phys. Rev. B 89, 035438 (2014).
- Luttrell et al. (2006) R. D. Luttrell, S. Brown, J. Cao, J. L. Musfeldt, R. Rosentsveig, and R. Tenne, Phys. Rev. B 73, 035410 (2006).
- Zhang et al. (2015) X. Zhang, X.-F. Qiao, W. Shi, J.-B. Wu, D.-S. Jiang, and P.-H. Tan, Chem. Soc. Rev. 44, 2757 (2015).
- Wieting and Verble (1971) T. J. Wieting and J. L. Verble, Phys. Rev. B 3, 4286 (1971).
- Late et al. (2014) D. J. Late, S. N. Shirodkar, U. V. Waghmare, V. P. Dravid, and C. N. R. Rao, Chem. Phys. Chem. 15, 1592 (2014).
- Grimvall (1999) G. Grimvall, Thermophysical properties of materials (Amsterdam: Elsevier, 1999).
- Shao et al. (2015) H. Shao, X. Tan, T. Hu, G.-Q. Liu, J. Jiang, and H. Jiang, EPL (Europhysics Letters) 109, 47004 (2015).
- Volovik et al. (1978) L. S. Volovik, V. V. Fesenko, A. S. Bolgar, S. V. Drozdova, L. A. Klochkov, and V. F. Primachenko, Soviet Powder Metallurgy and Metal Ceramics 17, 697 (1978).
- Blinder and Trofimova (1993) A. S. Blinder, A. V. Bolgar and Z. A. Trofimova, Powder Metallurgy and Metal Ceramics 32, 234 (1993).
- O’hare et al. (1984) P. A. G. O’hare, W. Hubbard, G. Johnson, and H. Flotow, The Journal of Chemical Thermodynamics 16, 45 (1984).
- Aksoy et al. (2006) R. Aksoy, Y. Ma, E. Selvi, M. Chyu, A. Ertas, and A. White, Journal of Physics and Chemistry of Solids 67, 1914 (2006).
- Aksoy et al. (2008) R. Aksoy, E. Selvi, and Y. Ma, Journal of Physics and Chemistry of Solids 69, 2138 (2008).
- Zhao et al. (2015) Z. Zhao, H. Zhang, H. Yuan, S. Wang, Y. Lin, Q. Zeng, G. Xu, Z. Liu, G. K. Solanki, K. D. Patel, et al., Nat Commun 6, 7312 (2015).
- Dudnik and Kh. (1966) E. M. Dudnik and O. V. Kh., Soviet Powder Metallurgy and Metal Ceramics 5, 125 (1966).
- El-Mahalawy and Evans (1976) S. H. El-Mahalawy and B. L. Evans, J. Appl. Crystallogr. 9, 403 (1976).
- Selvi et al. (2006) E. Selvi, Y. Z. Ma, R. Aksoy, A. Ertas, and A. White, Journal of Physics and Chemistry of Solids 67, 2183 (2006).
- Mounet and Marzari (2005) N. Mounet and N. Marzari, Phys. Rev. B 71, 205214 (2005).
- Huang et al. (2014) L. F. Huang, P. L. Gong, and Z. Zeng, Phys. Rev. B 90, 045409 (2014).
- Sevik (2014) C. Sevik, Phys. Rev. B 89, 035422 (2014).
- Julian (1965) C. L. Julian, Phys. Rev. 137, A128 (1965).