Structural evolution of bismuth sodium titanate induced by A-site non-stoichiometry: Neutron powder diffraction studies
Abstract
We performed neutron powder diffraction measurements on (Bi0.5Na0.5+x)TiO3 and (Bi0.5+yNa0.5)TiO3 to study structural evolution induced by the non-stoichiometry. Despite the non-stoichiometry, the local structure (r 3.5 Å) from the pair distribution function analysis is barely affected by the sodium deficit of up to -5 mol%. With increasing pair distance, however, the atomic pair correlations weaken due to the disorder caused by the sodium deficiency. Although the sodium and the bismuth share the same crystallographic site, their non-stoichiometry have rather opposite effects as revealed from a distinctive distortion of the Bragg peaks. In addition, Rietveld refinement demonstrates that the octahedral tilting is continually suppressed by the sodium deficit of up to -5 mol%. This is contrary to the effect of the bismuth deficiency, which enhances the octahedral tilting.
I Introduction
(Bi0.5Na0.5)TiO3 (BNT) based solid solutions are one of the most promising candidates for replacing lead-containing electromechanical ceramics such as Pb(Zr1-xTix)O3, and have been extensively studied Ma et al. (2013); Simons et al. (2011); Aksel and Jones (2010); Ranjan et al. (2009); Rodel et al. (2009). On the substitution of the sodium by the potassium ion, BNT undergoes a phase transition from rhombohedral to tetragonal structure Jones et al. (2002). Similarly, solid solution of BNT with BaTiO3 exhibits rich structural phases Simons et al. (2011); Ma et al. (2012) as a function of composition and poling field with enhanced ferroelectric response near the morphotropic phase boundary Rodel et al. (2009). In addition, recent works report that a doping on perovskite A- and B-site Watanabe et al. (2007); Davies et al. (2011); Aksel et al. (2012a) modifies physical properties such as depolarization temperature, and piezoelectric constant (). For example, a doping of lanthanide ions Watanabe et al. (2007); Aksel et al. (2012b) on the A-site decreases the depolarization temperature, . Contrary, the B-site substitution of the iron and the manganese Davies et al. (2011); Aksel et al. (2012a) enhances the .
On the crystal structure of a doped BNT, it is found that the crystal structure approaches cubic phase with increasing addition of La Herabut and Safari (1997). Also, a slight increase of the cell volume by the Fe doping is observed Aksel et al. (2012a). These concurrent structural modifications with the evolution of the hint an underlying role of the structure on the depolarization temperature. In this paper, we report a structural evolution of non-stoichiometric (Bi0.5NaTiO3 and (Bi0.5+yNa0.5)TiO3 from neutron powder diffraction measurements. Using both atomic pair distribution function analysis Egami and Billinge (2012) and Rietveld refinement we investigate the local structural distortion below the atomic pair distance r3.5 Å as well as the long-range octahedral tilting induced by the sodium and the bismuth non-stoichiometry, respectively.
II Experiments
Stoichiometric (Bi0.5Na0.5)TiO3, non-stoichiometric (Bi0.5Na0.5+x)TiO3 (=-5, -2, +1 mol%) and (Bi0.5+yNa0.5)TiO3 (=-1, -0.5, +1 mol%) ceramic samples were prepared using a solid-state reaction. After calcination and intermediate ball milling powders were pelletized and sintered at 1150 ∘C for 2 h in air. The apparent densities of the pellets after the sintering were above 95 % of the theoretical values, indicating that all samples were prepared consistently Sung et al. (2010, 2011). Ceramic samples were crushed into fine powders and then annealed to relieve strain. Time-of-flight neutron powder diffraction measurements were performed on the NPDF instrument at the Los Alamos Neutron Science Center. Powder samples were loaded in vanadium cans and then mounted in a closed-cycle helium cryostat with Helium exchange gas. All measurements were performed at =180 K to reduce thermal contribution to structural features.
III Results and Discussion
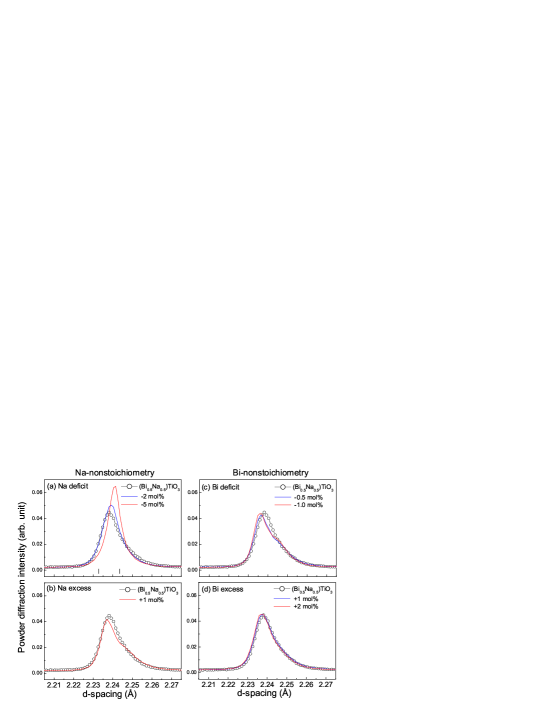
Figure 1 summarizes the effects of the non-stoichiometry on (202) and (006) Bragg peaks. The tick marks in (a) are peak positions for the stoichiometric BNT represented by the symbol (-o-). Solid lines are those of the non-stoichiometric samples. First, note that the non-stoichiometry of the sodium (a,b) and the bismuth (c,d) have rather opposite effects on the Bragg peak positions and shape. For the sodium deficient samples, the Bragg peak shifts toward higher d-spacing. In addition, the peak becomes sharper and symmetric with increasing deficiency, much like the case of the lanthanum doped BNT Herabut and Safari (1997). In contrast, the Bragg peak position shifts toward lower d-spacing and the shoulder around d-spacing 2.25 Å becomes pronounced due to the bismuth deficiency. Unlike the sodium excess, the bismuth excess barely affects the Bragg peak positions and shape. Overall, these results emphasize the distinctive role of the sodium and the bismuth deficiency/excess on the lattice distortion.
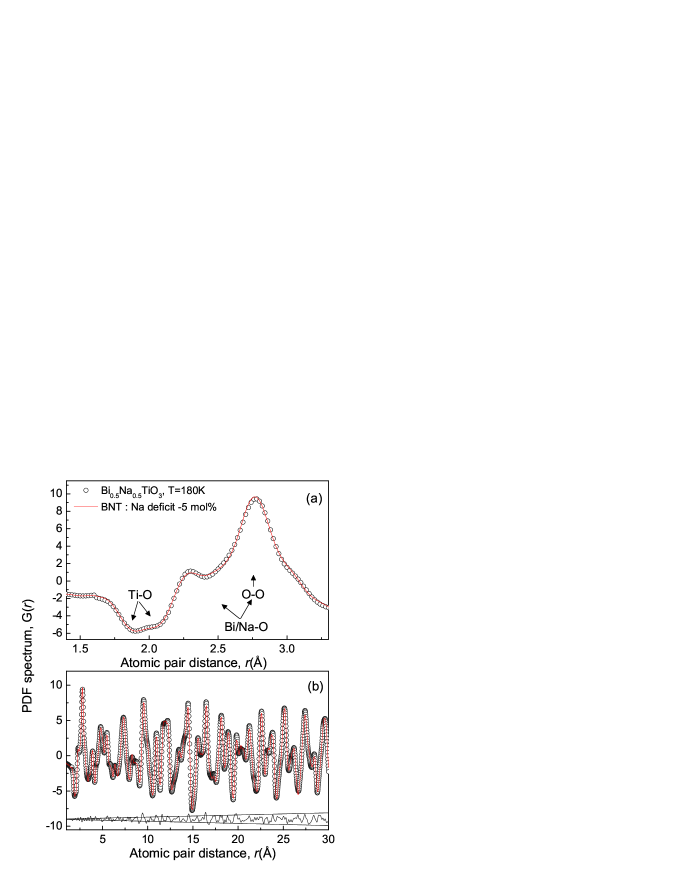
The A-site deficiency of Bi/Na ion generates oxygen vacancies Sung et al. (2010) which induce a distortion of the octahedral unit, and thus affects a local displacement of Ti ion Jeong et al. (2011a) and induces a leakage conductivity in ferroelectric BNT Li et al. (2014). To examine the local structural distortion induced by the A-site deficiency we performed neutron pair distribution function (PDF) analysis on stoichiometric BNT and sodium -5 mol% deficit BNT. PDF spectra were obtained via Fourier transform of experimental total scattering structure functions Egami and Billinge (2012) with Qmax=25 Å-1 after data reduction using the program PDFgetN Peterson et al. (2000). In Fig. 2(a), the first few peaks correspond to Ti-O, Bi/Na-O, and O-O bonds. The Ti-O bond appears as a negative peak due to a negative neutron scattering length of the titanium. In addition, the doublet peak shape indicates that the Ti ion is off-centered in an oxygen octahedron Jeong et al. (2011b); Keeble et al. (2013). Note that the PDF spectra of the stoichiometric (open circles) and sodium -5 mol% deficit (solid line) BNT overlap quite nicely up to the pair distance r3.5 Å. This result indicates that the local structures around the Ti ion and of the oxygen octahedron are little affected by the sodium deficiency. However, as the difference curve in Fig. 2(b) indicates, the deviation between the two spectra becomes larger at higher-. The increasing discrepancy reflects a weakening of the atomic correlations due to a structural disorder in the sodium deficient sample.
We now focus on the long-range structural evolution of BNT induced by the non-stoichiometry. The crystal structure of ferroelectric BNT is somewhat controversial. Originally, it was reported as rhombohedral structure by Jones and Thomas Jones and Thomas (2002) by using neutron powder diffraction measurements. In the subsequent high resolution x-ray diffraction measurements, however, a subtle peak splitting was observed in a sintered powder sample and monoclinic structure Aksel et al. (2011) was proposed. More complex picture was proposed by Rao et al. on electrically poled and thermally annealed specimens Rao et al. (2013). The authors found that both rhombohedral and monoclinic phases coexisted in the thermally annealed sample. In addition, the fraction of the phase was increased by applying an external electric field and a mechanical grinding. In recent, the structural ambiguity of BNT has been reinvestigated by using a convergent beam electron diffraction of unpoled single crystals. The results show that defect-free BNT has an average symmetry over a few nanometer length scale. Near defects such as antiphase boundary and domain walls, however, the material will have a monoclinic symmetry Beanland and Thomas (2014). In our Rietveld analysis we tried both rhombohedral and monoclinic phases to refine neutron powder diffraction pattern of the stoichiometric BNT at 180 K. We found that the fitting with rhombohedral phase was more stable and easily converged with less number of parameters than that using monoclinic phase. Thus, we kept the phase and used it for the refinement of the other non-stoichiometric samples.
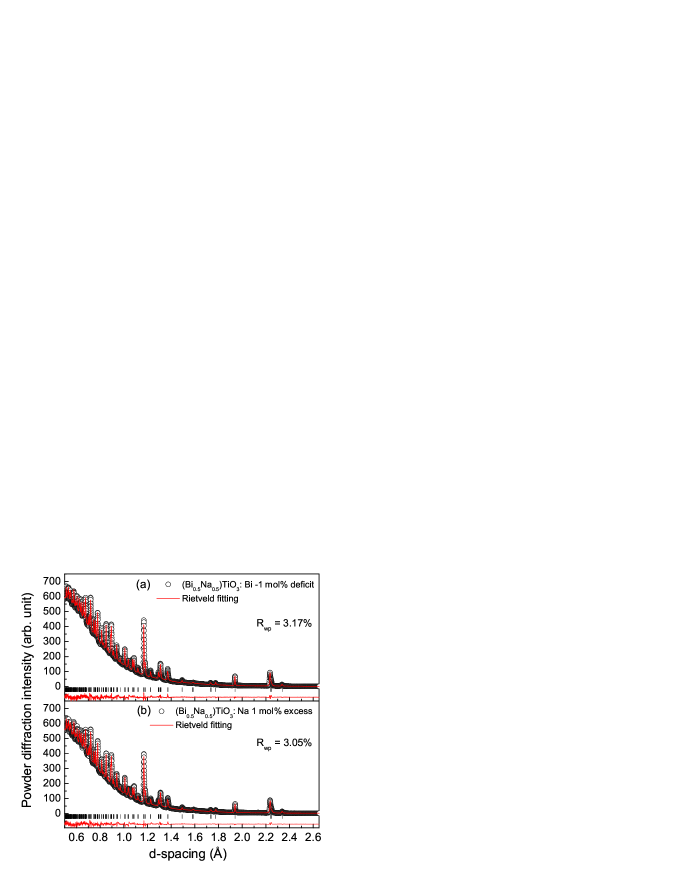
Figure 3 shows representative refinements on a bismuth deficit (-1 mol%) and a sodium excess (1 mol%) samples using GSAS Larson and Von Dreele (1986) interfaced by EXPGUI Toby (2001). Solid line represents a Rietveld fitting using rhombohedral structure Jones and Thomas (2002). Tick marks indicate Bragg peak positions. Also shown is a difference curve between the experimental and the model patterns. In the Rietveld refinements, lattice and thermal parameters as well as atomic positions were refined along with absorption and background corrections. The bismuth and the sodium ions are assumed to share the same crystallographic position. High quality of the fitting confirms that all samples maintain the average structure. Despite the presence of heavy ion (Bi), the atomic positions of the oxygen ion were reliably refined due to a large scattering contrast of oxygen in the neutron diffraction. Based on these structural information we calculated the octahedral tilting angle Jones and Thomas (2002) as a function of the sodium and the bismuth non-stoichiometry, respectively.
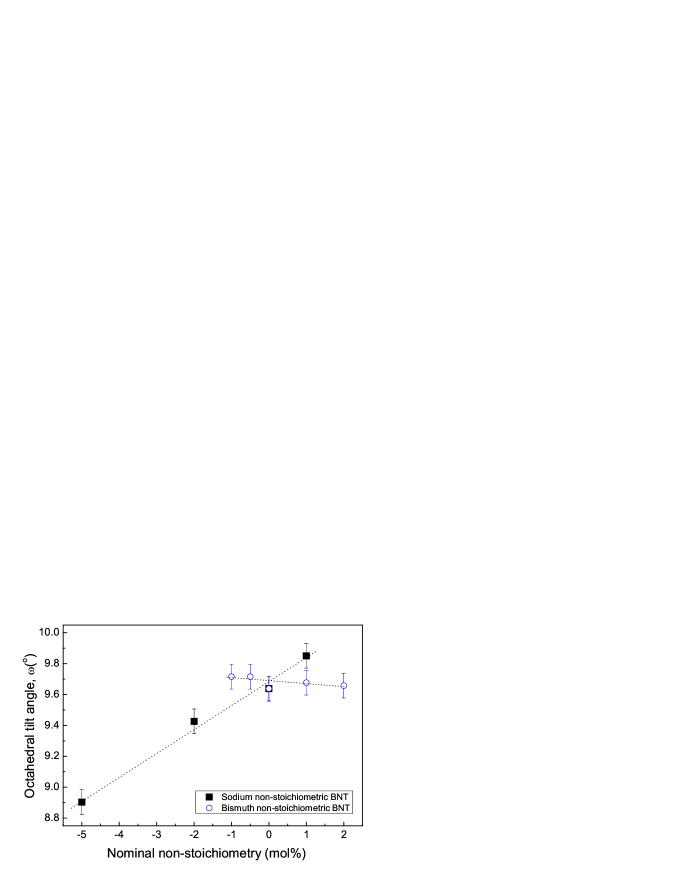
In the rhombohedral BNT, the antiphase octahedral tilting (a-a-a- Glazer tilt system) Glazer (1972); Megaw and Darlington (1975) is coupled with cation displacements Jones and Thomas (2002) and plays an important role for the stability of the ferroelectric phase. The tilting appears at around 670 K and increases with decreasing temperature, saturating to at 5 K Jones and Thomas (2002). Figure 4 shows the octahedral tilting angle as a function of the sodium () and the bismuth () non-stoichiometry at 180 K. For the sodium non-stoichiometric BNT (), the antiphase octahedral tilting angle evolves with a positive slope as a function of the non-stoichiometry. At the sodium deficit of -5 mol%, the tilting angle is suppressed to 8.9∘. With the sodium excess of 1 mol%, however, the tilting is enhanced to . Effectively, the change of the tilting angle between -5 mol% 1 mol% is equivalent Jones and Thomas (2002) to the the temperature variation of about 100 , and reflects the instability of the ferroelectric lattice to the sodium non-stoichiometry. For the bismuth non-stoichiometric BNT (), the tilting trend is more or less opposite to that of the sodium non-stoichiometric BNT i.e. the tilting increases slightly with the deficiency of the bismuth, exhibiting a negative slope. This is an interesting contrast, indicating that the sodium and the bismuth play a distinct role on the crystal structure of BNT. In fact, recent studies using neutron total scattering analysis show that the displacement of Bi3+ is about twice larger Keeble et al. (2013) than that of Na+. As a result, an octahedron tilting which is coupled to the A-site ionic displacements would be different around the sodium and the bismuth ions, respectively. The disparity of the octahedral tilting around Bi3+ and Na+ imposes an important structural feature such as nano-scale tilting disorder Levin and Reaney (2012), which is observed by transmission electron microscopic studies. With A-site non-stoichiometry, the tilting disorder will be increased due to a fluctuation of the local chemistry and the resultant variation of the octahedral tilting angle.
IV Conclusion
Using neutron powder diffraction studies, we find that the local structure of BNT below the atomic pair distance 3.5 Å is little influenced, contrary to the noticeable suppression/enhancement of the long-range oxygen octahedral tilting by the A-site non-stoichiometry. In addition, we report that the sodium and the bismuth non-stoichiometry induce a rather opposite octahedral tilting evolution. These results provide a structural hint for a disparity of the tilting behavior around Bi3+ and Na+, which leads to a local tilting disorder.
Acknowledgements.
We are grateful to K. Page and J. Siewenie for helping with the data collection. This work was supported by the National Research Foundation of Korea grant funded by the Korean Government NRF-2013R1A1A2012499. This work has benefited from the use of NPDF at the Lujan Center at Los Alamos Neutron Science Center, funded by DOE Office of Basic Energy Sciences. Los Alamos National Laboratory is operated by Los Alamos National Security LLC under DOE Contract DE-AC52-06NA25396.References
- Ma et al. (2013) C. Ma, H. Guo, and X. Tan, Adv. Funct. Mater. 23, 5261 (2013).
- Simons et al. (2011) H. Simons, J. Daniels, W. Jo, R. Dittmer, A. Studer, M. Avdeev, J. Rodel, and M. Hoffman, Appl. Phys. Lett. 98, 082901 (2011).
- Aksel and Jones (2010) E. Aksel and J. L. Jones, Sensors 10, 1935 (2010).
- Ranjan et al. (2009) R. Ranjan, V. Kothai, R. Garg, A. Agrawal, A. Senyshyn, and H. Boysen, Appl. Phys. Lett. 95, 042904 (2009).
- Rodel et al. (2009) J. Rodel, W. Jo, K. T. P. Seifert, E. Anton, and T. Granzow, Am. Ceram. Soc. 92, 1153 (2009).
- Jones et al. (2002) G. O. Jones, J. Kreisel, and P. A. Thomas, Powder Diffraction 17, 301 (2002).
- Ma et al. (2012) C. Ma, H. Z. Guo, S. P. Beckman, and X. Tan, Phys. Rev. Lett. 109, 107602 (2012).
- Watanabe et al. (2007) Y. Watanabe, Y. Hiruma, H. Nagata, and T. Takenaka, Ferroelectrics 358, 139 (2007).
- Davies et al. (2011) M. Davies, E. Aksel, and J. L. Jones, J. Am. Ceram. Soc. 94, 1314 (2011).
- Aksel et al. (2012a) E. Aksel, J. S. Forrester, B. Kowalski, M. Deluca, D. Damjanovic, and J. L. Jones, Phys. Rev. B 85, 024121 (2012a).
- Aksel et al. (2012b) E. Aksel, J. S. Forrester, H. M. Foronda, R. Dittmer, D. Damjanovic, and J. L. Jones, J. Appl. Phys. 112, 054111 (2012b).
- Herabut and Safari (1997) A. Herabut and A. Safari, J. Am. Ceram. Soc. 80, 2954 (1997).
- Egami and Billinge (2012) T. Egami and S. J. L. Billinge, Underneath the Bragg Peaks: Structural Analysis of Complex Materials, 2nd ed. (Pergamon Press, 2012).
- Sung et al. (2010) Y. S. Sung, J. M. Kim, J. H. Cho, T. K. Song, M. H. Kim, H. H. Chong, T. G. Park, D. Do, and S. S. Kim, Appl. Phys. Lett. 96, 022901 (2010).
- Sung et al. (2011) Y. S. Sung, J. M. Kim, J. H. Cho, T. K. Song, M. H. Kim, and T. G. Park, Appl. Phys. Lett. 98, 012902 (2011).
- Jeong et al. (2011a) I.-K. Jeong, J. S. Ahn, B. G. Kim, S. Yoon, S. P. Singh, and D. Pandey, Phys. Rev. B 83, 064108 (2011a).
- Li et al. (2014) M. Li, M. J. Pietrowski, R. A. D. Souza, H. Zhang, I. M. Reaney, S. N. Cook, J. A. Kilner, and D. C. Sinclair, Nature Materials 13, 31 (2014).
- Peterson et al. (2000) P. F. Peterson, M. Gutmann, T. Proffen, and S. J. L. Billinge, J. Appl. Cryst. 33, 1192 (2000).
- Jeong et al. (2011b) I. K. Jeong, C. Y. Park, D. J. Kim, S.-H. Kim, B. K. Moom, I. W. Kim, and C. W. Ahn, Z. Krist. 226, 150 (2011b).
- Keeble et al. (2013) D. S. Keeble, E. R. Barney, D. A. Keen, M. G. Tucker, J. Kreisel, and P. A. Thomas, Adv. Funct. Mater. 23, 185 (2013).
- Jones and Thomas (2002) G. O. Jones and P. A. Thomas, Acta Crystallographica Section B 58, 168 (2002).
- Aksel et al. (2011) E. Aksel, J. S. Forrester, J. L. Jones, P. A. Thomas, K. Page, and M. Suchomel, Appl. Phys. Lett. 98, 152901 (2011).
- Rao et al. (2013) B. N. Rao, A. N. Fitch, and R. Ranjan, Phys. Rev. B 87, 060102(R) (2013).
- Beanland and Thomas (2014) R. Beanland and P. A. Thomas, Phys. Rev. B 89, 174102 (2014).
- Larson and Von Dreele (1986) A. C. Larson and R. B. Von Dreele, General Structure Analysis System, unpublished Report LAUR 86-748 (Los Alamos National Laboratory, 1986).
- Toby (2001) B. H. Toby, J. Appl. Cryst. 34, 210 (2001).
- Glazer (1972) A. M. Glazer, Acta Cryst. B 28, 3384 (1972).
- Megaw and Darlington (1975) H. D. Megaw and C. N. Darlington, Acta Cryst. A 31, 161 (1975).
- Levin and Reaney (2012) I. Levin and I. M. Reaney, Adv. Funct. Mater. 22, 3445 (2012).