Does the obscured AGN fraction really depend on luminosity?
Abstract
We use a sample of 151 local non-blazar AGN selected from the INTEGRAL all-sky hard X-ray survey to investigate if the observed declining trend of the fraction of obscured (i.e. showing X-ray absorption) AGN with increasing luminosity is mostly an intrinsic or selection effect. Using a torus-obscuration model, we demonstrate that in addition to negative bias, due to absorption in the torus, in finding obscured AGN in hard X-ray flux limited surveys, there is also positive bias in finding unobscured AGN, due to Compton reflection in the torus. These biases can be even stronger taking into account plausible intrinsic collimation of hard X-ray emission along the axis of the obscuring torus. Given the AGN luminosity function, which steepens at high luminosities, these observational biases lead to a decreasing observed fraction of obscured AGN with increasing luminosity even if this fraction has no intrinsic luminosity dependence. We find that if the central hard X-ray source in AGN is isotropic, the intrinsic (i.e. corrected for biases) obscured AGN fraction still shows a declining trend with luminosity, although the intrinsic obscured fraction is significantly larger than the observed one: the actual fraction is larger than % at erg s-1 (17–60 keV), and decreases to % at erg s-1. In terms of the half-opening angle of an obscuring torus, this implies that in lower-luminosity AGN, and in higher-luminosity ones. If, however, the emission from the central SMBH is collimated as , the intrinsic dependence of the obscured AGN fraction is consistent with a luminosity-independent torus half-opening angle .
keywords:
galaxies: active – galaxies: nuclei – galaxies: Seyfert.1 Introduction
A lot of recent studies based on X-ray and hard X-ray extragalactic surveys have demonstrated that the fraction of X-ray absorbed (hereafter referred to as obscured) active galactic nuclei (AGN) decreases with increasing observed X-ray luminosity, at least at erg s-1, both in the local () and high-redshift Universe (Ueda et al. 2003; Steffen et al. 2003; Hasinger 2004; Sazonov & Revnivtsev 2004; La Franca et al. 2005; Sazonov et al. 2007; Hasinger 2008; Beckmann et al. 2009; Brightman & Nandra 2011; Burlon et al. 2011; Ueda et al. 2014; Aird et al. 2015; Buchner et al. 2015; note also earlier evidence, Lawrence & Elvis 1982). This might indicate that the opening angle of the (presumably) toroidal obscuring structure – the key element of AGN unification schemes – increases with AGN luminosity, for example due to feedback of the central supermassive black hole (SMBH) on the accretion flow.
Could the observed luminosity dependence of the obscured AGN fraction arise due to selection effects? This question has been occasionally raised before (e.g. Mayo & Lawrence 2013) and is prompted by the fact that even hard X-ray ( keV) surveys, which are usually flux (or signal-to-noise ratio) limited, should be biased against detection of Compton-thick AGN, i.e. objects viewed through absorption column density cm-2, let alone X-ray surveys at energies below 10 keV which must be biased against even Compton-thin obscured sources. Due to this detection bias, the observed fraction of obscured AGN is expected to be lower than the intrinsic fraction of such objects. Furthermore, this effect may depend on luminosity, somehow reflecting the shape of the AGN luminosity function (LF). In fact, as discussed by Lawrence & Elvis (2010), some mid-infrared selected, radio selected and volume-limited AGN samples do not demonstrate any clear luminosity dependence of the proportion of type 1 (i.e. containing broad emission lines in the optical spectrum) and type 2 AGN.
Although there have been previous attempts (Ueda et al., 2003; Malizia et al., 2009; Burlon et al., 2011; Ueda et al., 2014) to take into account detection biases when estimating the space density of obscured AGN based on hard X-ray surveys, they were, in our view, not fully self-consistent and/or used too small samples of hard X-ray selected AGN. It is our goal here to improve on both of these aspects.
The purpose of the present study is to i) evaluate the impact on the observed hard X-ray LF and observed luminosity dependence of the obscured AGN fraction of the negative bias for obscured AGN discussed above and a positive bias that we demonstrate likely exists for unobscured AGN, and ii) reconstruct the intrinsic dependence of the fraction of obscured AGN on luminosity in the local Universe. Our treatment is based on a realistic torus-like obscuration model and makes use of the INTEGRAL/IBIS 7-year (2002–2009) hard X-ray survey of the extragalactic sky. Our sample consists of local () Seyfert galaxies and is highly complete and reliable. Although there are now significantly larger hard X-ray selected samples of local AGN, based on additional observations by INTEGRAL/IBIS and especially by Swift/BAT, they currently suffer from significant incompleteness as concerns identification and absorption column density information. Most importantly, our sample is large enough to contain a significant number, 17, of heavily obscured ( cm-2) AGN, for which we use as much as possible estimates based on high-quality hard X-ray spectral data, in particular from the NuSTAR observatory, which has recently been systematically observing AGN discovered in the Swift/BAT and INTEGRAL/IBIS hard X-ray surveys.
We adopt a cosmological model with and km s-1 Mpc-3.
2 The INTEGRAL AGN sample
We use the catalogue of sources (Krivonos et al., 2010b) from the INTEGRAL/IBIS 7-year all-sky hard X-ray survey (hereafer, the INTEGRAL 7-year survey, Krivonos et al. 2010a). To minimise possible biases in our study of the local AGN population due to remaining unidentified INTEGRAL sources and objects with missing distance and/or X-ray absorption information, we exclude from the consideration the Galactic plane region (). The catalogue is composed of sources detected on the time-averaged (December 2002 – July 2009) 17–60 keV map of the sky and is significance limited (). The corresponding flux limit varies over the sky: ( erg s-1 cm-2) for 50% (90%) of the extragalactic () sky (see Fig. 1).

The main properties of the INTEGRAL 7-year survey and of the corresponding catalogue of sources were described by Krivonos et al. (2010a, b). Using this catalogue, Sazonov et al. (2010) made preliminary estimates of the hard X-ray LF of local AGN and the dependence of the obscured AGN fraction on luminosity. Subsequent follow-up efforts by different teams have resulted in additional identifications, classifications, distance measurements and X-ray absorption column estimates for many INTEGRAL sources, which has significantly improved the quality of the catalogue, as detailed below.
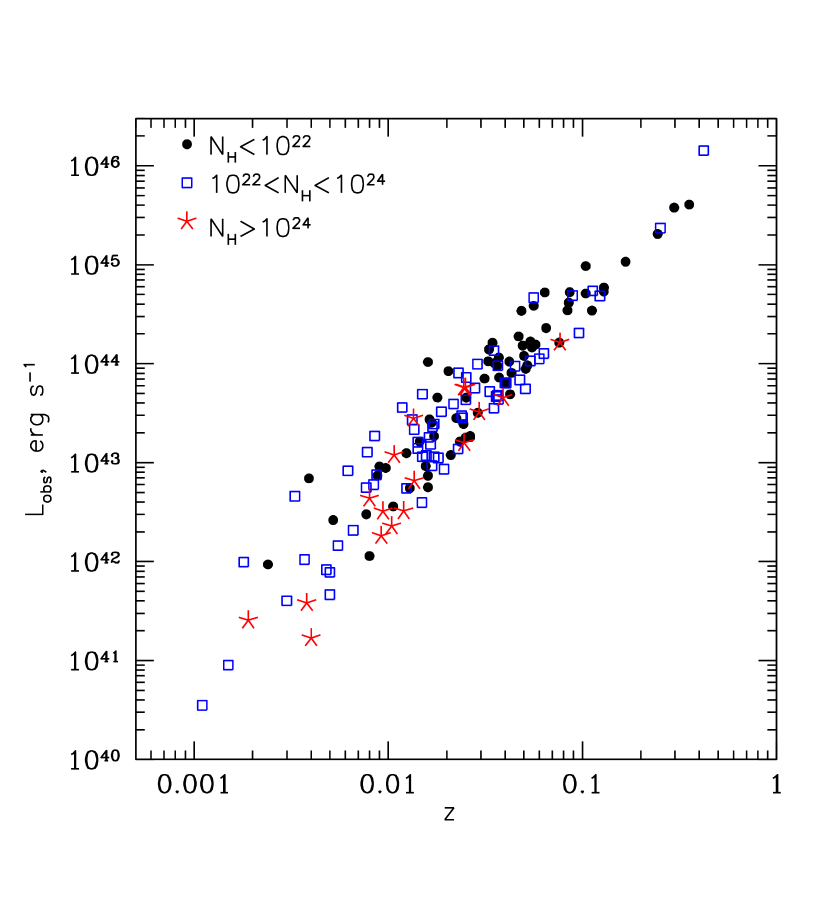
The final sample used here consists of 151 non-blazar (i.e. Seyfert-like) AGN (see Table 3 in Appendix A), with blazars (15 in total) being excluded from the analysis. The sample is highly complete, as there are only 4 sources at from the INTEGRAL 7-year catalogue that remain unidentified. Moreover, all of our AGN have known distances and reliable estimates of their absorption columns based on X-ray spectroscopy. As illustrated in Fig. 2, our sample is mostly local, with 146 out of the 151 objects being located at , and spans about 5 decades in (observed) luminosity, from to erg s-1 (hereafter, all luminosities are in the 17–60 keV energy band, unless specified otherwise).
We note that although we used the most up-to-date information from the NASA/IPAC Extragalactic Database (NED) and recent literature to remove blazars from our AGN sample, we cannot rule out that some of our objects have blazar-like properties, i.e. their observed hard X-ray emission contains a significant contribution from a relativistic jet. The most suspicious in this respect are objects classified as broad-line (i.e. presumably oriented towards us) radio galaxies. There are 6 such AGN in our sample: 3C 111, 3C 120, Pic A, 3C 390.3, 4C +74.26 and S5 2116+81. All of them have erg s-1 (but erg s-1), i.e. belong to the high-luminosity part of the sample. However, the total number of objects with erg s-1 is much larger: 42. This suggests that possible incomplete filtering of the sample from blazars is unlikely to significantly affect the results and conclusions of this work.
2.1 Absorption columns, heavily obscured AGN
| Object | Reference for | |||
|---|---|---|---|---|
| Mpc | erg s-1 | cm-2 | ||
| SWIFT J0025.8+6818 | 52.0 | NuSTAR (Krivonos et al., 2015) | ||
| NGC 1068 | 12.3 | NuSTAR (Bauer et al., 2014) | ||
| NGC 1194 | 59.0 | ? | XMM-Newton (below 10 keV, Greenhill, Tilak, & Madejski 2008) | |
| CGCG 420-015 | 129.2 | NuSTAR (Krivonos et al., 2015) | ||
| MRK 3 | 58.6 | Suzaku (Ikeda, Awaki, & Terashima, 2009) | ||
| IGR J09253+6929 | 172.6 | ? | low X-ray/hard X-ray flux ratio (Swift/XRT+INTEGRAL/IBIS) | |
| NGC 3081 | 28.6 | Suzaku (Eguchi et al., 2011) | ||
| NGC 3281 | 46.3 | BeppoSAX (Vignali & Comastri, 2002) | ||
| ESO 506-G027 | 109.5 | Suzaku (Winter et al., 2009b) | ||
| NGC 4939 | 34.7 | ? | BeppoSAX (Maiolino et al., 1998), but varied to cm-2 | |
| (XMM-Newton, below 10 keV, Guainazzi et al. 2005a) | ||||
| NGC 4945 | 3.4 | NuSTAR (Puccetti et al., 2014; Brightman et al., 2015), Suzaku (Yaqoob, 2012) | ||
| IGR J141754641 | 348.3 | ? | low X-ray/hard X-ray flux ratio (Swift/XRT+INTEGRAL/IBIS) | |
| NGC 5643 | 11.8 | NuSTAR (Krivonos et al., 2015) | ||
| NGC 5728 | 24.8 | NuSTAR (Krivonos et al., 2015) | ||
| IGR J145613738 | 107.7 | Chandra+INTEGRAL/IBIS (Sazonov et al., 2008) | ||
| ESO 137-G034 | 33.0 | Suzaku (Comastri et al., 2010) | ||
| NGC 6240 | 107.3 | NuSTAR (Krivonos et al., 2015) |
For the purposes of this study it is important to have maximally complete and reliable information on the X-ray absorption columns, , of the studied AGN. Our starting source of such information is our previous papers on the INTEGRAL/IBIS survey (Sazonov et al., 2007, 2012) as well as on the RXTE (3–20 keV) slew survey (Sazonov & Revnivtsev, 2004), but we have updated the estimates in all cases where it was necessary and possible (see Table 3).
For unobscured and lightly obscured ( cm-2) sources, X-ray spectroscopy at energies below 10 keV is usually sufficient for evaluating . Such data do exist for all of our sources and in most cases there are reliable published values, which we adopt. Furthermore, if the absorption column is less than cm-2, we adopt and consider such sources unobscured.
However, absorption column estimates based on X-ray data below 10 keV become unreliable for strongly absorbed sources, having cm-2. In such cases, we prefer to use results from hard X-ray (above 10 keV) spectroscopy, whenever possible. Specifically, our preference list of instruments is headed by NuSTAR – the unique focusing hard X-ray telescope, followed by Suzaku and then by all other currently operating or previously flown hard X-ray missions.
For five of the heavily obscured ( cm-2) objects and candidates, we carried out our own analysis of publicly available NuSTAR data (Krivonos et al., 2015). Specifically, we fitted the spectra by a sum of a strongly absorbed power-law component (with a high-energy cutoff) and a disk-reflection continuum modelled with pexrav in XSPEC. The NuSTAR spectra of SWIFT J0025.8+6818, CGCG 420-015 and NGC 5643 are consistent with being fully reflection dominated (i.e. dominated by Compton-scattered continuum), and so we prescribed cm-2 to them. The other two objects, NGC 5728 and NGC 6240, along with strong reflection demonstrate a significant contribution from the primary component suppressed by intrinsic absorption at the level of – cm-2. More physically motivated AGN torus models confirmed this qualitative result (see Krivonos et al. 2015 for details). Our derived spectral parameters for CGCG 420-015, NGC 5643, NGC 5728 and NGC 6240 are consistent with pre-NuSTAR estimates for these objects (Severgnini et al. 2011, Matt et al. 2013, Comastri et al. 2010, Vignati et al. 1999, respectively).
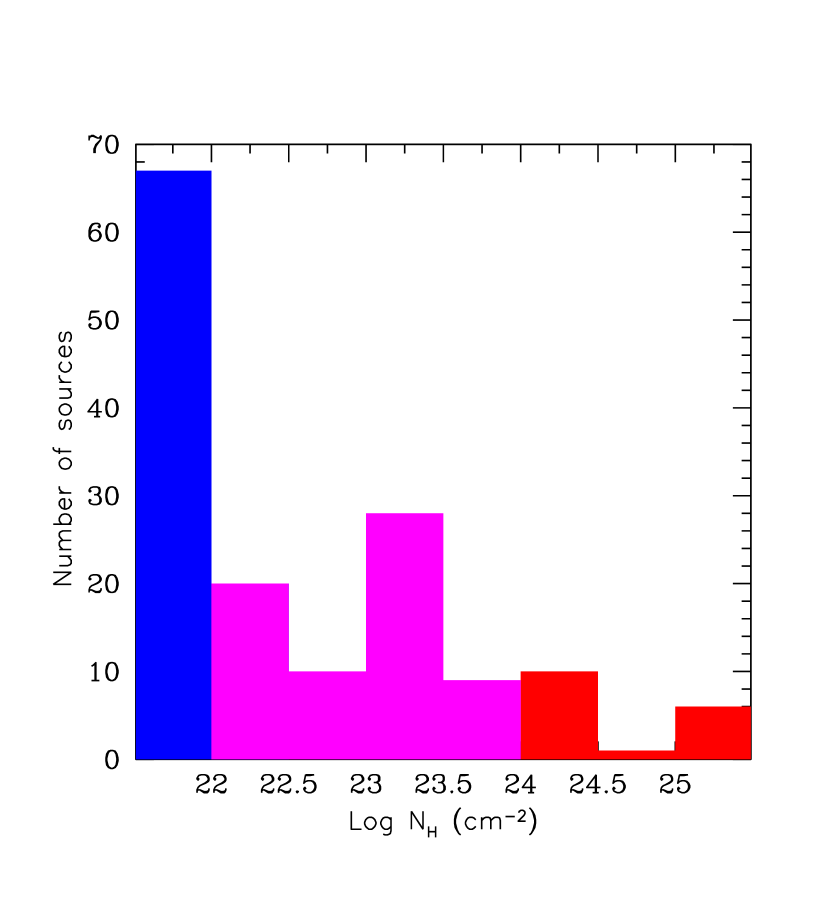
In total, our sample consists of 67 unobscured ( cm-2) and 84 obscured ( cm-2) AGN, including 17 heavily obscured ( cm-2) ones.
Table 1 provides key information about our heavily obscured AGN. For 7 of these, there are reliable estimates or evidence that the source’s spectrum is reflection-dominated (in which case we adopt that cm-2) from NuSTAR observations. All but one (IGR J145613738) of the remaining 10 objects are either planned to be observed by NuSTAR soon or have already been observed by this telescope but the data are proprietary at the time of writing. However, for most of these sources there exists fairly reliable information from other hard X-ray missions indicating that cm-2 – see Table 1.
Three of the objects included in our sample of heavily obscured AGN are currently candidates rather than firmly established representatives of this class: the quoted value cm-2 for NGC 1194 comes from X-ray data below 10 keV, whereas the presence of cm-2 absorption columns in IGR J09253+6929 and IGR J141754641 is strongly suggested by very low () X-ray/hard X-ray flux ratios that we find for them from Swift/XRT and INTEGRAL/IBIS data. Note that we initially used the same argument to regard another source from this sample, SWIFT J0025.8+6818, as a likely heavily obscured AGN, and it indeed proved to be such once we analysed NuSTAR data. In the analysis below, we assume that cm-2 for both IGR J09253+6929 and IGR J141754641.
The most difficult case is that of NGC 4939, which manifested itself as a reflection-dominated source ( cm-2) during BeppoSAX observations in 1997 (Maiolino et al., 1998), but was found to be in a Compton-thin state, with cm-2, by XMM-Newton in 2001 (Guainazzi et al., 2005a). We nevertheless treat NGC 4939 as a reflection-dominated source in our analysis, in part because the hard X-ray flux measured by INTEGRAL for this source is similar to that measured by BeppoSAX but lower than the flux inferred from the XMM-Newton observation and so INTEGRAL may have caught the source in a state similar to that revealed by BeppoSAX. Generally, we adopt cm-2 for reflection-dominated sources (there are in total 6 such objects) in our analysis, although in reality the column density in such objects may be even higher, say cm-2.
We have thus obtained a fairly large and high-quality (in terms of information on intrinsic obscuration) sample of heavily obscured AGN. The high completeness and reliability of this sample are crucial for our analysis below.
3 Observed properties of local AGN
We first consider a number of observed properties of the local AGN population using our INTEGRAL sample.
Fig. 3 shows the observed distribution of absorption columns for our objects, while Fig. 4 shows the observed dependence of the obscured AGN fraction on hard X-ray luminosity. The latter was obtained by counting obscured and unobscured sources within specified luminosity bins and dividing the first number by the sum of the two. One can clearly see a declining trend of the obscured AGN fraction with increasing luminosity, which is well known from previous studies.

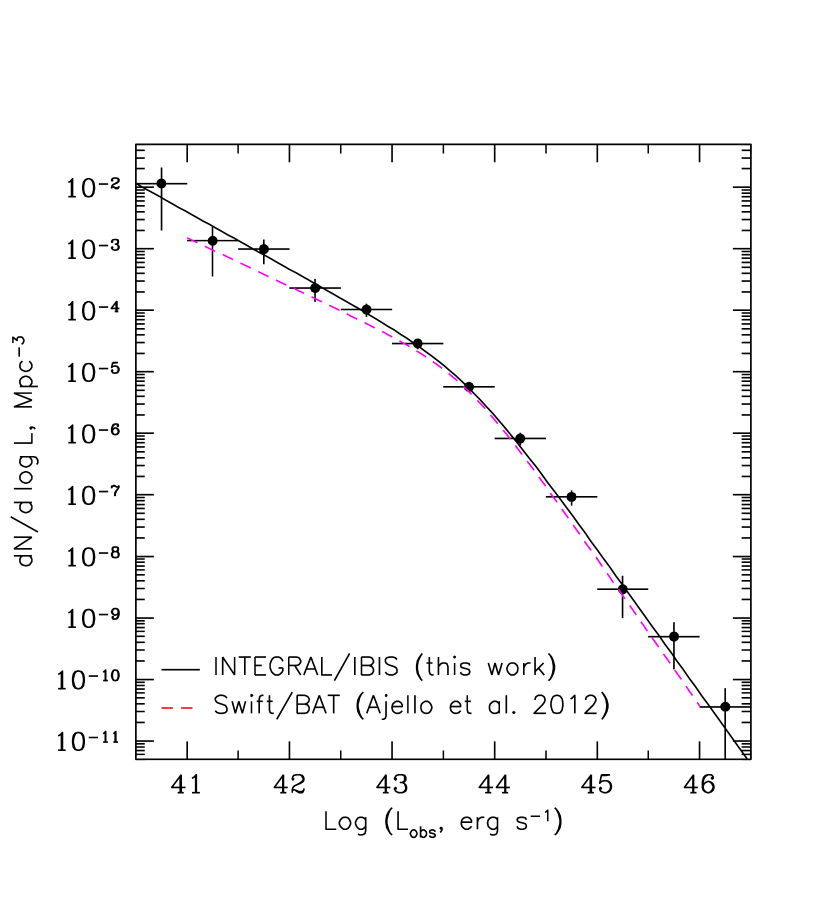
We next calculated the observed hard X-ray LF, (number of objects per Mpc per ), of local AGN: both in binned and analytic form (see Fig. 5). The analytic LF model used throughout this study is a broken power law:
| (1) |
The binned LF was constructed using the standard method, whereas the best-fit values (and their uncertainties) of the characteristic luminosity, , and of the two slopes, and , of the analytic model (see Table 2) were found using a maximum likelihood estimator (similarly to Sazonov et al. 2007):
| (2) |
where are the observed luminosities of AGN in our sample, and is the volume of the Universe probed by the INTEGRAL 7-year survey for a given , which can be calculated from the sky coverage curve (see Fig. 1). The normalization of the analytic model is derived from the actual number of objects in the sample.
Comparing this newly determined observed hard X-ray LF with our old result (Sazonov et al., 2007) based on a smaller set (66 vs. 151 objects) of AGN detected with INTEGRAL, we find good agreement between the two, but the constraints on the LF parameters have now significantly improved. We can also compare the INTEGRAL LF with that derived from a still larger (361 objects) sample of (mostly) local AGN found in nearly the same energy band (15–55 keV) in the Swift/BAT survey (Ajello et al., 2012). As can be seen in Fig. 5, the two LFs are in good agreement with each other.
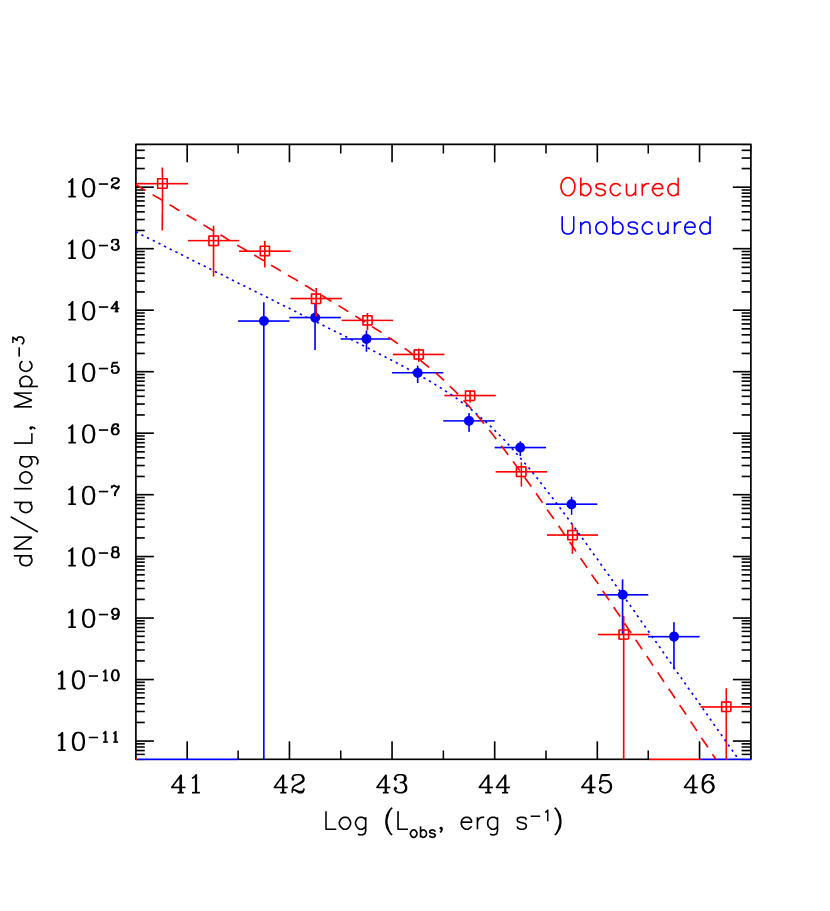
Finally, we calculated separately the observed LFs of unobscured and obscured AGN (see Fig. 6). It can be seen that these LFs are different in shape, as is verified by the best-fit parameters of the corresponding analytic fits (see Table 2).
| AGN | , | Num. density | Lum. density | ||||
| class | Mpc-3 | (–) | (–) | ||||
| Mpc-3 | erg s-1 Mpc-3 | ||||||
| Observed LF | |||||||
| All | 151 | 1.122 | 54 () | ||||
| Unobscured | 67 | 0.243 | 10 () | ||||
| Obscured | 84 | 0.839 | 48 () | ||||
| Intrinsic LF, isotropic emission, | |||||||
| All | 151 | 1.806 | 61 () | ||||
| Unobscured | 67 | 0.201 | 7.0 () | ||||
| Obscured | 84 | 1.581 | 59 () | ||||
| Intrinsic LF, isotropic emission, | |||||||
| All | 151 | 1.494 | 52 () | ||||
| Unobscured | 67 | 0.203 | 7.5 () | ||||
| Obscured | 84 | 1.698 | 59 () | ||||
| Intrinsic LF, cosine-law emission, | |||||||
| All | 151 | 1.593 | 57 () | ||||
| Unobscured | 67 | 0.188 | 5.3 () | ||||
| Obscured | 84 | 1.565 | 66 () | ||||
a The normalization is given without an error because this parameter is strongly correlated with the others.
4 Intrinsic properties of local AGN
The observed LF just discussed has not been corrected for any effects associated with absorption or scattering of hard X-rays emitted by the AGN central source on the way between the source and the observer, nor for any intrinsic anisotropy of the emission generated by the central source in AGN. This observed LF is expected to be affected by absorption bias: an obscured AGN will be inferred to have a lower luminosity, (here, is the measured hard X-ray flux and is the distance to the source), than its intrinsic (i.e. emitted by the central source) luminosity, , and a source like this can be found in a flux-limited hard X-ray survey within a smaller volume of the Universe than it would be in the absence of X-ray absorption: . Here, the approximation simbol reflects the fact that AGN obscuration may also affect the shape of the measured X-ray spectrum and thus the number of photons recorded by a given detector with its specific energy response. On the other hand, as discussed below, unobscured AGN are expected to have higher observed luminosities than their intrinsic angular-averaged luminosities and can thus be detected within a larger . We can correct for both of these biases and obtain an intrinsic hard X-ray LF of local AGN. To this end, we use a physically motivated obscuration model described below.
4.1 Torus model and AGN spectra
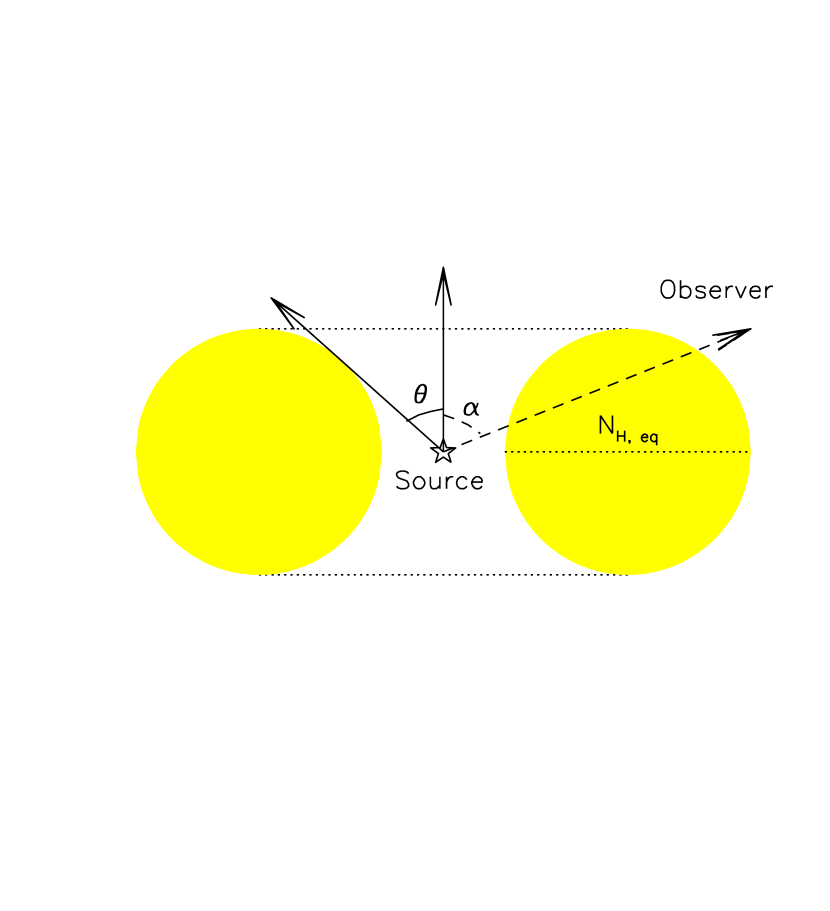
We have a developed a Monte-Carlo code for modelling AGN X-ray spectra modified by reprocessing in a toroidal structure of gas. The adopted geometry (see Fig. 7) is similar to that used in other existing models, e.g. Ikeda, Awaki, & Terashima (2009); Murphy & Yaqoob (2009); Brightman & Nandra (2011). The key assumptions of our model are:
-
1.
The geometrical shape is that of a ring torus;
-
2.
The gas is homogeneous, cold, neutral and of normal cosmic chemical composition;
-
3.
The X-ray spectrum emitted by the central source is a power law with an exponential cutoff, , with and keV;
-
4.
The central (point-like) source is either isotropic, – hereafter, Model A, or emitting according to Lambert’s law, , where is the viewing angle with respect to the axis of the torus – hereafter, Model B.
The introduction of Model B is an important aspect of the present study and is motivated by the common belief that the hard X-ray emission observed from AGN is produced by Comptonization of softer emission from an accretion disk around a SMBH in a hot corona lying above the disk. If such a corona has quasi-planar geometry, the hard X-ray flux it produces will be collimated along the axis of the disk/corona roughly as (the exact law being dependent on the photon energy and the optical depth of the corona, Pozdnyakov, Sobol, & Sunyaev 1983; Sunyaev & Titarchuk 1985), where is the cosine of the angle between the outgoing direction and the axis of the disk/corona. Because the obscuring torus in turn is likely coaligned with the accretion disk, the emergent hard X-ray radiation will be collimated along the axis of the torus. In reality, a significant fraction of the coronal emission is reflected by the underlying accretion disk, but this also occurs preferentially along the axis of the disk/torus (Magdziarz & Zdziarski, 1995). Since there is still significant uncertainty in the overall physical picture, we introduce a simple, energy independent collimation factor to get an idea of how strongly intrinsic collimation of hard X-ray emission can affect observed properties of local AGN.
Apart from the two alternatives for the angular dependence of intrinsic emission (Model A or Model B), our model has three free parameters: (i) the equatorial column density, (the total number of H atoms per cm2 along an equatorial line of sight between the central source and the observer, (ii) half-opening angle of the torus, , and (iii) the viewing angle relative to the axis of the torus, (see Fig. 7).
X-ray photons emitted by the central source can scatter multiple times within the torus before they either get photoabsorbed in the gas or escape from the system. Our radiative transfer calculations are based on a method developed by Churazov et al. (2008). The gas in the torus is assumed to be neutral, with the relative abundances of all elements as in the Solar photosphere. The following processes are included in the simulations: photoelectric absorption, Rayleigh and Compton scattering and fluorescence. Photoelectric absorption is calculated using the data and approximations of Verner & Yakovlev (1995) and Verner et al. (1996). For fluorescence we use the energies and yields from Kaastra & Mewe (1993). Compton and Rayleigh scattering are modelled using differential cross sections provided by the GLECS package (Kippen, 2004) of the GEANT code (Agostinelli et al., 2003). Namely, the Livermore Evaluated Photon Data Library (EPDL, see Cullen et al. 1990) and the Klein-Nishina formula for free electrons are used to calculate total cross-sections and the angular distribution of scattered photons for each element.
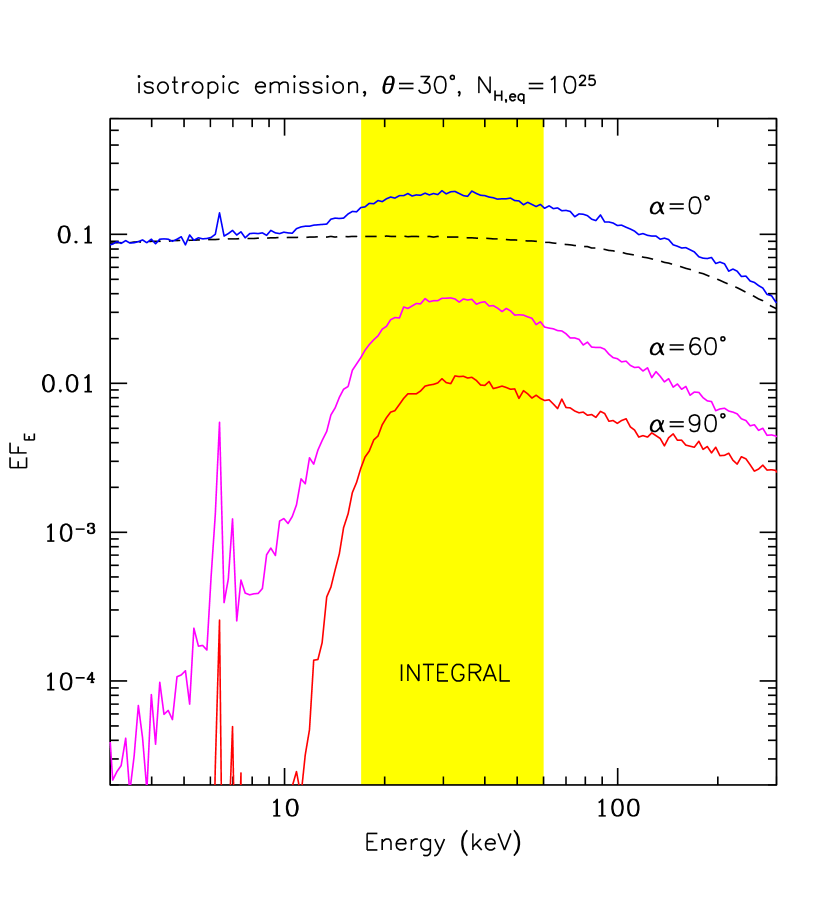
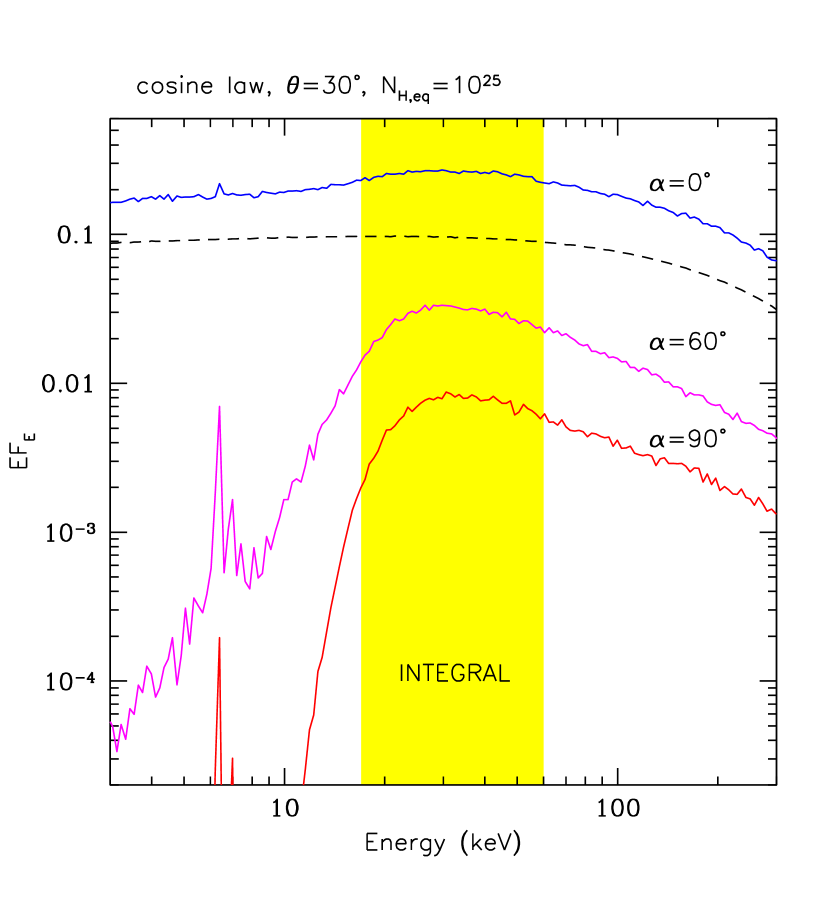
Figure 8 shows examples of emergent AGN spectra simulated using our model of the obscuring torus. As expected, for obscured AGN (), the observed hard X-ray flux can be strongly attenuated relative to the emitted flux and for high absorption columns ( cm-2) the spectrum can become reflection-dominated, as the observer will mostly see emission reflected from the inner walls of the torus rather than emission from the central source transmitted through the torus. In this last case, there also appear strong iron K and K fluorescent lines at 6.4 keV and 7.06 keV. These spectral properties and trends for heavily obscured AGN are of course well known.
We further see from Fig. 8 that the spectra observed from directions , corresponding to unobscured AGN, also differ from the intrinsic spectrum. Namely, they have an excess due to Compton reflection of hard X-rays from the torus in the direction of the observer. This hump is located approximately within the energy band of 17–60 keV that we use for detecting AGN in the INTEGRAL survey. It is obvious that this Compton reflection component should bias observed luminosities of unobscured AGN higher in this and similar (e.g. Swift/BAT) hard X-ray surveys. Any intrinsic collimation of emission along the axis of the obscuring torus will make this positive bias even stronger (see the spectrum for Model B and in the lower panel of Fig. 8). This important aspect is frequently overlooked in AGN population studies, even though a reflection component is well known to be present in the hard X-ray spectra of unobscured AGN.
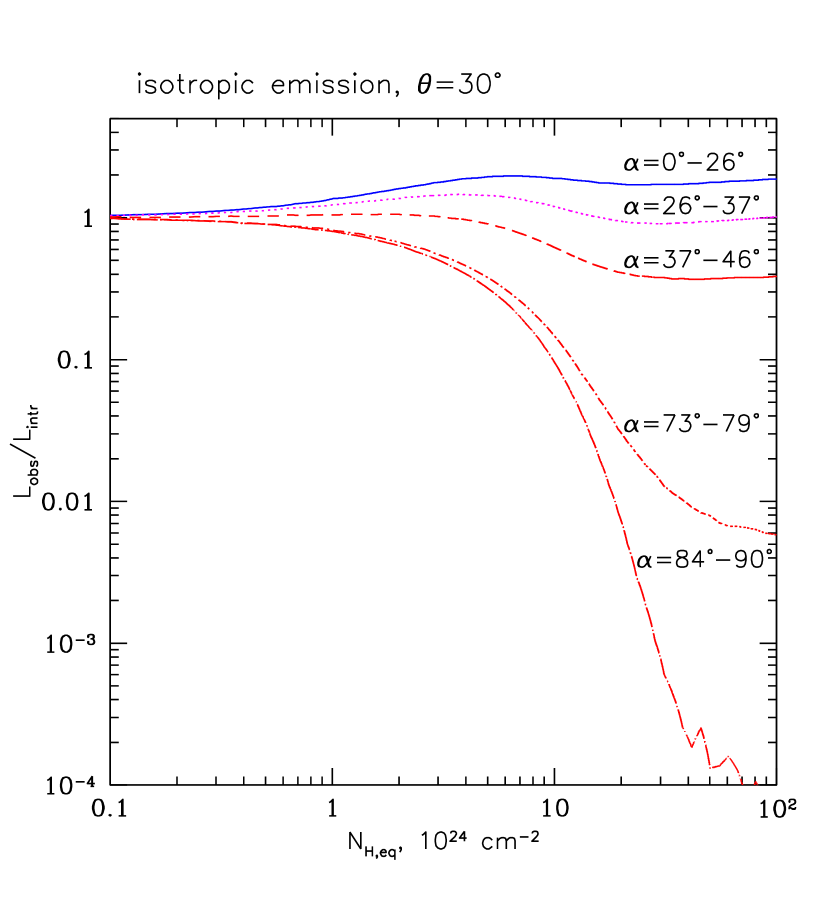
4.2 AGN detection bias
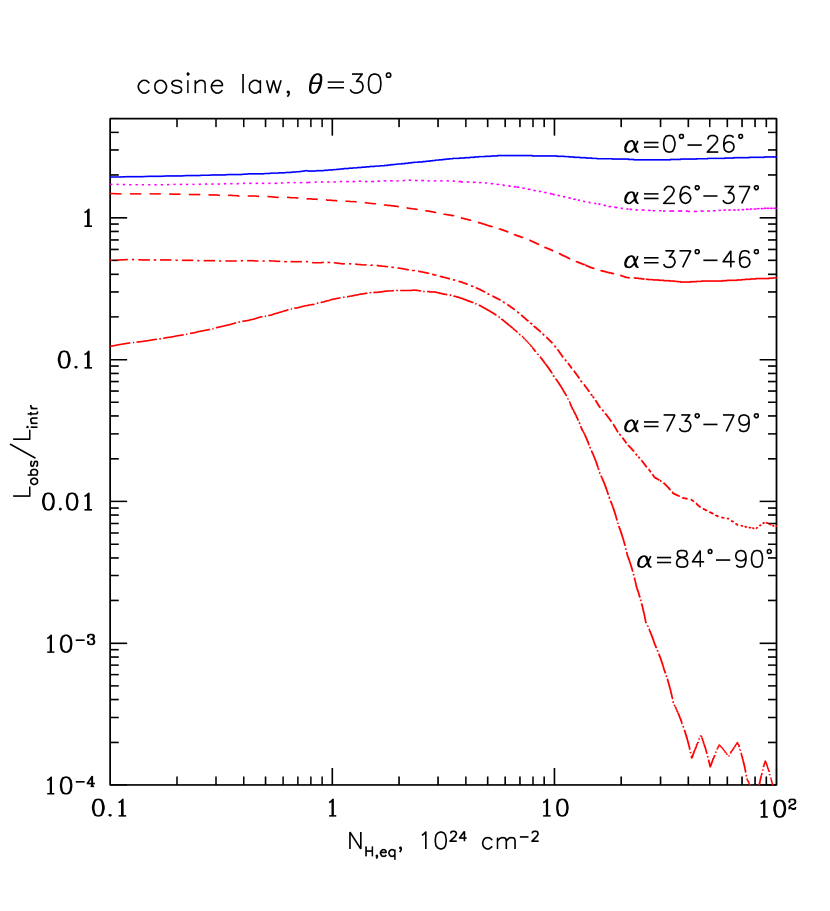
To quantify biases affecting detection of unobscured and obscured AGN in the INTEGRAL survey, we show in Fig. 9, for Model A and Model B, the ratio, , of the observed to intrinsic luminosity in the 17–60 keV energy band as a function of , for a torus half-opening angle and several narrow ranges of the viewing angle . One can see that is always larger than unity, i.e. , for unobscured AGN. For example, for Model A and , increases from 1 to as increases to a few cm-2 and remains at approximately this level thereafter. This trend can be easily understood: the amplitude of Compton reflection is expected to be proportional to the torus optical depth, , in the optically thin regime () and constant in the opposite case (). As regards obscured AGN (), decreases with increasing and increasing (apart from a local maximum at cm-2 at near-equatorial directions for Model B – due to the reflected component), as could be expected due to the increasing attenuation of the transmitted component. The most obvious and important difference of Model B with respect to Model A is that the observed hard X-ray flux is anisotropic even in the absence of an obscuring torus (i.e. for ) – just due to the initial collimation of emission.
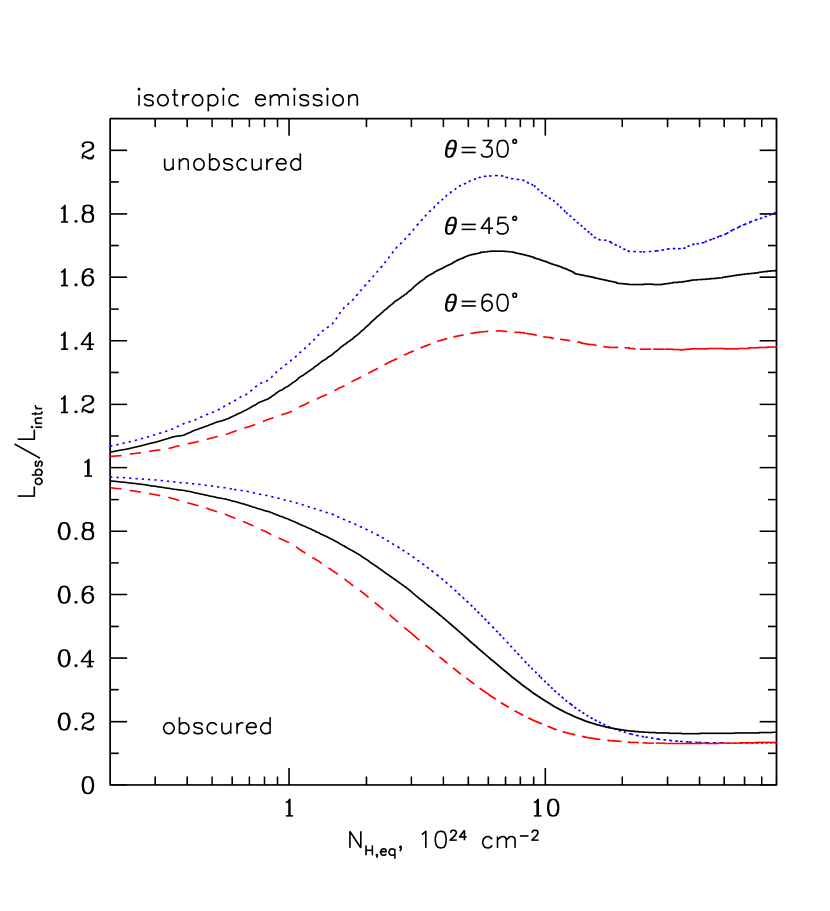
We can proceed further and ask the question: what would be the average observed/intrinsic flux ratio for the local populations of unobscured and obscured AGN if (i) AGN tori were randomly oriented with respect to the observer, which is a natural assumption, and (ii) all the tori had the same half-opening angle (this, of course, permits the physical size of the torus to vary from one object to another and e.g. to depend on luminosity). To this end, we just need to average the dependencies shown in Fig. 9 over the viewing angle for the unobscured and obscured directions:
| (3) |
| (4) |
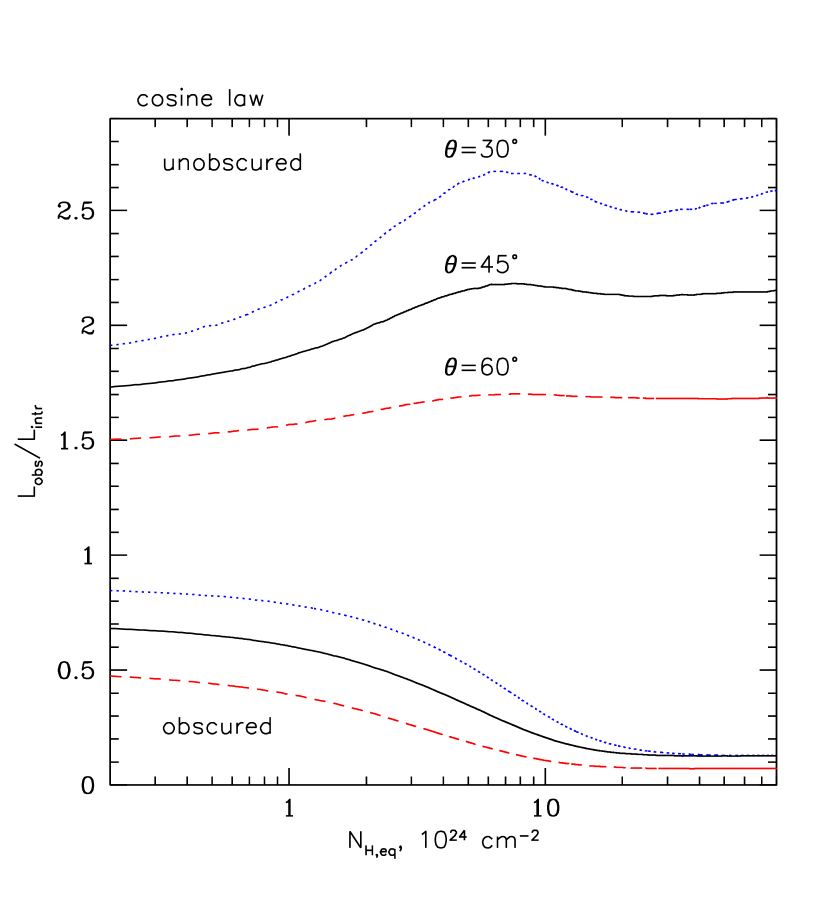
The result is shown in Fig. 10 as a function of for torus half-opening angles , and . One can see that for Model A, (the average observed/intrinsic flux ratio for unobscured AGN) reaches a maximum of –2, depending on , at cm-2, then declines to –1.7 by cm-2 and stays at approximately this level for higher column densities. The average ratio for obscured AGN monotonically decreases from to as increases from cm-2 to cm-2 and stays at this level thereafter. In the case of a cosine-law emitting source, the situation is qualitatively similar, but the contrast between the unobscured and obscured directions is more pronounced: it is present already at and increases further, due to Compton reflection, with increasing .
It is obvious from Fig. 10 that a hard X-ray survey, like the ones performed by INTEGRAL and Swift, will find unobscured AGN more easily than even lightly obscured objects, let along heavily obscured ones. Our goal now is to correct the observed statistical properties of local AGN for this obvious bias.
4.3 Intrinsic distribution of torus column densities
We can first estimate the intrinsic distribution of the column densities, , of AGN torii. To this end, we need to correct the observed distribution (Fig. 3) for absorption bias, excluding from the consideration the first, cm-2, bin since it pertains to unobscured AGN for which our line of sight does not cross the torus. Given the fairly small number of obscured AGN, especially of heavily obscured ones, in our sample, we are bound to make some simplifying assumptions. For example, we may assume that the intrinsic distribution does not depend on luminosity. In this case, the intrinsic distribution can be estimated simply by dividing the observed one by (and normalising the resulting dependence so that its integral over equals unity), with the bias factor having been discussed in §4.2.
In doing this exercise, we assumed that for our obscured AGN. This is because we do not know the orientation of our objects apart from the fact that some of them are unobscured and hence , while others are obscured and hence . For our assumed torus geometry (see Fig. 7), the line-of-sight column density depends on the viewing angle as follows:
| (5) |
so that the mean over all obscured directions is
| (6) |
Hence the coefficient in the conversion of to above. Note that the values adopted from the literature for some of our Compton-thick AGN may already have been ascribed the meaning of an equatorial rather than line-of-sight column density by the corresponding authors. However, considering our sample of heavily obscured sources as a whole, the information it contains on the absorption columns is very heterogeneous, as it is based on various spectral models used by various authors. Fortunately, a typical expected difference between and for obscured AGN is only % (see equation (6) above) and has negligible impact on our results.


The resulting intrinsic distribution is presented in Fig. 11. It is only weakly dependent on both the assumed half-opening angle of the obscuring torus and the assumed emission model (Model A or Model B). This distribution can be roughly described as log-uniform between and cm-2, although the upper boundary is, of course, fairly uncertain. A similar result was previously obtained using AGN from the Swift/BAT hard X-ray survey (Burlon et al., 2011; Ueda et al., 2014). Moreover, the intrinsic distribution shown in Fig. 11 is similar to the one inferred for optically selected Seyfert 2 galaxies (Risaliti, Maiolino, & Salvati, 1999).
4.4 Intrinsic luminosity function
We now calculate the intrinsic hard X-ray LF of unobscured and obscured AGN, . As for the observed LFs discussed in §3, we use both binned and analytic representations.
For the binned LFs, the procedure is as follows:
-
1.
First, based on the observed luminosity and estimated torus column density of each source in the sample (Table 3), we determine its intrinsic hard X-ray luminosity as either (for unobscured sources) or (for obscured sources), where the ratios and are calculated as discussed above (from eqs. (3) and (4), see Fig. 10), assuming some (the same for all objects) torus half-opening angle and using Model A or Model B. Here again we use the average ratios and rather than the viewing-angle dependent from which they derive for the lack of knowlegde of the orientation of our objects. Strictly speaking, this procedure is not fully correct, because for given and , a hard X-ray flux limited survey will preferentially find objects with smaller viewing angles within the corresponding groups of and , as is clear from Fig. 9. However, this may be regarded as a next-order correction to the bias considered here and does not significantly affect our results, as we verify in §5.
As was said before, the values for our obscured objects are estimated from their measured columns as . However, we cannot determine similarly the torus column densities for our unobscured AGN111In principle, one could try to estimate for unobscured AGN from the contribution of the reflection component to the observed spectrum, but that requires high-quality hard X-ray data, which is not always available, and is model-dependent. In particular, the result will depend on the unknown opening angle .. Therefore, we simply assume that cm-2 for these objects, since this is approximately the median value of the inferred intrinsic absorption column distribution for obscured AGN (see Fig. 11).
-
2.
Second, we calculate for each source the volume of the Universe, , over which AGN with such observed luminosity can be detected in the INTEGRAL survey. Since the detection limit for a given hard X-ray instrument (IBIS in our case) is actually determined by photon counts, it should depend on the observed X-ray spectral shape, which for the problem at hand is affected by absorption and reflection in the torus (see examples of AGN spectra in Fig. 8). We correct for this effect, but this correction proves to be negligible (as is the -correction due to cosmological redshift). As a result, we obtain essentially the same for our sources as we used in constructing the observed LF in §3).
-
3.
The final step consists of summing up the contributions of the individual sources, i.e. adding the for each AGN of a given class (unobscured or obscured) to the space density of such objects within a luminosity bin containing (rather than ) for this source.
To obtain analytic forms of the intrinsic LFs, we use the same broken power-law model as for our observed LFs but a different likelihood estimator:
| (7) |
Here are the same estimates of the intrinsic luminosities of our objects as we used before to construct the binned intrinsic LFs (i.e. calculated from using the actual estimates for the obscured AGN and assuming that cm-2 for the unobscured ones), but is now the volume over which AGN with given intrinsic luminosity and torus column density can be detected in the INTEGRAL survey. To calculate these volumes, we again use the -averaged quantities (in fitting the intrinsic LF of unobscured AGN) and (in fitting the intrinsic LF of obscured AGN). The integrals over in equation (7) are computed from to cm-2, i.e. we assume that the intrinsic distribution of torus column densities is log-uniform over this range, as suggested by the result of our preceeding analysis shown in Fig. 11.
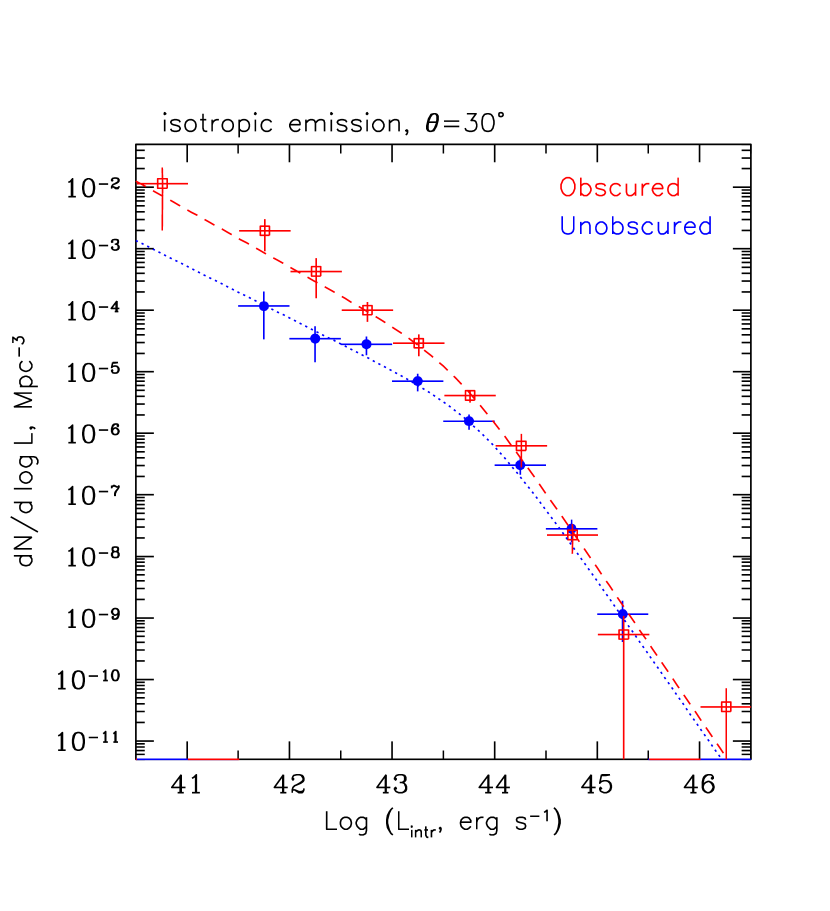
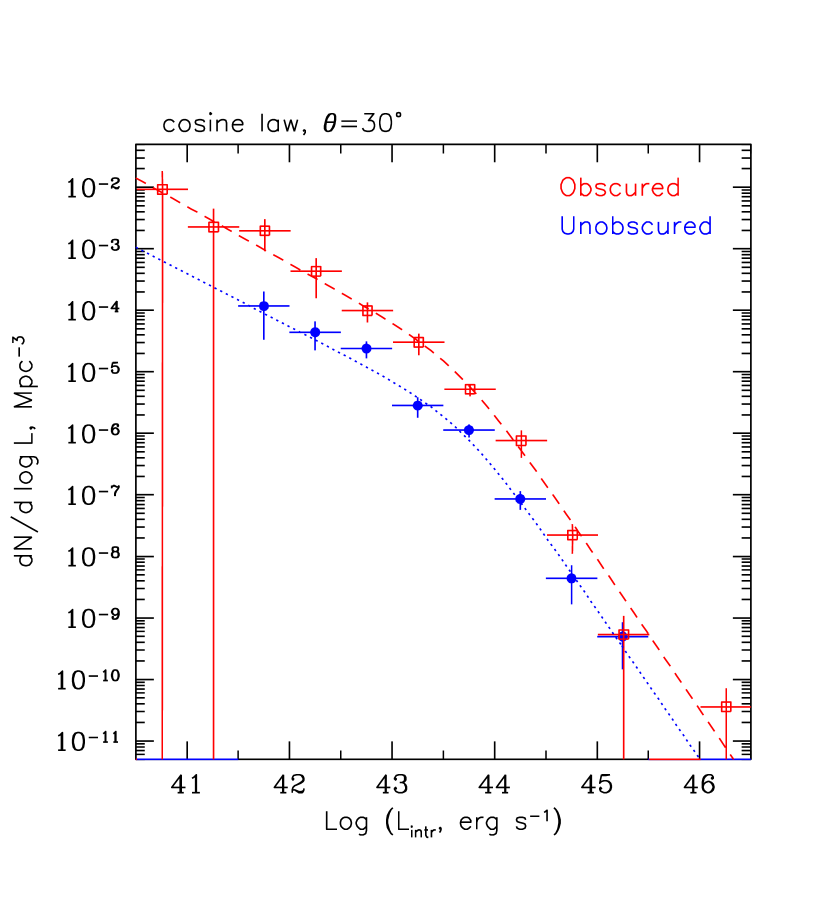
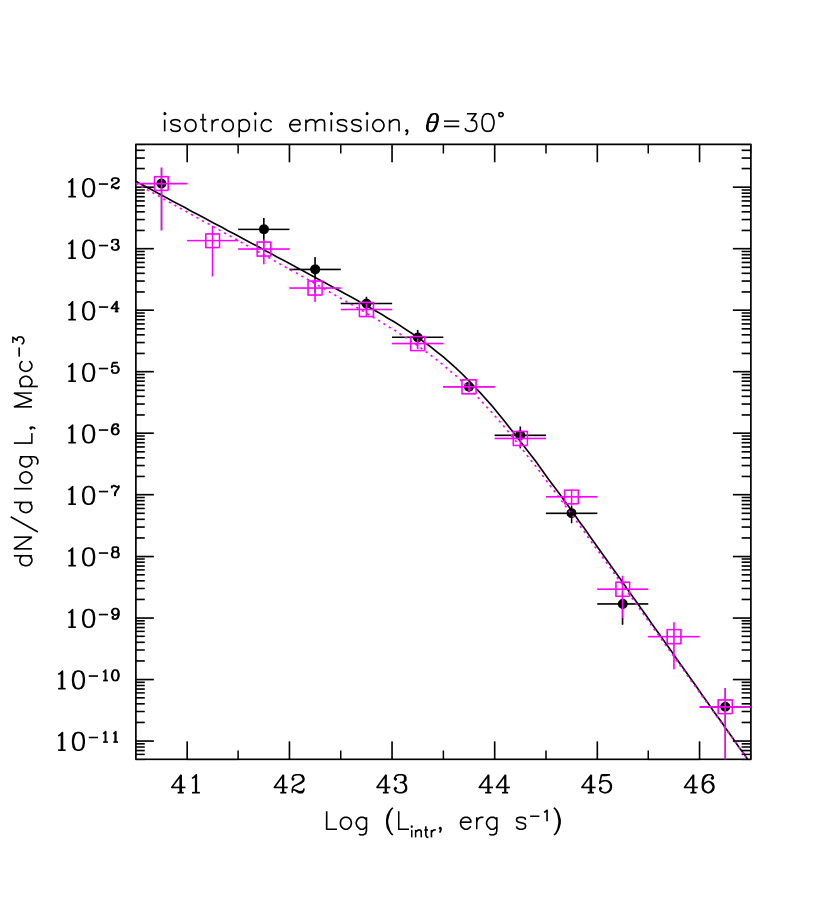

Figure 12 shows the resulting intrinsic LFs for unobscured and obscured AGN, calculated assuming for Model A and Model B. We see that in the former case, the shapes of the intrinsic LFs of unobscured and obscured AGN are clearly different from each other, although to a lesser degree that it was for the observed LFs (Fig. 6) from which they derive. However, for Model B the intrinsic LFs of unobscured and obscured AGN are not significantly different in shape from each other. These conclusions are verified by the best-fit parameters obtained for these LFs (see Table 2). Note that the derived intrinsic LFs (both binned and analytic ones) are only weakly sensitive to the torus half-opening angle that was assumed in constructing them, and nearly the same results are obtained for and . This is due to the weak sensitivity of the and factors to (see Fig. 10).
The transformation of the observed binned LFs to the intrinsic ones can be understood as follows: (i) all unobscured AGN making up the LF shift by the same amount, and for Model A and Model B, respectively, to the left along the luminosity axis (since we have assumed the same equatorial optical depth of the torus, cm-2, for all of our unobscured objects), and (ii) each obscured AGN from the INTEGRAL sample moves its own distance to the right-hand side of the plot, this shift being small for lightly obscured objects ( cm-2) but substantial (up to for cm-2) for heavily obscured ones.
Finally, we can calculate the intrinsic LF of the entire local AGN population, by summing up the contributions of unobscured and obscured sources. In obtaining the analytic fit in this case, we define as follows:
| (8) |
where and are the corresponding volumes for unobscured and obscured AGN. The resulting LF is shown in Fig. 13 and its best-fit parameters are presented in Table 2.
One can see that the total intrinsic LF is not very different from the total observed LF. This means that the two effects observed in Fig. 12, namely the shift of the LF of unobscured AGN to lower luminosities and the shift of the LF of obscured AGN to higher luminosities almost compensate each other, with this conclusion being only weakly sensitive to the assumed torus opening angle and angular dependence of intrinsic emission.
4.5 Total AGN space density
Integration of the total intrinsic and observed LFs over luminosity suggests that the cumulative hard X-ray luminosity density of local AGN may be underestimated by the observed LF by –30%, although this increase is statistically insignificant (see Table 2). Specifically, the intrinsic luminosity density of AGN with erg s-1 is found to be erg s-1 Mpc-3 (17–60 keV), with the exact value slightly depending on our assumptions (see Table 2).
For our assumed intrinsic AGN spectrum (), the ratio of luminosities in the 2–10 keV and 17–60 keV energy bands is about unity. Therefore, the luminosity density of AGN with erg s-1 may be estimated at erg s-1 Mpc-3 also in the standard X-ray band (2–10 keV). We may compare this value with a prediction for based on a redshift-dependent intrinsic luminosity function derived by Ueda et al. (2014) using a large heterogenous sample of AGN compiled from various surveys. Integration of this LF over the luminosity range from to erg s-1 gives erg s-1 Mpc-3 (2–10 keV), which is a factor of smaller than the above estimate. In reality, the / ratio may well be rather than due to the expected presence in AGN spectra of a Compton reflection component associated with the accretion disk. In fact, this component was already discussed in §4.1 as one of the reasons why hard X-ray emission may be intrinsically collimated in AGN and is implicitly taken into account in our anisotropic Model B. Taking this spectral component into account, we can lower our estimate of the luminosity density to erg s-1 Mpc-3 (2–10 keV), which is still higher than the Ueda et al. (2014) result by a factor of . The remaining difference may be related to the different procedures used in these works to construct the intrinsic LFs and to the larger and more complete sample of local heavily obscured AGN used in our study.
4.6 Intrinsic dependence of obscured AGN fraction on luminosity
Similarly to the observed LF, the observed dependence of the fraction of obscured AGN on luminosity (Fig. 4) must be affected by AGN detection biases. By removing these biases one can obtain an intrinsic dependence of the obscured AGN fraction on luminosity. To this end, we should simply divide the intrinsic LF of obscured AGN by the total intrinsic LF. The result is presented in Fig. 14 for , Model A and Model B, and in Fig. 15 for .
We see that in the case of isotropic emission the declining trend of obscured AGN fraction with luminosity is retained upon removing the absorption bias, although the intrinsic obscured fraction at any luminosity is significantly higher compared to the observed fraction (see Fig. 4). We can interpret this result in terms of the torus opening angle, i.e. the fraction of the sky that will be shielded from the central source by a toroidal structure of gas. To this end, we have drawn in Figs. 14 and 15 four horizontal lines corresponding to , , and . We see that if the central sources in AGN are isotropic, then the torus opening angle must be smaller than in low-luminosity objects ( erg s-1) and increasing to – in high-luminosity ones ( erg s-1).


If, however, the emission from the central SMBH is collimated as , then the derived intrinsic dependence of the obscured AGN fraction on luminosity is in fact consistent with the opening angle of the torus being constant with luminosity, namely – see the bottom panel in Fig. 14.
Importantly, these conclusions are almost insensitive to the opening angle (within the range –) of the torus that we actually assumed in deriving the intrinsic luminosity dependences of the obscured AGN fraction (compare the results for and in Figs. 14 and 15). This is again due to the fact that the and ratios, which characterise observational biases for our AGN sample and which we have corrected for, are, for a given emission law (Model A or Model B), primarily determined by the torus column density (see Fig. 10). Hence, the derived intrinsic luminosity dependences of the obscured AGN fraction are quite robust but depend on the actual degree of collimation of the AGN central source.
5 Direct convolution model
We have demonstrated that positive bias with respect to unobscured AGN and negative bias with respect to obscured AGN in flux-limited hard X-ray surveys together strongly affect the observed dependence of the obscured AGN fraction on luminosity. Our preceeding analysis consisted of convering the observed LFs of unobscured and obscured AGN to the intrinsic LFs of these populations. In solving this ’inverse problem’, we used a number of simplifications that we noted were unlikely to have significant impact on our results. In particular, we used the viewing angle-averaged conversion factors and rather than the and ratios from which they derive. We also assumed a fixed torus column density, cm-2, for all of our unobscured AGN. To verify that these assumptions were reasonable, we now perform a ’direct convolution’ test, as described below:
-
1.
Assume that the tori in local AGN have the same half-opening angle .
-
2.
Assume that local AGN are oriented randomly with respect to us.
-
3.
Assume that the AGN central source is isotropic or, alternatively, emitting according to Lambert’s law ().
-
4.
Assume that the intrinsic distribution of AGN torus column densities does not depend on luminosity and is log-uniform between and . Such a distribution, with cm-2 and cm-2, approximately matches the real distribution we have inferred using the INTEGRAL sample (see Fig. 11).
-
5.
Adopt the intrinsic AGN LF as derived in our preceeding analysis for given and emission law (see Table 2).
-
6.
Use the above set of assumptions specifying the intrinsic properties of the local AGN population to simulate, using our torus obscuration model, AGN properties as would be observed in the INTEGRAL survey.
The main difference with respect to the inverse problem is that the ratio now explicitly depends on the viewing angle, which is randomly drawn for each simulated source, and on , which is drawn from the assumed log-uniform distribution for each simulated source, both for obscured AGN and for unobscured ones.
Figure 16 shows the simulated luminosity dependences of the observed obscured AGN fraction for and either isotropic or cosine-law emission; Fig. 17 shows the corresponding results for . As our baseline distribution we use cm-2 and cm-2 (solid lines), but we also show results obtained for cm-2 and cm-2 and for cm-2 and cm-2. The results of simulations are compared with the luminosity dependence actually observed with INTEGRAL.


We see that the luminosity dependence of the observed obscured AGN fraction predicted for the case of isotropic emission and is inconsistent with the INTEGRAL data ( per 8 data points between and erg s-1). The isotropic model with a larger torus opening angle, , provides a better match but the fit is nevertheless poor ( per 8 data points). Among the four presented cases, the best agreement between simulations and observations is achieved in the case of cosine-law emission and ( per 8 data points). These results confirm our previously reached conclusion that unless hard X-ray emission in AGN is intrinsically collimated, there must be an intrinsic declining trend of the torus opening angle with increasing AGN luminosity.
Nevertheless, Figs. 16 and 17 clearly demonstrate that biases associated with detection of AGN in flux-limited hard X-ray surveys inevitably lead to the observed fraction of obscured AGN being dependent on luminosity even if this quantity has no intrinsic luminosity dependence. Specifically, in such a case, the observed obscured fraction approaches a constant value in the limit of , and another, lower limiting value at . It is easy to show that, if the intrinsic ratio of obscured and unobscured AGN is , then their observed ratio will be:
| (9) |
where and are the appropriately ensemble-averaged bias factors () for unobscured and obscured AGN, respectively, and is the (effective) slope of the luminosity function. For example, in the case of cosine-law emission and , the corresponding bias factors averaged over the log-uniform distribution (see Fig. 10) are and , whereas . Therefore, for our inferred intrinsic AGN LF, with and in the low- and high-luminosity ends, respectively, and , we may expect and at and erg s-1, respectively. This corresponds to the obscured AGN fractions and , respectively, which is approximately what we see in Fig. 16 for the results of simulations with the cosine-law emission law and .
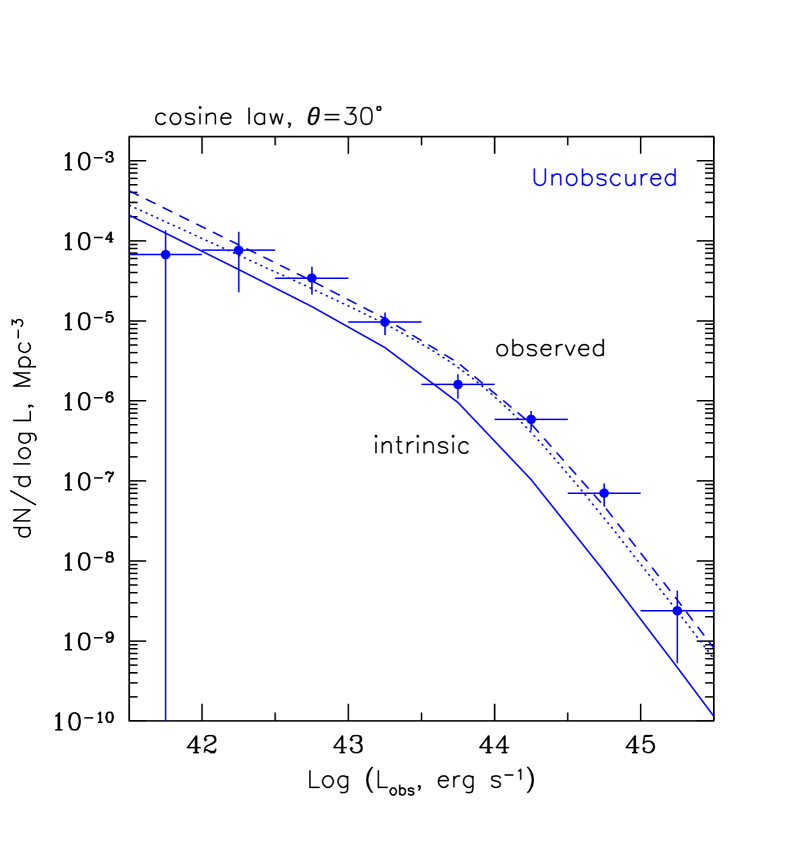
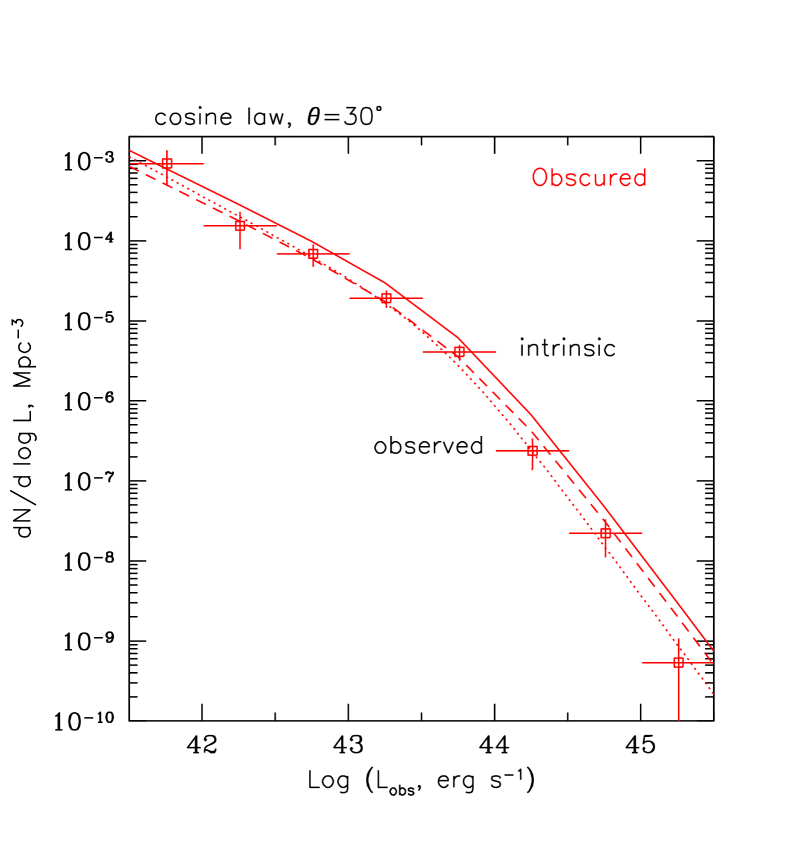
Figure 18 shows how our direct convolution model predicts the observed LFs of unobscured and obscured AGN in the case of cosine-law emission and . We see that for unobscured AGN, the simulated observed LF fits the INTEGRAL data well. In the case of obscured AGN, the match between the simulated and actually observed LFs is good below erg s-1, but a significant deviation is evident at higher luminosities. This probably reflects the intrinsic differences between the inverse and direct approaches to the considered problem, discussed at the beginning of this section. Nevertheless, this difference does not significantly affect the conclusions of this study.
Note that in reality the situation may be more complicated. For example, the intrinsic distribution may depend on luminosity. Also, the obscuring gas may be clumpy, so that the distribution observed for obscured AGN may represent not only the distribution of torus column densities over the AGN population but also the distribution of line-of-sight columns over different observing directions for a given AGN torus. It would be interesting to study this and other possibilities in future work, when significantly larger samples of hard X-ray selected AGN become available.
6 Discussion and summary
We utilised a sample of about 150 local () hard X-ray selected AGN, with reliable information on X-ray absorption columns, to find out how strongly the observed declining trend of the obscured AGN fraction with increasing luminosity may be affected by selection effects. Using a torus-obscuration model and a state-of-the-art radiative transfer code, we demonstrated that there must exist not only a negative bias, due to absorption in the torus, in finding obscured AGN in hard X-ray flux limited surveys, but also a positive bias in detecting unobscured AGN – due to reflection by the torus of part of the radiation emitted by the central source towards the observer. We further pointed out that these two biases may in fact be even stronger if one takes into account plausible intrinsic collimation of hard X-ray emission along the axis of the obscuring torus, which can arise both in the hot corona where the hard X-ray emission presumably originates and as a result of reflection of part of this radiation by the underlying, optically thick accretion disk.
We demonstrated that for an AGN luminosity function that steepens at high luminosities, which is indeed the case, these observational biases should inevitably lead to the observed fraction of obscured AGN being smaller in the high-luminosity end of the LF than in the low-luminosity end even if the obscured AGN fraction has no intrinsic luminosity dependence. Moreover, even in the low-luminosity part of the LF, the observed obscured fraction will be lower than its intrinsic value.
We explored two possibilities for the central hard X-ray source in AGN: (i) isotropic emission and (ii) emission collimated according to Lambert’s law, . In the former case, the intrinsic (i.e. corrected for the biases discussed above) obscured AGN fraction reconstructed from our INTEGRAL sample still shows a declining trend with luminosity, although the inferred intrinsic obscured fraction is larger than the observed one at any luminosity. Namely, the obscured fraction is larger than % at erg s-1 (17–60 keV), and decreases to % at erg s-1. In terms of the half-opening angle of an obscuring torus, this implies that in lower-luminosity AGN, and in higher-luminosity ones. If, however, the emission from the central SMBH is collimated as , then the derived intrinsic dependence of the obscured AGN fraction is consistent with the opening angle of the torus being constant with luminosity, namely .
At the moment, we regard both possiblities – intrinsic obscuring AGN fraction declining with luminosity or being constant – as feasible, as they depend on the presently poorly understood angular emission diagram of the central source in AGN. We note however that a luminosity-independent obscured AGN fraction might be consistent with findings of some studies based on non-X-ray selected AGN samples (see Lawrence & Elvis 2010 for a discussion). We also note that the intrinsic ratio of obscured to unobscured AGN that follows from our study, which changes with luminosity from to in the case of isotropic emission and is in the case of cosine-law emission, is not very different from the ratio inferred for optically selected AGN by Maiolino & Rieke (1995). A more careful comparison of these and other existing estimates of the ratio of obscured and unobscured AGN in future work may help us get insight into the geometrical and physical properties of obscuration in AGN, which may be different in X-ray, optical, infrared and radio bands.
The intrinsic dependence of the obscured AGN fraction on luminosity derived here can find application in modelling the cosmic X-ray background (CXB). Importantly, the inferred obscured fractions are somewhat larger (even without allowance for possible intrinsic collimation of X-ray emission in AGN) than those adopted in some popular CXB synthesis models (e.g. Treister & Urry 2005; Gilli, Comastri, & Hasinger 2007; Ueda et al. 2014) – for example compare our Figs. 14 and 15 with Fig. 13 in Gilli, Comastri, & Hasinger 2007 and Fig. 5 in Ueda et al. 2014 (note, however, that these plots use the 2–10 keV energy band while we use 17–60 keV).
As a byproduct, we reconstructed the intrinsic hard X-ray luminosity function of local AGN and estimated the total number density and luminosity density of AGN with erg s-1 (17–60 keV and 2–10 keV), which may be used as reference values in the study of cosmic AGN evolution and in modelling the cosmic X-ray background.
The constraints on the intrinsic dependence of the obscured AGN fraction on luminosity obtained in this work can be improved in the near future using larger samples of hard X-ray selected AGN from INTEGRAL, Swift and NuSTAR surveys (see Lansbury et al. 2015 for a new constraint on the abundance of heavily obscured AGN from NuSTAR data). Note however that it will be practially impossible to improve the current, fairly uncertain estimate of the obscured AGN fraction at the highest luminosities ( erg s-1) in the local Universe, since the INTEGRAL and Swift all-sky surveys are sensitive enough to detect all such objects in the local () Universe and have found just a few of them because of the very low space density thereof.
We finally note that AGN selection effects similar to those discussed for hard X-ray surveys in this work should also affect obscured AGN fractions inferred from samples selected in X-rays (at energies below 10 keV). This should be studied in future work.
Acknowledgments
This study was supported by the Russian Foundation for Basic Research (grant 13-02-01365). We thank the referee for useful comments.
Appendix A AGN catalogue
Table 3 presents the sample of non-blazar AGN at used in this work. It is based on the catalogue of sources (Krivonos et al., 2010b) detected during the INTEGRAL/IBIS 7-year all-sky survey. After publication of this catalogue, three previously unidentified sources, IGR J13466+1921, IGR J144884009 and IGR J17036+3734 have been proved to be AGN and hence added to our sample. For 31 nearby (closer than 40 Mpc) objects we adopt distance estimates from the Extragalactic Distance Database (EDD)222http://edd.ifa.hawaii.edu/, whereas the distances of the remaining objects are estimated from their redshifts, which are adopted from NED. The quoted hard X-ray luminosities are observed ones, calculated from the adopted distances and measured hard X-ray (17–60 keV) fluxes (Krivonos et al., 2010b).
For this study, the most important AGN property is X-ray absorption column density. The corresponding information has been updated with respect to our previous publications (Sazonov & Revnivtsev, 2004; Sazonov et al., 2007, 2012) whenever necessary and possible. The last column of Table 3 provides relevant references.
| Object | z | Ref. | Ref. | |||
|---|---|---|---|---|---|---|
| Mpc | erg s-1 | cm-2 | ||||
| IGR J00040+7020 | 0.0960 | 442.4 | 44.31 | 3 | 2 | |
| SWIFT J0025.8+6818 | 0.0120 | 52.0 | 42.51 | 3 | ||
| MRK 348 | 0.0150 | 65.2 | 43.69 | 30 | 4 | |
| ESO 297-G018 | 0.0252 | 110.4 | 43.86 | 50 | 5 | |
| IGR J015280326 | 0.0172 | 74.9 | 43.06 | 14 | 6 | |
| NGC 788 | 0.0136 | 59.0 | 43.33 | 40 | 4 | |
| MRK 1018 | 0.0424 | 188.1 | 43.69 | 7,8 | ||
| IGR J020861742 | 0.1290 | 607.6 | 44.77 | 9 | ||
| LEDA 138501 | 0.0492 | 219.4 | 44.18 | 10 | ||
| MRK 590 | 0.0264 | 115.7 | 43.26 | 11 | ||
| SWIFT J0216.3+5128 | 0.4220 | 2322.8 | 46.15 | 3 | 7 | |
| MRK 1040 | 0.0167 | 72.7 | 43.40 | 12 | ||
| IGR J02343+3229 | 0.0162 | 70.5 | 43.26 | 2 | 13 | |
| NGC 985 | 0.0431 | 191.3 | 43.91 | 14 | ||
| NGC 1052 | 0.0050 | 19.4 | 1 | 41.89 | 20 | 15 |
| NGC 1068 | 0.0038 | 12.3 | 1 | 41.58 | 16 | |
| IGR J025240829 | 0.0168 | 73.1 | 42.97 | 12 | 9 | |
| NGC 1142 | 0.0288 | 126.5 | 43.99 | 50 | 4 | |
| NGC 1194 | 0.0136 | 59.0 | 42.82 | ? | 17 | |
| IGR J03249+4041 | 0.0476 | 212.0 | 43.84 | 3 | 18 | |
| IGR J03334+3718 | 0.0550 | 246.3 | 44.17 | 7,18 | ||
| NGC 1365 | 0.0055 | 18.0 | 1 | 42.16 | 19 | |
| ESO 548-G081 | 0.0145 | 63.0 | 43.21 | 20 | ||
| 3C 105 | 0.0890 | 408.2 | 44.69 | 30 | 7,8 | |
| 3C 111 | 0.0485 | 216.1 | 44.53 | 21 | ||
| IRAS 04210+0400 | 0.0450 | 200.0 | 43.98 | 30 | 7,18 | |
| 3C 120 | 0.0330 | 145.4 | 44.14 | 11 | ||
| UGC 03142 | 0.0217 | 94.8 | 43.59 | 3 | 7 | |
| CGCG 420-015 | 0.0294 | 129.2 | 43.51 | 3 | ||
| ESO 033-G002 | 0.0181 | 78.9 | 43.05 | 1 | 22 | |
| LEDA 075258 | 0.0160 | 69.6 | 42.75 | 7,18 | ||
| XSS J050542348 | 0.0350 | 154.4 | 44.13 | 6 | 23 | |
| IRAS 05078+1626 | 0.0179 | 78.0 | 43.66 | 24 | ||
| ARK 120 | 0.0327 | 144.0 | 44.02 | 25 | ||
| ESO 362-G018 | 0.0124 | 53.8 | 43.10 | 26 | ||
| PIC A | 0.0351 | 154.9 | 44.01 | 11 | ||
| NGC 2110 | 0.0078 | 29.0 | 1 | 43.11 | 14 | 27 |
| MCG 8-11-11 | 0.0204 | 89.0 | 43.92 | 11 | ||
| MRK 3 | 0.0135 | 58.6 | 43.45 | 100 | 28 | |
| PMN J06236436 | 0.1289 | 607.1 | 44.73 | 29 | ||
| IGR J062396052 | 0.0405 | 179.4 | 43.80 | 20 | 30 | |
| IGR J06415+3251 | 0.0172 | 74.9 | 43.39 | 16 | 31 | |
| MRK 6 | 0.0188 | 81.9 | 43.52 | 32 | ||
| IGR J075634137 | 0.0210 | 91.7 | 43.08 | 33 | ||
| ESO 209-G012 | 0.0405 | 179.4 | 43.80 | 34 | ||
| IGR J08557+6420 | 0.0370 | 163.5 | 43.64 | 20 | 7,18 | |
| IRAS 091496206 | 0.0573 | 257.0 | 44.19 | 10 | ||
| IGR J09253+6929 | 0.0390 | 172.6 | 43.66 | ? | 35 | |
| NGC 2992 | 0.0077 | 29.0 | 1 | 42.75 | 1 | 36 |
| MCG -5-23-16 | 0.0085 | 36.8 | 43.27 | 2 | 11 | |
| IGR J095226231 | 0.2520 | 1276.8 | 45.37 | 6 | 37 | |
| NGC 3081 | 0.0080 | 28.6 | 1 | 42.64 | 100 | 38 |
| ESO 263-G013 | 0.0333 | 146.7 | 43.72 | 30 | 39 | |
| NGC 3227 | 0.0039 | 26.4 | 1 | 42.84 | 4 | |
| NGC 3281 | 0.0107 | 46.3 | 43.08 | 200 | 40 | |
| IGR J103864947 | 0.0600 | 269.6 | 44.05 | 1 | 4 | |
| IGR J104044625 | 0.0239 | 104.6 | 43.48 | 3 | 4 | |
| NGC 3516 | 0.0088 | 38.0 | 1 | 42.87 | 11 | |
| NGC 3783 | 0.0097 | 25.1 | 1 | 42.95 | 4 | |
| IGR J114596955 | 0.2440 | 1230.9 | 45.31 | 7,41 | ||
| IGR J12009+0648 | 0.0360 | 159.0 | 43.67 | 11 | 31 |
| Object | z | Ref. | Ref. | |||
|---|---|---|---|---|---|---|
| Mpc | erg s-1 | cm-2 | ||||
| IGR J120265349 | 0.0280 | 122.9 | 43.75 | 2 | 33 | |
| NGC 4051 | 0.0024 | 17.1 | 1 | 41.97 | 11 | |
| NGC 4138 | 0.0030 | 13.8 | 1 | 41.60 | 8 | 42 |
| NGC 4151 | 0.0033 | 11.2 | 1 | 42.66 | 8 | 11 |
| IGR J12107+3822 | 0.0229 | 100.1 | 43.14 | 3 | 7 | |
| NGC 4235 | 0.0080 | 31.5 | 1 | 42.06 | 7 | |
| NGC 4253 | 0.0129 | 56.0 | 42.74 | 43 | ||
| NGC 4258 | 0.0015 | 7.6 | 1 | 40.95 | 7 | 44 |
| MRK 50 | 0.0234 | 102.4 | 43.21 | 24 | ||
| NGC 4388 | 0.0084 | 16.8 | 1 | 42.78 | 40 | 36,45 |
| NGC 4395 | 0.0011 | 4.7 | 1 | 40.55 | 2 | 46 |
| NGC 4507 | 0.0118 | 51.2 | 43.56 | 47 | ||
| ESO 506-G027 | 0.0250 | 109.5 | 43.76 | 100 | 48 | |
| XSS J123891614 | 0.0367 | 162.1 | 43.98 | 2 | 33 | |
| NGC 4593 | 0.0090 | 37.3 | 1 | 42.96 | 4 | |
| WKK 1263 | 0.0244 | 106.8 | 43.39 | 31 | ||
| NGC 4939 | 0.0104 | 34.7 | 1 | 42.36 | ? | 49 |
| NGC 4945 | 0.0019 | 3.4 | 1 | 41.41 | 400 | 50 |
| ESO 323-G077 | 0.0150 | 65.2 | 43.06 | 30 | 4 | |
| IGR J13091+1137 | 0.0251 | 109.9 | 43.64 | 60 | 39 | |
| IGR J131095552 | 0.1040 | 481.8 | 44.71 | 7 | ||
| IGR J13149+4422 | 0.0366 | 161.7 | 43.68 | 5 | 13 | |
| MCG -03-34-064 | 0.0165 | 71.8 | 43.19 | 36 | ||
| CEN A | 0.0018 | 3.6 | 1 | 41.99 | 11 | 27 |
| ESO 383-G018 | 0.0124 | 53.8 | 42.74 | 20 | 7,51 | |
| MCG -6-30-15 | 0.0077 | 25.5 | 1 | 42.48 | 12 | |
| NGC 5252 | 0.0230 | 100.6 | 43.91 | 5 | 36 | |
| MRK 268 | 0.0399 | 176.7 | 43.81 | 30 | 7,18 | |
| IGR J13466+1921 | 0.0850 | 388.7 | 44.62 | 52 | ||
| IC 4329A | 0.0160 | 69.6 | 44.02 | 12 | ||
| LEDA 49418 | 0.0509 | 227.2 | 43.75 | 2 | 53 | |
| NGC 5506 | 0.0062 | 21.7 | 1 | 42.92 | 3 | 11 |
| IGR J141754641 | 0.0766 | 348.3 | 44.21 | ? | 35 | |
| NGC 5548 | 0.0172 | 74.9 | 43.27 | 11 | ||
| ESO 511-G030 | 0.0224 | 97.9 | 43.45 | 11 | ||
| NGC 5643 | 0.0040 | 11.8 | 1 | 41.23 | 3 | |
| NGC 5728 | 0.0094 | 24.8 | 1 | 42.51 | 200 | 3 |
| IGR J144884009 | 0.1230 | 577.1 | 44.69 | 6 | 54 | |
| IGR J145525133 | 0.0160 | 69.6 | 42.87 | 10 | ||
| IGR J145613738 | 0.0246 | 107.7 | 43.20 | 37 | ||
| IC 4518A | 0.0157 | 68.3 | 43.07 | 10 | 7,18 | |
| MRK 841 | 0.0364 | 160.8 | 43.98 | 55 | ||
| NGC 5995 | 0.0252 | 110.4 | 43.66 | 11 | ||
| IGR J155396142 | 0.0149 | 64.8 | 42.60 | 20 | 10 | |
| ESO 389-G002 | 0.0194 | 84.6 | 42.93 | 6 | 18 | |
| WKK 6092 | 0.0156 | 67.8 | 42.96 | 24 | ||
| IGR J161855928 | 0.0350 | 154.4 | 43.55 | 10 | 56 | |
| ESO 137-G034 | 0.0092 | 33.0 | 1 | 42.26 | 39 | |
| IGR J163852057 | 0.0264 | 115.7 | 43.27 | 13 | ||
| IGR J164823036 | 0.0313 | 137.7 | 43.85 | 4 | ||
| NGC 6221 | 0.0050 | 15.6 | 1 | 41.66 | 1 | 57 |
| NGC 6240 | 0.0245 | 107.3 | 43.76 | 250 | 3 | |
| IGR J165585203 | 0.0540 | 241.6 | 44.22 | 4 | ||
| IGR J17009+3559 | 0.1130 | 526.7 | 44.74 | 30 | 7,18 | |
| IGR J17036+3734 | 0.0650 | 293.1 | 44.36 | 18 | ||
| NGC 6300 | 0.0037 | 13.1 | 1 | 42.02 | 25 | 11 |
| IGR J174181212 | 0.0372 | 164.4 | 43.86 | 4 | ||
| H 1821+643 | 0.2970 | 1541.0 | 45.58 | 11 | ||
| IC 4709 | 0.0169 | 73.6 | 43.36 | 12 | 23 | |
| IGR J182493243 | 0.3550 | 1895.4 | 45.61 | 58 | ||
| ESO 103-G035 | 0.0133 | 57.7 | 43.43 | 30 | 11 |
| Object | z | Ref. | Ref. | |||
|---|---|---|---|---|---|---|
| Mpc | erg s-1 | cm-2 | ||||
| 3C 390.3 | 0.0561 | 251.4 | 44.59 | 4 | ||
| ESO 140-G043 | 0.0142 | 61.7 | 43.14 | 2 | 59 | |
| ESO 025-G002 | 0.0289 | 126.9 | 43.50 | 7,18 | ||
| IGR J18559+1535 | 0.0838 | 382.9 | 44.54 | 4 | ||
| EXSS 1849.47831 | 0.0420 | 186.3 | 44.02 | 18 | ||
| IGR J190773925 | 0.0760 | 345.4 | 44.21 | 7,18 | ||
| IGR J191942956 | 0.1668 | 804.6 | 45.03 | 7,18 | ||
| ESO 141-G055 | 0.0371 | 164.0 | 44.06 | 11 | ||
| SWIFT J1930.5+3414 | 0.0633 | 285.1 | 44.10 | 30 | 6 | |
| 1H 1934063 | 0.0106 | 45.9 | 42.56 | 60 | ||
| IGR J194053016 | 0.0520 | 232.3 | 43.98 | 61 | ||
| NGC 6814 | 0.0052 | 22.0 | 1 | 42.42 | 12 | |
| XSS J19459+4508 | 0.0539 | 241.1 | 44.03 | 11 | 33 | |
| CYG A | 0.0561 | 251.4 | 44.67 | 20 | 62 | |
| ESO 399-IG020 | 0.0250 | 109.5 | 43.25 | 7,56 | ||
| IGR J20286+2544 | 0.0142 | 61.7 | 43.21 | 50 | 2,4 | |
| 4C +74.26 | 0.1040 | 481.8 | 44.99 | 11 | ||
| MRK 509 | 0.0344 | 151.7 | 44.21 | 11 | ||
| RX J2044.0+2833 | 0.0500 | 223.1 | 44.08 | 7,18 | ||
| S5 2116+81 | 0.0860 | 393.6 | 44.72 | 63 | ||
| IGR J21196+3333 | 0.0510 | 227.7 | 43.95 | 7,18 | ||
| NGC 7172 | 0.0087 | 31.9 | 1 | 42.88 | 13 | 11 |
| IGR J22292+6646 | 0.1120 | 521.7 | 44.54 | 58 | ||
| NGC 7314 | 0.0048 | 15.9 | 1 | 41.92 | 1 | 64 |
| MRK 915 | 0.0241 | 105.5 | 43.45 | 3 | 7,18 | |
| MR 2251178 | 0.0640 | 288.4 | 44.72 | 65 | ||
| NGC 7465 | 0.0066 | 26.5 | 1 | 42.32 | 66 | |
| NGC 7469 | 0.0163 | 70.9 | 43.44 | 4 | ||
| MRK 926 | 0.0469 | 208.8 | 44.28 | 4 |
References: (1) Distance adopted from the Extragalactic Distance Database, rather than calculated from the redshift; (2) de Rosa et al. (2012); (3) Krivonos et al. (2015); (4) Sazonov et al. (2007); (5) Ueda et al. (2007); (6) Landi et al. (2007); (7) Sazonov et al. (2010); (8) Winter et al. (2009a); (9) Rodriguez, Tomsick, & Bodaghee (2010); (10) Malizia et al. (2007); (11) Sazonov & Revnivtsev (2004); (12) Reynolds (1997); (13) Rodriguez, Tomsick, & Chaty (2008); (14) Krongold et al. (2009); (15) Terashima et al. (2002); (16) Bauer et al. (2014); (17) Greenhill, Tilak, & Madejski (2008); (18) Malizia et al. (2012); (19) Walton et al. (2014); (20) Parisi et al. (2009); (21) Lewis et al. (2005); (22) Vignali et al. (1998); (23) Revnivtsev et al. (2006); (24) Molina et al. (2009); (25) Vaughan et al. (2004); (26) Walton et al. (2013); (27) Fukazawa et al. (2011); (28) Ikeda, Awaki, & Terashima (2009); (29) Gallo et al. (2006); (30) Revnivtsev et al. (2007); (31) Winter et al. (2008); (32) Immler et al. (2003); (33) Sazonov et al. (2005); (34) Panessa et al. (2008); (35) this work; (36) Risaliti (2002); (37) Sazonov et al. (2008); (38) Eguchi et al. (2011); (39) Comastri et al. (2010); (40) Vignali & Comastri (2002); (41) Landi et al. (2010); (42) Cappi et al. (2006); (43) Turner et al. (2007); (44) Young & Wilson (2004); (45) Shirai et al. (2008); (46) Moran et al. (2005); (47) Braito et al. (2013); (48) Winter et al. (2009b); (49) Maiolino et al. (1998), strongly variable ; (50) Puccetti et al. (2014); (51) Noguchi, Terashima, & Awaki (2009); (52) Vasudevan et al. (2013); (53) Risaliti et al. (2000); (54) Molina et al. (2012); (55) Petrucci et al. (2007); (56) Panessa et al. (2011); (57) Levenson et al. (2001); (58) Landi et al. (2009); (59) Ricci et al. (2010); (60) Malizia et al. (2008); (61) Zhang et al. (2009); (62) Young et al. (2002); (63) Molina et al. (2008); (64) Dewangan & Griffiths (2005); (65) Reeves & Turner (2000); (66) Guainazzi, Matt, & Perola (2005b).
References
- Agostinelli et al. (2003) Agostinelli S., et al., 2003, NIMPA, 506, 250
- Aird et al. (2015) Aird J., Coil A. L., Georgakakis A., Nandra K., Barro G., Pérez-González P. G., 2015, MNRAS, 451, 1892
- Ajello et al. (2012) Ajello M., Alexander D. M., Greiner J., Madejski G. M., Gehrels N., Burlon D., 2012, ApJ, 749, 21
- Bauer et al. (2014) Bauer F. E., et al., 2014, arXiv, arXiv:1411.0670
- Beckmann et al. (2009) Beckmann V., et al., 2009, A&A, 505, 417
- Braito et al. (2013) Braito V., Ballo L., Reeves J. N., Risaliti G., Ptak A., Turner T. J., 2013, MNRAS, 428, 2516
- Brightman & Nandra (2011) Brightman M., Nandra K., 2011, MNRAS, 413, 1206
- Brightman et al. (2015) Brightman M., et al., 2015, ApJ, 805, 41
- Buchner et al. (2015) Buchner J., et al., 2015, ApJ, 802, 89
- Burlon et al. (2011) Burlon D., Ajello M., Greiner J., Comastri A., Merloni A., Gehrels N., 2011, ApJ, 728, 58
- Cappi et al. (2006) Cappi M., et al., 2006, A&A, 446, 459
- Churazov et al. (2008) Churazov E., Sazonov S., Sunyaev R., Revnivtsev M., 2008, MNRAS, 385, 719
- Comastri et al. (2010) Comastri A., Iwasawa K., Gilli R., Vignali C., Ranalli P., Matt G., Fiore F., 2010, ApJ, 717, 787
- Cullen et al. (1990) Cullen D. E., Perkins S. T., Rathkopf J. A., 1990, The 1989 Livermore Evaluated Photon Data Library (EPDL), UCRL-ID-103424, Lawrence Livermore National Laboratory
- de Rosa et al. (2012) de Rosa A., et al., 2012, MNRAS, 420, 2087
- Dewangan & Griffiths (2005) Dewangan G. C., Griffiths R. E., 2005, ApJ, 625, L31
- Eguchi et al. (2011) Eguchi S., Ueda Y., Awaki H., Aird J., Terashima Y., Mushotzky R., 2011, ApJ, 729, 31
- Fukazawa et al. (2011) Fukazawa Y., et al., 2011, ApJ, 727, 19
- Gallo et al. (2006) Gallo L. C., Lehmann I., Pietsch W., Boller T., Brinkmann W., Friedrich P., Grupe D., 2006, MNRAS, 365, 688
- Gilli, Comastri, & Hasinger (2007) Gilli R., Comastri A., Hasinger G., 2007, A&A, 463, 79
- Greenhill, Tilak, & Madejski (2008) Greenhill L. J., Tilak A., Madejski G., 2008, ApJ, 686, L13
- Guainazzi et al. (2005a) Guainazzi M., Fabian A. C., Iwasawa K., Matt G., Fiore F., 2005a, MNRAS, 356, 295
- Guainazzi, Matt, & Perola (2005b) Guainazzi M., Matt G., Perola G. C., 2005b, A&A, 444, 119
- Hasinger (2004) Hasinger G., 2004, NuPhS, 132, 86
- Hasinger (2008) Hasinger G., 2008, A&A, 490, 905
- Ikeda, Awaki, & Terashima (2009) Ikeda S., Awaki H., Terashima Y., 2009, ApJ, 692, 608
- Immler et al. (2003) Immler S., Brandt W. N., Vignali C., Bauer F. E., Crenshaw D. M., Feldmeier J. J., Kraemer S. B., 2003, AJ, 126, 153
- Kaastra & Mewe (1993) Kaastra J. S., Mewe R., 1993, A&AS, 97, 443
- Kippen (2004) Kippen R. M., 2004, NewAR, 48, 221
- Krivonos et al. (2010a) Krivonos R., Revnivtsev M., Tsygankov S., Sazonov S., Vikhlinin A., Pavlinsky M., Churazov E., Sunyaev R., 2010, A&A, 519, A107
- Krivonos et al. (2010b) Krivonos R., Tsygankov S., Revnivtsev M., Grebenev S., Churazov E., Sunyaev R., 2010, A&A, 523, AA61
- Krivonos et al. (2015) Krivonos R., Sazonov S., Churazov E., 2015, in preparation
- Krongold et al. (2009) Krongold Y., et al., 2009, ApJ, 690, 773
- La Franca et al. (2005) La Franca F., et al., 2005, ApJ, 635, 864
- Landi et al. (2007) Landi R., et al., 2007, ATel, 1274, 1
- Landi et al. (2009) Landi R., et al., 2009, A&A, 493, 893
- Landi et al. (2010) Landi R., Bassani L., Malizia A., Stephen J. B., Bazzano A., Fiocchi M., Bird A. J., 2010, MNRAS, 403, 945
- Lansbury et al. (2015) Lansbury G. B., et al., 2015, ApJ, 809, 115
- Lawrence & Elvis (1982) Lawrence A., Elvis M., 1982, ApJ, 256, 410
- Lawrence & Elvis (2010) Lawrence A., Elvis M., 2010, ApJ, 714, 561
- Levenson et al. (2001) Levenson N. A., Cid Fernandes R., Jr., Weaver K. A., Heckman T. M., Storchi-Bergmann T., 2001, ApJ, 557, 54
- Lewis et al. (2005) Lewis K. T., Eracleous M., Gliozzi M., Sambruna R. M., Mushotzky R. F., 2005, ApJ, 622, 816
- Maiolino & Rieke (1995) Maiolino R., Rieke G. H., 1995, ApJ, 454, 95
- Maiolino et al. (1998) Maiolino R., Salvati M., Bassani L., Dadina M., della Ceca R., Matt G., Risaliti G., Zamorani G., 1998, A&A, 338, 781
- Magdziarz & Zdziarski (1995) Magdziarz P., Zdziarski A. A., 1995, MNRAS, 273, 837
- Malizia et al. (2007) Malizia A., et al., 2007, ApJ, 668, 81
- Malizia et al. (2008) Malizia A., et al., 2008, MNRAS, 389, 1360
- Malizia et al. (2009) Malizia A., Stephen J. B., Bassani L., Bird A. J., Panessa F., Ubertini P., 2009, MNRAS, 399, 944
- Malizia et al. (2012) Malizia A., Bassani L., Bazzano A., Bird A. J., Masetti N., Panessa F., Stephen J. B., Ubertini P., 2012, MNRAS, 426, 1750
- Matt et al. (2013) Matt G., Bianchi S., Marinucci A., Guainazzi M., Iwawasa K., Jimenez Bailon E., 2013, A&A, 556, A91
- Mayo & Lawrence (2013) Mayo J. H., Lawrence A., 2013, MNRAS, 434, 1593
- Molina et al. (2008) Molina M., et al., 2008, MNRAS, 390, 1217
- Molina et al. (2009) Molina M., et al., 2009, MNRAS, 399, 1293
- Molina et al. (2012) Molina M., Landi R., Bassani L., Malizia A., Stephen J. B., Bazzano A., Bird A. J., Gehrels N., 2012, A&A, 548, A32
- Moran et al. (2005) Moran E. C., Eracleous M., Leighly K. M., Chartas G., Filippenko A. V., Ho L. C., Blanco P. R., 2005, AJ, 129, 2108
- Murphy & Yaqoob (2009) Murphy K. D., Yaqoob T., 2009, MNRAS, 397, 1549
- Noguchi, Terashima, & Awaki (2009) Noguchi K., Terashima Y., Awaki H., 2009, ApJ, 705, 454
- Panessa et al. (2008) Panessa F., et al., 2008, A&A, 483, 151
- Panessa et al. (2011) Panessa F., et al., 2011, MNRAS, 417, 2426
- Parisi et al. (2009) Parisi P., et al., 2009, A&A, 507, 1345
- Petrucci et al. (2007) Petrucci P. O., et al., 2007, A&A, 470, 889
- Pozdnyakov, Sobol, & Sunyaev (1983) Pozdnyakov L. A., Sobol I. M., Sunyaev R. A., 1983, ASPRv, 2, 189
- Puccetti et al. (2014) Puccetti S., et al., 2014, ApJ, 793, 26
- Reeves & Turner (2000) Reeves J. N., Turner M. J. L., 2000, MNRAS, 316, 234
- Revnivtsev et al. (2006) Revnivtsev M., Sazonov S., Churazov E., Trudolyubov S., 2006, A&A, 448, L49
- Revnivtsev et al. (2007) Revnivtsev M., Sunyaev R., Lutovinov A., Sazonov S., 2007, ATel, 1253, 1
- Reynolds (1997) Reynolds C. S., 1997, MNRAS, 286, 513
- Ricci et al. (2010) Ricci C., Beckmann V., Audard M., Courvoisier T. J.-L., 2010, A&A, 518, A47
- Risaliti et al. (2000) Risaliti G., Gilli R., Maiolino R., Salvati M., 2000, A&A, 357, 13
- Risaliti, Maiolino, & Salvati (1999) Risaliti G., Maiolino R., Salvati M., 1999, ApJ, 522, 157
- Risaliti (2002) Risaliti G., 2002, A&A, 386, 379
- Rodriguez, Tomsick, & Chaty (2008) Rodriguez J., Tomsick J. A., Chaty S., 2008, A&A, 482, 731
- Rodriguez, Tomsick, & Bodaghee (2010) Rodriguez J., Tomsick J. A., Bodaghee A., 2010, A&A, 517, A14
- Sazonov & Revnivtsev (2004) Sazonov S. Y., Revnivtsev M. G., 2004, A&A, 423, 469
- Sazonov et al. (2005) Sazonov S., Churazov E., Revnivtsev M., Vikhlinin A., Sunyaev R., 2005, A&A, 444, L37
- Sazonov et al. (2007) Sazonov S., Revnivtsev M., Krivonos R., Churazov E., Sunyaev R., 2007, A&A, 462, 57
- Sazonov et al. (2008) Sazonov S., Revnivtsev M., Burenin R., Churazov E., Sunyaev R., Forman W. R., Murray S. S., 2008, A&A, 487, 509
- Sazonov et al. (2010) Sazonov S., Churazov E. M., Krivonos R., Revnivtsev M., Sunyaev R., 2010, Proc. 8th INTEGRAL Workshop ”The Restless Gamma-ray Universe”, Sept. 27–30 2010, Dublin, id. 6
- Sazonov et al. (2012) Sazonov S., et al., 2012, ApJ, 757, 181
- Severgnini et al. (2011) Severgnini P., Caccianiga A., Della Ceca R., Braito V., Vignali C., La Parola V., Moretti A., 2011, A&A, 525, A38
- Shirai et al. (2008) Shirai H., et al., 2008, PASJ, 60, 263
- Steffen et al. (2003) Steffen A. T., Barger A. J., Cowie L. L., Mushotzky R. F., Yang Y., 2003, ApJ, 596, L23
- Sunyaev & Titarchuk (1985) Sunyaev R. A., Titarchuk L. G., 1985, A&A, 143, 374
- Terashima et al. (2002) Terashima Y., Iyomoto N., Ho L. C., Ptak A. F., 2002, ApJS, 139, 1
- Treister & Urry (2005) Treister E., Urry C. M., 2005, ApJ, 630, 115
- Turner et al. (2007) Turner T. J., Miller L., Reeves J. N., Kraemer S. B., 2007, A&A, 475, 121
- Ueda et al. (2003) Ueda Y., Akiyama M., Ohta K., Miyaji T., 2003, ApJ, 598, 886
- Ueda et al. (2007) Ueda Y., et al., 2007, ApJ, 664, L79
- Ueda et al. (2014) Ueda Y., Akiyama M., Hasinger G., Miyaji T., Watson M. G., 2014, ApJ, 786, 104
- Vasudevan et al. (2013) Vasudevan R. V., Brandt W. N., Mushotzky R. F., Winter L. M., Baumgartner W. H., Shimizu T. T., Schneider D. P., Nousek J., 2013, ApJ, 763, 111
- Vaughan et al. (2004) Vaughan S., Fabian A. C., Ballantyne D. R., De Rosa A., Piro L., Matt G., 2004, MNRAS, 351, 193
- Verner & Yakovlev (1995) Verner D. A., Yakovlev D. G., 1995, A&AS, 109, 125
- Verner et al. (1996) Verner D. A., Ferland G. J., Korista K. T., Yakovlev D. G., 1996, ApJ, 465, 487
- Vignali et al. (1998) Vignali C., Comastri A., Stirpe G. M., Cappi M., Palumbo G. G. C., Matsuoka M., Malaguti G., Bassani L., 1998, A&A, 333, 411
- Vignali & Comastri (2002) Vignali C., Comastri A., 2002, A&A, 381, 834
- Vignati et al. (1999) Vignati P., et al., 1999, A&A, 349, L57
- Walton et al. (2013) Walton D. J., Nardini E., Fabian A. C., Gallo L. C., Reis R. C., 2013, MNRAS, 428, 2901
- Walton et al. (2014) Walton D. J., et al., 2014, ApJ, 788, 76
- Winter et al. (2008) Winter L. M., Mushotzky R. F., Tueller J., Markwardt C., 2008, ApJ, 674, 686
- Winter et al. (2009a) Winter L. M., Mushotzky R. F., Reynolds C. S., Tueller J., 2009a, ApJ, 690, 1322
- Winter et al. (2009b) Winter L. M., Mushotzky R. F., Terashima Y., Ueda Y., 2009b, ApJ, 701, 1644
- Young et al. (2002) Young A. J., Wilson A. S., Terashima Y., Arnaud K. A., Smith D. A., 2002, ApJ, 564, 176
- Yaqoob (2012) Yaqoob T., 2012, MNRAS, 423, 3360
- Young & Wilson (2004) Young A. J., Wilson A. S., 2004, ApJ, 601, 133
- Zhang et al. (2009) Zhang S., Chen Y. P., Torres D. F., Wang J. M., Li T. P., Ge J. Q., 2009, A&A, 505, 553