A XMM-Newton observation of a sample of four close dSph galaxies.
Abstract
We present the results of the analysis of deep archival XMM-Newton observations towards
the dwarf spheroidal galaxies Draco, Leo I, Ursa Major II and Ursa
Minor in the Milky Way neighbourhood.
The X-ray source population is characterized and cross-correlated with
available databases with the aim to infer their nature. We also investigate if intermediate-mass black holes
are hosted in the center of these galaxies.
In the case of Draco, we detect 96 high-energy sources, two of them being possibly local stars,
while no evidence for any X-ray emitting central compact object is found.
Towards the Leo I and UMa II field of view we reveal 116 and 49 X-ray sources, respectively.
None of them correlates with the putative central black holes and only one is likely associated with a UMa II local source.
The study of the UMi dwarf galaxy shows 54 high-energy sources and
a possible association with a source at the dSph center. We put an upper limit to the central compact
object luminosity of 4.021033 erg/s. Furthermore, via the correlation with a radio source near the
galactic center, we get that the putative black hole should have a mass of
and be radiatively inefficient. This confirms a previous result obtained by using Chandra data alone.
keywords:
X–rays: individual: Draco dSph - Leo I dSph - UMa II dSph - UMi dSph - black hole physics1 Introduction
Dwarf spheroidal galaxies (dSphs) are very peculiar star systems with mass in the range - M⊙ (Martin et al. 2008) and relatively poor in stars. Consequently they result very faint and difficult to be detected and studied in details. In the past decades, the interest in dSphs has rapidly grown up. Indeed, until 2001, only 9 Milky Way (MW) dwarf satellites (at distance between 16 and 250 kpc) were known (Odenkirchen et al. 2001) while, recently, McConnachie (2012) listed over 100 nearby galaxies in and around the Local Group, along with their relevant physical properties.
If dSphs orbit close enough to the Galactic center, they may lose mass and be disrupted by the tidal forces due to the Galactic potential. Tidal effects can be easily revealed in the Sagittarius dSph which has a peculiar shape characterized by stellar debris along its orbit (see Mateo et al. 1998, Ibata et al. 2001). Tidal extension signatures for Carina and Ursa Minor dSphs were also detected by Majewski et al. (2000) and Martinez-Delgado et al. (2001). On the contrary, Odenkirchen et al. (2001) showed that there is no evidence for the existence of a tail-like extension of the Draco dSph star population beyond its tidal radius.
DSph are characterized by large mass-to-light ratios. This leads scientists to infer that they are dark matter (DM) dominated objects (see e.g. Mateo 1997). Breddels & Helmi (2013) performed a comparison between different dSph formation scenarios using a sample of DM profiles and argued that no particular model is significantly preferred among others. Moreover, some authors suggest different dSph growing processes, without contemplating DM content. In this respect, Yang et al. (2014), by using numerical simulations, claim that a merger in M31, occurred 8.5 Gyr ago, could have ejected a tidal-tail toward our direction. So that, dSph could be generated from the interaction between the low-mass tidal dwarf galaxies and our MW.
As far as the origin and evolution of dSphs, they can be either remnants of bigger systems, disrupted by tidal forces or affected by supernova winds that take out the overwhelming majority of gas (Silk et al. 1987), or small mass systems since their origin. In the latter case, they could be the building blocks of large galaxies (with mass in the range - M⊙) while, in the absence of interaction (merging or disruption), they can survive until now. To address these issues, dSphs are nowadays intensively studied by numerical simulations to infer their formation and evolution (Assmann et al. 2013a, Assmann et al. 2013b, Casas et al. 2012).
Additionally, as globular clusters, dSphs host old stellar populations and, consequently, X-ray sources are expected to be most likely low mass X-ray binaries (LMXBs) or cataclysmic variables (CVs). However, one fundamental difference between globular clusters and dSphs is their central stellar density that can be at least two order of magnitude smaller in dSphs (Harris (1996); McConnachie (2012)). Then, at variance with globular clusters where it is thought that the high stellar density forms a nursery for LMXB through capture, in the case of dSphs any X-ray binary should be primordial. However, due to the old stellar population, LMXBs would turn off in a few hundred million years, making unlikely finding these systems in dSphs.
The lower stellar density of dSph offers a contrasting environment with respect to that in globular clusters and a comparison of the X-ray source populations in the two cases may help testing the LMXB formation scenario. This is exactly the case of the Sculptor dSph which was studied by Maccarone et al. (2005b) who found five X-ray sources (likely X-ray binaries with a newutron star or a black hole primary) with erg s-1 associated to the galaxy. This discovery, from one side proves that LMXBs can exist in a old stellar environment with low stellar encounters. From the other side, it is clearly challenging for the LMXB formation theory.
Hence, one of the goals of this paper is to attempt a classification of the X-ray sources identified towards our dSph sample and pinpoint local (or candidate local) sources. Detecting X-ray sources in dSph can, moreover, help in the investigation of the dark matter component in these objects. Indeed, when neutron stars form in SN II explosions they get large kick velocities ( km s-1, Podsiadlowski et al. 2004) exceeding the escape local velocity (a few km s-1) due to the stellar component of the dSph. However, if dSphs have a dark matter halo, LMXBs (and even isolated millisecond pulsars which are direct descendant of LMXBs) can be retained within the galaxy (Dehnen & King, 2006).
DSphs are also the best candidates to host intermediate mass black holes (hereinafter IMBHs) in their gravitational cores. This clue derives by extrapolating fundamental relation (see e.g. Magorrian et al. 1998, for the super massive BH case) down to the typical dSph masses. In particular, IMBH masses can be evaluated either via dynamical considerations or using the fundamental plane relation at radio and X-ray wavelengths (see e.g., Reines et al. 2013, Nucita et al. 2013a, Nucita et al. 2013b). We also mention that, within the galaxy hierarchy scenario, IMBHs may be the ground seeds for the formation of super massive BHs hosted in the center of galaxies.
Searches for IMBHs in dSphs have been attempted recently. In a very interesting paper, Lemons et al. (2015) have anlayzed a sample of dSph galaxies detected by the Sloan Digital Sky Survey (SDSS) with redshift and stellar mass content M⊙. By a cross-correlation with the Chandra Source Catalogue, it was found that 19 galaxies have at least a detectable hard X-ray source within three half light radii. Moreover, for about half of this sample, there is the evidence that the X-ray source (possibly a massive black hole candidate) is associated to the optical nucleus of the dSph. Of course, as pointed out by the authors, follow-up observations are necessary to disentangle between stellar-mass X-ray binaries and the existence of active galactic nuclei with an accreting BH as central engine.
On the basis of these results, we also searched in the selected dSphs for X-ray sources with the typical signatures of accreting IMBHs. Although the statistics at hand is low, it is interesting that we find fraction of galaxies in our sample that appear hosting a central X-ray source is similar to that observed by Lemons et al. (2015). Also in our case, only dedicated follow-up observations may allow to unveil the source nature.
The paper is structured as follows: in Section 2 we briefly describe the sample of objects used in our study. Section 3 presents the procedure used to analyze the XMM-Newton data. The results for the high-energy study of dSphs are reported in Section 4 and, finally, in Section 5 we address our conclusions.
2 DSph sample
Our study is concerned with the high-energy characterization of dSphs. We select the dSph sample for which XMM-Newton archival data are available. We did not consider the Fornax dSph galaxy since it was already studied in details by Orio et al. (2010) and Nucita et al. (2013a). Here, we remind that these authors found an X-ray source possibly associated to a variable star belonging to the galaxy and two more sources at the boundaries of the Fornax globular clusters GC 3 and GC 4. Furthermore, following Jardel & Gebhardt (2012) who predicted the existence of a central IMBH with mass M⊙, Nucita et al. (2013a) searched also for X-ray targets at the galaxy center. In the particular case of one of the possible gravitational centers reported in Stetson et al. (1998), the authors found a close X-ray source. The source unabsorbed keV flux is erg s-1 cm-2 corresponding to an intrinsic luminosity of erg s-1 (assuming a galaxy distance of 138 kpc): in the IMBH hypothesis (and assuming a Bondi spherycal accretion or in the context of a Keplerian thin disk model), the compact object seems to accrete very inefficiently.
In this paper, we focus our attention on four galaxies111 We mention that the XMM-Newton observations analysed in this work (see text for details) have been already used for different purposes. As an example, Malyshev et al. (2014) searched for a 3.55 keV line as the signatures of dark matter (in the form of sterile neutrinos) decays. Their analysis showed no evidence for the presence of such line in the stacked spectra of the investigated dSphs. : Draco, Leo I, Ursa Major II and Ursa Minor (hereafter UMa II and UMi, respectively).
2.1 Draco
The Draco dSph (at J2000 coordinates RA = 17h 20m 12.4s and Dec = 57∘ 54′ 55′′) is a MW companion galaxy. Since its discovery (Wilson 1955) this galaxy became target of many observational campaigns. Baade & Swope (1961) first derived the distance to the galaxy to be about 99 kpc through the identification of variable stars. In addition, others studies on Draco variables were made by Zinn & Searle (1976), Nemec (1985), Goranskij (1982), Kinemuchi et al. (2002) and Bonanos et al. (2004). Recently, Kinemuchi et al. (2008) presented a survey with the photometry of different kind of sources (270 RR Lyrae stars, 9 anomalous Cepheids, 2 eclipsing binaries, 12 slow irregular red variables, 30 background QSOs and 26 probable double-mode RR Lyrae stars). Other photometric studies were performed by Bellazzini et al. (2002) and Rave et al. (2003).
Draco seems to host a single stellar population older than 10 Gyr (Grillmair et al. 1998, Dall’Ora et al. 2003). According to Bonanos et al. (2004), the Draco luminosity ( L⊙) is comparable to that of the faintest luminous systems.
By NED222NASA/IPAC Extragalactic Database is available at http://ned.ipac.caltech.edu. we get not only the galaxy coordinates but also other interesting quantities such as the mean distance of about 82 kpc and the physical major and minor axes of 1.19 kpc and 0.72 kpc, respectively. McConnachie (2012) reports a position angle of . For our study333For completeness, we note that Draco dSph was observed also by the Chandra satellite (IDs 9568 and 9776) with the ACIS-S camera and exposure times of ks and ks, respectively. Only four detectors were on during the observations thus limiting the coverage of the Draco galaxy. The event files were reprocessed using the most updated calibration files and the CIAO tool suite (version 4.6). Then, we searched for X-ray sources in the keV by using the celldetect code choosing a signal-to-noise ratio of for the source detection. After eliminating a few sources not recognized as such by eye, we were left with X-ray targets indicated by yellow diamonds in Figure 1 We remind that the background corrected rates and fluxes of the identified sources are consistent within the errors with those estimated by using XMM-Newton . we used five XMM-Newton observations (IDs , , , , and ) made in the August 2009 for a total exposure time of about 90 ks.
2.2 Leo I
As far as Leo I (at J2000 coordinates RA = 10h 08m 28.1s and Dec = 12∘ 18′ 23′′) is concerned, NED database gives a mean distance of 246 kpc (thus it is one of the furthest MW companions), positional angle of 80∘, physical major and minor axis of 0.86 kpc and 0.64 kpc, respectively. Harrington & Wilson (1950) analized this gas poor galaxy whose type II star population and elliptical shape suggested a similarity with the Sculptor system. The large distance from the MW and the high radial velocity, confirmed by Koch et al. (2007), suggest that Leo I is an isolated dSph, not currently affected by Galactic tidal forces. However, the presence of stars beyond the object tidal radius confirms the hypotesis that some dSphs may be perturbed at least in their outermost regions by the existence of a huge amount of dark matter at large distances.
Recently Smecker-Hane et al. (2009) re-analyzed the star population content of this dwarf galaxy and determined the galaxy
star formation rate as a function of time. In particular, they
found that Leo I has a stellar population older than previously believed and older than that of the
irregular Leo A galaxy, although both systems have continuously formed stars. The evidence of a radial age gradient in the red giant branch (RGB) stellar population was shown by
Gullieuszik et al. (2009) who estimated the stellar ages, while Menzies et al. (2010) analyzed the existence of asymptotic giant branch (AGB) variables.
In our work we use the XMM-Newton observation (ID ) of about 90 ks made on 2008-11-24,
the same being previously analyzed by Orio et al. (2010). These authors cross-correlated their sample of X-ray detected sources with the
catalogue of carbon rich AGB stars in Leo I Held et al. 2010 finding no association. As claimed by Orio et al. (2010), a few X-ray sources correlate in position with
RGB stars (most symbiotic binary systems have red giant companions). This is consistent with our results (see Section 3).
2.3 Ursa Major II
UMa II dSph (with J2000 coordinates RA = 08h 51m 30s and Dec = 63∘ 07′ 48′′) was discovered by Zucker et al. (2006) analyzing Sloan Digital Sky Survey (SDSS). They noted its irregular and distorted shape, probably due to a tidal disruption process. Evidences supporting this scenario are found in morphological studies made by Fellhauer et al. (2007) and Muñoz et al. (2010) to which we refer for more details. In spite of the dominant dark matter contribution scenario, Smith et al. (2013) demonstrated, via N-Body simulations, that the observed properties can be well reproduced, in absence of DM, by tidal mass loss processes. So the presence/absence of dark matter in UMa II is a not yet settled issue.
Another still open point is related to the star population of this dwarf galaxy. Dall’Ora et al. (2012) revealed hints, although not statistically significant, of two distinct stellar populations, with different age and metallicity. They also detected a RR Lyrae star in UMa II and evaluated a distance of about 34.7 kpc. We use a distance of 34 kpc, as reported by NED, in the analysis of XMM-Newton data (ID ) obtained on 2011-04-21 with an exposure time of about 34 ks. As reported in McConnachie (2012), the galaxy half light radius is kpc and a position angle of .
2.4 Ursa Minor
The fourth target of our sample is UMi dSph at J2000 coordinates RA = 15h 09m 10.2s and Dec = 67∘ 12′ 52′′ (Falco et al. 1999).
This dSph is one of the first MW companions revealed in the past century (Wilson 1955). Walker et al. (2007) analized the stellar velocity dispersion profiles of some dSphs, among which UMi, observing that it remains approximately constant with the galactocenter distance. The authors also noted that the observed profiles were well fitted by models of luminous stars systems immersed into a DM halo.
Regarding the star formation history, UMi shows a predominantly old (with age of about 10 Gyr) stellar population (Carrera et al. 2002).
In that work, the authors studied also the stellar metallicity claiming the absence of a metallicity radial gradient
throughout the galaxy.
According to NED, UMi has a mean distance of 73 kpc, positional angle of 69∘,
physical major and minor axis of 0.85 kpc and 0.53 kpc, respectively.
We analyzed two XMM-Newton observations (ID , and ) made between the end of August and the beginning of
September 2005 for a total exposure time of 27 ks.
Nucita et al. (2013b) analyzed the X-ray data acquired by the Chandra satellite towards this galaxy and found an X-ray source spatially coincident (within a few arcseconds) with a radio one. Assuming that the target is an accreting IMBH, the authors evaluated the BH mass, which resulted to be M⊙. However, the detection algorithm used did not allow to exclude that one false detection per CCD occurred. Here, to confirm the previous result, here we used XMM-Newton observations (see the next Section).
3 XMM-Newton data reduction and source detection
We used the XMM-Science Analysis System (SAS version see: http://xmm.esa.int/sas/), with the most recent calibration files, to process the observation data files (ODFs).
We obtained the event lists by processing the raw data via the standard emchain and epchain tools, and following the standard procedures in screening the data provided by the three European Photon Imaging Cameras (MOS 1, MOS 2 and pn) on-board XMM-Newton satellite.
We applied the analysis procedure described in Nucita et al. (2013a).
Here we only remind that, in accordance with the 2XMM catalogue of serendipitous X-ray sources (Watson et al. 2009),
we divided each EPIC camera event list into 5 energy bands, i.e. : keV, keV, keV, keV,
and keV, producing one image for each energy band, plus a mosaic image in the 0.2-12.0 keV
energy band (for inspection purposes only), and carried out the source detection using the SAS task edetectchain.
The exposure map has been evaluated with the eexpmap task,
for each camera and input image, taking into account the calibration information on spatial quantum efficiency, filter transmission and vignetting.
Then we produced appropriate image masks to delimit the regions in which to perform source detection with the task emldetect.
This task applies a point spread function (PSF) fitting algorithm simultaneously in the five energy bands giving as output source coordinates,
energy fluxes and hardness ratios (for details see: http://xmm.esac.esa.int/sas/current/documentation).
The X-ray fluxes are given in units of erg s-1 cm-2 through the formula
| (1) |
where the count rate () and the energy conversion factor
() are in units of counts cm2 erg-1 in the -th band for each EPIC camera.
To obtain the latter factors 444For ECFs and associated correction factors, see the User’s
Guide of the 2XMM catalogue of serendipitous sources available at
http://xmmssc-www.star.le.ac.uk/Catalogue/2XMMi-DR3. We note that our results are consistent within a few percent when relaxing the adopted
assumptions. we assumed a power-law model with photon index and
mean Galactic foreground absorption cm-2 (Watson et al. 2009).
Finally, we purged the candidate source lists by requiring a maximum likelihood threshold equal to 10, corresponding to 4, and removing a few spurious sources identified as false detections or positioned at the borders of the cameras. Our results are consistent with the 3XMMi-DR4 with minor differences due to the fact that we have excluded few spurious sources.
At the end of the procedure, we obtained 89, 116, 49 and 54 sources for Draco, Leo I, UMa II and UMi, respectively Previously, Orio et al. (2010) analyzed the same Leo I data set detecting 105 X-ray sources. We impute the discrepancy to slightly different choices in the data screening procedure and the detection threshold used.
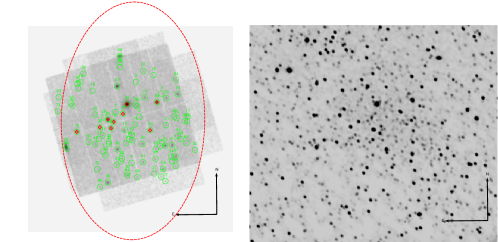
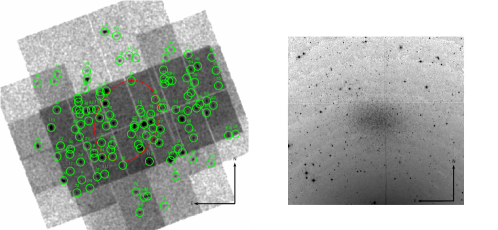
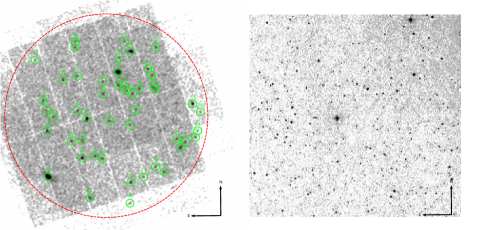
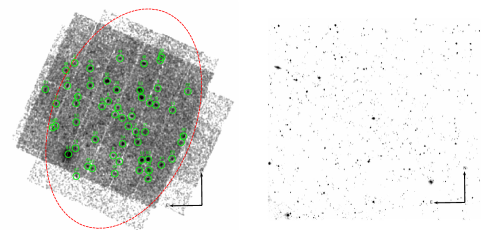
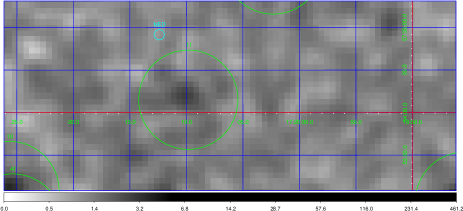
The logarithmically scaled 0.2-12 keV images (smoothed with a 3 pixel gaussian kernel) are shown in Fig. 1. For Draco, Leo I and UMi the dashed circles represent the extension of the galaxies as suggested by the NASA/IPAC extragalactic database, while in the case of UMa II we used the half light radius taken from McConnachie (2012). In each panel, the radius circles containing of energy at 1.5 keV in the pn camera (see e.g., de La Calle et al. 2014) indicate the detected sources each of which is labeled with a sequential number following the 0.2-12.0 keV increasing flux order.
In Tables LABEL:DracoSources - LABEL:UMiSources we report the main results of our analysis, showing the detected sources in increasing flux order. For each source, the first two columns show, respectively an identification number and a label () indicating how many times it was revealed in the XMM-Newton observations, i.e.: A - once, B - twice, C - three times, and so on. In Leo I and UMa II cases there are only A sources because we used a single observation. Columns 3-5 report the J2000 coordinates with the associated errors. Column 6 reports the 0.2-12.0 keV absorbed flux. To get the parameter (column 7), the SIMBAD555http://simbad.u-strasbg.fr/simbad/ archive was searched for correlations (within a radius of 3′′) from which we extracted the relevant magnitude in the V band or, if not available, the average between R and B ones (Bartlett et al., 2012). The high-energy hardness-ratios , and with (see next section) are shown in the remaining columns. In Tables LABEL:Dracoclass - LABEL:UMiclass we present the correlation with catalogued counterparts, if any. For this purpose, we used several databases to correlate our X-ray source catalogue with optical counterparts, namely: the Two Micron All-Sky Survey (2MASS), the Two Micron All-Sky Survey Extended objects (2MASX, Skrutskie et al. 2006), the United States Naval Observatory all-sky survey (USNO-B1, Monet et al. 2003), the position and proper motions extended catalogues (PPMX, Roeser et al. 2008 and PPMXL, Roeser et al. 2010), the QSO candidates in the SDSS stripes examined (J/MNRAS/396/223/qsos, D’Abrusco et al. 2009), the candidate AGN objects catalogue (J/MNRAS/437/968, Cavuoti et al. 2014). Regarding Draco dSph, we also searched for long-period, semi-regular red variable stars, carbon stars and eclipsing binaries (J/AJ/136/1921/table9, Kinemuchi et al. 2008), QSOs found in the same survey (J/AJ/136/1921/table10, Kinemuchi et al. 2008), variable stars (J/AJ/127/861, Bonanos et al. 2004), and late-type stars (J/A+A/442/165, Cioni & Habing 2005). The quasar-galaxy associations catalogue (J/AZh/78/675, Bukhmastova 2001) was used for the analysis of both Draco and UMi.
In the Leo I case, we used the NIR catalogue obtained with the WFCAM wide-field array at the United Kingdom Infrared Telescope (J/MNRAS/404/1475/table2, Held et al. 2010), while the Palomar Transient Factory (PTF) photometric catalogue 1.0 (II/313, Ofek et al. 2012) was compared with UMa II source list. Moreover, for UMi dSph we examined the catalogue of quasar candidates from non-parametric Bayes classifier kernel density estimate (J/ApJS/180/67, Richards et al. 2010) and the atlas of Radio/X-ray associations (V/134/arxa, Flesch 2010).
For details about the limiting magnitude of the used catalogues we remind to the relevant publications. Here, for example, we remind that 2MASS has limiting sensitivity of 17.1, 16.4 and 15.3 mag in J, H, and K bands, respectively, while the USNO-B1 catalogue is complete down to a visual magnitude of and has postional accuracy of . Note that some catalogues (as PPMX and PPMXL, or 223/qsos and 437/968) refer to other well known catalogues (as 2MASS and USNO-B1, or SDSS) and inherit the corresponding limiting magnitudes.
Therefore, we associated to the coordinates of each of the identified X-ray sources an error resulting from the quadrature sum of the
XMM-Newton positional accuracy ( at confidence level, see Kirsch 2004 and Guainazzi 2010)
and the statistical error as determined by the edetectchain tool. Since the resulting positional uncertainty is of the order of a few arcseconds, we do not over-plot the source error circles in
any figure of this paper.
In the same way, the error associated with the optical counterpart was derived from the relevant catalogues.
Only if an X-ray source is found to be within (and arcsec) from a catalogue counterpart,
we report the corresponding distance in arcseconds in Tables LABEL:Dracoclass - LABEL:UMiclass.
In the case of multiple sources satisfying the previous condition, the source having
the minimum distance from the X-ray target was used .
We also show the object type (OType) category of the counterpart, as reported in the SIMBAD archive666The SIMBAD
object classification (class standard designation, condensed one and extended explanation as well) is available at
http://simbad.u-strasbg.fr/simbad/sim-display?data=otypes., as well as our own source classification (HR Class).
| Src | # | RA | DEC | ERR | F | |||||||
|---|---|---|---|---|---|---|---|---|---|---|---|---|
| (J2000) | (J2000) | arcsec | erg s-1 cm-2 | |||||||||
| 1 | A | 17 19 26.1 | 57 50 18.7 | 2.546 | 1.21 | 0.08 0.58 | -0.66 0.67 | 0.71 0.22 | -0.83 0.20 | -1.00 1.01 | 1.00 0.64 | |
| 2 | A | 17 20 07.8 | 58 03 5.8 | 2.558 | 1.09 | 0.131 | -0.07 0.64 | -0.26 0.68 | 0.01 0.30 | 0.29 0.30 | -1.00 0.22 | 1.00 0.23 |
| 3 | A | 17 19 27.2 | 58 00 36.3 | 2.418 | 0.54 0.45 | -1.314 | 0.28 0.55 | -0.44 0.56 | -0.11 0.29 | -0.35 0.29 | -0.76 0.47 | 1.00 0.14 |
| 4 | C | 17 20 02.3 | 57 55 44.5 | 2.510 | 0.55 0.27 | -0.08 0.63 | -0.13 0.69 | 0.18 0.25 | 0.01 0.25 | -0.24 0.31 | -0.64 0.37 | |
| 5 | A | 17 20 59.4 | 57 48 28.7 | 2.567 | 1.29 | -0.22 0.73 | -0.09 0.64 | -0.04 0.20 | 0.27 0.24 | -0.46 0.27 | -0.94 0.94 | |
| 6 | A | 17 19 10.6 | 57 46 28.3 | 2.591 | 1.31 | -0.13 0.79 | -0.02 0.59 | 0.37 0.31 | 0.28 0.25 | -0.42 0.26 | -1.00 0.93 | |
| 7 | A | 17 20 39.8 | 57 56 48.2 | 2.427 | 0.66 0.37 | 0.09 0.65 | 0.23 0.56 | -0.10 0.31 | 0.68 0.21 | -0.13 0.25 | -0.23 0.31 | |
| 8 | A | 17 20 14.7 | 57 46 07.5 | 2.578 | 0.70 0.62 | -0.14 0.68 | 0.14 0.59 | 0.35 0.31 | 0.28 0.22 | -0.20 0.23 | -1.00 0.48 | |
| 9 | B | 17 20 22.9 | 57 50 14.8 | 3.287 | 0.71 0.33 | 0.00 0.63 | 0.20 0.57 | 0.67 0.44 | 0.53 0.23 | 0.01 0.21 | -0.75 0.21 |
| Src | # | RA | DEC | ERR | F | |||||||
|---|---|---|---|---|---|---|---|---|---|---|---|---|
| (J2000) | (J2000) | arcsec | erg s-1 cm-2 | |||||||||
| 1 | A | 10 08 56.2 | 12 19 27.2 | 2.480 | 0.15 0.14 | -0.16 0.60 | -0.01 0.49 | 0.27 0.26 | 0.09 0.22 | -0.76 0.24 | 0.42 0.38 | |
| 2 | A | 10 08 50.9 | 12 18 24.8 | 2.403 | 0.20 0.15 | -0.39 0.54 | -0.03 0.49 | 0.20 0.22 | 0.22 0.17 | -0.95 0.14 | 0.76 1.14 | |
| 3 | A | 10 08 19.5 | 12 19 38.6 | 2.344 | 0.21 0.13 | -0.870 | -0.12 0.59 | -0.17 0.57 | -0.03 0.22 | -0.03 0.24 | -0.40 0.33 | 0.06 0.51 |
| 4 | A | 10 08 12.4 | 12 17 18.7 | 2.358 | 0.21 0.14 | -0.32 0.53 | 0.04 0.46 | 0.63 0.17 | -0.08 0.16 | -0.35 0.21 | -0.99 0.71 | |
| 5 | A | 10 08 25.4 | 12 16 29.9 | 2.358 | 0.22 0.11 | -0.15 0.37 | -0.53 0.46 | 0.27 0.16 | -0.44 0.18 | -0.86 0.35 | 0.34 0.85 | |
| 6 | A | 10 08 55.0 | 12 09 47.9 | 2.475 | 0.50 | -0.06 0.77 | -0.52 0.77 | -0.22 0.20 | -0.19 0.26 | -0.22 0.40 | -1.00 1.39 | |
| 7 | A | 10 07 51.4 | 12 22 01.9 | 2.408 | 0.58 | 0.08 0.77 | 0.02 0.54 | -0.98 0.12 | 0.98 0.16 | -0.20 0.30 | 0.09 0.34 | |
| 8 | A | 10 08 37.6 | 12 14 13.2 | 2.350 | 0.26 0.17 | -0.18 0.52 | -0.05 0.45 | 0.26 0.22 | 0.11 0.20 | -0.47 0.24 | 0.33 0.51 | |
| 9 | A | 10 08 47.8 | 12 13 41.6 | 2.651 | 0.30 0.12 | -0.14 0.38 | -0.08 0.36 | 0.49 0.18 | 0.06 0.15 | -0.28 0.18 | -0.99 0.40 | |
| 10 | A | 10 08 38.3 | 12 19 17.1 | 2.321 | 0.33 0.15 | -0.21 0.52 | -0.12 0.46 | -0.09 0.17 | 0.32 0.19 | -0.94 0.16 | 0.81 0.50 |
| Src | # | RA | DEC | ERR | F | |||||||
|---|---|---|---|---|---|---|---|---|---|---|---|---|
| (J2000) | (J2000) | arcsec | erg s-1 cm-2 | |||||||||
| 1 | A | 08 51 34.3 | 63 12 48.2 | 2.414 | 0.67 0.48 | -0.24 0.41 | -0.45 0.50 | 0.58 0.17 | -0.38 0.17 | -0.90 0.23 | -1.00 2.82 | |
| 2 | A | 08 50 51.9 | 63 08 37.6 | 2.578 | 0.68 0.25 | -0.08 0.65 | 0.30 0.65 | 0.15 0.42 | 0.64 0.23 | -0.16 0.23 | -1.00 0.19 | |
| 3 | A | 08 51 26.3 | 63 07 03.7 | 2.431 | 0.69 0.32 | -0.08 0.52 | -0.08 0.55 | 0.56 0.27 | 0.28 0.22 | -0.32 0.22 | -0.38 0.35 | |
| 4 | A | 08 50 59.9 | 63 06 28.6 | 2.496 | 0.80 0.48 | -0.23 0.71 | 0.22 0.63 | 0.25 0.39 | 0.54 0.24 | -0.47 0.22 | -0.93 0.49 | |
| 5 | A | 08 51 06.5 | 63 18 38.9 | 2.708 | 0.83 0.56 | -0.31 0.51 | -0.24 0.59 | 0.67 0.19 | -0.17 0.22 | -0.90 0.15 | -1.00 0.73 | |
| 6 | A | 08 51 03.7 | 63 11 29.1 | 2.449 | 0.87 0.32 | -0.30 0.57 | 0.06 0.56 | 0.53 0.28 | 0.15 0.20 | -0.41 0.24 | -0.89 0.30 | |
| 7 | A | 08 50 55.9 | 63 11 02.2 | 2.246 | 1.01 0.37 | -0.21 0.32 | -0.44 0.41 | 0.48 0.14 | -0.44 0.15 | -0.85 0.25 | -0.29 0.82 | |
| 8 | A | 08 51 44.6 | 63 01 55.2 | 2.303 | 1.18 0.51 | -0.29 0.39 | -0.19 0.45 | 0.43 0.17 | -0.04 0.17 | -0.81 0.17 | 0.62 0.45 | |
| 9 | A | 08 50 47.3 | 63 11 43.6 | 2.323 | 1.20 0.50 | -0.21 0.41 | -0.08 0.43 | 0.14 0.23 | 0.34 0.16 | -0.66 0.16 | -0.49 0.46 | |
| 10 | A | 08 53 02.7 | 63 15 53.0 | 2.505 | 3.14 | -0.10 0.50 | -0.46 0.59 | 0.51 0.27 | -0.21 0.27 | -0.70 0.27 | -1.00 0.92 |
| Src | # | RA | DEC | ERR | F | |||||||
|---|---|---|---|---|---|---|---|---|---|---|---|---|
| (J2000) | (J2000) | arcsec | erg s-1 cm-2 | |||||||||
| 1 | A | 15 09 01.8 | 67 11 31.9 | 2.582 | 0.59 0.34 | -0.923 | -0.32 0.66 | 0.16 0.70 | -0.20 0.35 | 0.38 0.28 | -0.38 0.24 | -1.00 0.31 |
| 2 | A | 15 08 48.6 | 67 10 34.6 | 2.708 | 0.72 0.59 | -0.34 0.79 | 0.20 0.83 | 0.17 0.44 | 0.37 0.28 | -0.28 0.23 | -0.66 0.40 | |
| 3 | A | 15 09 13.1 | 67 12 59.4 | 3.052 | 0.73 0.29 | -0.18 0.52 | -0.33 0.67 | 0.42 0.24 | -0.33 0.24 | -0.66 0.19 | -1.00 0.29 | |
| 4 | A | 15 09 25.9 | 67 13 35.3 | 2.477 | 0.85 0.45 | -0.25 0.73 | 0.27 0.71 | 0.71 0.23 | 0.37 0.26 | -0.51 0.24 | -0.17 0.38 | |
| 5 | A | 15 09 29.2 | 67 06 24.6 | 2.779 | 0.88 0.64 | -0.402 | -0.19 0.45 | -0.23 0.54 | 0.24 0.31 | -0.01 0.28 | -0.39 0.32 | -1.00 1.03 |
| 6 | A | 15 10 39.6 | 67 22 36.6 | 2.912 | 3.59 | 0.717 | -0.01 0.98 | -0.49 0.96 | -0.01 0.29 | -0.32 0.39 | -0.09 0.90 | -1.00 2.72 |
| 7 | A | 15 09 18.0 | 67 05 20.3 | 2.607 | 0.98 0.67 | -0.06 0.33 | -0.67 0.45 | 0.51 0.22 | -0.74 0.17 | -0.29 0.58 | -1.00 1.63 | |
| 8 | A | 15 09 38.4 | 67 15 56.0 | 2.414 | 1.12 0.51 | 0.507 | -0.42 0.58 | 0.28 0.56 | -0.01 0.24 | 0.61 0.15 | -0.76 0.18 | -0.49 0.47 |
| 9 | A | 15 08 08.1 | 67 18 10.8 | 2.573 | 1.17 0.89 | 0.478 | -0.14 0.55 | -0.39 0.63 | 0.11 0.24 | -0.01 0.25 | -0.78 0.26 | 0.62 0.53 |
| 10 | A | 15 08 11.7 | 67 15 14.4 | 2.339 | 1.24 0.82 | 0.407 | -0.19 0.47 | -0.26 0.49 | 0.13 0.20 | -0.04 0.20 | -0.36 0.23 | -1.00 0.82 |
| Src | RA | DEC | 223 qsos | 2MASS | 2MASX | PPMX | PPMXL | USNO-B1 | table9 | table10 | 437 968 | 127 861 | 78 675 | 442 165 | SIMBAD | HR |
|---|---|---|---|---|---|---|---|---|---|---|---|---|---|---|---|---|
| (J2000) | (J2000) | (arcsec) | (arcsec) | (arcsec) | (arcsec) | (arcsec) | (arcsec) | (arcsec) | (arcsec) | (arcsec) | (arcsec) | (arcsec) | (arcsec) | OType | Class | |
| 1 | 17 19 26.1 | 57 50 18.7 | 1.46 | 1.46 | 1.46 | f | ||||||||||
| 2 | 17 20 07.8 | 58 03 5.8 | 0.13 | 0.58 | * | fg | ||||||||||
| 3 | 17 19 27.2 | 58 00 36.3 | 1.86 | 1.82 | 1.65 | * | FG | |||||||||
| 4 | 17 20 02.3 | 57 55 44.5 | ||||||||||||||
| 5 | 17 20 59.4 | 57 48 28.7 | f | |||||||||||||
| 6 | 17 19 10.6 | 57 46 28.3 | f | |||||||||||||
| 7 | 17 20 39.8 | 57 56 48.2 | h | |||||||||||||
| 8 | 17 20 14.7 | 57 46 07.5 | h | |||||||||||||
| 9 | 17 20 22.9 | 57 50 14.8 | h | |||||||||||||
| 10 | 17 20 25.6 | 57 53 04.7 | 0.32 | 0.37 | 0.37 | 0.38 | 0.40 | * | FG |
| Src | RA | DEC | 223 qsos | 2MASS | PPMX | PPMXL | USNO-B1 | 437 968 | 1475/table2 | SIMBAD | HR |
|---|---|---|---|---|---|---|---|---|---|---|---|
| (J2000) | (J2000) | (arcsec) | (arcsec) | (arcsec) | (arcsec) | (arcsec) | (arcsec) | (arcsec) | OType | Class | |
| 1 | 10 08 56.2 | 12 19 27.2 | f | ||||||||
| 2 | 10 08 50.9 | 12 18 24.8 | f | ||||||||
| 3 | 10 08 19.5 | 12 19 38.6 | 1.43 | RG* | l | ||||||
| 4 | 10 08 12.4 | 12 17 18.7 | 2.23 | ||||||||
| 5 | 10 08 25.4 | 12 16 29.9 | f | ||||||||
| 6 | 10 08 55.0 | 12 09 47.9 | 2.99 | ||||||||
| 7 | 10 07 51.4 | 12 22 01.9 | h | ||||||||
| 8 | 10 08 37.6 | 12 14 13.2 | f | ||||||||
| 9 | 10 08 47.8 | 12 13 41.6 | h | ||||||||
| 10 | 10 08 38.3 | 12 19 17.1 | 2.39 | h |
| Src | RA | DEC | 223 qsos | 2MASS | 2MASX | PPMX | PPMXL | USNO-B1 | I1 313 | 437 968 | SIMBAD | HR |
|---|---|---|---|---|---|---|---|---|---|---|---|---|
| (J2000) | (J2000) | (arcsec) | (arcsec) | (arcsec) | (arcsec) | (arcsec) | (arcsec) | (arcsec) | (arcsec) | OType | Class | |
| 1 | 08 51 34.3 | 63 12 48.2 | 1.86 | 2.63 | 0.77 | f | ||||||
| 2 | 08 50 51.9 | 63 08 37.6 | h | |||||||||
| 3 | 08 51 26.3 | 63 07 03.7 | h | |||||||||
| 4 | 08 50 59.9 | 63 06 28.6 | h | |||||||||
| 5 | 08 51 06.5 | 63 18 38.9 | f | |||||||||
| 6 | 08 51 03.7 | 63 11 29.1 | f | |||||||||
| 7 | 08 50 55.9 | 63 11 02.2 | 0.95 | 0.96 | 0.74 | 0.87 | f | |||||
| 8 | 08 51 44.6 | 63 01 55.2 | 1.27 | 1.33 | 1.77 | 1.31 | f | |||||
| 9 | 08 50 47.3 | 63 11 43.6 | h | |||||||||
| 10 | 08 53 02.7 | 63 15 53.0 | f |
| Src | RA | DEC | 223 qsos | 2MASS | PPMX | PPMXL | USNO-B1 | 180 67 | V 134 | SIMBAD | HR |
|---|---|---|---|---|---|---|---|---|---|---|---|
| (J2000) | (J2000) | (arcsec) | (arcsec) | (arcsec) | (arcsec) | (arcsec) | (arcsec) | (arcsec) | OType | Class | |
| 1 | 15 09 01.8 | 67 11 31.9 | 1.10 | 0.96 | 0.54 | * | l | ||||
| 2 | 15 08 48.6 | 67 10 34.6 | f | ||||||||
| 3 | 15 09 13.1 | 67 12 59.4 | |||||||||
| 4 | 15 09 25.9 | 67 13 35.3 | f | ||||||||
| 5 | 15 09 29.2 | 67 06 24.6 | 2.28 | 2.22 | 2.41 | 2.29 | * | l | |||
| 6 | 15 10 39.6 | 67 22 36.6 | * | l | |||||||
| 7 | 15 09 18.0 | 67 05 20.3 | |||||||||
| 8 | 15 09 38.4 | 67 15 56.0 | * | snr | |||||||
| 9 | 15 08 08.1 | 67 18 10.8 | * | l | |||||||
| 10 | 15 08 11.7 | 67 15 14.4 | * | fg |
4 High-energy view
In the following section we address the problem of the membership of our X-ray sources to the dSph galaxies, mainly through the analysis of high-energy data.
4.1 Hardness-Ratios and X-ray-to-NIR Flux Diagrams
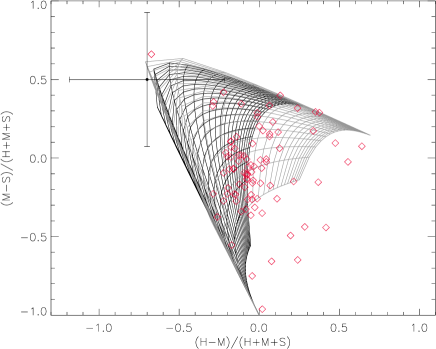
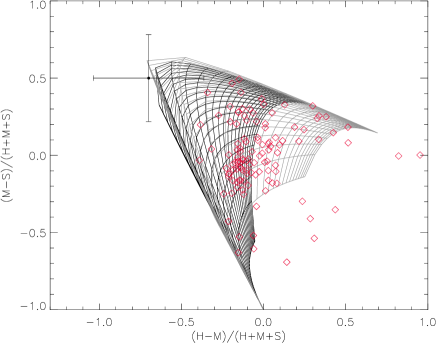
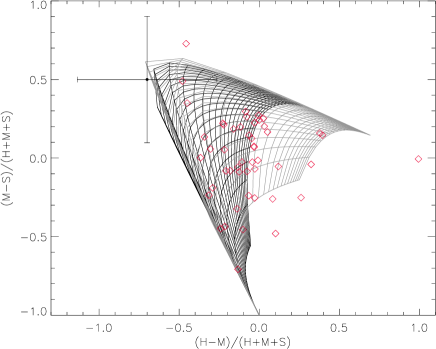
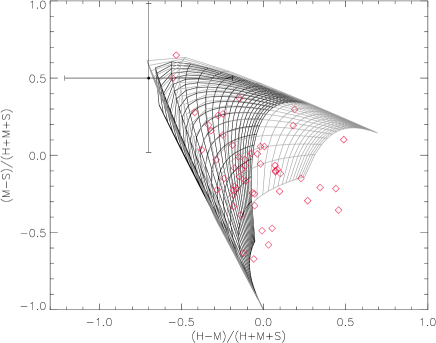
With the aim to attempt a classification of the high-energy sources detected towards our dSph sample, we followed Ramsay & Wu (2006) and calculated the hardness-ratios () as
| (2) |
Here, S, M, and H correspond to the count rates in the 0.2-1.0 keV, 1.0-2.0 keV, and 2.0-12.0 keV energy bands. From these values we constructed the color-color diagrams shown in Fig. 2, where the obtained values are compared with two spectral models. We used bremsstrahlung (grey tracks) and power-law (black lines) models in order to simulate the and of Cataclysmic Variables (CVs), Active Galactic Nuclei (AGN) or X-ray binaries777The reader can also see Ramsay & Wu (2006)., respectively.
We used the XSPEC package (Arnaud 1996) version 12.0.0 to obtain the color-color contours. In both cases, we vary the equivalent hydrogen column density from cm-2 to cm-2 so each of the almost horizontal lines corresponds to models with equal which increases from bottom to top. The temperature associated to each bremsstrahlung model (kT, taken in the range 0.1 - 3.0 keV) and the power-law index (in the range 0.1 - 3.0) are associated with primarily vertical lines: the values of kT and increase from left to right and from right to left, respectively.
In the upper left side of each panel of Fig. 2 we give a representative error bar, obtained by averaging all the data point error bars. Some of the detected sources have colors consistent with those of the absorbed power-law or absorbed bremsstrahlung models, others seem to require combined spectra or fall outside the pattern area. Even if many sources appear to have spectra consistent with that of a typical AGN (squared dots close black tracks) we cannot rule out that some of the sources have a different nature. In fact, due to the large error bars affecting values, a classification based only on the hardness-ratio cannot constrain the nature of the objects in our sample, allowing to distinguish among AGNs, X-ray binaries, CVs and X-ray active stars.
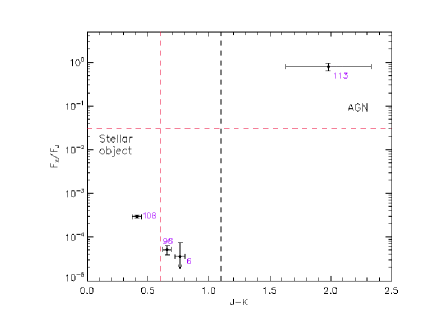
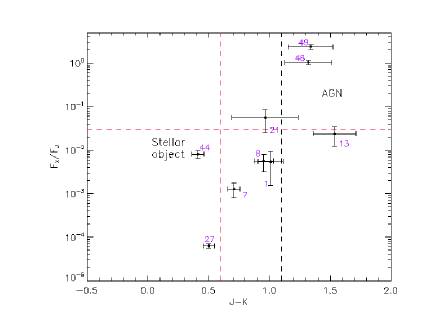
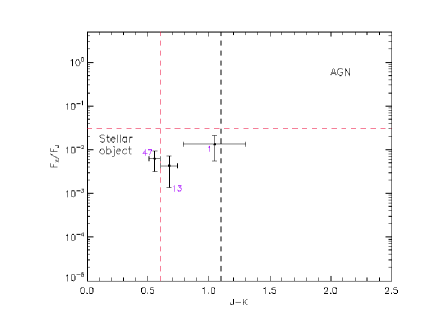
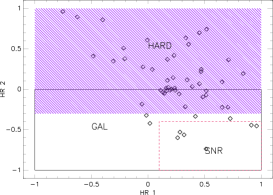
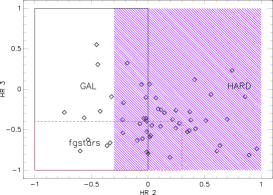
In order to improve our classification, we adopted the method of Haakonsen & Rutledge (2009) that uses a color-color diagram based on the ratio between the keV flux () and the NIR flux in the J band () versus the J-K color. In particular, QSO and Seyfert 1 objects lie in the upper right part having and (dashed red lines in Fig. 3) and the coronally active stars (including pre-main sequence and main-sequence stars, high proper-motion objects and binary systems) the lower left side with (dotted black line in Fig. 3) and .
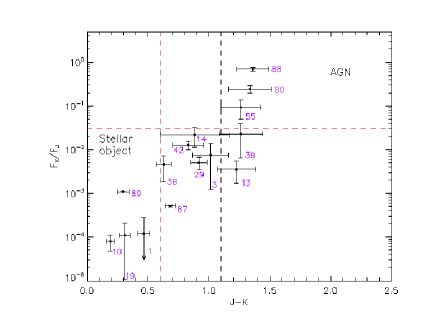
As one can see in Tables LABEL:DracoSources - LABEL:UMiSources we found many correlations between the detected sources and 2MASS catalogue. For these sources, we give in Tables 9 the 0.2-2.4 keV and NIR J band fluxes, as well as the J and K magnitudes.
| Src | FX | FJ | J | K |
|---|---|---|---|---|
| ( erg s-1 cm-2) | ( erg s-1 cm-2) | |||
| 1 | 0.48 | 173.6 3.7 | 11.17 0.02 | 10.70 0.02 |
| 3 | 0.21 0.18 | 2.87 0.19 | 15.62 0.07 | 14.61 0.08 |
| 10 | 0.28 0.12 | 351.6 5.5 | 10.40 0.02 | 10.21 0.02 |
| 13 | 0.33 0.17 | 9.11 0.69 | 14.37 0.08 | 13.14 0.08 |
| 14 | 0.33 0.16 | 1.52 0.15 | 16.31 0.10 | 15.42 0.18 |
| 19 | 0.37 0.34 | 343.3 8.2 | 10.43 0.03 | 10.12 0.02 |
| 29 | 0.45 0.14 | 8.97 0.26 | 14.38 0.03 | 13.46 0.04 |
| 38 | 0.61 0.36 | 13.29 0.38 | 13.96 0.03 | 13.33 0.03 |
| 39 | 0.61 0.44 | 2.67 0.20 | 15.70 0.08 | 14.44 0.10 |
| 42 | 0.68 0.14 | 5.32 0.24 | 14.95 0.05 | 14.12 0.08 |
| 55 | 1.04 0.46 | 1.12 0.17 | 16.64 0.16 | 15.38 0.02 |
| 80 | 5.19 0.86 | 2.13 0.18 | 15.94 0.09 | 14.60 0.09 |
| 87 | 10.70 0.56 | 2086 37 | 8.47 0.02 | 7.78 0.02 |
| 88 | 28.9 2.3 | 4.14 0.24 | 15.22 0.06 | 13.86 0.07 |
| 89 | 44.48 0.55 | 4090 115 | 7.74 0.03 | 7.44 0.02 |
| Src | FX | FJ | J | K |
|---|---|---|---|---|
| ( erg s-1 cm-2) | ( erg s-1 cm-2) | |||
| 6 | 0.20 | 262 5 | 10.72 0.02 | 9.96 0.02 |
| 96 | 1.90 0.46 | 3716 62 | 7.84 0.02 | 7.18 0.02 |
| 108 | 3.29 0.27 | 1117 22 | 9.15 0.02 | 8.74 0.02 |
| 113 | 5.70 0.45 | 0.71 0.15 | 17.14 0.21 | 15.16 0.15 |
| Src | FX | FJ | J | K |
|---|---|---|---|---|
| ( erg s-1 cm-2) | ( erg s-1 cm-2) | |||
| 1 | 0.27 0.19 | 4.94 0.23 | 15.03 0.05 | 14.02 0.06 |
| 7 | 0.40 0.15 | 31.54 0.78 | 13.02 0.03 | 12.31 0.03 |
| 8 | 0.47 0.20 | 8.36 0.27 | 14.46 0.04 | 13.51 0.04 |
| 13 | 0.64 0.30 | 2.70 0.13 | 15.69 0.09 | 14.15 0.08 |
| 21 | 0.92 0.49 | 1.66 0.16 | 16.22 0.10 | 15.25 0.17 |
| 26 | 1.23 0.59 | 0.83 0.12 | 16.96 0.15 | – |
| 27 | 1.24 0.14 | 1973 42 | 8.53 0.02 | 8.03 0.02 |
| 44 | 3.92 0.77 | 49.2 1.2 | 12.54 0.03 | 12.13 0.02 |
| 48 | 22.1 1.3 | 2.14 0.20 | 15.94 0.10 | 14.62 0.10 |
| 49 | 63.7 4.8 | 2.67 0.23 | 15.70 0.09 | 14.36 0.09 |
| Src | FX | FJ | J | K |
|---|---|---|---|---|
| ( erg s-1 cm-2) | ( erg s-1 cm-2) | |||
| 1 | 0.23 0.14 | 1.75 0.15 | 16.16 0.09 | 15.11 0.17 |
| 13 | 0.52 0.36 | 12.26 0.30 | 14.04 0.03 | 13.37 0.04 |
| 47 | 2.4 1.2 | 37.47 0.76 | 12.83 0.02 | 12.28 0.02 |
To obtain the 0.2-2.4 keV band flux we used the 0.2-12.0 keV one assuming, in webPIMMS888WebPIMMS is available at
http://heasarc.gsfc.nasa.gov/Tools/w3pimms.html, a power-law model
with spectral index and absorption column density inferred by NASA on-line tool
999This tool is available at
http://heasarc.gsfc.nasa.gov/cgi-bin/Tools/w3nh/w3nh.pl. Thus we obtained
=1.7 and =2.77 for Draco, =1.7 and =3.75 for Leo I,
=1.7 and =4.65 for UMa II and
=1.7 and =2.20 for UMi. In Fig. 3, we present the color-color diagrams
for the sources listed in Table 9.
In particular, Fig. 3 (a) shows the fifteen sources of Draco dSph with the detected counterparts. Among these, three (55, 80 and 88) clearly reside in the AGN part of the diagram. The likely galactic nature of source 55 is also inferred by the correlation with a QSO (see catalogues 223/qsos and 1921/table10). Instead sources 1, 3, 10, 14, 19, 29, 38, 42, 87, and 89 can be stellar objects. Many of them (1, 10, 19, 38, 87, 89) correlate with PPMX sources so are probably Milky Way sources. Scr 38 is also associated with an object belonging to a late-type stars catalogue (442/165), while Src 29 is realistically a “carbon star (C1)”, as also reported in the Draco stellar catalogue 1921/table9. Src 10 may be either a star (PPMX catalogue) or a background (437/968) object. In this case, the use of the diagram can be useful to settle the querelle in favour of a stellar type. We cannot use the same method for Src 13, correlating with both PPMX (stellar) and 78/675 (quasar-galaxy association) catalogues, because of its not clear identification in the aforementioned regions of the diagram. Finally, Src 39 is not catalogued with our diagram although it seems correlated with an AGN candidate (437/968 catalogue).
In the Leo I case we find four sources correlating with the 2MASS catalogue. The position of Scr 113 in Fig. 3 (b) denotes its background nature. The sources 96 and 108, recognized as stellar sources, are also associated with two objects in the PPMX catalogue, so they can be foreground stars.
Fig. 3 (c) shows five (1, 7, 8, 27, 44) stellar and three (21, 48, 49) galactic sources toward UMa II dSph. We correctly obtain a correlation of Src 27 with a source in the PPMX catalogue. In the same catalogue we find a source correlating with Src 44 that has an association with an AGN candiate (437/968 catalogue) so the diagram is useful in order to fix the possible stellar nature of the source.
In the last panel of Fig. 3, named (d), we present the analysis for UMi dSph. The relevant sources (1, 13 and 47) seem to have characteristics similar to X-ray active stars and binary sources. In particular, Src 13 correlates with a Radio/X-ray source (V/134 catalogue) with Red [Blue] magnitude of 17.0 [20.2] while Scr 47, correlating also with PPMX catalogue, is probably a foreground star.
We also used the SIMBAD database to search for correlations between our X-ray sources and available catalogues, getting more information (e.g., magnitude, redshift, source interpretation) afterwards used.
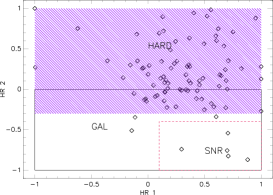
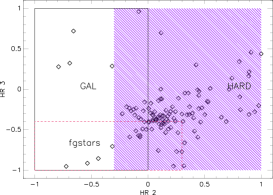
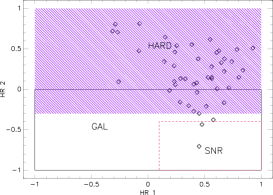
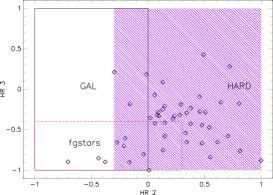
Moreover we follow the method of Pietsch et al. (2004), already used by Bartlett et al. (2012) to classify high-energy sources in Phoenix dSph. These authors statistically evaluated the nature of the sources by considering some criteria based on HR values definied as , with the count rates of the bands already given in S 3. We get our own criteria, summarized in Table 10, using the criteria fixed by Bartlett et al. (2012) and requesting the relevant classification in SIMBAD (for results of our classification, see Fig. 4 and Table 11). The sources are labelled identified (i), classified (cl) or candidate (ca) if they fulfill all, the mayority or only few criteria, respectively.
Furthermore, in the last column of Tables LABEL:Dracoclass-LABEL:UMiclass we report the source classification (HR Class.) based on these criteria. Here, FG [fg/f] point out the identified [classified/candidate] foreground stars, snr the classified Super Nova Remnants, A the identified Active Galactic Nuclei, G [g] the identified [classified] galaxies, sss the classified super soft sources, h the classified hard sources and Loc [loc/l] the identified [classified/candidate] local X-ray sources.
As the reader can see, the obtained results allow to get a wider X-ray source classification and show a good agreement with the previous inferences.
| Src Type | Criteria |
|---|---|
| fg star | classified as star in SIMBAD, log and and or not defined |
| SNR | classified as SNR in SIMBAD, and and not a fg star |
| AGN | classified as AGN, Sy1 or QSO in SIMBAD, not classification as SNR from |
| GAL | classified as G in SIMBAD, Optical id with galaxy and |
| SSS | , - or not defined, and not defined |
| HARD | or only and defined and no other classification |
| LX | not a fg star, classified as star in SIMBAD, redshift compatible with dSph’s one |
| Type | Draco | Leo I | UMa II | UMi |
|---|---|---|---|---|
| fg star | 5i+7cl+13ca | 2i+24ca | 11ca | 1i+8cl+8ca |
| SNR | 1cl | 2cl | 0 | 4cl |
| AGN | 11i | 1i | 1i | 2i |
| GAL | 1cl | 1i+1cl | 0 | 0 |
| SSS | 0 | 0 | 0 | 0 |
| HARD | 28cl | 72cl | 31cl | 10cl |
| LX | 1i+1cl+13ca | 1ca | 1cl | 16ca |
| not class | 8 | 12 | 5 | 5 |


4.2 Background sources
As suggested in the previous discussion, some of the detected sources may be AGNs or background galaxies. We estimate
the expected number of background sources towards our targets through the logN-logS diagram (Hasinger et al. 2005).
Starting from the minimum absorbed fluxes (in the 0.2-12.0 keV energy band) and assuming
and values as in the previous section, we estimated, via
webPIMMS v3.9,
the unabsorbed fluxes in the 0.5-2.0 keV energy band to be
for Draco,
for Leo I,
for UMa II,
for UMi.
Using these values as input parameters in the Hasinger relation, we find the
expected number of background AGNs as a function of the angular distance from the galaxy center.
In order to compare the theoretically estimated source number with the observed one,
we divided each dSph field of view (FOV)
into five rings and performed therein the comparison.
As it can be seen in Table 12, the number of X-ray sources in each annulus
is generally consistent with the expected one, although this is not the case for the external annuli since the logN-logS does
not account for border effects.
Nevertheless, we cannot rule out that some sources actually belong to MW or to the dSphs. This claim is supported by the presence of X-ray sources in the bottom-left region of the panels in Fig. 3 and the correlations with variable stars catalogues and the analysis summarized in the following section as well.
| Annulus | Rin | Rex | # Exp | # Obs |
|---|---|---|---|---|
| (arcmin) | (arcmin) | |||
| 1 | 0.00 | 0.76 | 0.2 0.1 | 0 |
| 2 | 0.76 | 3.60 | 5.6 1.0 | 7 |
| 3 | 3.60 | 6.50 | 13.3 2.4 | 13 |
| 4 | 6.50 | 9.00 | 17.6 3.1 | 22 |
| 5 | 9.00 | 16.00 | 79.4 14.1 | 46 |
| Annulus | Rin | Rex | # Exp | # Obs |
|---|---|---|---|---|
| (arcmin) | (arcmin) | |||
| 1 | 0.00 | 0.76 | 0.6 0.1 | 0 |
| 2 | 0.76 | 3.60 | 13.4 2.2 | 11 |
| 3 | 3.60 | 6.50 | 31.4 5.0 | 26 |
| 4 | 6.50 | 9.00 | 41.7 6.8 | 25 |
| 5 | 9.00 | 16.00 | 188.3 30.7 | 53 |
| Annulus | Rin | Rex | # Exp | # Obs |
|---|---|---|---|---|
| (arcmin) | (arcmin) | |||
| 1 | 0.00 | 0.76 | 0.2 0.1 | 0 |
| 2 | 0.76 | 3.60 | 4.5 0.9 | 3 |
| 3 | 3.60 | 6.50 | 10.9 2.0 | 13 |
| 4 | 6.50 | 9.00 | 14.4 2.6 | 11 |
| 5 | 9.00 | 16.00 | 65.1 11.6 | 22 |
| Annulus | Rin | Rex | # Exp | # Obs |
|---|---|---|---|---|
| (arcmin) | (arcmin) | |||
| 1 | 0.00 | 0.76 | 0.3 0.1 | 1 |
| 2 | 0.76 | 3.60 | 6.1 1.8 | 5 |
| 3 | 3.60 | 6.50 | 14.6 4.3 | 10 |
| 4 | 6.50 | 9.00 | 19.2 5.6 | 12 |
| 5 | 9.00 | 16.00 | 86.8 25.4 | 26 |
4.3 Possible local stars
As next we investigate the local nature of some of the detected high-energy sources.
Draco sources 3, 14 and 42, recognized as stellar objects in Fig. 3 (a), are not associated with any of the sources in the PPMX catalogue and so it cannot be excluded that they are local high-energy stellar systems. Src 30 has a “carbon like star counterpart” at a distance of 0.38′′, as reported by the 1921/table9 catalogue that collects many kinds of stars belonging to Draco. Sources 60, 64 and 77 correlate with late-type stars in Draco but Scr 64 and 77 have closer counterparts in two background object catalogues as well. Finally, Src 84 is associated with a Draco variable star (within 1′′) of the 127/861 catalogue but also to a QSO at distance of 0.52′′ [0.55′′] in the 1921/table10 [1223/qsos] catalogue. Its local nature is not so clear and we must conclude that Src 84 is likely linked to a background source, owing to the smaller distance from this kind of counterpart. The background nature of the last three sources is confirmed by the SIMBAD database. In the same data collection we find clues for stellar nature of X-ray sources toward/in Draco dSph.
As regards Leo I dSph, we find twenty correlations between our catalogue and 1475/table2 one, a NIR catalogue of Leo I stars.
One of these sources (Scr 103) also correlates (within ) with a QSO candidate, so we infer a possible background nature for it.
Instead Scr 6 seems to have a stellar nature (as already seen in Sect. 4.1) and no association with PPMX sources, therefore we argue that it belongs to Leo I galaxy.
In the UMa II case, sources 1, 7 and 8 may belong to this dSph because of their stellar nature (see the aforementioned Sect. 4.1) and no association with any PPMX object. Furthermore sources 7 and 8 correlate with objects in II/313 catalogue, a list of not variable sources. According to their “stellarity index”, a star/galaxy discriminator defined by Ofek et al. (2012), these two sources seem not to have an extended profile and could be UMa II stars, lacking foreground hints.
As for UMi, sources 1 and 13 are probably stars that belong to UMi because they are recognized as likely stellar objects in Fig. 3 (d) but don’t show any correlations with the PPMX catalogue.
We also perform a more restrictive source analysis, using the method deduced from Pietsch et al. (2004) and Bartlett et al. (2012) and considering as local sources only those identified or classified as such. Therefore, in the Draco dSph case we have two local sources (the identified 29 and the classified 14), only one (the classified 14) for UMa II and none as for Leo I and UMi. A subsequent follow-up (also in other wavelengths) would be useful to fully probe the nature of such objects. In addition, it could have some implications in the formation and evolution scenarios of these galactic systems.
Apart from the aforementioned sources, about thirty of them remain at the candidate stage. So, a further study could settle the issue if they really belong to the dSphs or not.
4.4 Clues for IMBHs
Both the MBH- and MBH-MBulge relations (e.g., Gebhardt et al. 2000 and
Ferrarese & Merrit 2000) suggest to search for compact objects, belonging to IMBH’s
range, toward dSphs. For this reason we investigate the presence of BHs in their cores,
where these X-ray sources are likely located.
The closest source (Src 11) to the Draco center is at distance of about 51′′,
Src 67 [Src 3] at 76′′ [51′′] from Leo I [UMa II] center (see Fig. 5).
These distances are well above the source error boxes (1.2′′,
0.7′′ and 1.4′′, respectively) so we infer that none of the high-energy sources is
located at the center of these dSphs.

Nevertheless, using the minimum unabsorbed fluxes and the distances reported by NED, we estimated an upper limit
to the luminosity (in the 0.2-12.0 keV energy band) of the compact central object (if any),
getting about 4.751033 erg s-1,
1.21 1034 erg s-1 and 1.051033 erg s-1 for Draco, Leo I and UMa II, respectively.
Scaling the previous minimum fluxes to the 0.5-2.0 keV energy band, we obtained, via the logN-logS relation, the expected
number of the background sources (within 25′′): 0.08, 0.18 and 0.06, respectively.
Being well below the unity, we infer that if any source exist in such a region, it should be located within the dwarf galaxies.
Despite any clear identification of central object, we also put an upper limit to the putative central BH mass (MBH) by
assuming it accretes through the Bondi-Hoyle spherical model. Bondi & Hoyle (1944) claimed that when a BH moves with
velocity through a gaseus medium, characterized by an hydrogen number density , it accretes at a rate given by
| (3) |
where is the proton mass and the sound speed in the medium. Then, the subsequent X-ray luminosity can be rewritten as
with , while is the efficiency in converting mass to radiant energy and the fraction of the Bondi-Hoyle accretion rate onto the BH.
Assuming 10 km s-1 (consequently V 15 km s-1) and in the range 10-3 - 10-1 cm-3 as typical values for this kind of system, we obtain that the IMBHs (if any) at the center of these galaxies must have an upper limit mass of M⊙. Of course, this estimate scales as . We also searched for radio sources in the NRAO VLA Sky Survey (NVSS) (within 100′′ from the dSph centers) with the aim of obtaining a better BH mass estimate. However, no radio source was found.
4.5 The case of UMi dSph
The possibility that UMi dSph hosts a BH in its center was already studied quite intensely. For example, Maccarone et al. (2005a) found a radio source within 3 error box from the galaxy center and, assuming the existence of an accreting IMBH and a gas density as low as 1/30-1/100 of the typical density in globular clusters, these authors realized that a central black hole with mass of few 105 M⊙ would be necessary in order to explain the observed radio flux. Furthermore, Lora et al. (2009) inferred an upper limit of 2-3104 M⊙ using N-body simulations of the tidal disruption of a long lived substructure observed on the north-east side of the UMi major axis. It was also claimed that the compact object may not residing in the galactic center but offset from it because of gravitational effects.
Nucita et al. (2013b) analyzed the X-ray data acquired by the Chandra satellite for ks in 2011 (Obs. id. 12754) and found an X-ray source (at J2000 coordinates RA = 15h 09m 14.37s and Dec = 67∘ 12′ 58.4′′, with associated error of ) with an unabsorbed 0.5-7.0 keV flux of F4.9 erg s-1. The X-ray source was spatially coincident (within 1.2′′) with a source (the same already identified in the radio band by Maccarone et al. 2005a) with a flux density of 7.10.4 mJy at 1.4 GHz. Such radio source 150914+671258 was detected by NRAO VLA Sky Survey (NVSS) at J2000 coordinates RA = 15h 09m 14.56s and Dec = 67∘ 12′ 58.9′′ and the relevant positional error is 2.1′′ as obtained from the sum in quadrature of the uncertainties associated to the two coordinates. Under the assumption that the observed source is an accreting IMBH, Nucita et al. (2013b) used the fundamental plane relation to evaluate the BH mass, which resulted to be 106M⊙. As stressed by the same authors, the detection algorithm (wavdetect) was run with a significance threshold of corresponding to the possibility to have at least one false detection in the CCD where the target is found. Hence, the source was detected by Chandra only at confidence level.
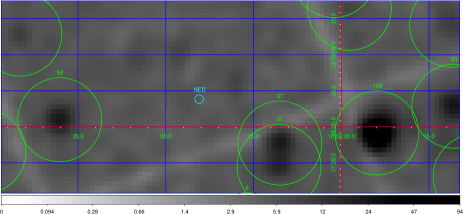
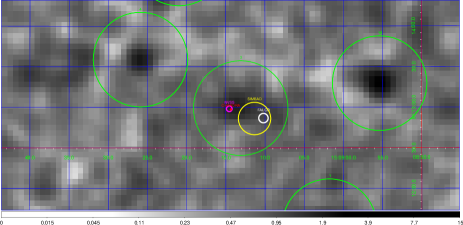
Here, in order to test the robustness of this result, we analyzed the 2005 XMM-Newton data and found that, as shown in Fig. 5(d), an X-ray source (Src 3) is clearly detected and superimposed to the location of the galaxy center. In particular, Src 3 (with J2000 coordinates RA = 15h 09m 13.1s and Dec = 67∘ 12′ 59.4′′) has a distance of 30′′ from UMi center (white circle) as reported by Falco et al. (1999) 101010Falco et al. (1999) assigned a positional uncertaintly of 3.5′′, obtained as a sum in quadrature of the errors (2.5′′) associated on RA and Dec, to UMi galaxy center., and a galactocentric distance 24′′ if the SIMBAD database coordinates 111111UMi dSph is located, as reported by SIMBAD (yellow circle), at J2000 coordinates RA = 15h 09m 11.34s and Dec = 67∘ 12′ 51.7′′ with a positional uncertaintly of 12.2′′, due to the sum in quadrature of the RA (2′′) and Dec (12′′) errors. are considered. In the same Figure, we give the position of the X-ray source detected by Chandra (1” red circle) and the associated NVSS radio counterpart (2” magenta circle). Note that the distance between the XMM-Newton and Chandra sources is .
Src 3 is characterized by an absorbed 0.2-12.0 keV flux of 7.32.9)10-15 erg s-1 cm-2 which corresponds to an unabsorbed flux of F=(7.903.14)10-15 erg s-1 cm-2. The unabsorbed 2-10 keV band flux is F=(4.051.61)10-15 erg s-1 cm-2.
Assuming a distance of 7310 kpc, as reported by NED, we are left with a luminosity L=(4.882.37)1033 erg s-1 and L=(2.501.21)1033 erg s-1.
Following Nucita et al. (2013b) and the references therein, we can get constraints on the possible central BH parameters. In fact, from the correlation between X-ray Src 3 and the radio 150914+671258 source (at distance of 3.6′′), we can estimate the BH mass using the fundamental plane relation (Merloni et al. 2003, Körding et al. 2006)
| (4) |
where the mass and the luminosities are in units of solar masses M⊙ and erg s-1, respectively, = 0.60, =0.78 and =7.33. Solving for the black hole mass, Merloni et al. (2003) obtained
| (5) |
where is the source distance expressed in Mpc and the last term is a consequence of the scatter in the fundamental plane relation.
From the 1.4 GHz radio flux density of the source 150914+671258, we obtained the 5 GHz one, assuming . So, assuming a flat source spectrum (), we get mJy, consequently a radio flux erg cm -2 s-1 and a radio luminosity of erg s-1.
Using the previous estimate of the radio (5 GHz) and X-ray (2-10 keV) fluxes in eq. (5), we estimate a mass of 106 M⊙ for the putative IMBH. The rather large uncertainty is mostly due to the intrinsic scatter of the fundamental plane relation. The obtained IMBH mass is consistent with that estimated by Nucita et al. (2013b) when analyzing the 2011 Chandra data. We also note that this result sligthly depends on the index of the radio spectral energy distibution. Changing , scales with the factor . For example, for the BH mass gets reduced by .
Note also that when scaling the 0.2-12 keV source flux (as detected by the XMM-Newton) to the range 0.5-7 keV, one gets a flux consistent (within the errors) to that estimated using the 2011 Chandra data. The corresponding 0.5-7.0 keV luminosity is erg . By comparing the bolometric luminosity, calculated as (Ho 2008), with the expected Eddington one erg s-1, one gets . This clearly shows that the UMi putative BH is radiatively inefficient. Indeed, assuming the simplified Bondi accretion scenario, we use eq. (4.4) with and obtain
| (6) |
that confirms the expected low IMBH accretion efficiency, previously highlighted.
Finally, we evaluate the expected number of background objects to investigate the possibility that the high energy emission of Src 3 is due to an object standing behind. By using the minimum X-ray detected flux towards UMi, correctly scaled to the 0.5-2.0 keV band ( erg s-1 cm-2), we get within from the center. In spite of the small value of N, the background scenario cannot be definitively ruled out.
5 Conclusions
In this paper, we re-analyzed some deep archival XMM-Newton data sets in order to full characterize the high-energy point-like source population of four dSph MW companions. Hence, the ultimate goal, is to classify the X-ray sources identified towards our galaxy sample and pinpoint local (or candidate local) sources.
We performed an accurate study obtaining 89 X-ray sources for Draco, 116 for Leo I, 49 for UMa II and 54 for UMi. Albeit these values are statistically consistent with those of background AGNs, theoretically reached via the logN-logS relation, we cannot rule out the possibility that some sources belong to the same dSphs. This claim is supported by the color-color diagram (based on the ratio between keV X-ray and J band NIR fluxes versus the J-K color). In this way we find that some X-ray sources, correlating with counterparts in the 2MASS catalogue, have a stellar nature (see Fig. 3 and Sect. 4.1). Further, we perform a statistical source sorting using only the high-energy data. This leads us to a wider and more complete classification of the X-ray sources in the target field of view. We reveal two high-energy sources (among which a carbon star) belonging to Draco, one to UMa II and none to Leo I. Although the the statistic at our hand is poor, finding a few possible local X-ray sources may represent a problem that need to be addressed. In fact, dSph galaxies, as globular clusters, host mainly old star populations but, due to the much lower central stellar density in dSphs, X-ray sources (either LMXBs or CVs) are expected to be primordial objects and not formed by capture encounters. However, these X-ray sources, should already turned off making unlikely to being found in dSphs. Finding X-ray sources in dSphs represent therefore a puzzling problem and in any case may allow to test the formation theories of these objects in a contrasting environment with respect to that in globular clusters..
By extrapolating the fundamental relation to the dSph realm, one sees that these galaxies are expected to contain IMBHs in their gravitational centers. We thus searched for X-ray sources located within the core radius of the dSphs of our sample. However, for Draco, Leo, and UMa we did not identify any high-energy (and radio) sources nearby the galactic centers. Then, we can only put upper limits to the mass and luminosity of the putative central IMBHs.
On the contrary, it is interesting that the UMi center hosts an X-ray source –Src 3– which correlates in position with a radio object. In the IMBH hypothesis, the fundamental plane relation of eq. (5) allows us to get an estimate of the mass (a few 10) of the accreting black hole possible hosted in the galaxy. We remind that the source was already detected by Chandra in the past but only at the poor confidence level, thus leaving the possibility that the Chandra source was a mere fake detection.
Our analysis, based on independent XMM-Newton data, confirms however Src 3 as a possible X-ray counterpart of an accreting IMBH.
Acknowledgments
We thank M. Guainazzi for stimulating discussions while preparing the manuscript. We also acknowledge the support by the INFN project TaSP. We thank the anonymous Referee for the suggestions that greatly improved the paper. One of us (AAN) is grateful to Matteo Nucita for reading the draft.
References
- Arnaud (1996) Arnaud K. A., 1996, in Jacoby G., Barnes J., eds, Astronomy Society of the Pacific Conference Series Vol. 101, XSPEC: The First Ten Years, in Astronomical Data Analysis Software and Systems V. Astron. Soc. Pac., San Francisco, p. 17
- Assmann et al. (2013a) Assmann, P., Fellhauer, M., Wilkinson, M. I., Smith, R., 2013a, MNRAS, 432, 274A
- Assmann et al. (2013b) Assmann, P., Fellhauer, M., Wilkinson, M. I., Smith, R., Blaña, M., 2013b, MNRAS, 435, 2391A
- Baade & Swope (1961) Baade, W., Swope, H. H., Astronomical Journal, 1961, 66, 300
- Bartlett et al. (2012) Bartlett, E. S., Coe, M. J., Haberl, F., McBride, V. A., Corbet, R. H. D., 2012, MNRAS, 422, 2302
- Bellazzini et al. (2002) Bellazzini M., Ferraro F. R., Origlia L., Pancino E., Monaco L., Oliva E., 2002, AJ, 124, 3222
- Bonanos et al. (2004) Bonanos, A. Z., Stanek, K. Z., Szentgyorgyi, A. H., Sasselov, D. D., Bakos, G. Á., 2004, AJ, 127, 861
- Bondi & Hoyle (1944) Bondi, H., Hoyle, F., 1944, MNRAS, 104, 273
- Breddels & Helmi (2013) Breddels, M. A., and Helmi, A., 2013, A&A 558, A35
- Bukhmastova (2001) Bukhmastova, Yu. L., 2001, Astron. Rep., 45, 581
- Carrera et al. (2002) Carrera, R., Aparicio, A., Martínez-Delgado, D., Alonso-García, J., 2002, AJ, 123, 3199C
- Casas et al. (2012) Casas, R. A., Arias, V., Peña Ramírez, K., Kroupa, P., 2012, MNRAS, 424, 1941C
- Cavuoti et al. (2014) Cavuoti, S., Brescia M., D’Abrusco R., Longo G., Paolillo M., 2014, MNRAS, 437, 968
- Cioni & Habing (2005) Cioni, M. R. L., Habing, H. J., 2005, A&A, 442, 165
- D’Abrusco et al. (2009) D’Abrusco, R., Longo, G., Walton, N. A., 2009, MNRAS, 396, 223
- Dall’Ora et al. (2003) Dall’Ora, M., et al., 2003, AJ, 126, 197
- Dall’Ora et al. (2012) Dall’Ora M. et al., 2012, ApJ, 752, 42
- de La Calle et al. (2014) de la Calle I. et al., eds, 2014, XMM-Newton Proposers Guide and Phase II Remote Proposal System Users Manual, issue 14.0 (ESA: XMM- Newton SOC
- Dehnen & King (2006) Dehnen, W., & King, A., 2006, MNRAS, 367, 29
- Falco et al. (1999) Falco, E. E., Kurtz, M. J., Geller, M. J., et al., 1999, PASP, 111, 438
- Fellhauer et al. (2007) Fellhauer, M., et al., 2007, MNRAS, 375, 1171
- Ferrarese & Merrit (2000) Ferrarese, L., Merrit, D., 2000, ApJ, 539, L9
- Flesch (2010) Flesch, E., 2010, PASA, 27, 283
- Jardel & Gebhardt (2012) Jardel, J. R., & Gebhardt, K., 2012, ApJ, 746, 89
- Gebhardt et al. (2000) Gebhardt, K.,et al., 2000, ApJ, 539, L13
- Goranskij (1982) Goranskij, V. P., 1982, Astronomicheskii Tsirkulyar NO.1216
- Grillmair et al. (1998) Grillmair, C. J., Mould, J. R., Holtzman, J. A., et al. ,1998, AJ, 115, 144
- Guainazzi (2010) Guainazzi, M., 2010, XMM-SOC-CAL-TN-0018, XMM-Newton Science Operations Centres http://xmm2.esac.esa.int/docs/documents/ /CAL-TN-0018.ps.gz
- Gullieuszik et al. (2009) Gullieuszik, M., Held, E. V., Saviane, I., Rizzi, L., 2009, A&A, 500, 735
- Haakonsen & Rutledge (2009) Haakonsen, C. B., Rutledge, R. E., 2009, ApJS, 184, 138
- Harrington & Wilson (1950) Harrington, R. G., Wilson, A. G., 1950, PASP, 62, 365, 118
- Harris (1996) Harris, W.E., 1996, AJ, 112, 1487
- Hasinger et al. (2005) Hasinger, G., Miyaji, T., Schmidt, M., 2005, A&A, 441, 417
- Held et al. (2010) Held E. V., Gullieuszik M., Rizzi L., Girardi L., Marigo P., Saviane I., 2010, MNRAS, 404, 1475
- Ho (2008) Ho, L. C., 2008, A&A, 46, 475
- Ibata et al. (2001) Ibata, R., Irwin, M., Lewis, G. F., Stolte, A., 2001, ApJ, 547, L133
- Kinemuchi et al. (2002) Kinemuchi, K., Smith, H. A., Lacluyzé, A. P., et al., 2002, Radial and Nonradial Pulsations as Probes of Stellar Physics, ASP Conference Proceedings, 259, Edited by Conny Aerts, Timothy R. Bedding, and Jørgen Christensen-Dalsgaard. ISBN: 1-58381-099-4. Also IAU Colloquium 185. San Francisco: Astronomical Society of the Pacific, 130
- Kinemuchi et al. (2008) Kinemuchi K., Harris H. C., Smith H. A., Silbermann N. A., Snyder L. A., La Cluyz A. P., Clark C. L., 2008, ApJ, 136, 1921
- Kirsch (2004) Kirsch, M. G. F., et al., 2004, in Proc. SPIE, 5488, 103
- Koch et al. (2007) Koch A., Wilkinson M. I., Kleyna J. T., Gilmore G. F., Grebel E. K., Mackey A. D., Evans N. W., Wyse R. F. G., 2007, ApJ, 657, 241
- Körding et al. (2006) Körding, E., Falcke, H., Corbel, S., 2006, A&A, 456, 439
- Lemons et al. (2015) Lemons, S.M., Reines, A. E., Plotkin, R. M., Gallo, E., & Greene, J.E., 2015, e-print arXiv:1502.06958
- Lora et al. (2009) Lora, V., Sánchez-Salcedo, F. J., Raga, A. C., Esquivel, A., 2009, ApJ, 699, L113
- Maccarone et al. (2005a) Maccarone, T. J., Fender, R. P., Tzioumis, A. K., 2005a, Astrophys. Space Sci., 300, 239
- Maccarone et al. (2005b) Maccarone, T. J., Kundu, A., Zepf, S. E., Piro, A. L., Bildsten, L., 2005b, MNRAS, 364, L61
- Magorrian et al. (1998) Magorrian, J., Tremaine, S., Richstone, D., 1998, AJ, 115, 2285
- Majewski et al. (2000) Majewski, S. R., Ostheimer, J. C., Patterson, R. J., et al., 2000, AJ, 119, 760
- Malyshev et al. (2014) Malyshev, D., Neronov, A., & Eckert, D., 2014, Phys. Rev. D, 90, 103506
- Martin et al. (2008) Martin, N. F., de Jong, J. T. A., Rix, H.-W., 2008, ApJ, 684, 1075
- Martinez-Delgado et al. (2001) Martínez-Delgado, D., Alonso-García, J., Aparicio, A., Gómez-Flechoso, M. A., 2001, ApJ, 549, L63
- Mateo (1997) Mateo, M., 1997, in Arnaboldi M., Da Costa G. S., Saha P., eds, Astron- omy Society of the Pacific Conference Series Vol. 116, The Nature of Elliptical Galaxies. Astron. Soc. Pac., San Francisco, p. 259
- Mateo et al. (1998) Mateo, M., Olszewski, E. W., Morrison, H. L., 1998, ApJ, 508, L55
- McConnachie (2012) McConnachie, A. W., 2012, AJ, 144, 4
- Menzies et al. (2010) Menzies, J. W., Whitelock, P. A., Feast, M. W., Matsunaga, N., 2010, MNRAS, 406, 86
- Merloni et al. (2003) Merloni, A., Heinz, S., Di Matteo, T., 2003, MNRAS, 345, 1057
- Monet et al. (2003) Monet, D. G., Levine, S. E., Canzian, B., 2003, AJ, 125, 984
- Muñoz et al. (2010) Muñoz, R. R., Geha, M., Willman, B., 2010, AJ, 140, 138
- Nemec (1985) Nemec, J. M., AJ, 1985, 90, 204
- Nucita et al. (2013a) Nucita, A. A., Manni, L., De Paolis, F., Vetrugno, D., Ingrosso, G., 2013a, A&A, 550, 18
- Nucita et al. (2013b) Nucita, A. A., De Paolis, F., Manni, L., Ingrosso, G., 2013b, New Ast., 23, 107
- Odenkirchen et al. (2001) Odenkirchen, M., et al., 2001, ApJ, 122, 2538
- Ofek et al. (2012) Ofek, E. O., et al., 2012, PASP, 124, 854
- Orio et al. (2010) Orio M., Gallagher J., Greco C., Held E., Walker N. H., Pavan L., 2010, AIP Conf. Proc., 1314, 337
- Pietsch et al. (2004) Pietsch, W., Misanovic, Z., Haberl, D., Ehle, M., Trinchieri, G., 2004, A&A, 426, 11
- Podsiadlowski et al. (2004) PodsiadlowskiPh.,RappaportS.,PfahlE.,HanZ.,BeerM.E.,2004,inRasio F. A., Stairs I. H., eds, Astronomy Society of the Pacific Conference Series Vol. 328, Binary Radio Pulsars. Astron. Soc. Pac., San Francisco, p. 327
- Ramsay & Wu (2006) Ramsay, G., Wu, K., 2006, A&A, 459, 777
- Rave et al. (2003) Rave H. A., Zhao C., Newberg H. J., Yanny B., Schneider D. P., Brinkman J., Lamb D. Q., 2003, ApJS, 145, 245
- Reines et al. (2013) Reines, A. E., Greene, J. E., Geha, M., 2013, ApJ, 775, 116
- Richards et al. (2010) Richards, G. T., et al., 2010, ApJ S, 180, 67
- Roeser et al. (2008) Roeser S., Schilbach E., Schwan H., Kharchenko N. V., Piskunov A. E., Scholz R. D., 2008, A&A, 488, 401
- Roeser et al. (2010) Roeser, S., Demleitner, M., Schilbach, E., 2010, AJ, 139, 2440
- Silk et al. (1987) Silk, J., Wyse, R. F. G., Shields, G. A., 1987, ApJ, 322, 59
- Skrutskie et al. (2006) Skrutskie, M. F., et al., 2006, AJ, 131, 1163
- Smecker-Hane et al. (2009) Smecker-Hane, T. A., Marsteller, B., Cole, A., Bullock, J., Gallagher, J. S., 2009, Bulletin of the American Astronomical Society, 41, 235
- Smith et al. (2013) Smith R., Fellhauer M., Candlish G. N., Wojtak R., Farias J. P., Blana M., 2013, MNRAS, 433, 2529
- Stetson et al. (1998) Stetson, P. B., Hesser, J. E., & Smecker-Hane, T. A. 1998, PASP, 110, 533
- Walker et al. (2007) Walker, M. G., Mateo, M., Olszewski, E. W., 2007, ApJ, 667, L53
- Watson et al. (2009) Watson, M. G., et al., 2009, A&A, 493, 339
- Wilson (1955) Wilson, A. G., PASP, 1955, 67, No. 394, 27
- Yang et al. (2014) Yang, Y., Hammer, F., Fouquet, S., et al., 2014, e-print arXiv:1405.2071
- Zinn & Searle (1976) Zinn, R., Searle, L., 1976, ApJ, 209, 734
- Zucker et al. (2006) Zucker, D. B., Belokurov, V., Evans, N. W., et al., 2006, ApJ, 650, L41