RXTE & Swift Observations of SWIFT J0513.4–6547
Abstract
We present timing and spectral analysis of SwiftXRT and RXTEPCA observations of the transient Be/X-ray pulsar SWIFT J0513.4–6547 during its outburst in 2009 and its rebrightening in 2014. From 2009 observations, short term spin-up rate of the source after the peak of the outburst is found to have about half of the value measured at the peak of the outburst by Coe et al. When the source is quiescent between 2009 and 2014, average spin-down rate of the source is measured to be Hz s-1 indicating a surface dipole magnetic field of Gauss assuming a propeller state. From 2014 observations, short term spin-down rate of the source is measured to be about two orders smaller than this long-term spin-down rate. The orbit of the source is found to be circular which is atypical for transient Be/X-ray binary systems. Hardness ratios of the source correlate with the X-ray luminosity up to erg s-1 in 3-10 keV band, whereas for higher luminosities hardness ratios remain constant. Pulsed fractions are found to be correlated with the source flux. Overall SwiftXRT and RXTEPCA energy spectrum of the source fit equally well to a model consisting of blackbody and power law, and a model consisting of a power law with high energy cut-off. From the pulse phase resolved spectra and pulse phase resolved hardness ratios obtained using RXTEPCA, it is shown that spectrum is softer for the phases between the two peaks of the pulse.
keywords:
X-rays: binaries, pulsars: individual: SWIFT J0513.4–6547, stars:neutron, accretion, accretion discs1 Introduction
On 2009 April 2 (MJD 54923) the SwiftBAT (Burst Alert Telescope) detected a new transient X-ray source SWIFT J0513.4–6547 in the Large Magellanic Cloud (LMC) (Krimm et al. 2009). An archival analysis of BAT data brought out that the source had been active since 2009 March 4 (MJD 54894) and had reached a peak brightness of mCrab on 2009 March 6. Monitoring observations with RXTE (Rossi X-ray Timing Explorer) tracked the decline of the outburst until 2009 May 13 (MJD 54964). The detection of strong pulsations with a period around 27.28 s during the outburst and the association of the X-ray transient with the optical source 2MASS 05132826–6547187, have led SWIFT J0513.4–6547 to be identified as a High Mass X-ray Binary system (HMXB) (Krimm et al. 2009, Krimm et al. 2013).
A recent study (Coe, Udalski & Finger 2013, Coe et al. 2015) on 4.5 years of OGLE IV (Optical Gravitational Lensing Experiment Phase IV) light curve revealed regular modulation of the optical magnitude. Approximately 0.05 magnitude flickering in every 27.4 days confirms the binary nature of SWIFT J0513.4–6547, assuming that the optical modulation represents the binary period of the system. Coe et al. (2015) refined the frequency measurements of Finger & Beklen (2009) from Fermi/GBM (Gamma Ray Burst Monitor) detections and derived the orbital parameters of the system. They provided an upper limit of 0.17 to the eccentricity using a model with a fixed orbital period of 27.405 d.
Coe et al. (2015) also studied the optical spectrum and identified the companion as a B1Ve star. The position of SWIFT J0513.4–6547 on the Corbet diagram (pulse period vs. orbital period diagram, Corbet 1984) affirms the Be/X-ray binary nature. Generally X-ray outbursts of Be/X-ray binary systems occur in two different forms, classified as Type I or Type II (Stella, White & Rosner 1986). Type I outbursts ( erg s-1) are correlated with the binary orbit so that; they are recurrently observed in certain orbital phases due to enhanced mass transfer. In contrast, Type II outbursts ( erg s-1) are less frequent, irregular but giant eruptions that decay along several orbital periods. 2009 outburst of SWIFT J0513.4-6547 can be identified as Type II since its peak luminosity is derived as erg s-1 (Coe et al. 2015) and the outburst lasted for about two orbital cycles.
Recently, the source underwent another bursting activity in 2014. During the XMM-Newton (X-ray Multi-Mirror Mission) detection on 2014 August 25 (MJD 56894), the luminosity was at the order of erg s-1 (Sturm et al. 2014). Seven follow-up Swift observations until the end of the year show that the luminosity peaked twice at the same level, September 19 (MJD 56919) and October 16 (MJD 56946). These three outbursts on August 25, September 19 and October 16 can be classified as Type I since their occurrence times are just about the expected optical maxima.
In this paper, we study the spectral and timing properties of SWIFT J0513.4–6547 through its observations with RXTE and Swift during the 2009 outburst. In addition, we analyse the Swift data of 2014 outburst. We introduce the observations in Section 2. We present our timing and spectral results in Sections 3 and 4. In Section 5, we discuss our results and conclude.
2 Observations
2.1 RXTE
| RXTE | Time | Number of | Exposure |
|---|---|---|---|
| proposal ID | (MJD) | observations | (ks) |
| 94065 | 54935 - 54947 | 10 | 14.24 |
| 94421 | 54948 - 54964 | 8 | 9.73 |
18 target of opportunity (TOO) observations (see Table 1) with RXTEPCA (Proportional Counter Array;
Jahoda et al. 1996) were carried out between 2009 April 14 (MJD 54935) and 2009 May 13 (MJD 54964). These observations
witness the decline of the 2009 outburst of SWIFT J0513.4–6547. The data are subjected to standard analysis using the tools
of HEASOFT V.6.15.1. Time filtering is applied with the criteria on elevation angle to be greater than 10,
offset from the source to be less than 0.02 and electron contamination of PCU2 to be less than 0.1. We also exclude
data within 30 minutes of the peak of South Atlantic Anomaly (SAA) in order to increase signal-to-noise ratio (SNR). The
resulting net exposure after the filtering is 24 ks.
GoodXenon events are used to generate 0.1 s binned 3–10 keV light curves for the timing analysis, whereas Standard2f mode
data are considered for broad spectral analysis. Furthermore, using FASEBIN tool, we construct pulse phase resolved
spectra from GoodXenon events. Energy-resolved pulse profiles are produced from phase spectra by obtaining the count rates
per phase bin with the tool FBSSUM. We select only data from PCU2 during the extraction of spectral files, since it
is the only PCU that is active during all of the observations. Moreover, only photons detected on the top anode layers are
selected to increase SNR. Background subtraction is applied for spectra and light curves by using EPOCH 5C background model
supplied for faint sources (i.e. 40 cts/s/PCU).
2.2 SWIFT
| Swift | Time | Off-axis | Exposure |
|---|---|---|---|
| obsID | (MJD) | () | (ks) |
| 00031393001 | 54932 | 0.45 | 4.63 |
| 00031393002 | 54937 | 0.35 | 6.34 |
| 00031393003 | 54940 | 1.01 | 1.69 |
| 00031393004 | 56916 | 0.10 | 0.93 |
| 00031393005 | 56919 | 2.12 | 1.41 |
| 00031393006 | 56925 | 0.39 | 0.97 |
| 00031393007 | 56939 | 2.48 | 1.00 |
| 00031393008 | 56946 | 1.53 | 1.24 |
| 00033532001 | 56985 | 2.39 | 1.31 |
| 00033532002 | 56986 | 1.21 | 1.05 |
After the SwiftBAT discovery of SWIFT J0513.4–6547, 3 follow-up SwiftXRT (X-ray Telescope;
Burrows et al. 2005) observations were performed on 2009 April. Moreover; when the source re-brightened on 2014 August,
7 pointing observations were completed until the end of 2014. A log of SwiftXRT observations is given in
Table 2. The total exposure of 2009 and 2014 observations are 12.67 ks and 7.92 ks, respectively.
The observations of SWIFT J0513.4–6547 are in photon counting (PC) mode which has a time resolution of 2.5 s.
XRT event files are filtered with the default screening criteria of XRTPIPELINE V.0.13.0 script of
XRTDAS V.2.9.2 package. Standard grade filtering (0-12) is applied to the data. For each observation, vignetting
corrected exposure maps are generated during the pipeline processing.
Throughout the 2009 observations of SWIFT J0513.4–6547 count rates were just around the pile-up limit
( 0.5 cts s-1), therefore the events are corrected for pile-up. For these observations an annular source region
is selected in order to exclude an inner circle of radius 7 arcsec, while the outer radius of the annulus is
70 arcsec. In contrast, the count rates of 2014 observations were low ( 0.1 cts s-1), consequently a
circular source extraction region with 35 arcsec radius is chosen. The same circular source-free region with
140 arcsec radius is used for background extraction for both 2009 and 2014 observations. Light curves and spectra are
extracted by filtering selected regions using XSELECT V.2.4C.
For the overall spectral analysis spectral files are rebinned to have at least 20 counts per energy bin, which is required
for fitting. However, spectra of individual observations are rebinned to have minimum of 1 count per bin and Cash
statistic (Cash 1979) is used as it is advised for low count spectra. We use the latest response matrix file (version v014) and
create individual ancillary response files using the tool XRTMKARF V.0.6.0 with the exposure maps produced during
the pipeline processing. Spectral analysis is performed using XSPEC V.12.8.1g.
3 Timing Analysis
3.1 Pulse Arrival Time and Pulse Frequency Measurements
For the RXTEPCA and SwiftXRT observations in 2009 (see Tables 1 and 2), we construct background subtracted lightcurves. The resulting RXTE and Swift lightcurves are 0.1s and 2.51s binned respectively. We correct the lightcurves with respect to the Solar System barycenter. The lightcurves are also corrected for the orbital binary motion using the orbital parameters given by Coe et al. (2015).
The nominal pulse period is estimated, by folding RXTEPCA barycentric lightcurve on statistically independent trial periods (Leahy et al. 1983). We search for periodicity using test and use the template pulse profile giving the maximum . Then we fold the RXTEPCA and SwiftXRT lightcurves with the best period obtained from RXTEPCA lightcurve. Pulse profiles are obtained with 10 and 20 phase bins from SwiftXRT and RXTEPCA, respectively. Pulse profiles are represented by their Fourier harmonics (Deeter & Boynton 1985). Then, we obtain the pulse arrival times for each observation by cross correlating the pulses with template pulse profile.
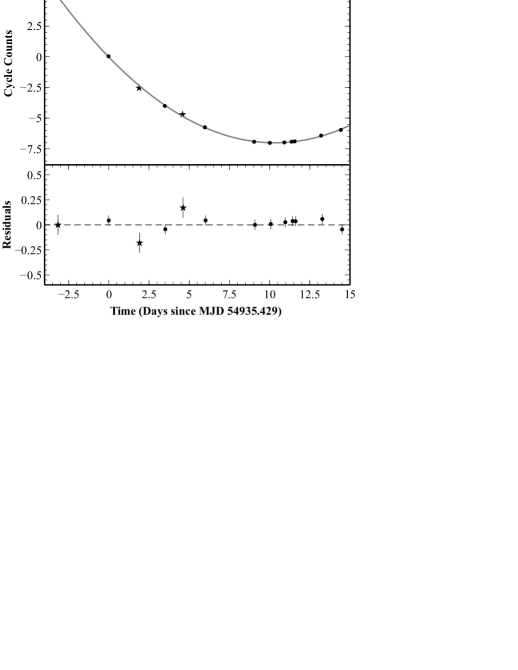
The phase connected pulse arrival times after the binary orbital correction are shown in the top panel of Fig. 1, whereas the residuals after the removal of the quadratic trend are shown in the bottom panel of Fig. 1. From this quadratic trend, spin-up rate is found to be Hz s-1. Reduced chi square of this fit is around 1.07. This suggest that the orbit of the system is circular which was also suggested by Coe et al. (2015). Coe et al. (2015) also found an upper limit of 0.17 to the eccentricity within confidence level. In order to find a further constraint on eccentricity, an elliptical orbital model is fitted to the residuals as suggested by Deeter et al. (1981). This fit gives an upper limit to the eccentricity as 0.028 in level. It should also be noted that the time coverage of pulse arrival times is only 63 percent of orbital period. Full orbital coverage of arrival times is needed to obtain a better constraint on the eccentricity.

SWIFT J0513.4-6547 was also observed seven times in 2014 within a time span of days (see Table 2). As for the 2009 observations, we construct background subtracted 2.51s binned lightcurves from 2014 observations. We construct pulse phase profiles for five of these observations and connect them in phase.
Pulse arrival times are presented in Fig. 2. Among 2014 observations listed in Table 2, no significant pulse detection is obtained from the observation at MJD 56939, and a single pulse arrival time is measured from the observations at MJD 56985 and MJD 56986. The pulse frequency measurement of the timing solution is consistent with the value reported by Sturm et. al. (2014) within one sigma level. Furthermore a spin down rate of Hz s-1 is found during this 70 days time span. Timing solutions of 2009 and 2014 are given in Table 3.
| Parameter | 2009 Solution | 2014 Solution |
|---|---|---|
| Epoch (MJD) | 54935.42866 | 56916.89857 |
| ( Hz) | 3.67020(7) | 3.64432(5) |
| (Hz s |
3.2 Energy-Resolved Pulse Profile


To see if there are any energy dependent changes in the profile, we construct 3–7 keV, 7–10 keV, 10–16.5 keV and 16.5–25 keV pulse profiles. The energy-resolved profiles given in the left panels of Fig. 3 are profiles averaged for RXTEPCA data between MJD 54935–54950. These energy bands are selected according to their average count rates. The source is the strongest in 3–7 keV band with an average count rate of 3.2 cts s-1. Other bands have approximately the same count rates as 1.7 cts s-1 on average.
Energy-resolved power spectra of the same energy bands are also constructed for comparison (see the right panels of Fig. 3). The second harmonic (0.0734 Hz) of the pulse frequency, that indicates the double-peaked structure, is evident on power spectra. In 3–7 keV and 7–10 keV bands, pulse profiles and power spectra are similar. In 10–16.5 keV band, along with a significant drop in the pulsed fraction; the double-peaked structure strengthens. The count rate of the phase between the primary and the secondary peak (indicated with a dashed line in Fig. 3) reaches the same level of the count rate of pulse minimum phase, which is the 0.0 phase. Consequently, the powers of the pulse and its second harmonic are balanced on the 10–16.5 keV power spectrum. The pulse diminishes in the 16.5–25 keV band, although the average count rate is similar to former bands. The powers of pulse and its second harmonic are at the level of noise on the 16.5-25 keV power spectrum.
3.3 Hardness Ratio
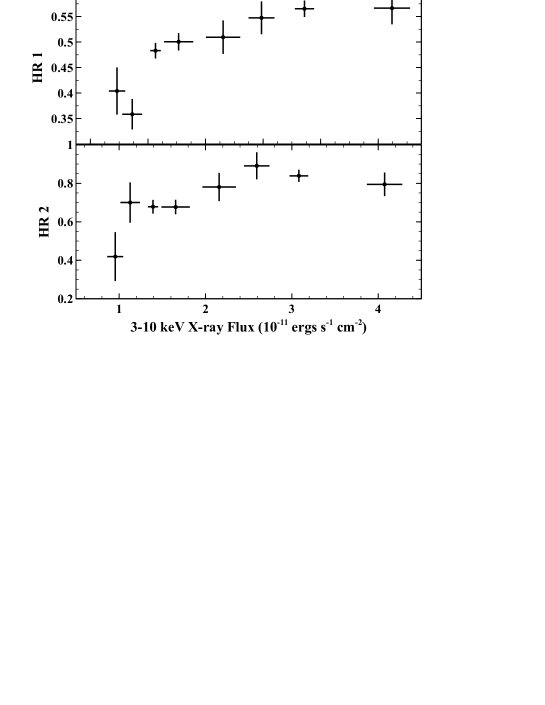

We also examine the lightcurves corresponding to specific energy bands and pulse profiles of SWIFT J0513.4–6547 in the context of hardness ratio. Daily averaged X-ray flux and X-ray luminosity dependences of HR1 (7–10 keV/3–7 keV) and HR2 (10–16.5 keV/7–10 keV) are plotted in Fig. 4.
Hardness ratios in pulse phase are plotted in Fig. 5. The top panel is the average pulse profile in the 3–16.5 keV energy range, which is the combination of pulsed bands in Fig. 3. Hardness ratios HR1 and HR2 are calculated as un-normalized count rate ratios of consecutive bands in Fig. 3. The HR1 reaches its minimum between the double peaks of the pulse. The secondary peak has the hardest ratio, whereas the primary peak has an average HR1 value. For HR2 the hardest phase is the 0.0 phase. A gradual softening is observed until the primary peak, where HR2 starts to increase again.
3.4 Pulsed Fraction

3–16.5 keV pulse profiles of individual RXTEPCA observations are constructed from the count rates of phase-binned
spectra using the tool FBSSUM. Then, the pulsed fractions are calculated with the standard definition
; where and are minimum and maximum counts of the pulse.
In Fig. 6, measured pulsed fractions are plotted as a function of 3–10 keV unabsorbed flux values obtained from the spectral fits. A positive correlation between X-ray flux and pulsed fraction is evident.
4 Spectral Analysis
4.1 Overall Spectrum during 2009
| Swift & RXTE 2009 | ph*po | ph*(bb+po) | ph*po*hi |
|---|---|---|---|
| cm | |||
| [keV] | – | – | |
| [km] | – | – | |
| [keV] | – | – | |
| [keV] | – | – | |
| Flux | |||
| / dof | 1.53/186 | 0.96/184 | 0.96/184 |
| Flux | / dof | |||
|---|---|---|---|---|
| Swift 2009 | 0.98/155 | |||
| Swift 2014 | 0.98/32 |
(a) Radius of the blackbody emitting region calculated from the normalization parameter of
BBODYRAD model, assuming a 50.6 kpc distance to the LMC. (b) Unabsorbed flux values calculated using
CFLUX model for the energy range 0.3–10 keV, in units of erg cms-1.
The 0.3–10 keV SwiftXRT spectrum of SWIFT J0513.4–6547 was previously described by a simple absorbed power law model using the 2009 observations of the source (Krimm et al. 2009, Coe et al. 2015). Our reanalysis of the Swift 2009 spectrum alone gives consistent results, however a trial for a simultaneous fit of SwiftXRT and RXTEPCA data from 2009 showed that this basic model is not enough to fully describe the spectrum of SWIFT J0513.4–6547 (=1.53, see Table 4 for best fit parameters). Energy ranges selected during the simultaneous fit of 12.7 ks XRT and 17.9 ks PCA spectra are 0.3–9.5 keV and 3–16.5 keV respectively. We exclude the energies above 16.5 keV, due to the low statistical significance of the PCA spectral bins. A constant factor is involved in the model, in order to mimic the normalization uncertainty between the two instruments.
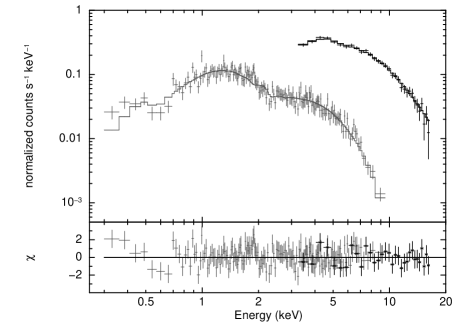
We make an effort to improve the simultaneous spectral fit by including extra model components. We achieve similar
improvements by adding a blackbody component (BBODYRAD) or a high energy cut-off (HIGHECUT). The best fit
plot is given in Fig. 7 and the resulting best fit parameters are listed in Table 4. Both models result in an acceptable (=0.96).
4.2 Individual Spectra of 2009 observations

During 2009, a total of 21 individual observations (18 RXTE and 3 Swift) of SWIFT J0513.4–6547 cover a time
span of about 30 days. We investigate the change of spectral parameters throughout this time by fitting the best fit
model (PHABS*POW*HIGHECUT) to the individual spectra of each observation. The spectra of RXTE observations
which are on the same days are summed for a daily spectrum. SNR of the individual spectra are low due to both low exposure
times ( 1-2 ks) and low count rates, therefore we fix the cut-off model parameters (i.e. and )
to their best fit values given in Table 4. Moreover, the hydrogen column density () is preset to its best
fit value, since we examine that the low along the line of sight does not show any significant change. Therefore we
only evaluate the variability of photon index and unabsorbed flux. 3-10 keV fluxes are measured using the CFLUX
model in XSPEC.
Daily spectral results for 3 XRT and 14 PCA spectra are plotted over observation mid-time in Fig. 8. The upper panel shows the decline of the 2009 outburst of SWIFT J0513.4–6547. For observations after MJD 54955, we are only able to measure an upper limit to the flux. The lower panel of Fig. 8 demonstrates the increase in photon index by decreasing flux. The photon indexes measured from Swift (filled circles) imply a slightly softer spectra when compared to values obtained from RXTE (empty circles), however this might be an instrumental effect due to the different energy bandpass of detectors. In Fig. 8, it is observed that as the flux decreases photon index increases which indicates that softer photons emerge from the source as the X-ray flux reduces.
4.3 Re-brightening in 2014

The 2014 brightening of SWIFT J0513.4–6547 is sparsely monitored by seven pointing Swift observations (each 1 ks) between MJD 56916 and 56986. The overall spectrum produced from 2014 observations provide similar results with Swift 2009 spectrum when described by a simple absorbed power law model (see Table 4). The absorption along the line of sight is estimated just the same with 2009 whereas spectral index appear to be a little higher, with a higher uncertainty due to the statistical quality of the low count spectrum. Nevertheless, the higher photon index in 2014 may also arise from the fact that the average X-ray flux of the source is about 20 per cent of the average 2009 flux, since we observe a flux dependence of the photon index for SWIFT J0513.4–6547 (see Fig. 8). 0.3-10 keV unabsorbed flux measurements of individual Swift observations in 2014 are given in Fig. 9. In this plot, the XMM-Newton measurement on MJD 56894 is also shown (Sturm et al. 2014). Sturm et al. (2014) suggested that the 2014 brightening of SWIFT J0513.4–6547 might be explained by recurrent Type I outbursts, since the detections with XMM-Newton and Swift are close to the time of expected optical maxima. Therefore, we calculate consequent optical maxima using the ephemeris given in Coe et al. (2015) and indicate them with arrows on Fig. 9. It is hard to distinguish whether the brightening is due to a single Type II outburst or a series of Type I outbursts, with the very few data points. One more supporting evidence for the Type I scenario is that, we measure another flux maximum corresponding exactly to the next optical maximum on MJD 56946. Furthermore, using the LMC distance of 50.6 kpc (Bonanos et al. 2011), the peak flux on 2014 correspond to a luminosity of erg s-1 which is about two orders of magnitude lower than the maximum luminosity on 2009. The order of the X-ray luminosity also supports the Type I scenario for the 2014 brightening of SWIFT J0513.4–6547.
4.4 Pulse Phase Resolved Spectra

In order to investigate the variation of spectral parameters with pulse phase, we analyze RXTEPCA observations
between MJD 54935–54950 using the tool FASEBIN. Timing and orbital parameters for SWIFT J0513.4–6547 are appended
into the timing files (i.e. psrtime.dat and psrbin.dat) and 16 phase-binned spectra are constructed for the
analysis. The exposure time of each bin turns out to be 1.1 ks. 3–16.5 keV spectra are modeled with the high energy
cut-off model as described in Section 4.2.
In Fig. 10, 3–10 keV unabsorbed flux and photon index values are plotted over pulse phase. The photon index exceeds its average value 0.93 in some certain phases. The steepest power law with index 1.48 is acquired in-between the double peaks of the pulse, whereas the peaks have lower indexes such as 0.7 and 0.8. The spectral parameters of lowest count rate bins (i.e. phase 0.0 and 0.0625) are not constrained well, an average index is found with a large uncertainty for these phases.
5 Discussion and Conclusion
The X-ray luminosity of 2009 outburst was initially at its peak value of erg s-1 (Coe et al. 2015). It was found to decrease below erg s-1 towards the end of the outburst. The source disappeared for days and then reappeared in 2014 with erg s-1.
Our frequency measurement from 2009 observations which correspond to the final stage of the outburst (see Table 3) complies with the general spin up trend of the initial stage of the outburst presented by Coe at al. (2015). Moreover, it is important to note that the arrival times bolster the Coe et al. (2015) assumption that the orbital and optical periods are the same.
The source is found to be spinning up with a rate of Hz s-1 during the final stage of the outburst of the 2009 outburst. Comparison with the values found for the initial stages of the 2009 outburst (Hz s-1, Coe et al. 2015) suggests that the spin rate of the source is correlated with the X-ray luminosity.
On the other hand, from Table 3, it is also found that the long-term ( days long) average spin-down rate of the source during the quiescence between 2009 and 2014 is Hz s-1 which is about two order higher than the rate measured during the re-brightening on 2014. This shows that, when the X-ray luminosity of the source increased in 2014, its spin-down rate is found to be smaller (i.e. spin rate value becomes greater).
Thus, whether the source spins up or spins down, its spin rate increases with the X-ray flux. Qualitatively, this trend suggests in general that the source spin rate is correlated with the X-ray luminosity. Observations from future outbursts of the source will be useful to better understand the spin rate X-ray luminosity relation of the source.
It is important to note that the long-term spin-down rate of Hz s-1 corresponds to a state where the source is quiescent. Although this spin-down rate is comparable to the long-term spin-down rates of persistent accretion powered X-ray pulsars such as GX 1+4 (Gonzales-Galan et al. 2012), it is not typical within the quiescent states of the transient sources. Although some transient sources are either found to be spinning up or spinning down in their quiescent states in between outbursts (e.g. GS 0834-430, A 0535+262, see Bildsten et al. 1997), only a few of them such as SXP 7.78 (Klus et al. 2014) exhibits long-term ( days long) quiescent states for which the spin-down rates have the same order of magnitude.
If we assume that the neutron star is in propeller state throughout the whole quiescent time interval, magnetic dipole ( where B is the surface dipole magnetic field and R is the radius of the neutron star) can be estimated (Alpar 2001) as
| (1) |
where is the moment of inertia, is the spin rate, is the mass and is the frequency of the neutron star. Using Equation 1, for a neutron star of mass , moment of inertia of g cm2 and a radius of cm, surface dipole magnetic field is estimated to be Gauss which is in good agreement with the magnetic field estimation by Coe et al. (2015) during the accretion phase using spin-up rate luminosity relation.
We confirm that SWIFT J0513.4–6547 has a circular orbit by refining the upper limit for the orbital eccentricity as 0.028 in confidence level. Although many of the Be/X-ray pulsar binary systems (especially the ones that have transient nature) have eccentric orbits, some of the transient Be/X-ray pulsar systems such as KS 1947+300 (Negueruela et al. 2003), 4U 1901+03 (Liu et al. 2003) , 2S 1553-542 (Kelley et al. 1983) and RX J0520.5-6932 (Kuehnel et al. 2014) have orbits with small eccentricities.
As seen in Fig. 3, it is evident that the pulse profile of SWIFT J0513.4–6547 is double-peaked. The count rate of one peak significantly exceeds the other, which we might call the primary peak. Regardless of the energy band, the peaks have similar phase coverage, where the mid-point between primary and secondary peaks is at phase.
As seen in Fig. 4, hardness ratios of the source correlates with the X-ray luminosity when 3-10 keV unabsorbed flux values are less than ergs cm-2 s-1, while for higher flux values hardness ratios remain constant. With an assumed source distance of 50.6 kpc, the flux value separating the correlating hardness values and constant hardness values corresponds to a luminosity of erg s-1. Postnov et. al. (2015) found similar hardness ratio dependence on X-ray luminosity in six transient X-ray pulsars (EXO 2030+375,GX 304-1, 4U 0115+63, V 0332+63, A 0535+26 and MXB 0656-072). Postnov et al. (2015) explains this ”saturation” behaviour of the hardness ratio as a result of surpassing a critical value that leads to an increase in the height of the accretion so that the contribution of the reflected component to the total emission starts decreasing. But their corresponding critical luminosity is nearly one order higher than our value, being erg s-1.
Maximum value of the pulse fraction obtained from 3-16.5 keV RXTEPCA observations (see Fig. 6) is which is consistent with the previously reported value (Krimm et al. 2009). In Fig. 6, the pulsed fraction shows a clear correlation with the source flux, given that higher fractions are observed for higher flux. For higher accretion rates, the material pressure of the accreting mass allows the plasma to move in and induces a closer interaction between the plasma and the magnetosphere. Consequently, increased efficiency of accretion onto the magnetic poles results in a higher pulsed fraction.
We found that overall SwiftXRT and RXTEPCA spectrum of SWIFT J0513.4–6547 is well described with either a power law model with a high energy cut-off at keV or a model consisting of a black body peaking at keV and a power law. For the overall spectrum, both of these models fit equally well.
If the model consisting of a blackbody component is considered; not only a quite high value of blackbody temperature ( keV), but also the unusually high value of blackbody emitting radius ( km) makes the model not favorable. Usually such high kT’s are observed in the spectra of low luminosity ( erg s-1) accreting X-ray pulsars, although there might be exceptions such as SAX J 2103.5+4545 and SWIFT J045106.8-694803 with a source luminosity and black body kT of the order of those of SWIFT J0513.4–6547 (Bartlett et al. 2013; İnam et al. 2004a). Moreover the fraction of blackbody flux contributing to the 0.3-10 keV flux is rather low as about 30 per cent of the unabsorbed flux. On the other hand, if the model including a power law with high energy cut-off is considered, high energy cut-off is a usual spectral feature that is observed in many of the HMXBs. Even if the cut-off energy keV measured for SWIFT J0513.4–6547 is at the lowest end of the range of energies measured for other sources (e.g. for 4U 1626–67 keV, see Coburn et al. 2002), we still prefer to represent the individual spectra with this model.
From Fig. 8, there is a marginal evidence that the decrease in X-ray flux leads to a softening of the X-ray spectrum. Similar spectral dependence which might be an indication of accretion geometry changes due to mass accretion rate variations was also found for the X-ray pulsars SAX J2103.5+4545 (Baykal et al. 2002), 2S 1417-62 (İnam et al. 2004b), XMMU J054134.7-682550 (İnam et al. 2009), Her X-1 (Klochkov et al. 2011) and SWIFT J1626.6-5156 (İcdem, İnam and Baykal 2011).
We also studied pulse phase resolved spectra of the source using RXTEPCA observations of 2009. As seen from Fig. 10, the peaks have similar photon index values of . However, the midpoint between primary and secondary peaks at phase has a steeper (softer) spectrum with a power law index of 1.48. The softening for this phase is also evident in HR1 hardness ratio shown in Fig. 5. The hardness ratio involving higher energy bands (i.e. HR2) reveals that the spectrum of the primary peak is softer than that of the secondary peak. This may be due to the fact that the higher energy bands have less count rates, so even modest variations in these energy bands do not affect the power law indices significantly.
Acknowledgment
We acknowledge support from TÜBİTAK, the Scientific and Technological Research Council of Turkey through the research projects TBAG 109T748 and MFAG 114F345.
References
- [1] Alpar, M. A., 2001, ApJ, 554, 1245
- [2] Bartlett, E. S.; Coe, M. J.; Ho, W. C. G. 2013, MNRAS, 436, 2054
- [3] Baykal, A.; Stark, M. J.; Swank, J. H. 2002, ApJ, 569, 903
- [4] Bildsten, L. et al. 1997, ApJS, 113, 367
- [5] Bonanos, A.Z.; Castro, N.; Macri, L.M.; Kudritzki, R. 2011, ApJL, 729, 9
- [6] Burrows, D. N.; Hil, J. E.; Nouse, J. A. et al. 2005, Space Sci. Rev., 120, 165
- [7] Cash, W. 1979, ApJ, 228, 939
- [8] Coburn, W.; Heindl, W. A.; Rothschild, R. E. et al. 2002, ApJ, 580, 394
- [9] Coe, M. J.; Finger, M.; Bartlett, E. S.; Udalski, A. 2015, MNRAS, 447,1630
- [10] Coe, M. J.; Udalski, A.; Finger, M. 2013, ATel, 5511
- [11] Corbet, R. H. D. 1984, A&A, 141, 91
- [12] Deeter, J. E., Boynton, P. E., Pravdo, S. H., 1981, ApJ, 247, 1003
- [13] Deeter J. E., Boynton P. E., 1985, in Hayakawa S., Nagase F., eds, Proc. Inuyama Workshop: Timing Studies of X-Ray Sources. Nagoya Univ., Nagoya, p. 29
- [14] Finger, M. H., Beklen, E. 2009, ATel 2023
- [15] Gonzalez-Galan, A., Kuulkers, E., Kretschmar, P., Larsson, S., Postnov, K., Kochetkova, A., Finger, M. H., 2012, A& A, 537, 66
- [16] İçdem, B.; İnam, S.Ç.; Baykal A., 2011, MNRAS, 415, 1523
- [17] İnam, S.Ç.; Baykal, A.; Swank, J.; Stark, M. J. 2004a, ApJ, 616, 463
- [18] İnam, S.Ç.; Baykal A., Scott D. M., Finger M., Swank J., 2004b, MNRAS, 349, 173
- [19] İnam, S.Ç.; Townsend L. J., McBride V. A., Baykal A., Coe M. J., Corbet R. H. D., 2009, MNRAS, 395, 1662
- [20] Jahoda, K.; Swank, J. H.; Giles, A. B. et al. 1996, Proc. SPIE, 2808, 59
- [21] Kelley, R. L.; Rappaport, S.; Ayasli, S. 1983, ApJ, 274, 765
- [22] Klochkov D., Santangelo A., Staubert R., Rothschild R. E., 2011, in Proc. 8th INTEGRAL Workshop, The Restless Gamma-Ray Universe, PoS(INTEGRAL 2010)061 (arXiv:1105.3547)
- [23] Klus, H.; Ho, W. C. G.; Coe, M. J.; Corbet, R. H. D.; Townsend, L. J. 2014, MNRAS, 437, 3863
- [24] Krimm, H. A.; Corbet, R. H. D.; Evans, P. A. et al. 2009, ATel 2011
- [25] Krimm, H. A.; Holland, S. T.; Corbet, R. H. D. et al. 2013, ApJS, 209, 14
- [26] Kuehnel, M.; Finger, M. H.; Fuerst, F.; Pottschmidt, K.; Haberl, F.; Wilms, J. 2014, ATel, 5856
- [27] Liu, Q. Z.; van Paradijs, J.; & van den Heuvel, E. P. J. 2006, A& A, 455, 1165
- [28] Negueruela, I.; Israel G. L., Marco, A.; Norton, A. J.; Speziali, R. 2003, A& A, 397, 739
- [29] Postnov, K.A.; Gornostaev, M.I.; Klochkov, D.; Laplace, E.; Lukin, V.V.; Shakura, N.I. 2015, arXiv:1506.07082 [astro-ph.HE]
- [30] Stella, L.; White, N. E.; Rosner R. 1986, ApJ, 308, 669
- [31] Sturm, R.; Carpano, S.; Haberl, F.; Maggi P.; Vasilopoulos, G. 2014, ATel 6483