Metastability effects in strained and stressed SrTiO3 films
Abstract
The sequence of ground states for SrTiO3 film subjected to epitaxial strain as well as to mechanical stress along the [001] and [110] axes is calculated from first principles within the density functional theory. Under the fixed-strain boundary conditions, an increase in the lattice parameter of a substrate results in the (II) sequence of ground states. Under the fixed-stress boundary conditions, the phase sequence is different and depends on how the stress is applied. It is revealed that the simultaneous presence of competing ferroelectric and antiferrodistortive instabilities in SrTiO3 gives rise to the appearance of metastable phases, whose number increases dramatically under the fixed-stress conditions. In the metastable phases, the octahedral rotation patterns are shown to differ substantially from those in the ground state. It is suggested that in systems with competing instabilities, each polar phase has its optimal octahedral rotation pattern which stabilizes this phase and creates a potential barrier preventing this phase to be transformed into other structures.
pacs:
61.50.Ah, 61.50.Ks, 64.60.My, 77.80.bn, 77.84.CgI Introduction
Elastic strain is widely used today to improve the properties of electronic materials. For example, the effect of the strain-induced decrease of the acceptor binding energy in germanium enabled to create unique photodetectors working in the far infrared. Rogalski (2011) An increase of the electron mobility in strained silicon enabled to considerably improve the performance of silicon field-effect transistors, Maiti et al. (2001) and the use of highly strained layers in pseudomorphic high electron mobility transistors made it possible to deliberately tune the energy diagrams of these heterostructures in order to significantly improve their characteristics. Ross et al. (1996)
The appearance of a strain-induced ferroelectricity in different dielectrics significantly extends the functionality of these materials and enables to offer new, previously known designs of electronic devices. The strain of incipient ferroelectrics leads to particularly impressive results. Pertsev et al. (2000); Haeni et al. (2004); Fennie and Rabe (2006); Eliseev et al. (2007); Akbarzadeh et al. (2007); Warusawithana et al. (2009); Morozovska et al. (2013) For example, the stretching of thin films of strontium titanate SrTiO3 grown on DyScO3 substrates increases the Curie temperature in this material, which is nonpolar in the absence of strain, to 300 K, Haeni et al. (2004) and the compression of these films grown on silicon substrates increases this temperature up to 410 K (Ref. Warusawithana et al., 2009).
Strontium titanate is an incipient ferroelectric exhibiting a competition between the ferroelectric and antiferrodistortive (octahedral rotational) instabilities. Zhong and Vanderbilt (1995) The latter of them is the cause of the phase transition observed in SrTiO3 at about 105 K. The first work in which the influence of strain on the ferroelectric properties of strontium titanate was considered within the phenomenological approach was the work of Uwe and Sakudo. Uwe and Sakudo (1976) Pertsev et al. Pertsev et al. (2000) have developed this approach to describe the effect of the epitaxial strain on SrTiO3 thin films. By expanding the thermodynamic potential in a power series of two order parameters (polarization and octahedral rotation) to the fourth order, the authors obtained a rich pressure–temperature phase diagram with a large number of different phases. For the set of material constants of SrTiO3 used by the authors, all obtained solutions had the order parameters directed along the axes of the cubic structure. Subsequent first-principles calculations in which the antiferrodistortive instability was neglected, Antons et al. (2005); Diéguez et al. (2005); Hashimoto et al. (2005) however, have shown that in stretched SrTiO3 films the polarization should be directed along the [110] axis, in agreement with the experimental data. Vasudevarao et al. (2006); Li et al. (2006) A more thorough first-principles study of the low-temperature phases of SrTiO3, in which both ferroelectric and antiferrodistortive instabilities were taken into account, Lin et al. (2006) showed that in highly stretched SrTiO3 films the polarization is indeed directed along the [110] axis, but at low strain a phase with the [100] polarization appears. This orientation of the polarization was observed later in anisotropically strained SrTiO3 films grown on GdScO3 and DyScO3 substrates. Vasudevarao et al. (2008); Biegalski et al. (2009) The phase diagrams of strained SrTiO3 for other sets of material constants were studied within the phenomenological and the phase-field approaches in Refs. Li et al., 2006; Shirokov et al., 2009; Sheng et al., 2010a, b.
When studying the strain effects on the properties of different materials, the fixed-strain boundary conditions are usually used. However, the study of the fixed-stress boundary conditions is also important for real systems. To explain this, let’s consider a thin epitaxial film which has domain structure and is fixed on a substrate. If the substrate is incompressible, then the in-plane lattice parameters in these domains would be equal to the lattice parameter of the substrate. However, in real systems the lattice parameters in the domains will be different because the substrate is compressible, and the difference between them will increase with increasing film thickness. In the limit of highly compressible (flexible) substrate, if one neglects mechanical and electrical boundary conditions at the domain walls, we come to the fixed-stress boundary conditions. In practice, the fixed-strain boundary conditions can be realized in ultrathin epitaxial films, whereas the fixed biaxial stress boundary conditions can be realized in films grown on flexible substrates or thin plates which are fixed at their edges on a set of piezoelectric actuators. The actual boundary conditions in real systems are intermediate between the two limiting cases, and this is why the analysis of both cases is necessary when studying the strain effects.
In this work, we consider the ferroelectric and antiferrodistortive instabilities in SrTiO3 under the fixed-stress boundary conditions and compare them with the results obtained for the fixed-strain boundary conditions. Two different ways of applying stress to the film are examined: a uniaxial stress normal to the film plane and a biaxial stress in the film plane. We show that these two ways of applying stress result in different phase diagrams. We demonstrate that the simultaneous presence of competing ferroelectric and antiferrodistortive instabilities in SrTiO3 gives rise to the appearance of previously unknown metastable phases, whose number increases dramatically under the fixed-stress conditions, and explain the origin of the metastability.
II Calculation technique
Elastic deformation of SrTiO3 films was realized in two ways. To create the fixed-strain boundary conditions, the (001)-oriented film was grown on a cubic substrate with the lattice parameter , which was varied within 2% of the lattice parameter of cubic strontium titanate. To create the fixed-stress boundary conditions, the stress was applied along the axis normal to the film plane (the pressure is ) or in the plane (the pressure is ). The film was considered free to relax in directions normal to the applied stress or strain.
Calculations of the equilibrium lattice parameters and atomic positions in films were performed within the first-principles density functional theory using the ABINIT software. The exchange-correlation interaction was described in the local density approximation (LDA). The pseudopotentials of atoms constructed using the RKKJ scheme Rappe et al. (1990) were borrowed from Ref. Lebedev, 2009. The plane-wave cutoff energy was 30 Ha (816 eV), the accuracy of self-consistent energy calculations was better than Ha. For the integration over the Brillouin zone, a 888 Monkhorst-Pack mesh for the cubic cell or meshes with equivalent density of -points for low-symmetry phases were used. The relaxation of atomic positions and lattice parameters was performed until the forces acting on the atoms become less than Ha/Bohr (0.1 meV/Å). Near the boundaries between the phases, the accuracy of the relaxation was increased to Ha/Bohr.
As the energy difference between some phases in this work can be as small as 0.1 meV, the accuracy and convergence of calculations are very important issues. Insufficient -point density, parallel shift of all atoms in the unit cell, and different sets of -points for different structures are the main sources of errors. The convergence studies have shown that an increase of the -point density by a factor of three changes the energies of phases by no more than 0.02 meV. More important errors may result from a parallel shift of all atoms in the unit cell. The standard deviation of the energy of phases calculated for 20 different random parallel shifts was equal to 0.028 meV and was independent of the -point density. As to the third source of errors, in most calculations we used the same sets of the -points when performing the integration over the Brillouin zone, but the tests have shown that the changes in the energy of phases calculated for different sets of -points do not exceed 0.03 meV. The errors in the enthalpy calculations resulting from variations of the unit cell volume and local stresses were less than 0.003 meV. So, the accuracy of our calculations enables to reliably distinguish the energy difference of 0.1 meV.
In searching for the ground state, after the relaxation of a structure of each relevant phase for each value of applied stress or strain, the phonon spectrum and the elastic tensor were calculated and it was checked whether all optical phonon frequencies at all high-symmetry points of the Brillouin zone are positive and whether the determinant and all leading principal minors constructed from components of the elastic tensor are positive (the stability criterion). If the criterion is not satisfied, small distortions corresponding to the least stable phonon were added to the structure, and the search for the ground state was continued. The technique of phonon spectra and elastic tensor calculations was similar to that described in Ref. Lebedev, 2009. We considered only monodomain states because domain walls usually have a positive energy and so the multidomain solutions have a higher energy.
III Results
The phonon spectrum calculations for the high-temperature phase of SrTiO3 confirmed a well-known result that there are three types of instabilities in the phonon spectrum: the ferroelectric one associated with the mode at the center of the Brillouin zone and two antiferrodistortive instabilities with respect to rotations of the oxygen octahedra described by and modes at the boundary of the Brillouin zone. LaSota et al. (1997); Lebedev (2009) Since the instability is weak and disappears when the mode at the point is condensed, we will neglect it when searching for the ground state. The calculations showed that in the absence of strain, the ground-state structure of strontium titanate is the phase. Lebedev (2009)
III.1 Fixed-strain boundary conditions
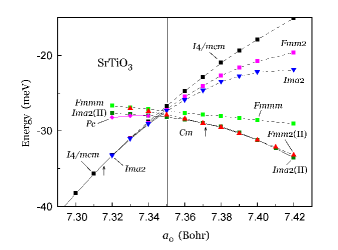
To better understand the influence of the fixed-stress boundary conditions on the phase diagrams, we first consider the phase diagrams for SrTiO3 films grown on a cubic substrate (the fixed-strain boundary conditions). Our calculations (Fig. 1) show that the sequence of the ground states [(II)(II)] in this case is unexpectedly complex. The transition between the and phases occurs at Bohr and is not shown in the figure (see Table A1 in the Appendix). At Bohr, the phase becomes unstable and transforms to the phase, in which the octahedra are rotated around the [001] pseudocubic axis, whereas the polarization is along the [110] one (Table 1). For all strains, this phase has a lower energy as compared to the phase in which the rotations are around the same axis, but the polarization is along the [100] axis. The transition between the and phases occurs at Bohr and is a first-order transition (the molar volumes of the two phases differ by 0.75% at the transition point). Near the phase transition point, the phase can be regarded as a slightly distorted (II) phase,111This is proven by an instability of the phonon spectra of (II) and (II) phases at 7.35–7.37 Bohr. For example, in the (II) phase, the eigenvector of unstable phonon at the point at 7.36–7.37 Bohr includes, in addition to polar displacements, the octahedral rotations around the axis perpendicular to the polarization, whereas at Bohr, the unstable phonon is at the boundary of the Brillouin zone and describes the in-phase octahedral rotations around the axis (similar to those described by the phonon in the cubic phase). The frequencies of these phonons are 10 cm-1. but the polarization vector quickly rotates in the plane from the [110] to [100] direction with increasing , and already at Bohr the (II) phase becomes the ground state. At 7.39–7.40 Bohr, the energy of the (II) phase turns out to be slightly lower than that of the (II) phase (by approximately 0.1 meV, see Table A1 in the Appendix for the energies of the phases). It is interesting that both phases with the lowest energy [(II) and (II)] in this region satisfy the stability criterion (i.e., the former of them is stable and the latter is metastable), so that in this region the phases with polarizations along the [110] and [100] pseudocubic axes can coexist. This, in particular, enables to explain why two different orientations of polarization have been observed in two different experiments Li et al. (2006); Biegalski et al. (2009) on SrTiO3 films grown on DyScO3 substrates and to understand the sensitivity of polarization to the anisotropic strain of the substrate. At Bohr, the (II) phase becomes the ground state.
| Space group | Order parameter |
|---|---|
| , | |
| , | |
| (II) | , |
| (II) | |
| (III) | , |
III.2 Fixed-stress boundary conditions
Under the fixed-stress boundary conditions, the sequence of the ground states resulting from compression or stretching of the film is different for two ways of applying stress. This follows from the difference between the equations used to calculate the enthalpy. At , the enthalpy is calculated using the formula , where is the total energy, is the pressure, is the unit cell volume, and is the strain tensor component (in Voigt notation) normal to the film. At , the enthalpy is , where and are the strain tensor components in the film plane.
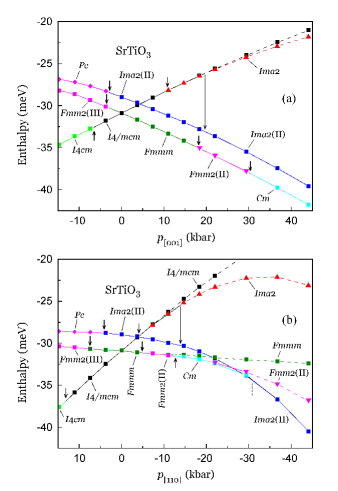
When the stress is applied, the symmetry of the high-temperature phase is lowered to tetragonal phase. As for the low-temperature phase, the formation of two structures differing by the direction of octahedral rotation axis is possible under stress. Because of a noticeable spontaneous strain accompanying the octahedral rotations in the unit cell, the resulting phase has a lower enthalpy for biaxially compressed films and the phase has a lower enthalpy for biaxially stretched films (Fig. 2). In this work, a positive sign of the applied stress means the compression and a negative one means the tension. Since the compression of the film along the axis results in its expansion in the plane, to facilitate the comparison of results for two ways of applying stress, we used two opposite directions of the horizontal axis in Fig. 2. The in-plane strain of the film at a maximum pressure ( kbar) is 2.13% for and 1.85% for .
The existence region of the phase on the phase diagram depicted in Fig. 2 is limited by the softening of the ferroelectric mode (under the in-plane compression) and of the ferroelectric mode (under the in-plane stretching). When crossing the boundaries of the existence region (shown by short vertical arrows in Fig. 2), the frequencies of corresponding modes become imaginary, and the symmetry of the unit cell is lowered, respectively, to and .222Since the mode is doubly degenerate, to find the ground state resulting from the ferroelectric instability of the phase we have to consider two structures described by two-component (, 0) and (, ) order parameters and to choose among them the structure with a lower enthalpy. Of the two possible solutions with space groups and , the phase had a lower enthalpy. The same applies to the phase, in which the softening of the mode upon the in-plane compression results in the appearance of the (III) phase polarized along the axis, and the softening of the mode upon the in-plane stretching results in the appearance of the (II) phase polarized along the axis (we assume that in both cases the octahedral rotations are around the axis). We note that for two ways of applying stress we are discussing, the values at which the phase transitions occur are very different. For example, for the – phase transition the transition pressures are kbar and kbar.
While there is only one – phase transition in the in-plane compressed SrTiO3 films, the sequence of the ground states in stretched films is much more complex. The calculations of the phonon spectra of the phase show that with increasing in-plane stretching not only the polar mode is softened, but also the polar mode is softened. At a pressure of kbar or kbar, the former mode results in the transition to the (II) phase polarized along the axis. With further increase of pressure (at 12.7 kbar or +30.3 kbar, respectively), the mode induces the transition to the phase, in which the polarization is rotated in the plane. For the in-plane stretching, the phase transforms to the (II) phase at 30 kbar [see Fig 2(b) and enthalpies of different phases in Table A2 in the Appendix]. In the case of the out-of-plane compression, the phase remains the ground state up to at least 45 kbar [Fig. 2(a)].
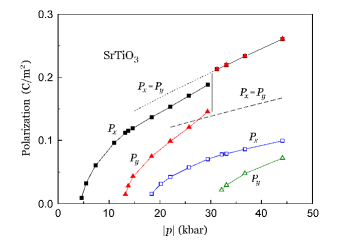
The pressure dependence of two components of spontaneous polarization for both ways of applying stress is shown in Fig. 3. The changes in polarization upon the (II) and (II) phase transitions and the fact that the polarization abruptly changes from the state in the phase to the state characteristic of the (II) phase are clearly seen. From the comparison of the polarizations for two ways of applying stress it follows that the polarization is about 2.5 times higher for biaxial stretching than for uniaxial compression, whereas the phase sequence is the same. The reason for this is simple: the term in the enthalpy makes larger in-plane strains more favorable under . As the in-plane polarization strongly increases with increasing tensile strain , the polarization in biaxially stretched films is considerably higher than that in uniaxially compressed films. Under the compression, the polarization in (II) and phases is much lower than that in the metastable (II) phase because the rotation around the [100] axis strongly reduces the values.
III.3 Hysteresis and metastability effects
An analysis of the stress dependence of the soft-mode frequencies in the ground states of SrTiO3 for the fixed-stress boundary conditions (Fig. 4) reveals a number of previously known features. First, the pressures, at which the extrapolated squares of the soft-mode frequencies vanish on both sides of the – phase transition, differ by 0.76 kbar for (hysteresis loops are not shown in the figure). For , the difference between these pressures is more significant, 1.88 kbar. This means that in both cases the – phase transition is of the first order. Similar phenomena are observed for the –(II) phase transition (the hysteresis region width is 0.48 kbar for and 0.41 kbar for ) and for the (II)– phase transition (the hysteresis region width is 0.39 kbar for and 0.62 kbar for ).
The most unusual phase transition in Fig. 4 is the (II) one which is observed in biaxially stretched films. As follows from Fig. 3, an abrupt change in polarization at this transition is an evidence of the first-order phase transition. This conclusion is consistent with the absence of any critical phonon mode softening on both sides of this transition (Fig. 4). Interestingly, that at pressures below the transition pressure, both structures [ and (II)] satisfy the stability criterion, which means that the (II) phase with a higher enthalpy is metastable at these pressures. We attribute the transition under discussion to a “sliding off” of the structure, which occurs when the enthalpy of the (II) phase becomes lower than that of the phase: thanks to the closeness of structures, the height of the potential barrier separating them is low.
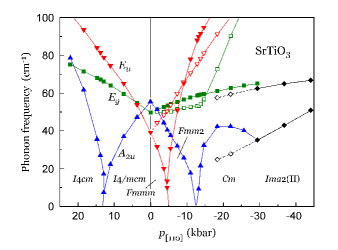
It is interesting to also consider the chain of phase transitions occurring on a branch starting from the phase which is metastable at tensile stresses (Fig. 2).333In principle, these phases can be prepared by cooling the film under compressive stress and after then by changing the sign of stress. The calculations of the phonon spectra for the phase show that not only the mode is softened with increasing tensile stress, but also the mode is softened, and after the phase transition to the phase at 4.1 kbar it splits into two components (Fig. 5). At 13.8 kbar, the frequency of one of its components vanishes. Adding of the distortions corresponding to this unstable mode to the structure causes its relaxation into a phase which has the same space group, but a different octahedral rotations pattern. This is already familiar to us the (II) phase, which was obtained earlier upon stretching the film along the (II)(II) chain. As the mode originates from the mode of cubic SrTiO3, the cause of the phase transition at 13.8 kbar is the antiferrodistortive instability, which results in a change of the octahedral rotation axis direction from one normal to the film plane in the phase to one along the polar [110] pseudocubic axis in the (II) phase. It is unusual here that upon the relaxation, the structure transforms through an intermediate phase into the metastable (II) phase, rather than into the ground-state structure [the phase according to Fig. 2(b)].
Similar phenomena are observed in uniaxially stressed SrTiO3 films at kbar [Fig. 2(a)]. The structure, which becomes unstable above this pressure, also relaxes into the metastable (II) phase rather than into the ground-state structure [(II) or ].
The metastability effects are also characteristic of the (II) phase at 15–37 kbar and at (11–22) kbar (Fig. 3).
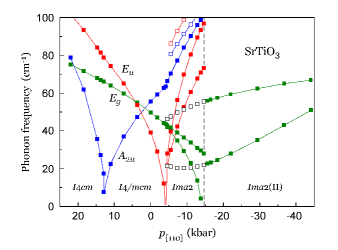
The behavior of the soft mode frequency in the (II) phase when changing the in-plane tensile stress is also interesting. As follows from Fig. 5, at the isostructural –(II) phase transition, the majority of modes abruptly change their frequencies (dashed lines in the figure), whereas the frequency of the soft mode does not vanish when approaching to the phase boundary from the (II) phase. This means that this phase transition is of the first order. This conclusion is also confirmed by the ability to preserve the stability of the (II) phase when gradually decreasing tensile stress (open symbols in Fig. 5). Thus, in the pressure range from 4.1 to 13.8 kbar, a hysteresis region occurs on the considered branch of the phase diagram.444The stability of the metastable (II) phase is retained up to a pressure of +4.1 kbar, above which it transforms to the phase. In this region, both and (II) phases satisfy the stability criterion, which means, if one takes into account the enthalpies of these phases [Fig. 2(b)], that both phases are metastable. The unusual property of the (II) chain of transformations is that the phase transition at kbar occurs from a nonpolar to a metastable polar phase, which transforms into another isostructural metastable polar phase with increasing stress (at 13.8 kbar).
The properties of polar phases coexisting in the hysteresis region differ significantly. At kbar, the values of spontaneous polarization are 0.128 C/m2 in the phase, 0.182 C/m2 in the (II) phase, and 0.096 C/m2 in the ground-state (II) phase. The band gaps calculated in the LDA approximation are 1.795 eV in the (II) phase, 1.825 eV in the phase, and 1.861 eV in the (II) phase.
IV Discussion
IV.1 Phase diagrams of strained and stressed SrTiO3 films
IV.1.1 Strained SrTiO3 films
To start, we compare the phase diagrams obtained in this work for SrTiO3 film grown on a cubic substrate (the fixed-strain boundary conditions) with the results of previous investigations.
At compressive strain, the results of this paper and previous works Pertsev et al. (2000); Li et al. (2006); Lin et al. (2006) are in good agreement and differ only in the strain values at which the – phase transition occurs. This is not surprising if we take into account the difference in the sets of material constants used in phenomenological models and the difference in the calculation techniques and schemes of the pseudopotential construction used in first-principles calculations. The difference in the values, at which the extrapolated squares of the soft-mode frequencies vanish at two sides of this phase transition, was found to be only 0.00024 Bohr in our calculations, which indicates that the transition is close to the second-order one.
At tensile strain, the results of our and previous calculations are much more different. In the phenomenological model, Pertsev et al. (2000) in stretched films at all strains the polarization is directed along the 100 pseudocubic axis, so that our solutions , (II), and are absent. In the phenomenological model Li et al. (2006) it was shown that the and (II) solutions appear at low values of the coefficient for the () term, and the phase is stable only in a narrow region of negative strains. Both these phases disappear with increasing (the solution obtained in this case agrees with that of Ref. Pertsev et al., 2000), and the phase does not appear at all. The optimal value of the coefficient for which the predictions of the phenomenological model are closest to the experiment was found in Ref. Sheng et al., 2010a. In the phase-field model Sheng et al. (2010b) at the phase is absent, and it is not clear whether the solution at high strains can be associated with our (II) phase. Our results also differ from those of the phenomenological model, Shirokov et al. (2009) in which its own set of material constants was used. According to Ref. Shirokov et al., 2009, when the lattice parameter is increased, the ground-state structures change as follows: (II)(II), whereas our calculations predict the sequence (II)(II) and that the and phases never become the ground-state structures. As for the comparison with the results of first-principles calculations that took into account both order parameters, Lin et al. (2006) in the cited work the existence regions of the and (II) phases are separated by an intermediate (II) phase. In our calculations, the sequence of the ground-state structures for stretched films differs from the data of Ref. Lin et al., 2006 in that the transition between the and phases occurs abruptly, and the (II) phase is the ground-state structure only in a narrow region separating the and (II) phases (Fig. 1).
IV.1.2 Stressed SrTiO3 films
We now consider the differences between the phase diagrams obtained under the fixed-stress boundary conditions for two ways of applying stress and the phase diagrams obtained above under the fixed-strain conditions.
In biaxially compressed film (), the transition pressures of the – and – phase transitions are close to the values of internal stress at the transition points in films grown on a cubic substrate (with a maximum deviation of 0.3–0.6 kbar). In contrast, at the biaxial stretching, the phase diagrams differ much stronger [compare Fig. 1 and Fig. 2(b)]. This is because under tension, the (II), , and (II) phases (in which spontaneous strains caused by polarization and octahedral rotations lie in the film plane) become energetically more favorable. At low stresses, a configuration in which the two components of spontaneous strain are perpendicular to each other is the most favorable, and at high stresses, a configuration in which the spontaneous strains are parallel to each other and are directed along the [110] pseudocubic axis is the most favorable. Due to an additional contribution to the enthalpy proportional to (where a “two-dimensional” elastic compliance is the sum of elastic compliance tensor components in Voigt notation), the phase with the highest is characterized by the strongest decrease of the enthalpy with increasing stress, and so it is asymptotically the most stable. In our case, this is the (II) phase.
Under uniaxial tension (), the phases in which the spontaneous strain is directed along the axis (under tension) or those in which the spontaneous strain lies in the film plane (under compression) should be more energetically favorable. However, we should note that the condition for the occurrence of a phase transition under uniaxial stress differ significantly from the condition for the case of biaxial stress. For example, the lattice parameter at which the – phase transition occurs in SrTiO3 is 7.2785 Bohr for and 7.3018 Bohr for . This reduces the transition pressure into the phase and strongly increases the transition pressures into the (II) and phases. As an additional contribution to the enthalpy for is proportional to , in this case asymptotically the most stable phase is that with the highest value. This phase is also the (II) phase, but because the transition pressure into this phase under uniaxial compression is sufficiently high (85 kbar), this phase does not become the ground state in the pressure range considered in this work [Fig. 2(a)].
As we have seen, the transition from the fixed-strain to the fixed-stress boundary conditions causes a change in the order of phase transitions: they become the first-order ones, and the width of the corresponding hysteresis regions depend on the way of applying stress. We attribute the change in the order of phase transitions to a well-known renormalization of the coefficients of the fourth-order terms in the Landau expansion produced by electrostriction, which results in that the second-order phase transitions can become the first-order ones. The fact that the lattice parameters (as well as the atomic positions) near the phase transition points are significantly different for two ways of applying stress enables to explain why the width of the hysteresis regions near these points depends on how the stress is applied. It is important to note that the mere fact of appearance of the first-order phase transitions in SrTiO3 means that the phenomenological description of its properties should take into account at least the sixth-order terms in the power series expansion of the thermodynamic potential.
IV.2 The nature of metastability effects
The most interesting result of this work is the observation of metastable phases and phase transitions between them in strained and stressed SrTiO3 films. We believe that the appearance of these phenomena is due to competing instabilities in this material.
Indeed, these phenomena were absent in the first-principles calculations in which the octahedral rotations were neglected. Antons et al. (2005); Diéguez et al. (2005); Hashimoto et al. (2005) These calculations predicted the second-order phase transition in biaxially compressed films and the second-order one in biaxially tensile films. According to our calculations, in which octahedral rotations were neglected, at the most stable phase is , Lebedev (2009) and the biaxial strain transforms it via an intermediate phase, respectively, to the phase (at Bohr) or to the phase (at Bohr).555The appearance of a gap between the and polar phases is typical of calculations in which the theoretical lattice parameter of cubic SrTiO3 was 7.27–7.285 Bohr. Antons et al. (2005); Diéguez et al. (2005); Hashimoto et al. (2005) In Ref. King-Smith and Vanderbilt, 1994, where Bohr, the lowest-energy phase at was already the phase. The pseudopotentials and calculation technique used in this work give a value of Bohr, which is closest to the experiment ( Bohr at 300 K). This effect is obviously associated with an effective pressure that exists in all LDA calculations (with underestimated lattice parameter) and influences the ferroelectric instability. No signs of metastability were observed in these calculations.
When both ferroelectric and antiferrodistortive instabilities in SrTiO3 are taken into account, the metastability appears already under the fixed-strain boundary conditions. It is observed in the (II) and (II) phases at 7.39–7.40 Bohr and in the phase, to which an unstable (II) phase relaxes at 7.32–7.34 Bohr upon condensation of two unstable phonons at the center and at the boundary of the Brillouin zone (the energy of the phase is significantly higher than that of the ground-state or phases, Fig. 1). The signs of metastability can also be observed in the region 7.35–7.37 Bohr where two different solutions with the symmetry and different orientation of the polarization, which both satisfy the stability criterion, appear as a result of relaxation of unstable (II) and (II) phases.
A particularly large number of metastable phases appears in SrTiO3 under the fixed-stress boundary conditions. Under these conditions, the majority of phases, which were simply unstable under fixed-strain conditions, become metastable (in Fig. 2 the points corresponding to these phases are connected by solid lines). An analysis shows that the octahedral rotation patterns in metastable phases are strongly different from those in the ground states. For example, for the phase, which is metastable under tensile stress, the transition to the ground state requires to change the direction of the octahedral rotation axis from [001] to [110], and for the and phases, which are metastable under compressive stress, the transition requires to change the direction from [11] to [001] and from [010] to [001], respectively. This suggests that each polar phase has its optimal octahedral rotation pattern which stabilizes this phase and creates a potential barrier preventing this phase to be easily transformed into another structure. Such a transformation needs to simultaneously shift a large number of the oxygen atoms involved in the octahedral rotations and to change the lattice parameters, so that the appearance of metastability is closely related to the antiferrodistortive instability. The height of the potential barrier separating the and (II) phases (which can be transformed into each other via an intermediate phase) is 24 meV per formula unit at kbar. The weakening of the metastability effects in films grown on cubic substrates, in which spontaneous strain cannot be fully realized, confirms this explanation. Nevertheless, the competition of the local distortions accompanying the appearance of polarization and octahedral rotations can be observed even in epitaxial films.
It should be noted that the metastability effects revealed in SrTiO3 films are qualitatively different from the effects typical for first-order phase transitions. In the latter case, the metastability appears in the hysteresis region where two phases described by different values of the same order parameter fulfill the stability criterion and so can coexist. In SrTiO3, the metastability effects are due to a complex interaction between the polarization and the rotational order parameter via a striction mechanism. This explains why the obtained solutions turn out to be very sensitive to the mechanical boundary conditions.
The consequence of the metastability effects in systems with competing instabilities is the impossibility, in certain situations, to establish whether the obtained solution is the ground-state structure of a system, or just a metastable state. As shown in this work, the approach used in most first-principles investigations of phase transitions (according to which the ground state is searched by a successive approaching to the structure that satisfies the stability criterion) often results only in the metastable states. The ground state in these systems can be found only after exploring the entire phase diagram and all transitions between the phases. This analysis, however, can be facilitated by studying the phase diagrams under the fixed-strain boundary conditions.
It can be seen that the existence of metastable phenomena in SrTiO3 results in the appearance of bistability regions on the phase diagrams, in which stable and one or more metastable polar phases coexist. Let us discuss one interesting possibility of using this bistability. The phase sequence obtained on the –– branch in stretched SrTiO3 films [Fig. 2(b)] enables to offer one more possible application of such films in non-volatile phase change memory devices. Indeed, by applying a specific sequence of stresses when cooling the film, a homogeneous metastable state in the hysteresis region (the phase) can be prepared in it. Then, the regions of equilibrium [(II), ] or the other metastable [(II)] phases can be formed on the film surface by the local optical heating. Due to the bistability of the system, both phases can coexist at low temperatures for a long enough time, and a contrast in their optical properties can be used for nondestructive read-out of recorded information. Erasing of information can be easily realized by heating the film at zero stress.
The sequences of the ground states in SrTiO3 films obtained in this work as a function of applied strain and stress correspond to the case of . At higher temperatures, the phase diagrams may become more complex because of the appearance of domain-like structures. Such a structure, which consisted of thick 90∘ domain walls, was revealed in a first-principles-based effective Hamiltonian molecular dynamics study of BaTiO3 films subjected to tensile strain in a wide temperature range below the Curie temperature. Grünebohm et al. (2015) In unstrained BaTiO3, the existence region of this multidomain state coincided with that of the orthorhombic phase in bulk BaTiO3. However, it remains unclear whether this multidomain structure is a real (static) one or just a correlated thermal motion of atoms because the presented data were averaged over a very short (4 ps) time interval. The existence of competing instabilities in SrTiO3 can complicate its domain structure. Its complex dynamic behavior and the metastability effects revealed in this work can result in enhanced loss tangent usually observed in ferroelectric phases because they both exhibit a retarded reaction to an applied electric field.
V Conclusions
The first-principles calculations of the phase diagrams of strained and stressed SrTiO3 films have revealed a number of previously unknown metastability effects which manifest themselves as coexistence of several phases all satisfying the stability criterion. These effects become particularly noticeable under the fixed-stress boundary conditions. It was shown that the cause of these effects is the existence of competing instabilities in this material. This suggests that similar phenomena may occur in other ferroelectrics with competing instabilities such as NaNbO3 and BiFeO3.
The metastability effects are also important for understanding the phenomenon of antiferroelectricity because competing instabilities are very typical for antiferroelectric materials such as PbZrO3. In particular, the electric-field-induced polar phase in PbZrO3 is in fact a metastable phase, in which the octahedral rotation pattern differs from that in the ground-state nonpolar structure.
As for the results specific for SrTiO3, it is clear that the phenomenological
description of its properties needs to take into account the higher-order terms
in the Landau expansion, and so the results of previous studies within this
approach require a further examination.
Acknowledgements.
The work was supported by Russian Foundation for Basic Research grant No. 13-02-00724.*
Appendix A Supplemental material
The energies and enthalpies of different phases calculated for a given strain or stress are compared in Tables A1 and A2. The optimized lattice parameters and atomic positions for all structures considered in this work are given in Tables A3 to A12.
| Phases | ||||||||
|---|---|---|---|---|---|---|---|---|
| (Bohr) | (II) | (II) | ||||||
| 7.16 | 93.03 | 95.72 | — | — | — | — | — | — |
| 7.20 | 73.46 | 74.53 | — | — | — | — | — | — |
| 7.22 | 64.97 | 65.53 | — | — | — | — | — | — |
| 7.24 | 57.19 | 57.47 | — | — | — | — | — | — |
| 7.26 | 50.17 | 50.28 | — | — | — | — | — | — |
| 7.27 | 46.95 | 46.97 | — | — | — | — | — | — |
| 7.275 | 45.40 | 45.43 | — | — | — | — | — | — |
| 7.28 | 43.91 | — | — | — | — | — | — | — |
| 7.29 | 41.01 | — | — | — | — | — | — | — |
| 7.30 | 38.28 | — | — | — | — | — | — | — |
| 7.31 | 35.70 | — | — | — | — | — | — | — |
| 7.315 | 34.45 | — | — | — | — | — | — | — |
| 7.32 | 33.24 | — | 26.67 | 33.26 | 33.23 | 27.67 | — | 28.21 |
| 7.33 | 30.94 | — | 26.89 | 31.07 | 30.99 | 27.81 | — | 28.03 |
| 7.34 | 28.76 | — | 27.12 | 29.09 | 28.96 | 27.96 | 27.40 | 28.00 |
| 7.345 | 27.71 | — | 27.24 | 28.19 | 28.01 | 28.03 | 27.63 | 28.05 |
| 7.35 | 26.69 | — | 27.36 | 27.37 | 27.12 | 28.17 | 27.87 | 28.17 |
| 7.36 | 24.71 | — | 27.61 | 25.89 | 25.47 | 28.48 | 28.39 | 28.49 |
| 7.37 | 22.86 | — | 27.86 | 24.65 | 24.04 | 28.97 | 28.99 | 29.04 |
| 7.38 | 20.98 | — | 28.02 | 23.49 | 22.65 | 29.44 | 29.51 | 29.54 |
| 7.39 | 19.38 | — | 28.30 | 22.77 | 21.62 | 30.25 | 30.33 | — |
| 7.40 | 17.87 | — | 28.58 | 22.22 | 20.77 | 31.21 | 31.21 | — |
| 7.42 | 15.05 | — | 29.07 | 21.91 | 19.61 | 33.55 | 33.19 | — |
| 7.44 | 12.59 | — | 29.56 | 22.53 | 19.29 | 36.65 | 35.56 | — |
| Phases | ||||||||
|---|---|---|---|---|---|---|---|---|
| (kbar) | (II) | (II) | ||||||
| 44.13 | — | — | 23.08 | 40.48 | — | 32.40 | 36.86 | — |
| 36.78 | — | — | 22.09 | 36.67 | — | 32.15 | 34.88 | — |
| 29.42 | — | 19.36 | 22.21 | 33.86 | — | 31.96 | 33.42 | 33.80 |
| 22.07 | — | 21.95 | 23.26 | 31.79 | — | 31.70 | 32.33 | 32.41 |
| 18.39 | — | 23.28 | 24.11 | 30.98 | — | 31.53 | 31.90 | 31.91 |
| 14.71 | — | 24.72 | 25.15 | 30.34 | — | 31.39 | 31.55111Response function calculations indicate an instability of this phase against its transformation into the phase. | 31.54 |
| 11.03 | — | 26.30 | 26.48 | 29.95 | — | 31.39 | 31.45 | — |
| 7.36 | — | 27.76 | 27.81 | 29.53 | 29.11 | 31.21 | 31.24 | — |
| 5.52 | — | 28.52 | 28.54 | 29.37 | 29.07 | 31.10 | 31.12 | — |
| 4.60 | — | 28.91 | 28.91 | 29.28 | 29.05 | 31.06 | 31.08 | — |
| 3.68 | — | 29.30 | — | 29.22 | 29.02 | 31.02 | — | — |
| 0.0 | — | 30.88 | — | 28.97 | 28.92 | 30.88 | — | — |
| 3.68 | — | 32.45 | — | 28.80 | — | 30.81 | — | — |
| 7.36 | — | 34.12 | — | 28.70 | — | 30.67 | — | — |
| 11.03 | — | 35.86 | — | 28.59 | — | 30.47 | — | — |
| 14.71 | 37.69 | 37.63 | — | 28.50 | — | 30.35 | — | — |
| Bohr, Bohr | ||||
|---|---|---|---|---|
| Atom | WP | |||
| Sr | 0.000000 | 0.500000 | 0.250000 | |
| Ti | 0.000000 | 0.000000 | 0.000000 | |
| O | 0.000000 | 0.000000 | 0.250000 | |
| O | 0.214346 | 0.714346 | 0.000000 | |
| Bohr, Bohr | ||||
|---|---|---|---|---|
| Atom | WP | |||
| Sr | 0.500000 | 0.000000 | 0.253951 | |
| Ti | 0.000000 | 0.000000 | 0.008361 | |
| O | 0.000000 | 0.000000 | 0.249368 | |
| O | 0.207733 | 0.707733 | 0.000840 | |
| Bohr, Bohr | ||||
|---|---|---|---|---|
| Atom | WP | |||
| Sr | 0.000000 | 0.250507 | 0.000000 | |
| Ti | 0.250000 | 0.000000 | 0.250000 | |
| O | 0.000000 | 0.000000 | 0.216530 | |
| O | 0.250000 | 0.250000 | 0.250000 | |
| O | 0.283971 | 0.000000 | 0.000000 | |
| Bohr, Bohr | ||||
|---|---|---|---|---|
| Atom | WP | |||
| Sr | 0.006484 | 0.000000 | 0.249962 | |
| Ti | 0.258024 | 0.249145 | 0.000000 | |
| O | 0.000988 | 0.281480 | 0.000000 | |
| O | 0.218214 | 0.000000 | 0.000000 | |
| O | 0.219248 | 0.000000 | 0.000000 | |
| O | 0.246996 | 0.250000 | 0.250000 | |
| Bohr, Bohr | ||||
|---|---|---|---|---|
| Atom | WP | |||
| Sr | 0.006027 | 0.250548 | 0.000000 | |
| Ti | 0.258045 | 0.000000 | 0.250988 | |
| O | 0.499078 | 0.000000 | 0.283937 | |
| O | 0.247904 | 0.250000 | 0.250000 | |
| O | 0.283166 | 0.000000 | 0.000000 | |
| O | 0.285274 | 0.000000 | 0.000000 | |
| Bohr, Bohr | ||||
|---|---|---|---|---|
| Atom | WP | |||
| Sr | 0.511582 | 0.000000 | 0.000000 | |
| Ti | 0.014611 | 0.001526 | 0.250000 | |
| O | 0.004529 | 0.000000 | 0.000000 | |
| O | 0.717532 | 0.218809 | 0.250000 | |
| O | 0.219196 | 0.717984 | 0.250000 | |
| Bohr, Bohr | ||||
|---|---|---|---|---|
| Atom | WP | |||
| Sr | 0.510431 | 0.001862 | 0.250000 | |
| Ti | 0.012530 | 0.000000 | 0.000000 | |
| O | 0.497252 | 0.547074 | 0.250000 | |
| O | 0.250394 | 0.249830 | 0.024560 | |
| Bohr, Bohr111The translation vectors are [100], [110], and [001]. | ||||
|---|---|---|---|---|
| Atom | WP | |||
| Sr | 0.504500 | 0.503322 | 0.000000 | |
| Sr | 0.505691 | 0.000127 | 0.000000 | |
| Ti | 0.005456 | 0.002834 | 0.250500 | |
| O | 0.029421 | 0.454223 | 0.000000 | |
| O | 0.029241 | 0.043574 | 0.000000 | |
| O | 0.001801 | 0.248585 | 0.280345 | |
| O | 0.501557 | 0.248085 | 0.734216 | |
| Bohr, Bohr, | ||||
|---|---|---|---|---|
| Bohr | ||||
| Atom | WP | |||
| Sr | 0.000000 | 0.249575 | 0.001152 | |
| Ti | 0.249152 | 0.000000 | 0.252941 | |
| O | 0.000000 | 0.000000 | 0.210624 | |
| O | 0.000000 | 0.000000 | 0.279767 | |
| O | 0.250000 | 0.250000 | 0.244342 | |
| O | 0.284337 | 0.000000 | 0.004654 | |
| Bohr, Bohr, | ||||
|---|---|---|---|---|
| Bohr, | ||||
| Atom | WP | |||
| Sr | 0.507791 | 0.252513 | 0.255092 | |
| Sr | 0.497563 | 0.247451 | 0.755063 | |
| Ti | 0.002976 | 0.248822 | 0.007148 | |
| Ti | 0.002331 | 0.251203 | 0.507150 | |
| O | 0.001328 | 0.204662 | 0.249255 | |
| O | 0.004428 | 0.295355 | 0.749257 | |
| O | 0.244962 | 0.007996 | 0.024935 | |
| O | 0.760337 | 0.507554 | 0.475052 | |
| O | 0.738300 | 0.491565 | 0.022296 | |
| O | 0.255419 | 0.007896 | 0.522307 | |
References
- Rogalski (2011) A. Rogalski, Infrared Detectors (2nd Edition) (CRC Press, Taylor and Francis Group, 2011).
- Maiti et al. (2001) C. K. Maiti, N. B. Chakrabarti, and S. K. Ray, eds., Strained Silicon Heterostructures: Materials and Devices (The Institution of Electrical Engineers, London, UK, 2001).
- Ross et al. (1996) R. L. Ross, S. P. Svensson, and P. Lugli, eds., Psudomorphic HEMT Technology and Applications (Kluwer Academic Publishers, Dordrecht, The Netherlands, 1996).
- Pertsev et al. (2000) N. A. Pertsev, A. K. Tagantsev, and N. Setter, Phys. Rev. B 61, R825 (2000).
- Haeni et al. (2004) J. H. Haeni, P. Irvin, W. Chang, R. Uecker, P. Reiche, Y. L. Li, S. Choudhury, W. Tian, M. E. Hawley, B. Craigo, A. K. Tagantsev, X. Q. Pan, S. K. Streiffer, L. Q. Chen, S. W. Kirchoefer, J. Levy, and D. G. Schlom, Nature 430, 758 (2004).
- Fennie and Rabe (2006) C. J. Fennie and K. M. Rabe, Phys. Rev. Lett. 97, 267602 (2006).
- Eliseev et al. (2007) E. A. Eliseev, M. D. Glinchuk, and A. N. Morozovska, Phys. Stat. Solidi B 244, 3660 (2007).
- Akbarzadeh et al. (2007) A. R. Akbarzadeh, L. Bellaiche, J. Iñiguez, and D. Vanderbilt, Appl. Phys. Lett. 90, 242918 (2007).
- Warusawithana et al. (2009) M. P. Warusawithana, C. Cen, C. R. Sleasman, J. C. Woicik, Y. Li, L. F. Kourkoutis, J. A. Klug, H. Li, P. Ryan, L.-P. Wang, M. Bedzyk, D. A. Muller, L.-Q. Chen, J. Levy, and D. G. Schlom, Science 324, 367 (2009).
- Morozovska et al. (2013) A. N. Morozovska, Y. Gu, V. V. Khist, M. D. Glinchuk, L.-Q. Chen, V. Gopalan, and E. A. Eliseev, Phys. Rev. B 87, 134102 (2013).
- Zhong and Vanderbilt (1995) W. Zhong and D. Vanderbilt, Phys. Rev. Lett. 74, 2587 (1995).
- Uwe and Sakudo (1976) H. Uwe and T. Sakudo, Phys. Rev. B 13, 271 (1976).
- Antons et al. (2005) A. Antons, J. B. Neaton, K. M. Rabe, and D. Vanderbilt, Phys. Rev. B 71, 024102 (2005).
- Diéguez et al. (2005) O. Diéguez, K. M. Rabe, and D. Vanderbilt, Phys. Rev. B 72, 144101 (2005).
- Hashimoto et al. (2005) T. Hashimoto, T. Nishimatsu, H. Mizuseki, Y. Kawazoe, A. Sasaki, and Y. Ikeda, Jap. J. Appl. Phys. 44, 7134 (2005).
- Vasudevarao et al. (2006) A. Vasudevarao, A. Kumar, L. Tian, J. H. Haeni, Y. L. Li, C.-J. Eklund, Q. X. Jia, R. Uecker, P. Reiche, K. M. Rabe, L. Q. Chen, D. G. Schlom, and V. Gopalan, Phys. Rev. Lett. 97, 257602 (2006).
- Li et al. (2006) Y. L. Li, S. Choudhury, J. H. Haeni, M. D. Biegalski, A. Vasudevarao, A. Sharan, H. Z. Ma, J. Levy, V. Gopalan, S. Trolier-McKinstry, D. G. Schlom, Q. X. Jia, and L. Q. Chen, Phys. Rev. B 73, 184112 (2006).
- Lin et al. (2006) C.-H. Lin, C.-M. Huang, and G. Y. Guo, J. Appl. Phys. 100, 084104 (2006).
- Vasudevarao et al. (2008) A. Vasudevarao, S. Denev, M. D. Biegalski, Y. Li, L.-Q. Chen, S. Trolier-McKinstry, D. G. Schlom, and V. Gopalan, Appl. Phys. Lett. 92, 192902 (2008).
- Biegalski et al. (2009) M. D. Biegalski, E. Vlahos, G. Sheng, Y. L. Li, M. Bernhagen, P. Reiche, R. Uecker, S. K. Streiffer, L. Q. Chen, V. Gopalan, D. G. Schlom, and S. Trolier-McKinstry, Phys. Rev. B 79, 224117 (2009).
- Shirokov et al. (2009) V. B. Shirokov, Y. I. Yuzyuk, and V. V. Lemanov, Phys. Solid State 51, 1025 (2009).
- Sheng et al. (2010a) G. Sheng, Y. L. Li, J. X. Zhang, S. Choudhury, Q. X. Jia, V. Gopalan, D. G. Schlom, Z. K. Liu, and L. Q. Chen, Appl. Phys. Lett. 96, 232902 (2010a).
- Sheng et al. (2010b) G. Sheng, Y. L. Li, J. X. Zhang, S. Choudhury, Q. X. Jia, V. Gopalan, D. G. Schlom, Z. K. Liu, and L. Q. Chen, J. Appl. Phys. 108, 084113 (2010b).
- Rappe et al. (1990) A. M. Rappe, K. M. Rabe, E. Kaxiras, and J. D. Joannopoulos, Phys. Rev. B 41, 1227 (1990).
- Lebedev (2009) A. I. Lebedev, Phys. Solid State 51, 362 (2009).
- LaSota et al. (1997) C. LaSota, C.-Z. Wang, R. Yu, and H. Krakauer, Ferroelectrics 194, 109 (1997).
- Note (1) This is proven by an instability of the phonon spectra of (II) and (II) phases at 7.35–7.37 Bohr. For example, in the (II) phase, the eigenvector of unstable phonon at the point at 7.36–7.37 Bohr includes, in addition to polar displacements, the octahedral rotations around the axis perpendicular to the polarization, whereas at Bohr, the unstable phonon is at the boundary of the Brillouin zone and describes the in-phase octahedral rotations around the axis (similar to those described by the phonon in the cubic phase). The frequencies of these phonons are 10 cm-1.
- Note (2) Since the mode is doubly degenerate, to find the ground state resulting from the ferroelectric instability of the phase we have to consider two structures described by two-component (, 0) and (, ) order parameters and to choose among them the structure with a lower enthalpy. Of the two possible solutions with space groups and , the phase had a lower enthalpy.
- Note (3) In principle, these phases can be prepared by cooling the film under compressive stress and after then by changing the sign of stress.
- Note (4) The stability of the metastable (II) phase is retained up to a pressure of +4.1 kbar, above which it transforms to the phase.
- Note (5) The appearance of a gap between the and polar phases is typical of calculations in which the theoretical lattice parameter of cubic SrTiO3 was 7.27–7.285 Bohr. Antons et al. (2005); Diéguez et al. (2005); Hashimoto et al. (2005) In Ref. \rev@citealpnumPhysRevB.49.5828, where Bohr, the lowest-energy phase at was already the phase. The pseudopotentials and calculation technique used in this work give a value of Bohr, which is closest to the experiment ( Bohr at 300 K). This effect is obviously associated with an effective pressure that exists in all LDA calculations (with underestimated lattice parameter) and influences the ferroelectric instability.
- Grünebohm et al. (2015) A. Grünebohm, M. Marathe, and C. Ederer, Appl. Phys. Lett. 107, 102901 (2015).
- King-Smith and Vanderbilt (1994) R. D. King-Smith and D. Vanderbilt, Phys. Rev. B 49, 5828 (1994).