Stay Awhile and Listen: User Interactions in a Crowdsourced Platform Offering Emotional Support
Abstract
Internet and online-based social systems are rising as the dominant mode of communication in society. However, the public or semi-private environment under which most online communications operate under do not make them suitable channels for speaking with others about personal or emotional problems. This has led to the emergence of online platforms for emotional support offering free, anonymous, and confidential conversations with live listeners. Yet very little is known about the way these platforms are utilized, and if their features and design foster strong user engagement. This paper explores the utilization and the interaction features of hundreds of thousands of users on 7 Cups of Tea, a leading online platform offering online emotional support. It dissects the user’s activity levels, the patterns by which they engage in conversation with each other, and uses machine learning methods to find factors promoting engagement. The study may be the first to measure activities and interactions in a large-scale online social system that fosters peer-to-peer emotional support.
I Introduction and Motivation
Internet and online-based social platforms encompassing online social networks such as Facebook, LinkedIn, and Twitter and messaging services like Snapchat and Kik are rising as the dominant way people in society communicate with each other. On these platforms, users are surrounded by ‘friends’ or ‘colleagues’ who may happy to help a person presently going through a period of emotional distress. Yet the public or semi-public nature of these platforms as well as the permanency of their communication records mean they are less than ideal mediums to seek and receive emotional support. There is therefore a need for online social systems that offer private, anonymous, quick, and live emotional support for those who prefer to communicate online and need immediate help [1, 2]. Existing systems for this purpose vary in regards to the type of support offered, from generic advice for common emotional conditions111http://www.stress.org/emotional-and-social-support, to offering self-diagnosis for a condition [3]. Some systems also offer access to a live therapist when a user is suffering from a specific condition, such as suicide contemplation222http://www.crisischat.org, http://www.befrienders.org or after receiving a critical health prognoses333http://www.cancersupportcommunity.org [4, 5, 6]. Past studies of online systems connecting users to a live listener confirm their effectiveness [7], however they are limited to only helping those that suffer from a particular ailment.
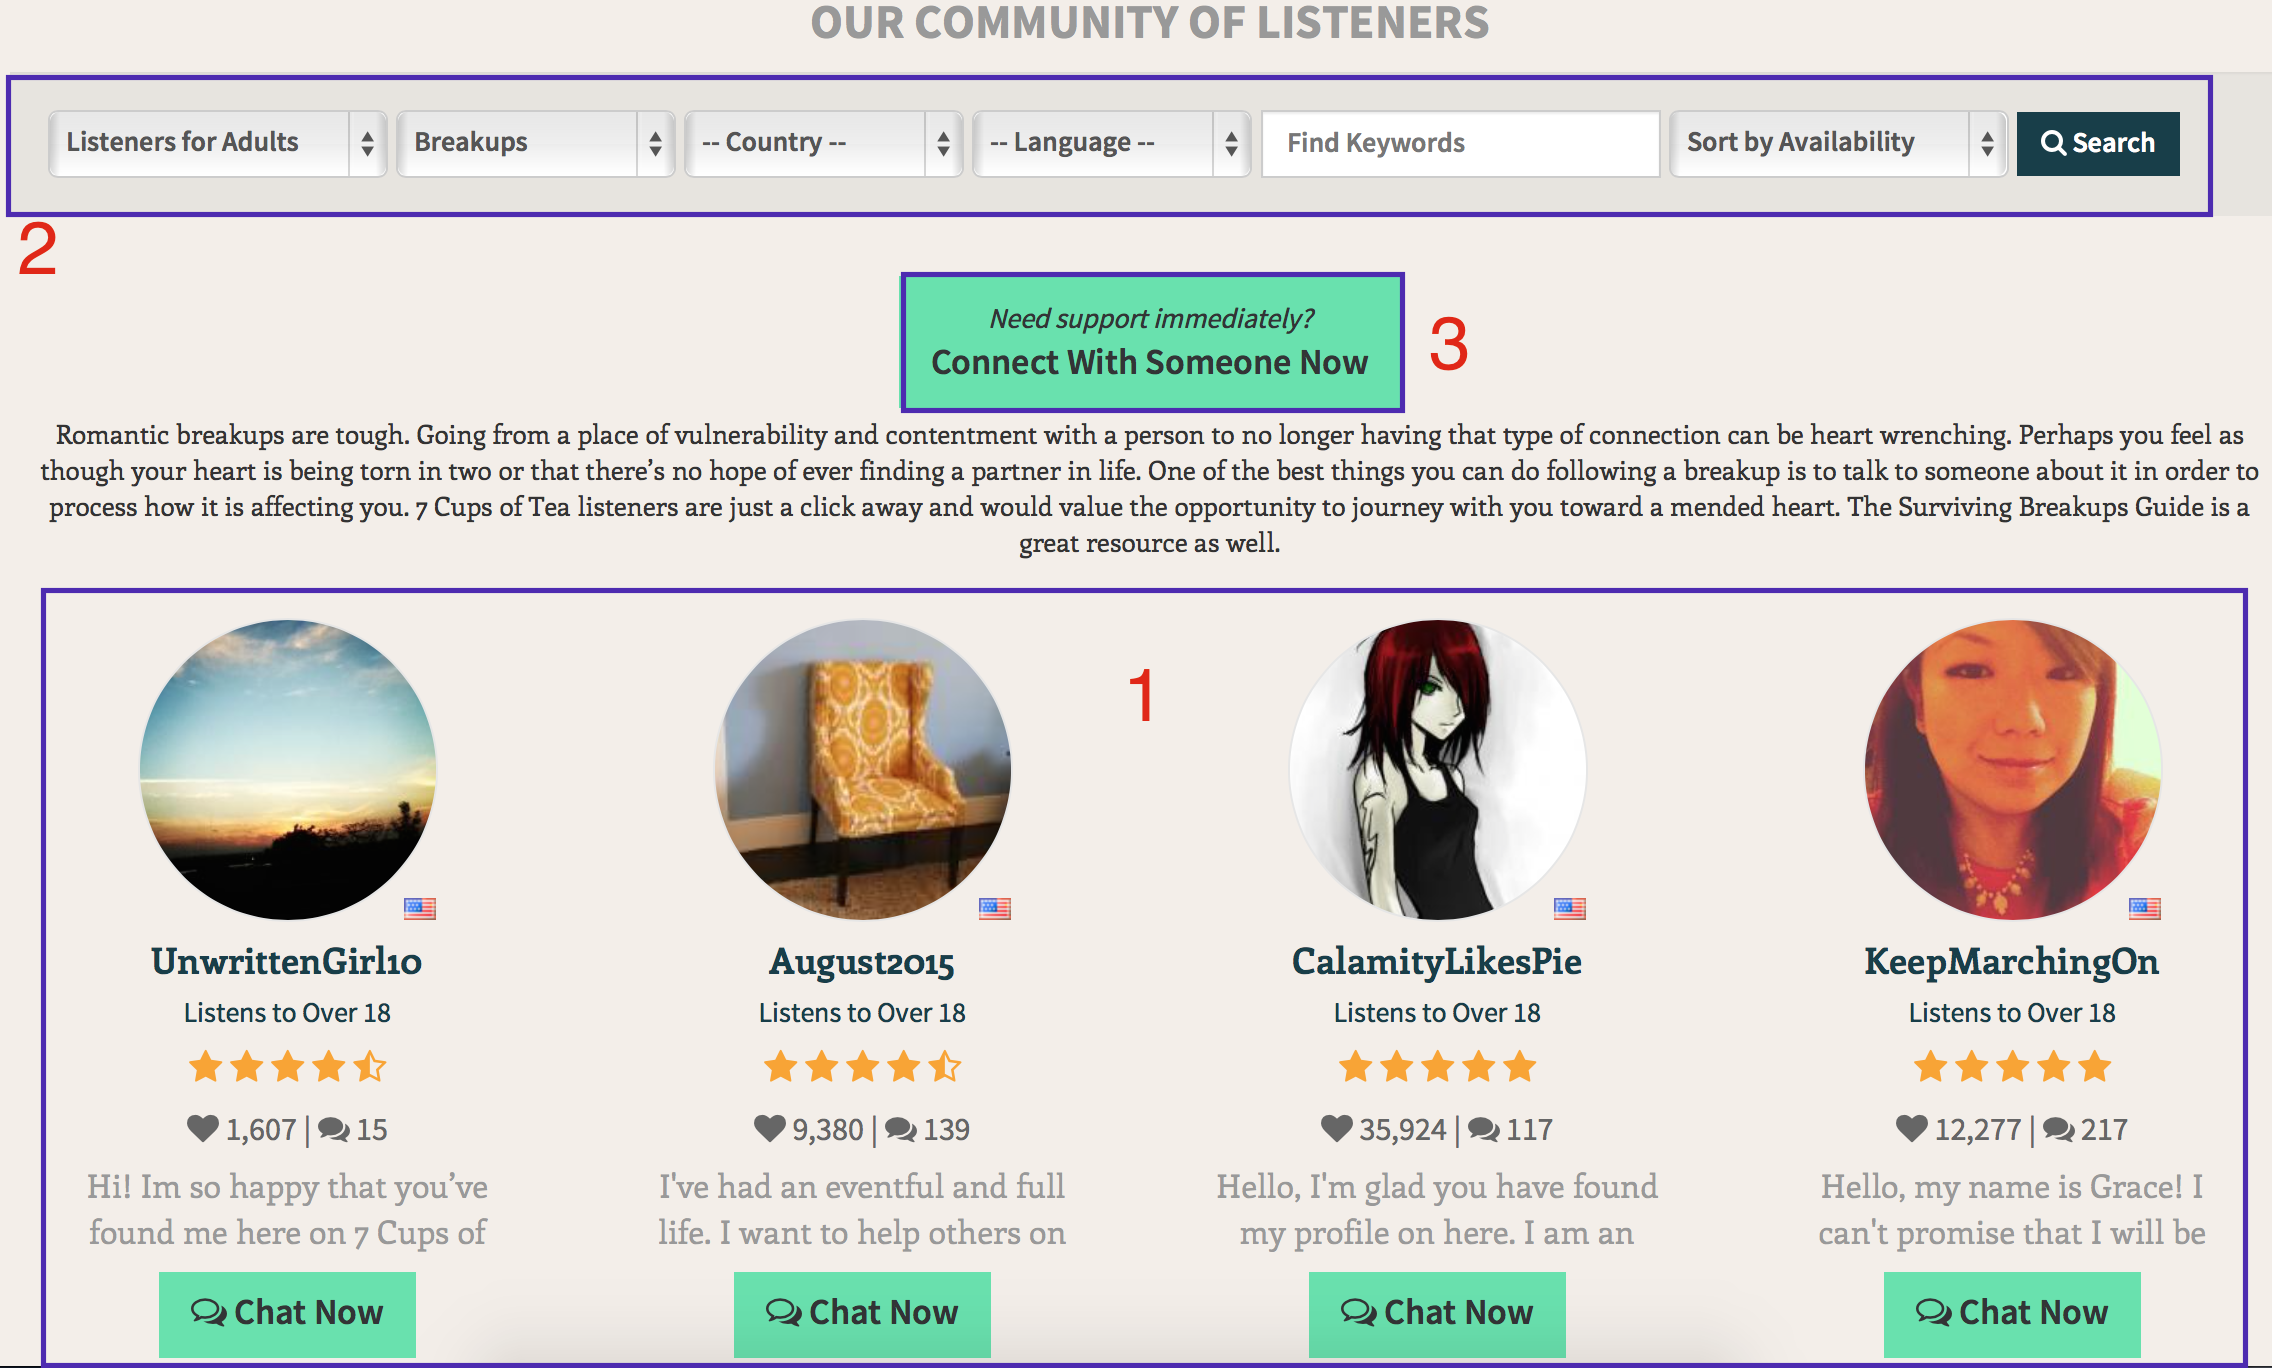
In order to provide a safe, anonymous space for users to find emotional support for problems of any size, the online social system 7 Cups of Tea444http://www.7cupsoftea.com (7cot) was developed. As seen in Figure 1, 7cot fosters an active community or crowd of “listeners” who are individuals trained to support people facing a wide range of emotional problems. People needing emotional support may use the service to immediately and privately engage in one-on-one conversations with listeners or connect to themed group chat rooms. In less than two years, 7cot has attracted a community of hundreds of thousands of members and fostered millions of one-on-one conversations. Its rapid growth suggests a significant demand for creating online spaces where users can find and offer emotional support.
Beyond our knowledge that therapeutic support can be effectively delivered online [7], we know very little about how online emotional support platforms are utilized by users, the mechanisms with which users connect to listeners, and the design choices that encourage long-term user engagement. This paper therefore studies the utilization, interactions, and engagement of users on 7cot. It specifically explores: (i) the degree to which activities are performed by different types of users; (ii) the interaction structure of member-to-listener conversations and the relationships among members (listeners) connecting with common listeners (members); and (iii) models that identify the user and platform features encouraging long-term user engagement. The findings are connected to useful insights on how to improve existing platforms, to create effective new ones, and to better understand how the Internet is currently used as a ‘crowdsourced emotional support’ tool.
The layout of this paper is as follows: Section II gives a broad overview of the 7cot platform. Section III explores the activity of different types of users on 7cot. Section IV studies the structure of interactions (conversations) between members and listeners. The factors that drive member engagement and model that predicts long-term engagement are presented in Section V. A summary of our findings and concluding remarks are given in Section VI.
II Overview of 7 Cups of Tea
7cot launched on December 5th 2013. The service is used by three types of users: members choosing to register an account in order to speak with someone, listeners who register to listen to the problems of others and are required to take an online training class, and guests who choose not to register but still wish to converse with listeners. Users may take on multiple types; for example a member that passes the required training class may become a ‘hybrid’ who is also a listener. Table I lists that, as of November 18 2014, the site is populated by 87,232 members, 33,601 listeners, and 12,038 hybrid users. The members and listeners identify themselves as either a teenager or an adult to connect with an appropriate listener. Once logged in, self help guides are available for users wanting to self-diagnose or support themselves.
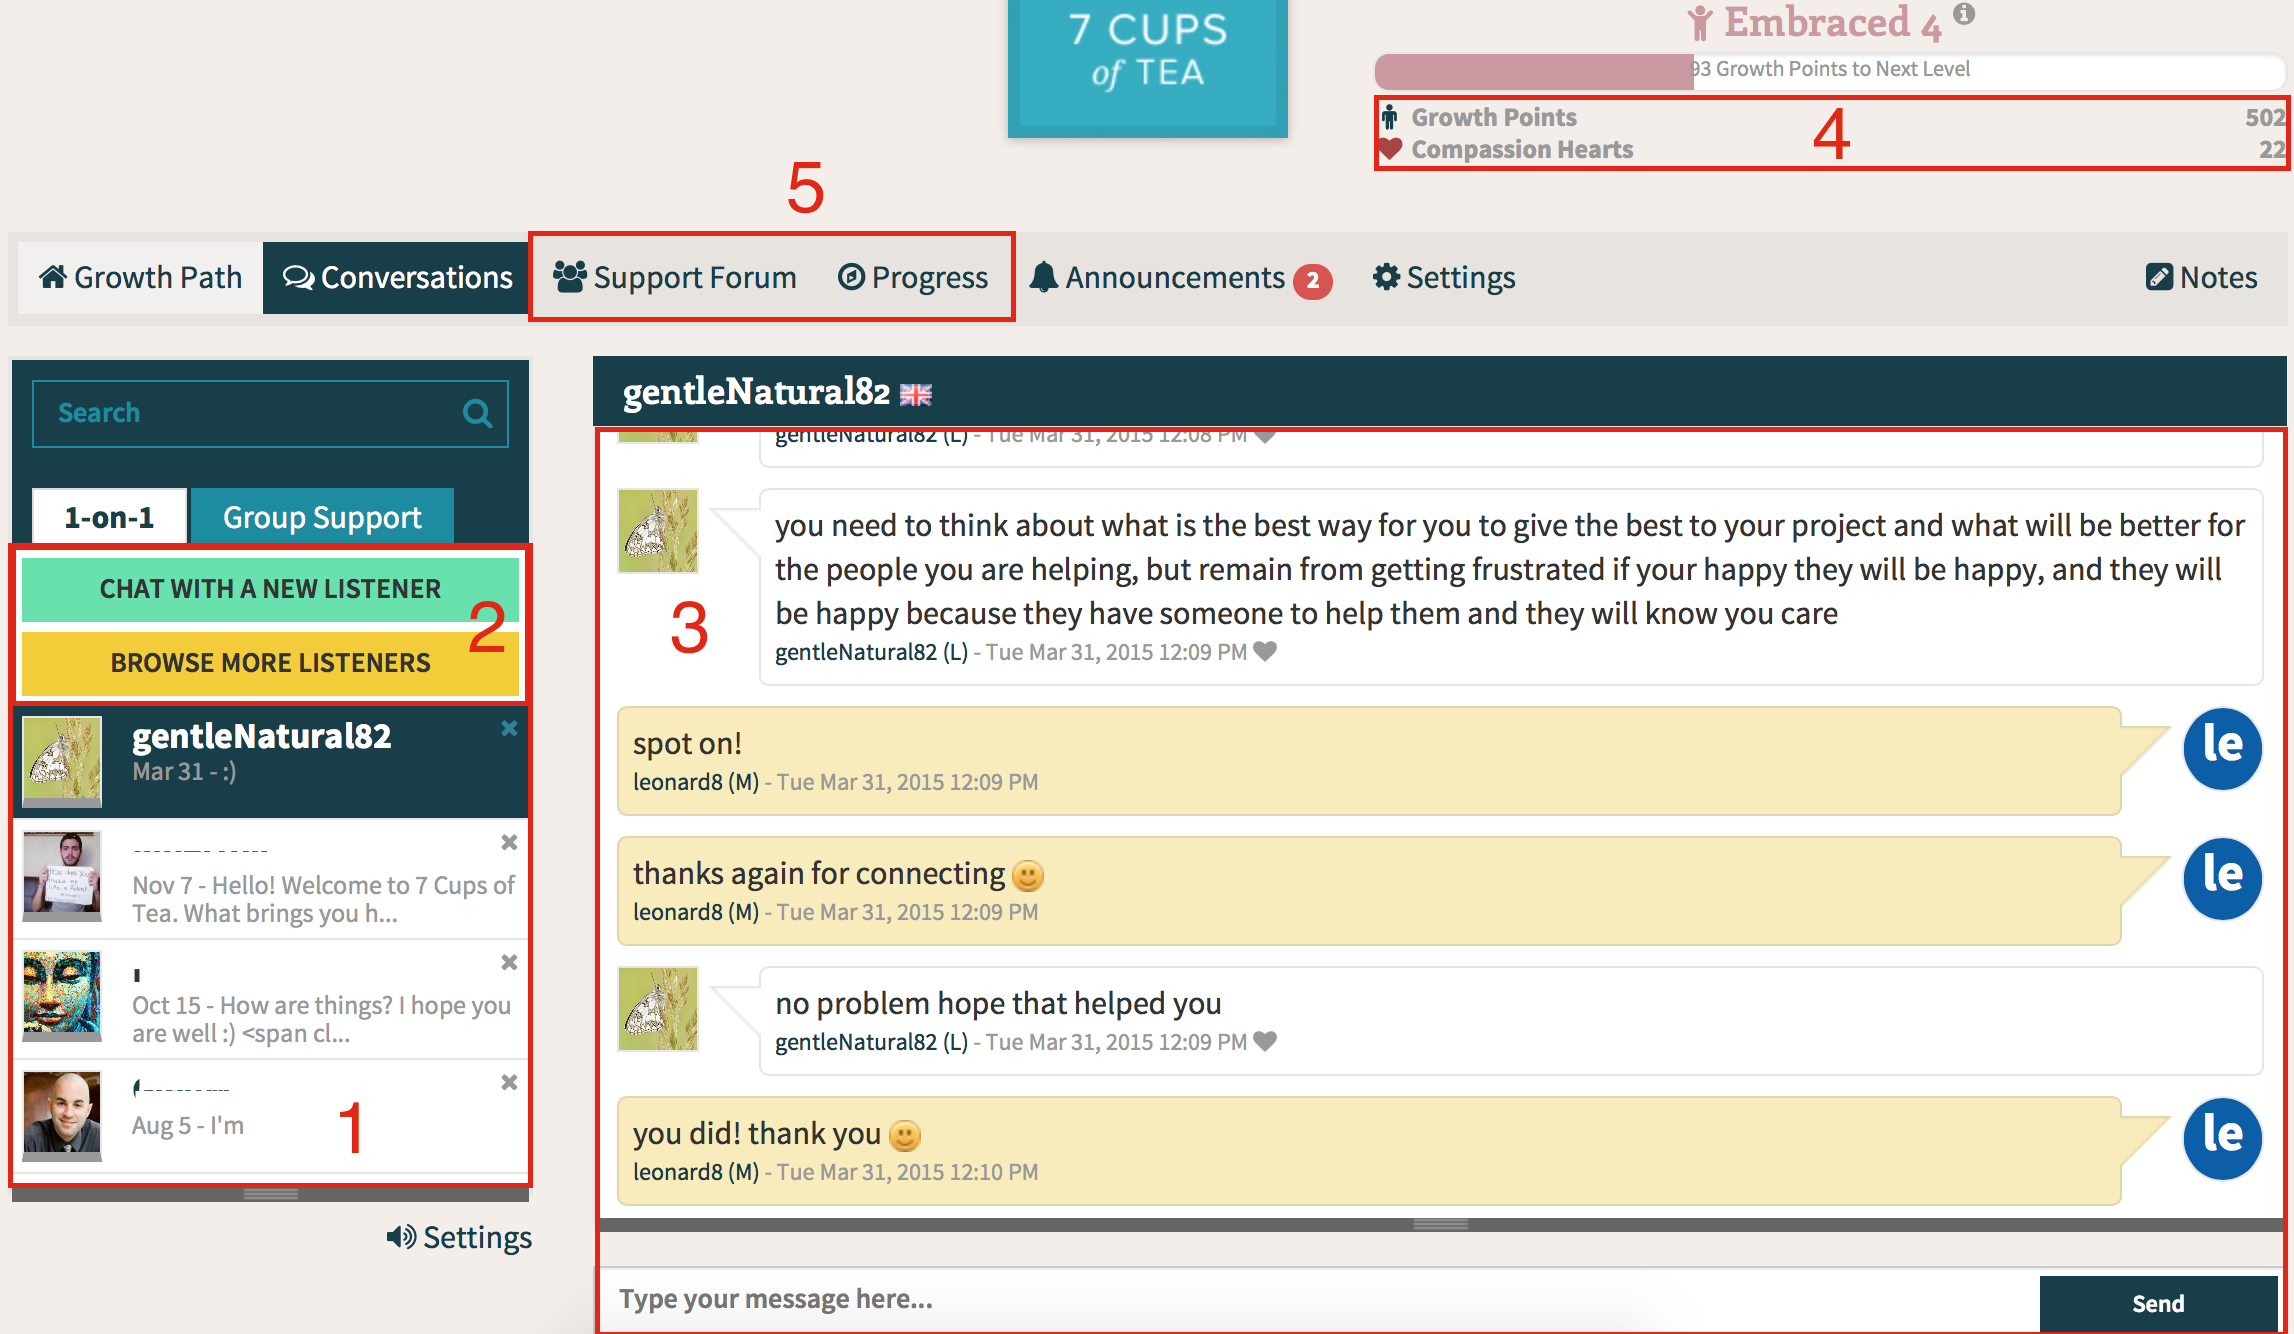
Users communicate with others in three different channels: group chats, conversations, or forums. Group chats are free exchanges that multiple guests, members, and listeners may participate in. Conversations are private exchanges of messages between members or guests and listeners. A conversation is a single, permanent connection lasting for an indefinite amount of time. Members and guests are able to start a conversation with any listener that is currently online, or may search for a listener satisfying some criteria. Members search for listeners through the interface in Figure 1. It offers a profile of the listeners matching the criteria entered in the top bar, and another option to immediately connect with any active listener should the member be in crisis. The interface members use to access various communication channels is shown in Figure 2. The left panel shows all conversations the user participates in and gives options to create new conversations, the right panel is an active conversation, the top right status bar are values related to members’ emotional progress, and the menu options lead to the forum and member profile.
“Gaming” or “progress” mechanisms are integrated into the site to represent user reputation and experience. Listeners gradually accrue ‘cheers’ over time, and after attaining certain amounts their ‘listener level’ is upgraded to a more prestigious category. Listeners also achieve ‘badges’ displayed on their profile for accomplishing tasks like helping members facing a specific type of need (e.g., loss of a loved one). Members accrue ‘growth points’ for performing simple activities such as posting on the forum, or sending messages during a conversation. Accruing enough ‘growth points’ will upgrade their ‘member level’, a rank that reflects a commitment to the site and progress toward improved mental health.
7cot shared a database capturing the attributes of all users, interactions, and activities performed since its inception on December 5th, 2013 through November 18th, 2014. The database includes metadata about every user except for those attributes related to the user’s true identity and contact information. Attributes of each conversation record were limited to participant identifiers, the date the conversation commenced, the number of messages exchanged by each party, whether the conversation was for a teenager or adult member, if the conversation was terminated by the member or listener, and the timestamp of the last message sent. User behaviors on the site were captured between May 7th and November 18th. For privacy reasons, the only actions captured are the number of messages sent, requests made, forum posts made, logins, forum views, help guide views, and page views through the mobile app or Web browser per user per day.
| Participation (a) | Actions (Avg. per user per active day) (b) | Conversations (c) | |||
|---|---|---|---|---|---|
| Period | Dec 5 - Nov 18 | Period | May 7 - Nov 18 | Period | Dec 5 - Nov 18 |
| Num. Conversations | 1.27M | Logins | 2.41 | Volume (by Users): | 413,256 (adult); 131,449 (teenager) |
| Distinct Forums | 53 | Conversation Messages | 62.28 | Volume (by Guests): | 493,365 (adult); 229,918 (teenager) |
| Chatroom Messages | 1.07M | Conversation Requests | 1.83 | Type: General | 522,863 (adult); 224,939 (teenager) |
| Forum Posts | 82,223 | Forum Posts | 2.93 | Type: Personal | 383,758 (adult); 136,428 (teenager) |
| Num. Members | 87,232 | Forum Post Views | 6.38 | Messages (by Non-Listeners) | 14.77M (adult); 4.28M (teenager) |
| Num. Listeners | 33,601 | Page Views | 15.98 | Messages (by Listeners) | 13.54M (adult); 4.12M (teenager) |
| Num. Hybrid | 12,038 | Help Guide Views | 4.12 | Terminations | 61,435 (members); 196 (listeners) |
III Platform Activity
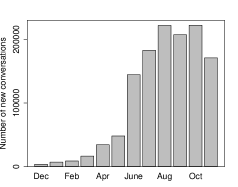
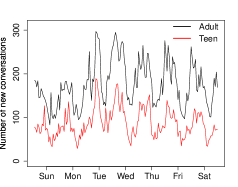
Table I is divided into three sections that summarize the participation, actions, and conversations held. The participation statistics in section (a) underscore the size and volume of activity on 7cot. In an 11 month span, over 1.27M conversations were held between 87,232 members seeking help and 33,601 listeners. In addition, 12,038 or 10.0% of all users are hybrids (both a member and a listener). The rate at which conversations are initiated rose at an exponential pace over 7cot’s first 9 months as shown in Figure 3a (note that conversations initiated in November 2014 only refer to approximately two weeks). We also explore the temporal patterns of conversations during the week of August 10, 2014 in Figure 3b. The labels on the axis are centered to 12pm. The Figure shows a diurnal pattern with larger volumes of conversations commencing in the middle weekdays. Furthermore, most conversations are initiated in the morning and overnight hours, with a lull in activity in the midday. These patterns suggest that members have a preference to share information during the evening or even overnight hours.
Section (b) of Table I summarizes the rate of actions undertaken by users per day, not counting the days when a user does not perform the action. For example, users log-in an average of 2.41 times across all days they have logged in at least once. Furthermore, members connect to an average of 1.83 listeners per day they decide to connect to a new listener, and submits an average of 62 messages. These statistics indicate that members are not hesitant to reach out with many other listeners multiple times per day. In fact, the platform’s ability to let a member communicate with many others, rather than a single professional, is a key differentiator between seeking online and offline help. For example, 7cot members may listen to the thoughts and perspectives of a large number of others, searching for resolution by considering the viewpoints of many others. Section (b) also shows that forum participation and seeking self-guided help are less popular compared to participating in one-on-one conversations.
Section (c) of Table I lists summary information about conversations, broken down by whether a participant is a teenager or an adult. Of the 1.27M conversations, more than half are initiated by guests. This reflects the demand for platforms to let people connect and speak with others immediately, without going through an extensive registration process beforehand. It also demonstrates an untapped opportunity for a platform to transform guests who had positive experiences into members or listeners who can further build its community. Section (c) also gives the breakdown of conversations that are “general” or “personal”. “General” conversations are ones where a member asks the platform to connect to any listener, whereas “personal” conversations have a member asking a specific listener to talk to. No matter the type, over 28.5% of all conversations involve teenagers, supporting the hypothesis that young generations find online platforms to be a desirable way to express their problems and find support. Users also tend to initiate conversations without regard for whom the listener is, with far more “general” than “personal” conversations. People seeking emotional support from a crowd may therefore be less interested in the kind or expertise of a listener. It could also be a reflection of 7cot’s design, which lets members connect to any listener quickly across many member interfaces. The section also shows that approximately 61,631 or 4.9% of all conversations are ‘canceled’ by a user. Canceled conversations are ones where a participant decides to permanently terminate a conversation. The relatively small percentage indicates that users sharing offensive, derogatory, or other messages that would lead to conversation termination happens infrequently. Users are therefore mostly civil and supportive to each other. Conversations are more often terminated by members, possibly if they disagree with the listeners suggestions or have found the conversation unable to solve their emotional problem.
IV Interaction Structure
We next study the patterns of member engagements with listeners on 7cot. The patterns are found through analysis of a network where members and listeners are connected if they held at least one conversation with each other. We also study networks that connect members (listeners) to each other if they had a conversation with at least one common listener (member). Structural analyses of the networks inform how members are choosing to engage with listeners on 7cot, if some subsets of listeners are more popular than others, and if a pattern of members selectively choosing listeners can be seen.
We represent all 7cot interactions as a bipartite network from members to listeners. We consider all 465,437 conversations that contained at least one message sent by either a member or listener (note that guests are excluded from this analysis and will be the subject of future work). Table II lists the structural features of this bipartite network. The network has an average degree of , i.e. members tend to connect to between five or six distinct listeners during their time on the service. This reaffirms the idea that members seek help from a number of others, perhaps to obtain different viewpoints or thoughts about their emotional problem. We also computed the number of connected components in the network. Only 477 disconnected components exist, the largest of which (GCC) includes virtually every user (99.2%) on the platform. In other words, there are virtually no members or listeners on 7cot who choose to exclusively search for and communicate only with each other. The single large GCC lets us compute the average path length in the network as , an expression valid for networks that are nearly fully connected [8], where and are the average number of others a user can reach within one and two hops respectively. The small average path length may be indicative of the existence of a large ‘core’ of members and listeners serving as hubs that connect members and listeners to others across the bipartite structure. Listeners in the ‘core’ may thus connect to large and diverse sets of members, i.e., are the listeners that connect to members who request to speak with any available listener.
| Bipartite Network | Member Proj. | Listener Proj. | |
| 117,372 | 86,877 | 30,495 | |
| 465,437 | 12,657,611 | 10,359,604 | |
| 5.39 | 291.39 | 679.43 | |
| N/A | 0.734 | 0.636 | |
| N/A | -0.10 | -0.06 | |
| 3.46 | 2.56 | 2.30 | |
| N/A | 0.003 | 0.022 | |
| Components | 447 | 447 | 447 |
| GCC Size | 116,411 (99.2%) | 86,364 (99.4%) | 30,047 (98.5%) |
We omit measuring the clustering coefficient , degree assortativity , and density of bipartite network because their definitions are closely related to measurements taken over the network’s one-mode projections [9]. One-mode projections capture the structure of interaction co-occurrences among the listeners and members of 7cot. Given a matrix where if listener has a conversation with member , we define and as the adjacency matrices of the member and listener projection networks, respectively. We then have () if members (listeners) and hold a conversation with common listeners (members). Structural patterns within the projection networks are discussed next.
IV-A Connectivity patterns
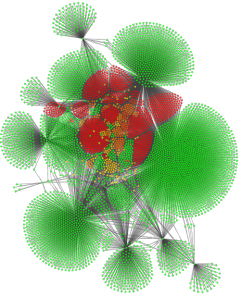
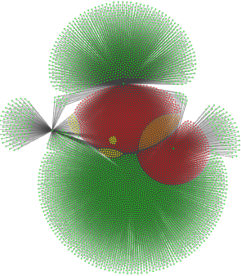
Table II gives the mean degree, global clustering coefficient, degree assortativity, average path length, density, and GCC size of the member and listener projection networks. These statistics may be compared with a visualization of a random sampling [10] of 10,000 edges of the projection networks in Figure 4. Nodes are colored hotter in the figure if they have a higher local clustering coefficient (green nodes have and red nodes have ) and are drawn under a force directed layout so that nodes separated by small distances are positioned closer together. Although sophisticated sampling algorithms are needed to create samples that maintain many structural features of the sampled network [11], edge sampling still conveys the shape of the global network within the interconnected core of the sample (nodes participating in excessive numbers of open triangles are likely an artifact of edge sampling). The high mean degree, large GCC size, and small average path lengths of both projections further support the hypothesis that members and listeners do not limit themselves to interact with a small subset of listeners (members). They both exhibit weak negative degree assortativity, suggesting a small inclination for members (listeners) who share just a few common listeners (members) with others share them with those who have large numbers of listeners (members) in common with others. However, the lower degree, larger clustering coefficient, and larger path lengths of the member network imply a weak penchant for members to form clusters by the common listeners they connect to. Such clusters can be seen in Figure 4a as cliques in the core of the member network. These clusters may be traces of member groups that connect to similar ‘types’ of listeners.
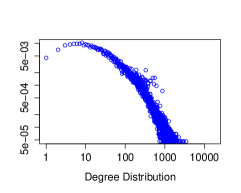
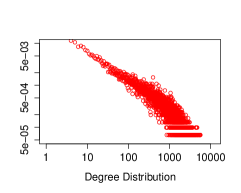
We find the degree distributions of the projection networks, presented in log-log scale in Figure 5, to take dissimilar shapes. The listener degree distribution exhibits a near straight line pattern indicative of a power-law distribution, but the pattern is less pronounced in the member degree distribution. We quantify this difference by running a maximum likelihood based test of the null hypothesis : the empirical data has a power-tailed distribution (the test also yields best fitting power-law exponent under the null) [12]. The test leaves little room to reject for the listener degree distribution (), but there is more doubt for the member degree distribution (). That the listener degree distribution has a power-tail suggests significant variation in the number of common members listeners share with each other, and that the probability of sharing orders of magnitude more members than expected is not negligible. A similar statement could be made about members, however they may exhibit less variation since we are less confident if a power-tailed trend exists. The difference of the distributions shape may be explained by members who only need to connect to a limited number of listeners in order to have many problems resolved, or by members who choose to connect deeply with a small number of listeners. Such behaviors place a ‘soft limit’ on the largest number of listeners members may connect to, weakening the support for a power-tail to emerge [13]. On the other hand, so long as a listener is available for newly added members to connect to, there may be no limit on the number of new members a listener may connect to over time.
IV-B Centrality analysis
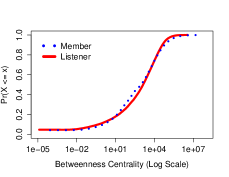
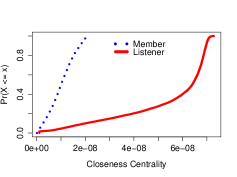
We also study connectivity-based notions of network centrality in the projection networks. We first consider the betweenness centrality of a user , defined as where is the number of shortest paths from users to and is the number of such paths that include . This measure reflects the notion that a user is ‘central’ if she is often part of the shortest path among two others in the network. Figure 6a plots the cumulative distribution (CDF) of the centrality scores across the two networks on semi-log scale. Its rapid ascent and long left tail indicate that almost all users are part of a number of shortest paths in the network. The networks are therefore structurally robust to the loss of users. We also consider the closeness centrality of a user , defined as where is the distance from user to . Figure 6b gives the CDF of closeness centrality on the two networks (note that the -axis is not in log scale). That the CDF for the listener distribution is stretched farther than the member distribution is only because there are fewer nodes in the network. Unlike betweenness centrality, the closeness centrality CDF of the two networks takes on different shapes. The CDF of the member network has only a slight curvature at its left and right tail, with a nearly linear body. This suggests that the centrality scores exhibit a small peak around the mean of the distribution but are otherwise uniformly distributed. The centrality scores of listeners are uniformly distributed up to approximately the percentile, at which point they become heavily skewed. A majority of listeners, therefore, are at a much shorter distance from those below this percentile. This pattern may be indicative of a core-periphery structure [14] in the listener projection network that does not exist in the member one, where those in the core (periphery) have high (low) closeness centrality. The probability of a listener falling in the core may be correlated with the diversity of the members she connects to: connecting to many different members increases the probability of sharing a connection with a listener already in the core.
IV-C Network transitivity
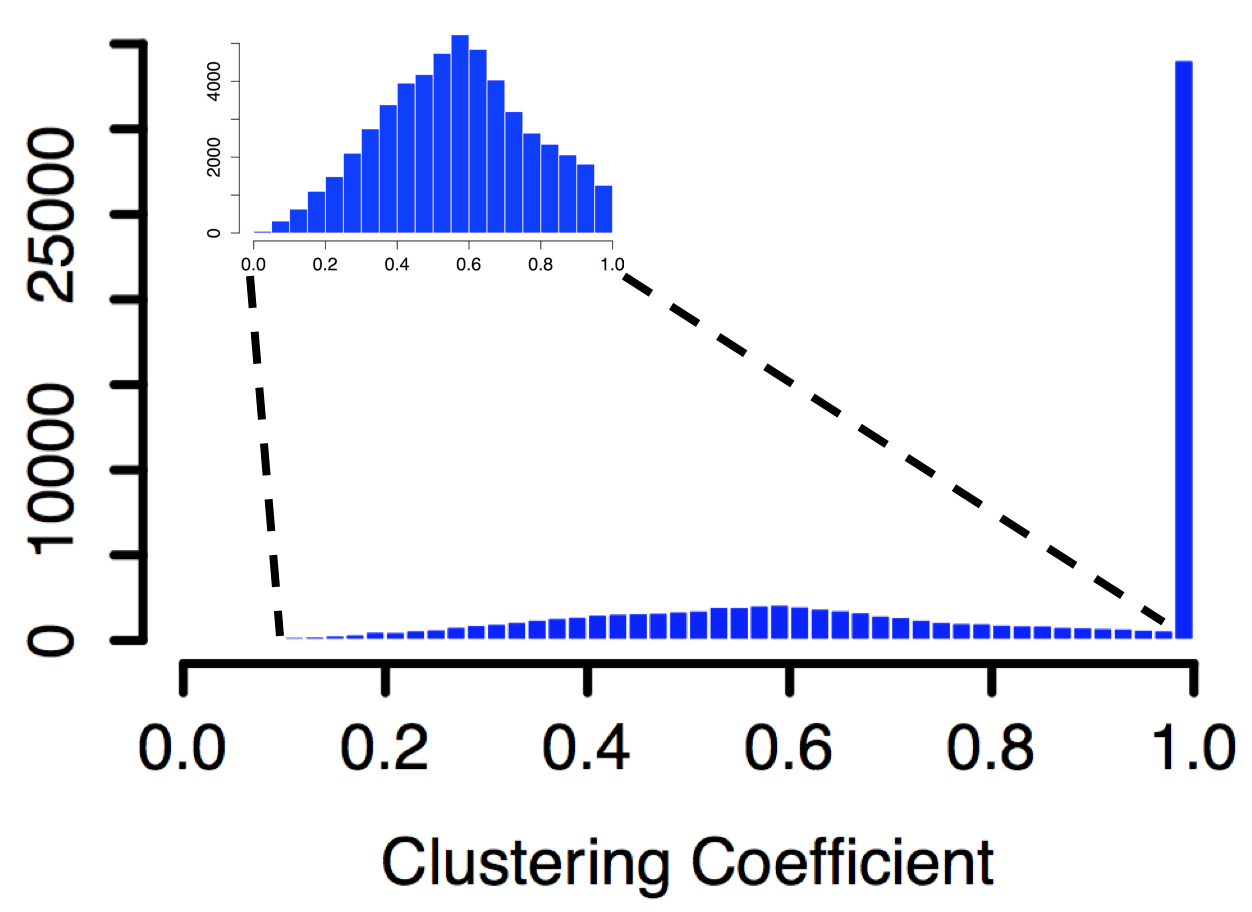
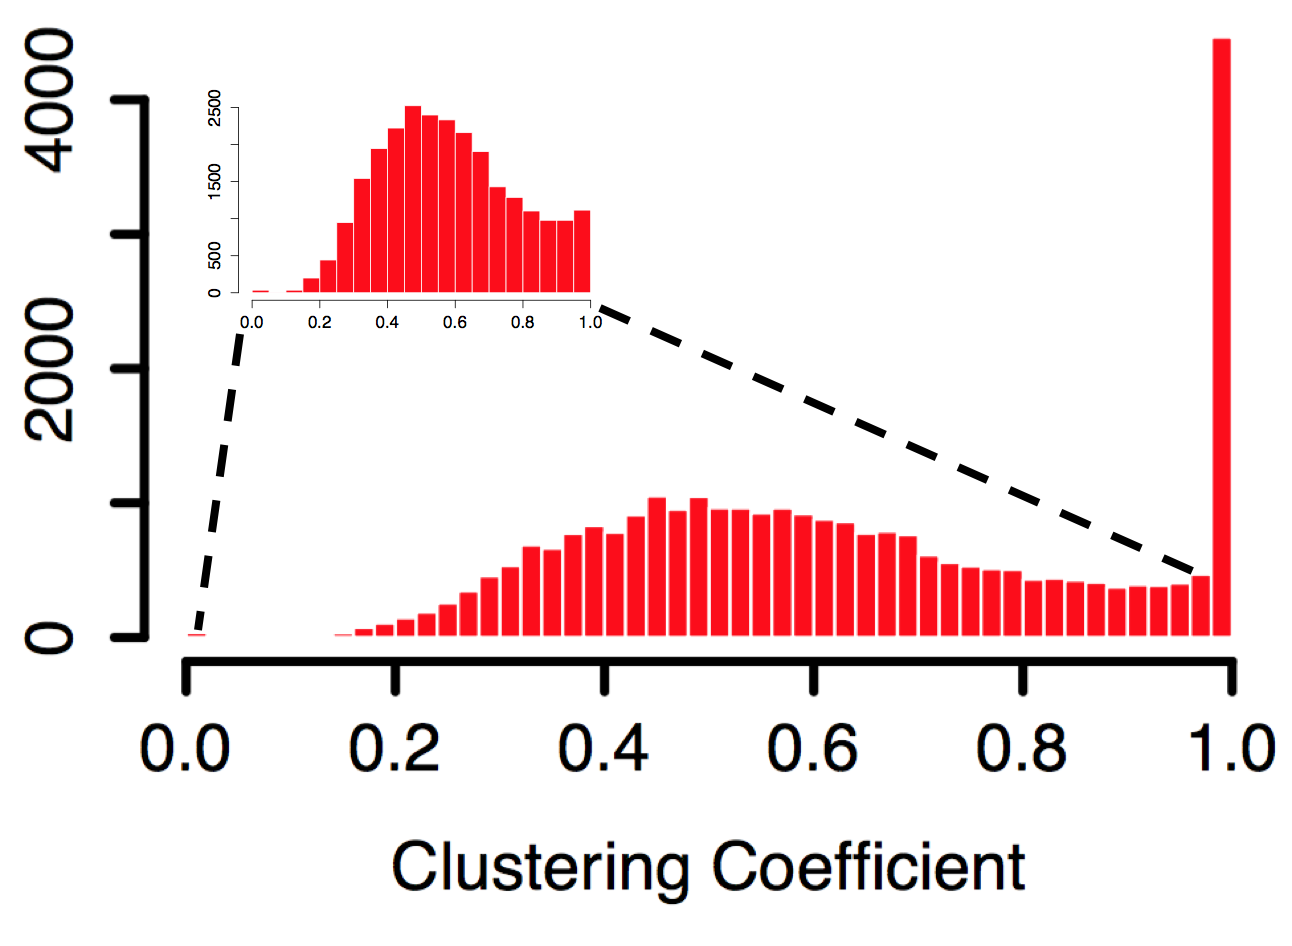
Finally, we use the local clustering coefficient distributions of the projection networks to study the tendency of transitive relationships among members and listeners. A transitive relationship is one where if user is a member (listener) connected to user and is connected to , then is connected to . Table II lists the global clustering coefficient, defined as the average of the number of closed triangles in a user’s neighborhood divided by the number of possible links that could exist within it [15], as and for the member and listener projections respectively. The large coefficients signify that transitive relationships dominate the projection networks. However, histograms of the local clustering coefficients in the member and listener network in Figure 7 show that the large values are driven by the 38.9% of members and 13.2% of listeners whose . The high values of are therefore driven by a small proportion of users with fully connected neighbors. When we consider users whose , closeness centralities appear to be normally distributed. Normally distributed distributions is a typical phenomenon in co-occurrence networks spanning many systems, including scientific paper authorship [16, 17], e-commerce co-purchases [18], and “related page” relationships on search engines [19], but the surge of members where is unique to 7cot interactions. This suggests that users with may not emerge from some natural or universal process innate to all co-occurrence networks. This is evidence that both members and listeners perform deliberate actions that drive them into fully connected neighborhoods in the projection networks. For example, members may be selectively connecting to the same pool of listeners that may have similar ratings, experiences, or bio’s suggesting an expertise that members in their neighborhood do. Finally, it is interesting to note that the proportion of members where (38.9%) is very similar to the proportion of personal conversations (where a member chooses a listener to connect to) in Table I (39.8%).
V Understanding User Engagement
Next, we perform an engagement analysis of members on 7cot. Engagement analysis offers insights about the user and platform features that encourage members to return, listeners to stay active, and encourage members to have multiple, fruitful conversations. Such insights are practically important to help a platform retain new members and grow its community of listeners. They also identify qualities that encourage people to seek follow-up emotional support. Due to space limitations, we will consider listener engagement in future work.
| Coins | 0.247 | Growth Points | 0.977 |
|---|---|---|---|
| Compassion Hearts | 0.243 | Signup Date | -0.009 |
| Last Login Date | 0.133 | Distress Level | 0.004 |
| Group Chat Msgs | 0.120 | Page Views (Web) | -0.002 |
| Page View (iOS) | -0.001 | Login Count | -0.001 |
| Conv. Requests | 0.001 | Self Help Views | 0.005 |
| Forum Posts | -0.001 | Forum Views | -0.001 |
| Forum Up-votes | 0.201 |
V-A Factors driving engagement
We first relate the features and behaviors of members and their relationship to a measure of site engagement. Since sharing with listeners is the purpose of the service, we quantify engagement as the message rate of a member, that is, the average number of messages sent per day in conversations. We consider features and behaviors that, based on discussions with psychologists and designers at 7cot, may be related to engagement: (i) number of coins, growth points, and compassion hearts, which are gaming and progress measures related to a members reputation and experience; (ii) signup and last login date; (iii) reported distress level when members register; (iv) number of group chat messages; (v) number of page views from the 7cot Web and iOS applications; (vi) number of logins; (vii) number of conversation requests sent; (viii) number of self help page views; (ix) number of forum posts, views, and up-votes. Table III gives the Pearson correlation coefficient between the features and a members’ message rates. The coefficients make clear that the gamification features of the platform (accumulated coins, hearts, and growth points) are strongly related to the engagement of a member. However, conversation messages sent by members directly increase growth points, giving this correlation little meaning. Member attributes and behaviors unrelated to communication (signup and last login date, distress level, page views, and help article views) exhibit virtually no correlation, suggesting that users dealing with any type and degree of emotional distress, at any time, exhibit similar levels of engagement on the site.
Many features exhibit little correlation with user engagement, but interaction terms built by subsets of them may be positively correlated. For example, users who exhibit a high distress level and submit many conversation requests may have a high level of engagement even though the features are individually not correlated. Instead of exhaustively exploring all multi-way interactions, we consider a random forest model that predicts user engagement by a regression over all features. A random forest is an ensemble of decision trees, each of which is trained over different bootstraps of the data. During training, each tree is limited to the use of distinct small subsets of the features to make splitting decisions. If is a vector of member ’s features, the random forest predicts the engagement of as where is the predicted engagement value from the of decision trees in the random forest. The bootstraps, limited choice of features for tree splitting, and averaging of results across the tree ensemble ensure the forest does not overfit the data even for large [20]. We compute the importance of each feature to the random forest regression model as follows: let be the mean square error (MSE) of the random forest predictions against the actual engagement of every member . The importance of feature may be found by randomly perturbing the values of across every member’s feature vector. Letting be the feature vector of member whose element is perturbed and as the MSE of the model using the perturbed vectors, the importance of may ranked by the percent increase in MSE between and . For example, if feature is not important, the errors of the model will be less sensitive to a reshuffling of its values across all users.
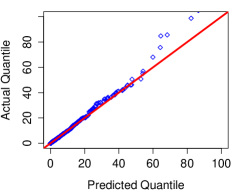
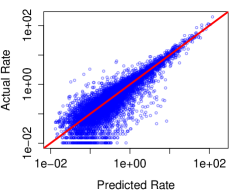
We trained a random forest using 75% of the user data for a forest with trees and randomly choose 1/3 of the features for every tree splitting decision. Figure 8 gives the quantile and prediction scatter plots of the predicted and actual message rates for the 25% of users not used to train the random forest. The figure demonstrates that the decision tree models engagement very well (), as the quantile plot shows a linear relationship between the distribution of the predicted and actual engagement rates up to the quantile. The predicted vs. actual engagement rates in Figure 8b only show normally distributed errors for users with low engagement.
Since the random forest reasonably models the relationship between member and behavioral features, we use it for feature importance analysis. Figure 9 shows the percent increase in MSE of a random forest trained with data where each factor was individually perturbed across the training data. As anticipated by Table III, the total number of growth points of a member is the most important factor for predicting user engagement due to its direct correspondence with her message rate. Members’ signup and last login dates are the next most important features, each of which increases MSE by over 20% when they are perturbed. The signup date of a user is weakly anticorrelated with engagement according to Table III, thus recent logins have a weak relationship to engagement. The number of messages sent in group chat is the next non-gaming related feature that is important for user engagement. This suggests that participating in group chats encourages users to become more engaged in their one-on-one conversations. It may be the case that users find group settings to be easier or less intimidating to participate in, and builds their confidence to have lengthy sessions with a listener. Finally, we note that the number of up-votes a member has on the forum actually introduces noise in the model, since perturbing this factor decreases the MSE of the random forest. One explanation may be that members who gain recognition for their forum posts may be disinclined to participate in conversations since they achieve recognition and perhaps satisfaction by only participating on the forum.

V-B New user engagement prediction
New members to a service may be active for a brief period of time, then become ‘inactive’ and never return. Early identification of new users likely to become inactive helps a platform identify those who could be encouraged or incentivized to continue seeking help, or become listeners to bolster its community. Feature importance analysis of such an identifier may also reveal the behaviors and attributes that promote people to return and seek follow-up support.
We consider a random forest classifier that identifies if a member, based on actions during her first two weeks on 7cot, will become an active user. Since there is lack of a standard definition for an ‘active’ user of a Web service, we consulted with 7cot administrators to define an active user as one who: (i) has been registered for at least six weeks; and (ii) has performed at least two actions on the service over the past month. We also define a ‘new user’ as one who has registered within the last two weeks. We identified all members who registered between May 7th (the first date user action data was recorded) and November 18th, 2014 (the end of our data set) and mark them as ‘active’ or ‘inactive’. We then collected the following actions they performed during their first two weeks on the site: (i) number of conversation requests and messages sent; (ii) number of forum posts made and viewed; (iii) number of logins performed; (iv) number of help page views; and (v) number of site pages accessed via 7cot’s Website and iOS app.
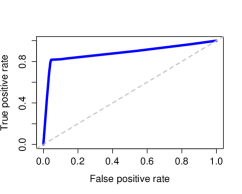

52,803 members registered on 7cot during the time period considered, of which 11,117 (21%) became active and 41,686 (79%) became inactive. We created a training set by randomly sampling 66% of the registered members for a random forest classifier to predict if they are active. Trees are trained in a similar fashion to regression. Each tree yields its own prediction of if a member will be active or inactive given her actions during the first two weeks. A majority vote of the trees then decides the class to be predicted. Due to the imbalance in the number of inactive and active members in the training data, the minority class is randomly oversampled so that equal number of inactive and active cases are provided for training [20]. The trained random forest was tested over the 33% of users not considered in the training set. The classifier achieves a very promising accuracy of 92.5% and the ROC curve in Figure 10a demonstrates only a moderate false positive rate (ROC curves approaching the (0,1) corner of the plot are perfect classifiers; the line represents a classifier that performs random guessing).
As before, we assess the importance of the factors used for predicting active users. Since the concept of MSE is incompatible with the notion of a binary classification decision, we instead consider the Gini index [20] of decision tree nodes in the forest. The Gini index of a decision tree node is defined by where is the proportion of members marked active (inactive) that fall into node based on the splitting criteria of its parent node. A close to zero suggests that the splitting rule at the parent divides the data into separate classes, which is a property of strong decision tree classifiers. We thus rank the importance of a factor by the average decrease of the Gini coefficient across all splits in all trees of the forest in Figure 10b. It reveals that the number of messages sent in conversations and conversation requests submitted within the first two weeks are the actions that best predict whether a user will become active. We further examine the interaction between these two features by showing the percentage of new users who became active and submitted messages in their first two weeks in Figure 11. Each trend corresponds to subsets of members who also submitted less than the specified number of conversation requests. The figure shows how for small numbers of conversation requests, the total number of messages sent in one-on-one conversations strongly influences members to become active. But once approximately five conversations are created, the number of messages sent in a conversation loses its importance. This may be because new users who connect with greater numbers of listeners feel more obligated to return to these connections again in the future. On the other hand, when a user connects to only a few listeners, a stronger bond between them (i.e., more messages shared) is necessary to drive the member to return to the site.
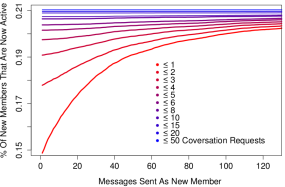
Figure 10b also shows that the number of account logins performed, the user’s distress level, and activity related to the online forums within a member’s first two weeks are not major predictors of her becoming active. The frequency with which a member accesses the platform is thus unrelated to whether she will become an active member; what matters is not the number of times a member visits, but the quality or productivity of those visits as measured by the number of messages sent and conversations requested. Furthermore, since members are equally likely to become active no matter their distress level, people suffering from both basic and complex problems may be equally willing to become active in online emotional support platforms. Finally, public spaces to post messages, such as forums, do not encourage new members to become active ones. This may be because forums serve as a less personal, more public medium of communication.
VI Conclusions and Future Work
As society becomes more reliant on Internet-based communication, online platforms that offer emotional support will only grow in importance. This paper presented a detailed analysis of user interactions on 7cot, which is the largest such platform available today. The analysis made important insights relevant to the understanding of an emotional support platform that could inform the design of future ones. It shows how users are respectful to each other and tend to use the platform during midweek evenings, and that the ability for users to access large numbers of listeners is important and useful. Structural analysis revealed a small tendency for members to connect with sets of listeners who have latent common attributes, and that the mechanisms letting members connect to any available listener may lead to a core-periphery structure of listener relationships. Engagement analysis emphasizes the importance of mechanisms to track user progress. In addition, less intimidating group chats may serve as a gateway to engaging listener conversations, and users facing both simple and complex problems are as likely to become active participants.
Future work will characterize guest attributes and behaviors in more detail, and explore how users transition from being guests, to members or listeners, and to hybrid users. The structural analysis will be extended to study the nature of the cliques emerging in the projection networks. This direction could reveal popular types of listeners that members search for, and whether or not the ailments of members can be inferred based on clique memberships. We will also perform a thorough engagement analysis on listeners, to understand the mechanisms and platform designs that keep them active. Improving the false positive rate of the active user classifier, alternate quantifications of ‘engagement’, and alternative classifier types will also be explored to enhance the engagement analysis.
References
- [1] Y. M. Binik, J. Cantor, E. Ochs, and M. Meana, “From the couch to the keyboard: Psychotherapy in cyberspace,” Culture of the Internet, pp. 71–100, 1997.
- [2] M. P. Huang and N. E. Alessi, “The internet and the future of psychiatry,” American Journal of Psychiatry, vol. 153, no. 7, pp. 861–869, 1996.
- [3] E. Zuckerman, “Finding, evaluating, and incorporating internet self-help resources into psychotherapy practice,” Journal of Clinical psychology, vol. 59, no. 2, pp. 217–225, 2003.
- [4] S. Bar-Lev, ““We are here to give you emotional support”: Performing emotions in an online HIV/AIDS support group,” Qualitative health research, 2008.
- [5] A. B. Rochlen, J. S. Zack, and C. Speyer, “Online therapy: Review of relevant definitions, debates, and current empirical support,” Journal of clinical psychology, vol. 60, no. 3, pp. 269–283, 2004.
- [6] A. Hemmati and K. S. K. Chung, “Associations between personal social network properties and mental health in cancer care,” in IEEE/ACM International Conference on Advances in Social Networks Analysis and Mining. IEEE, 2014, pp. 828–835.
- [7] A. Barak, “Emotional support and suicide prevention through the internet: A field project report,” Computers in Human Behavior, vol. 23, no. 2, pp. 971–984, 2007.
- [8] M. Newman, Networks: an introduction. Oxford University Press, 2010.
- [9] J.-L. Guillaume and M. Latapy, “Bipartite graphs as models of complex networks,” Physica A: Statistical Mechanics and its Applications, vol. 371, no. 2, pp. 795–813, 2006.
- [10] N. K. Ahmed, J. Neville, and R. Kompella, “Network sampling: from static to streaming graphs,” arXiv preprint arXiv:1211.3412, 2012.
- [11] D. Doran, “Triad-based Role Discovery for Large Social Systems,” in Proc. of Intl. Conference on Social Informatics Workshops, LNCS 8852, 2014, pp. 130–143.
- [12] A. Clauset, C. R. Shalizi, and M. Newman, “Power-Law Distributions in Empirical Data,” arXiv:0706.1062v2, Tech. Rep., 2009.
- [13] L. Lipsky, Queueing Theory: A Linear Algebraic Approach, 2nd ed. Springer-Verlag, 2009.
- [14] M. P. Rombach, M. A. Porter, J. H. Fowler, and P. J. Mucha, “Core-periphery structure in networks,” SIAM Journal on Applied Mathematics, vol. 74, no. 1, pp. 167–190, 2014.
- [15] D. J. Watts and S. H. Strogatz, “Collective dynamics of small-world networks,” Nature, vol. 393, no. 6684, pp. 440–442, 1998.
- [16] J. Yang and J. Leskovec, “Defining and evaluating network communities based on ground-truth,” Knowledge and Information Systems, vol. 42, no. 1, pp. 181–213, 2015.
- [17] J. Leskovec, J. Kleinberg, and C. Faloutsos, “Graph evolution: Densification and shrinking diameters,” ACM Transactions on Knowledge Discovery from Data, vol. 1, no. 1, 2007.
- [18] J. Leskovec, L. A. Adamic, and B. A. Huberman, “The dynamics of viral marketing,” ACM Transactions on the Web, vol. 1, no. 1, 2007.
- [19] X. Niu, X. Sun, H. Wang, S. Rong, G. Qi, and Y. Yu, “Zhishi. me-weaving chinese linking open data,” in Intl. Semantic Web Conference. Springer, 2011, pp. 205–220.
- [20] T. Hastie, R. Tibshirani, and J. Friedman, The elements of statistical learning. Springer, 2009.